Class-A penicillin binding proteins do not contribute to cell shape but repair cell-wall defects
- Institut Pasteur, France
- Université Paris Descartes, Sorbonne-Paris-Cité, France
- Umeå University, Sweden
- Université Paris Diderot, Sorbonne-Paris-Cité, France
- Proteomics Platform, Institut Pasteur, France
Figures
Figure 1 with 6 supplements

aPBPs have no role in maintaining rod-like cell shape.
(A) Sketch of the strain AV44 (LC69 mrcB::gfp-mrcB, mrcA::rfp-mrcA) with tunable levels of RFP-PBP1a and GFP-PBP1b. CRISPR guides are expressed either as crRNA (top) or as sgRNA (bottom), see also Figure 1—figure supplement 1. (B) Doubling time of AV51 (AV44 ΔPBP1a)/pAV20 as a function of PBP1b level, in minimal medium with glucose and casamino-acids at 30°C. sgRNA are expressed from pAV20 as annotated. AV58 is AV51 Para-GFP-PBP1b for over-expression. Skull logo: not viable. (C) Effect of aPBP concentration on cell diameter. Points indicate the median diameter within each population. Green: AV51/pCRRNAcos with crRNA G20, G14, G10 and GØ, or AV58 (over-expression). Red: AV50 (AV44 ΔPBP1b)/pCRRNAcos with crRNA R20, R18, R11 and RØ. AV63 is AV50 HK022::Para-RFP-PBP1a for over-expression. Levels were determined based on fluorescence and normalized with respect to WT according to DIA. (D) Effect of the concentration of Rod-complex proteins on cell diameter. Green: AV88 (LC69 MreB-GFP)/pAV20 with sgRNA G14, G10 or GØ. Red: AV08 (LC69 RFP-PBP2)/pAV20 with crRNA R20, R18, R11 or RØ. (E) Growth curve of AV44/pAV20 with PBP1ab repressed to lethal level (sgRNA G20-R20), and cell morphology during lysis. Individual points are biological replicates. OD: optical density. WT: wild-type.
-
Figure 1—source data 1
Data used to generate Figure 1 and its supplements.
- https://cdn.elifesciences.org/articles/51998/elife-51998-fig1-data1-v2.xlsx
Figure 1—figure supplement 1
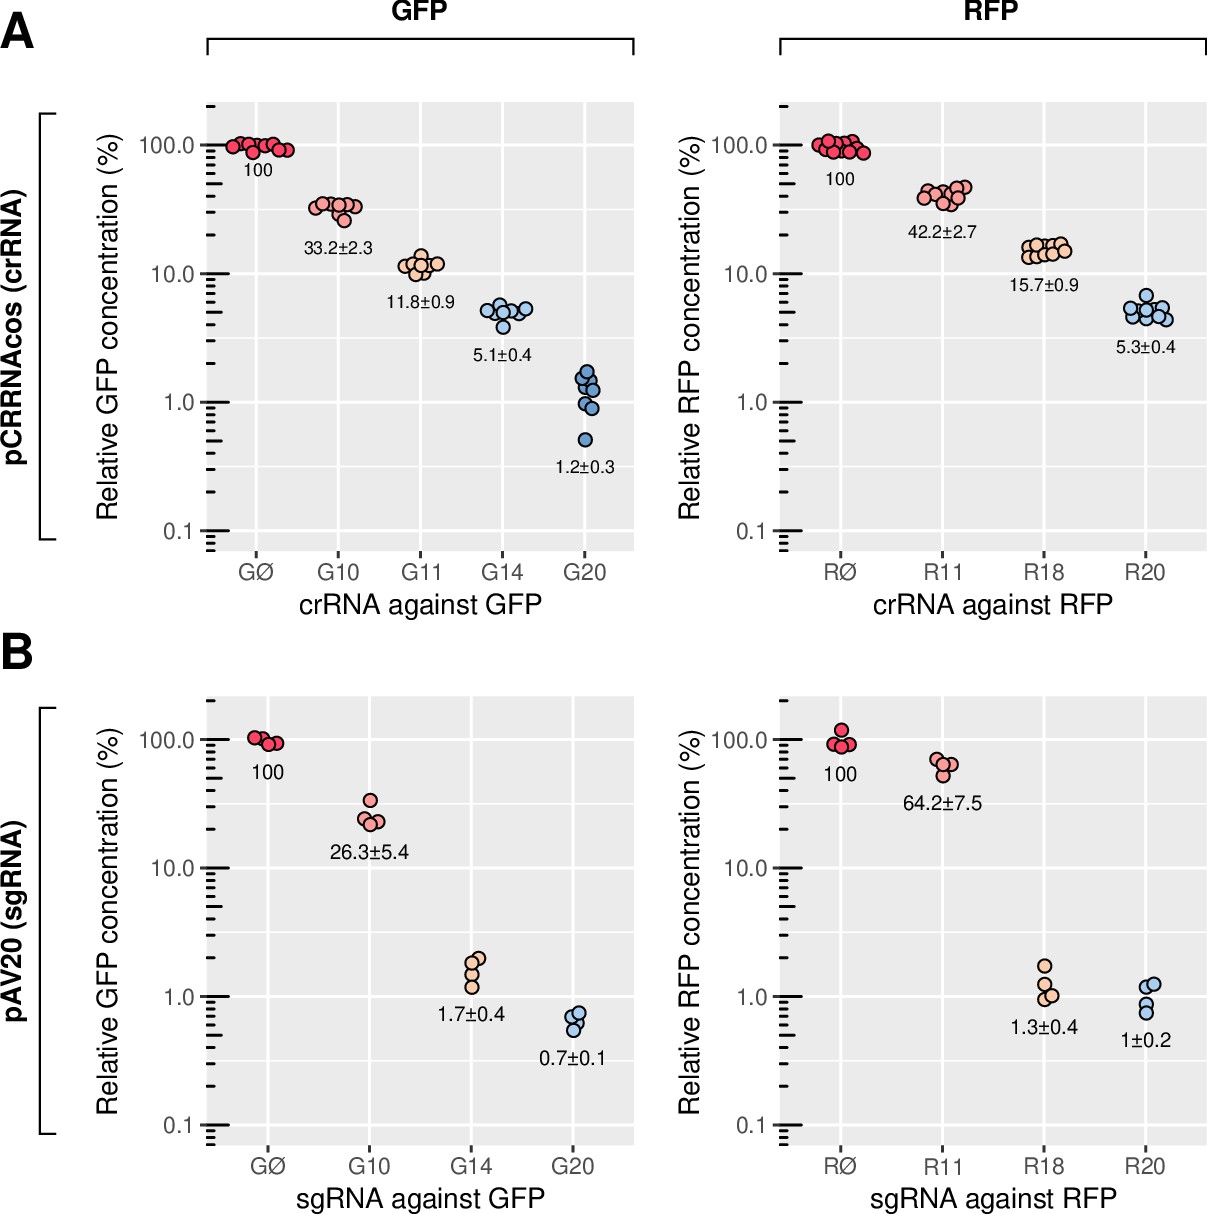
Passage probability of the different CRISPR guides used in this study.
This is measured by fluorescence microscopy in strain AV47 (LC69 HK022::P127-msfgfp, λ::P127-mcherry)/pCRRNAcos for crRNA or pAV20 for sgRNA. When used to repress the RFP-PBP1a and GFP-PBP1b fusions in AV44, the repression level may be different because of genetic feedback. (A) Repression of GFP and RFP by crRNAs expressed from the pCRRNAcos vector. (B) Repression of GFP and RFP by sgRNAs expressed from the pAV20 vector. See Table 1 for the sequences of the guides. Relative fluorescence is expressed as a percentage of AV47/pAV20 GØ-RØ, that is without repression. Data is from Vigouroux et al. (2018).
Figure 1—figure supplement 2

The RFP-PBP1a and GFP-PBP1b fusions are the only forms of aPBPs present in AV44.
(A) Fluorescent bocillin binds specifically to Penicillin Binding Proteins (PBP). The change in band intensity after repression by CRISPR does not reflect the change in fluorescence measured by microscopy for the same conditions, presumably because bocillin only labels potentially active molecules. All experiments are done in AV44/pCRRNAcos with crRNA as annotated. (B-C) Diameter of single cells at different levels of GFP-PBP1b (B) or RFP-PBP1a fusion (C), in strains AV100 (AV51 HK022::Para-GFP-PBP1b) and AV101 (AV50 HK022::Para-RFP-PBP1a), respectively. Different colors indicate different concentrations of arabinose, from 0% to 1%.
Figure 1—figure supplement 3

Quantification of GFP-PBP1b by semi-quantitative SDS-PAGE.
(A) Purified msfGFP-6xHis. Left: Elution fraction loaded in a 4–20% acrylamide gel stained with Coomassie blue. The predicted msfGFP-6xHis molecular weight is ≈28.42 kDa. Right: visualization of the in-gel fluorescent signal. (B) Representative 4–20% acrylamide gel with decreasing amounts of purified msfGFP-6xHis (first three lanes), followed with whole cell extracts of LC69, AV44 or AV51 with pAV20 as annotated. Approximately 30 μg of proteins were loaded. msfGFP-PBP1b isoforms: isoform α (predicted molecular weight 94.32 kDa, 121.1 kDa tagged with msfGFP), isoform μ (predicted molecular weight 88.91 kDa, 115.69 kDa tagged with msfGFP). Top: GFP fluorescence measurement. Bottom: Coomassie blue staining. There is no signal of the purified msfGFP-6xHis fusion protein because the amount loaded is probably below sensitivity limit for Coomassie blue staining.
Figure 1—figure supplement 4
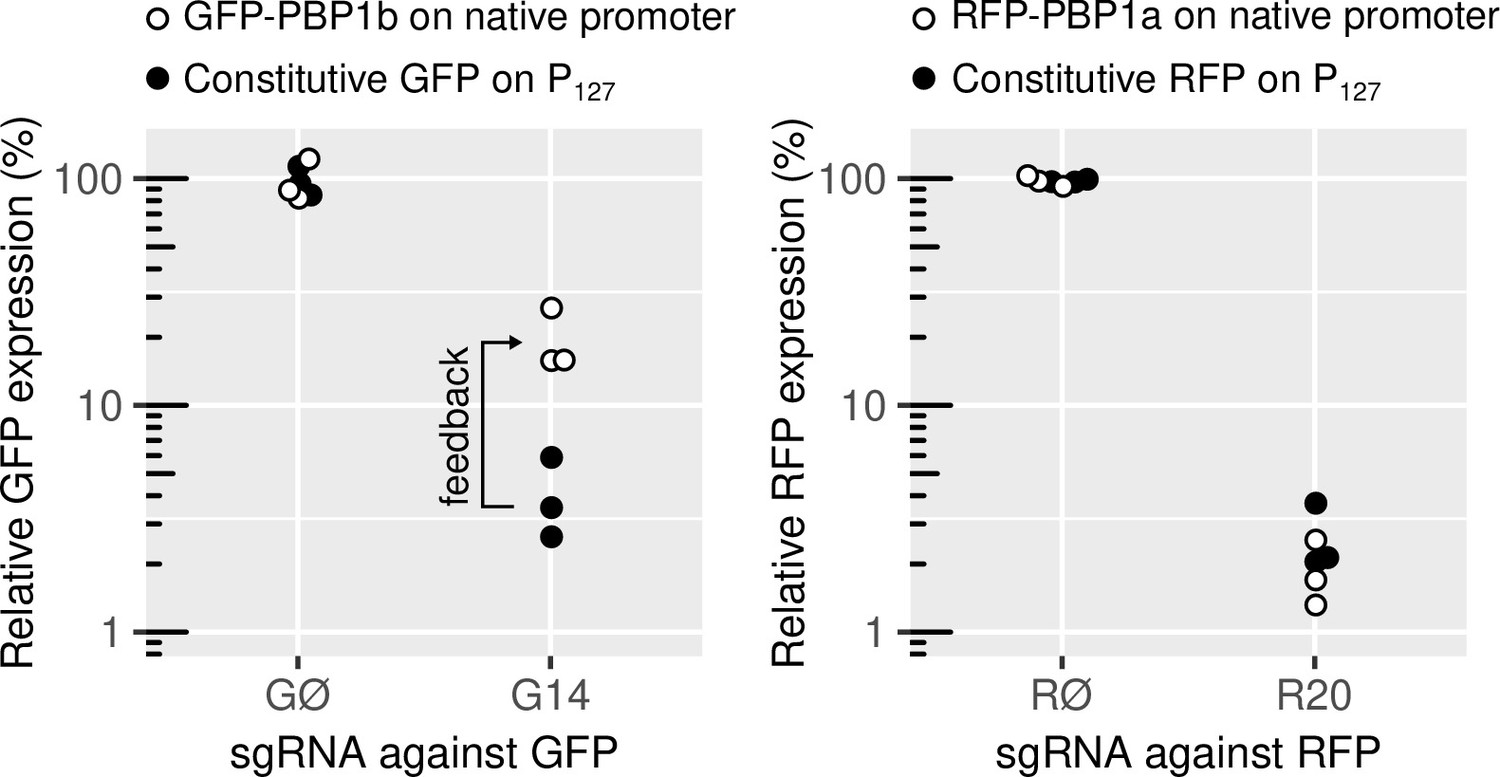
Residual PBP1a and PBP1b levels in response to CRISPR-based repression, measured by fluorescence microscopy.
Left: The same CRISPR guides produce different repression strength on GFP, depending on whether it is expressed constitutively in AV47 (186::Ptet-dCas9, HK022::P127-msfgfp, λ::P127-mcherry) or fused to PBP1b in the native locus (AV44). Right: Same experiment on the RFP-PBP1a fusion, on AV44, showing no evidence for feedback. sgRNAs are expressed from pAV20 with sgRNA GØ, RØ, G14 or R20 as annotated. In each case, relative fluorescence is expressed as a percentage of the fluorescence of the same strain carrying the pAV20 GØ-RØ control plasmid, that is without repression.
Figure 1—figure supplement 5
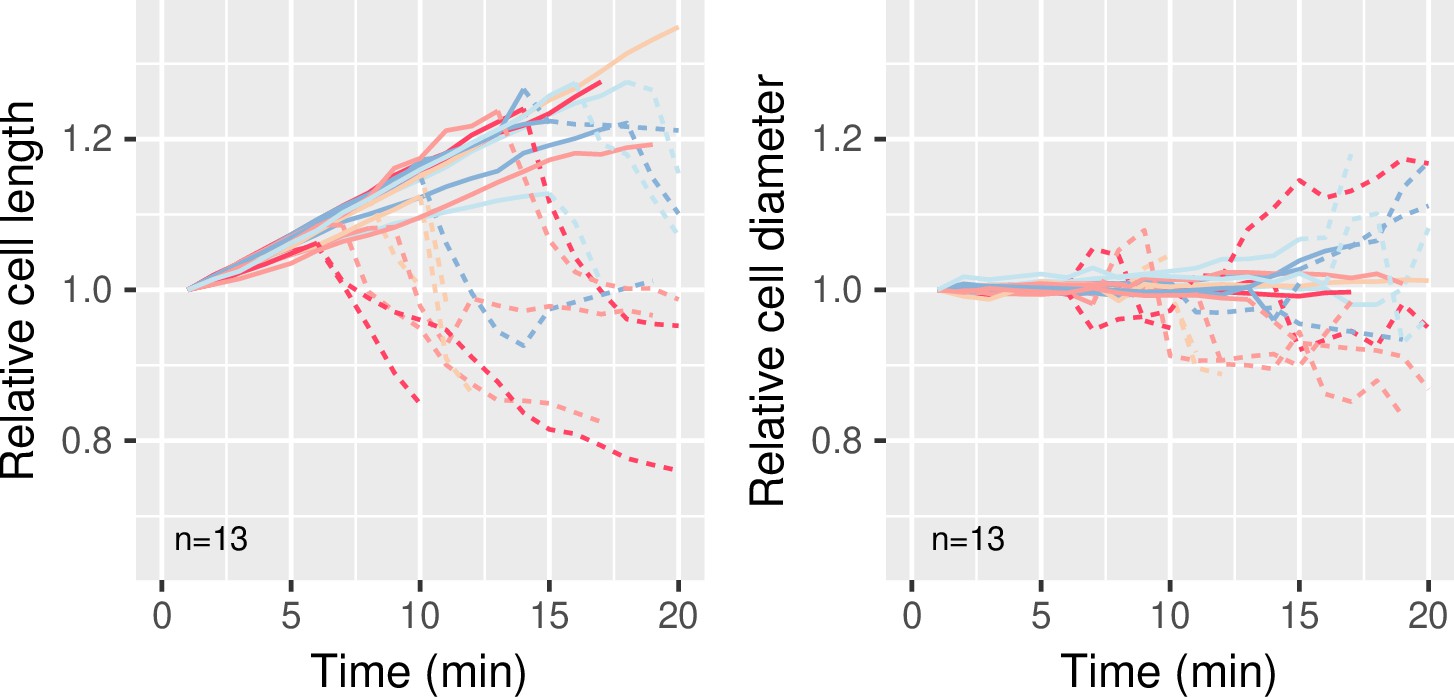
Dimensions of individual cells before lysis due to PBP1ab repression, in LB Strain: AV44/pAV20 G20-R20.
Imaging starts 4h45 after the induction of the CRISPR system. Cell length and cell diameter are normalized with respect to the dimensions of the cell in the first frame of the movie. Solid lines are living cells, dashed lines are lysed cells (phase-bright). Colors are arbitrary.
Figure 1—video 1
Video of a cell of AV44/pAV20 with sgRNA G20-R20, bulging then lysing.
Timestamps start at the beginning of the movie, 5 hr after CRISPR induction. Corresponds to Figure 1E.
Figure 2 with 4 supplements
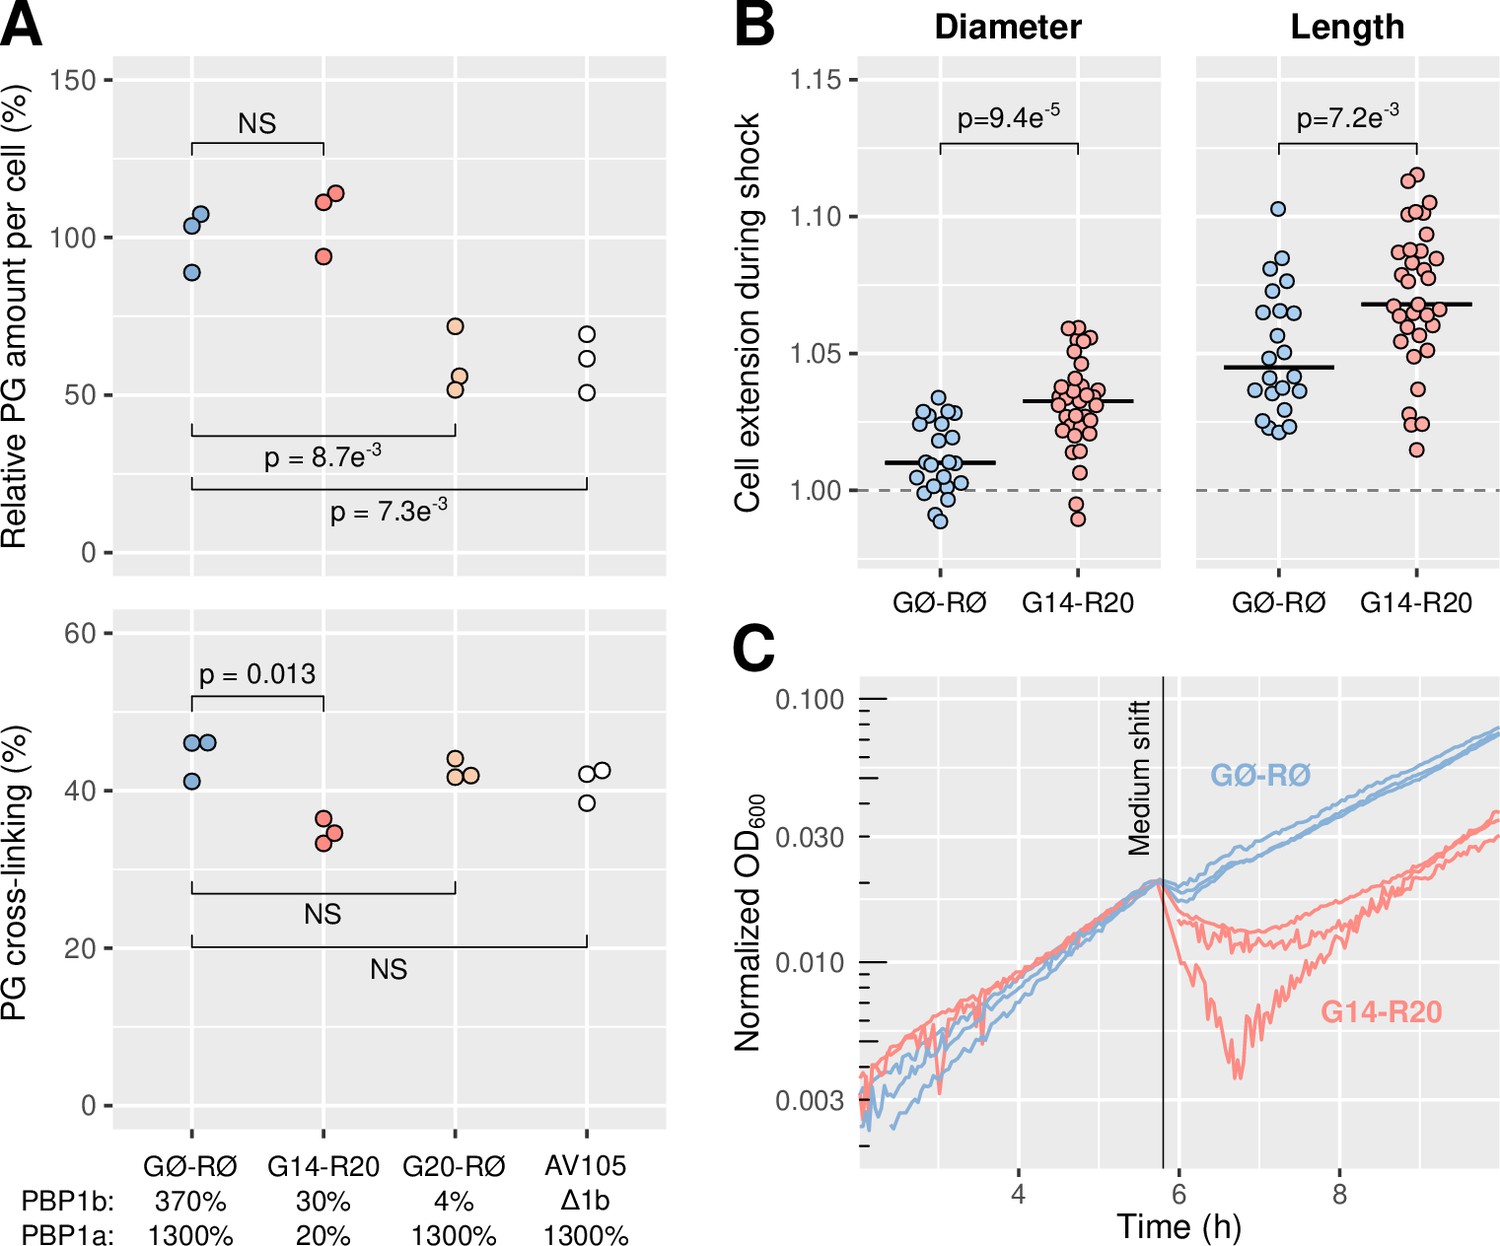
Repression of PBP1ab reduces mechanical stiffness while maintaining a high rate of peptidoglycan insertion.
(A) Top: Steady-state amount of peptidoglycan per cell, measured in AV84 (AV44 ΔLysA)/pAV20 and AV105 (AV44 ΔPBP1b ΔLysA) as annotated. Bottom: Fraction of the peptidoglycan that is cross-linked in the same conditions. p-Values correspond to a two-sided t-test. NS: not significant. (B) Extension of the cells’ short axis (left) and long axis (right) after a 1 osm/L NaCl downshock, in AV93 (AV44 ΔMscLS)/pAV20 with sgRNA GØ-RØ or G14-R20. A value of one corresponds to no extension. Horizontal lines represent the medians. p-Values correspond to a two-sided permutation test. (C) Growth curves before and after a 1 osm/L osmotic downshock, in AV93/pAV20 with sgRNA GØ-RØ or G14-R20. The curves are scaled so all curves have the same OD at the moment of the shock. OD: optical density.
-
Figure 2—source data 1
Data used to generate Figure 2 and its supplements.
- https://cdn.elifesciences.org/articles/51998/elife-51998-fig2-data1-v2.xlsx
Figure 2—figure supplement 1
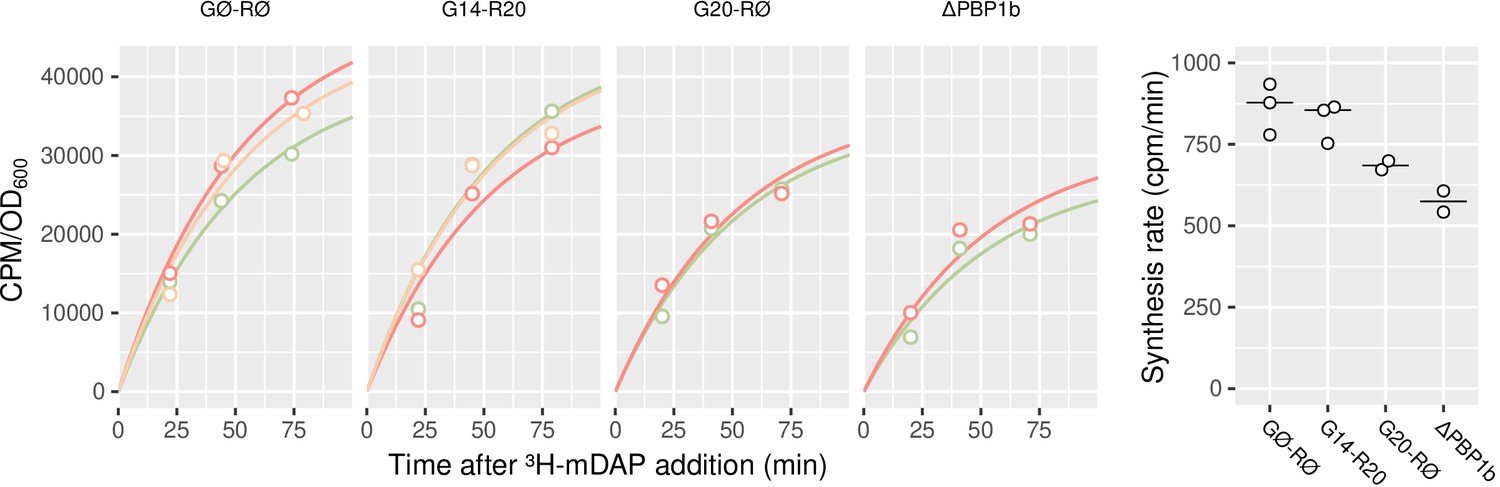
Amount of incorporated 3H-mDAP per optical density as a function of time.
Strains are AV84 (AV44 ΔlysA)/pAV20 GØ-RØ, AV84/pAV20 G14-R20, AV84/pAV20 G20-RØ and AV105 (AV84 ΔPBP1b)/pAV20 GØ-RØ, from left to right. The incorporated 3H-mDAP per cell is fit with formula , where is the rate of mDAP incorporation, and the rate of turn-over, the growth rate and the time (min). was measured to be 0.0069 min-1, was fit jointly for all curves and is equal to 0.012 min-1. Left: Colored curves are exponential fits (see Materials and methods) to the raw measurements (open symbols). Each color represents one biological replicate. CPM/OD600 values are proportional to the amount of incorporated mDAP per cell. Right: Fit values for the parameter. Experiment done in minimal medium.
Figure 2—figure supplement 2
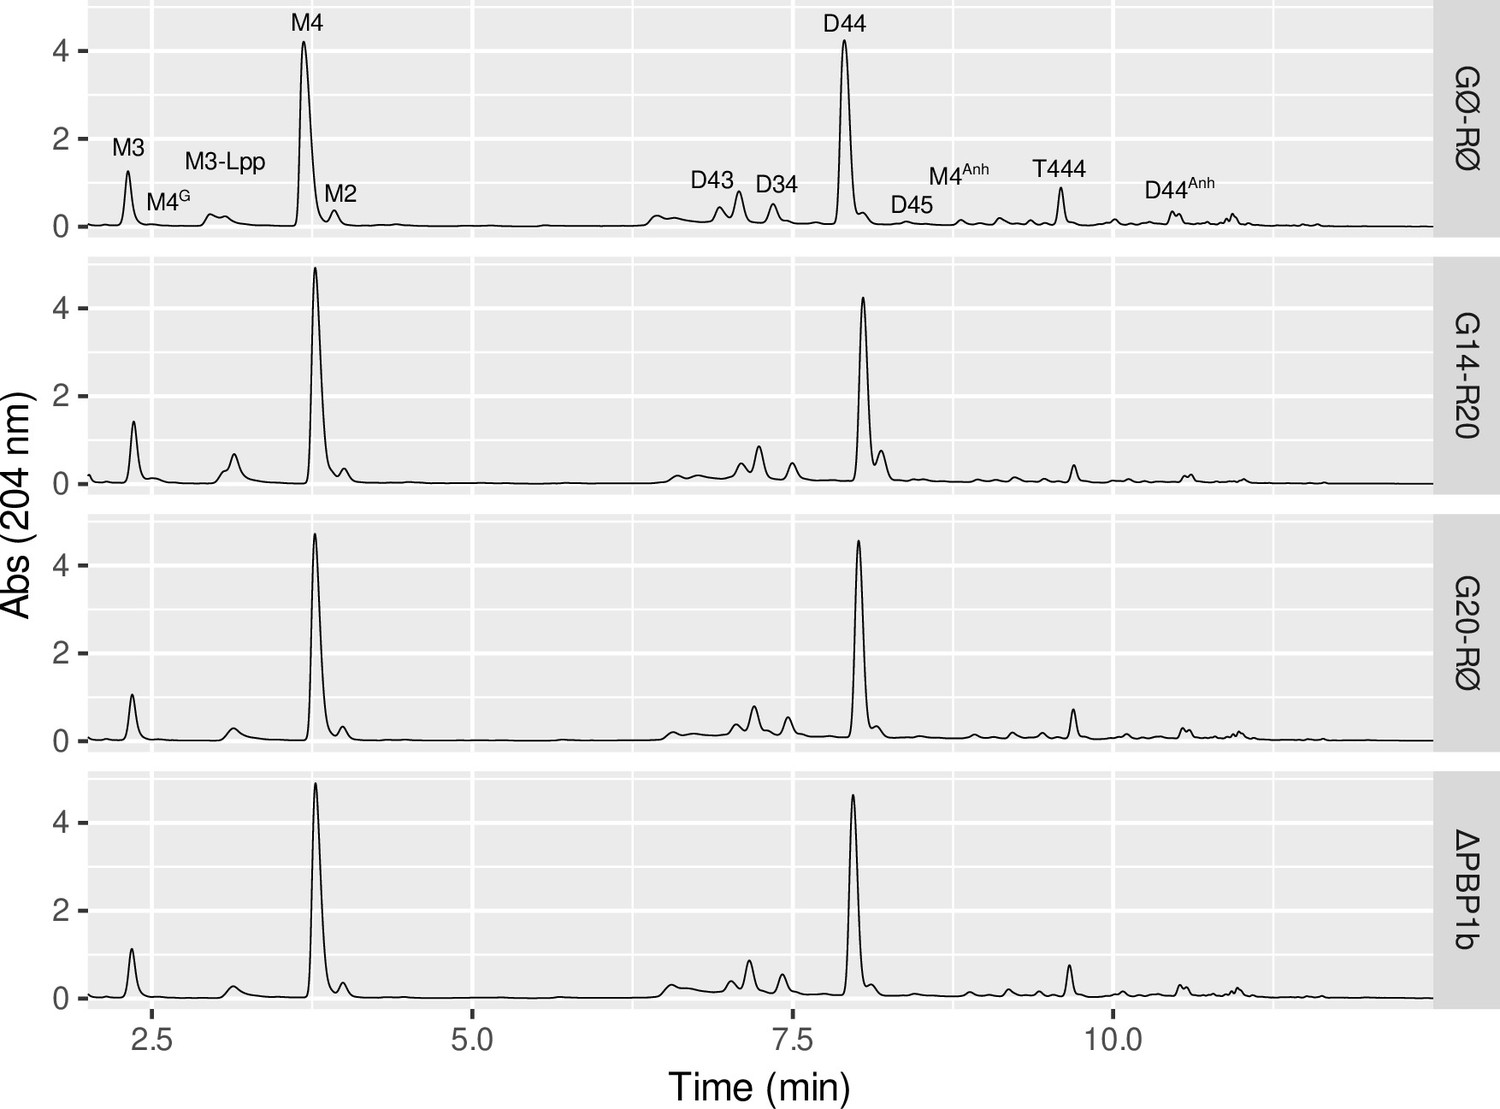
UPLC-UV chromatograms of the peptidoglycan after digestion by muramidase.
From top to bottom, strains are AV84/pAV20 GØ-RØ, AV84/pAV20 G14-R20, AV84/pAV20 G20-RØ and AV105/pAV20 GØ-RØ (ΔPBP1b). Abs: absorbance.
Figure 2—figure supplement 3
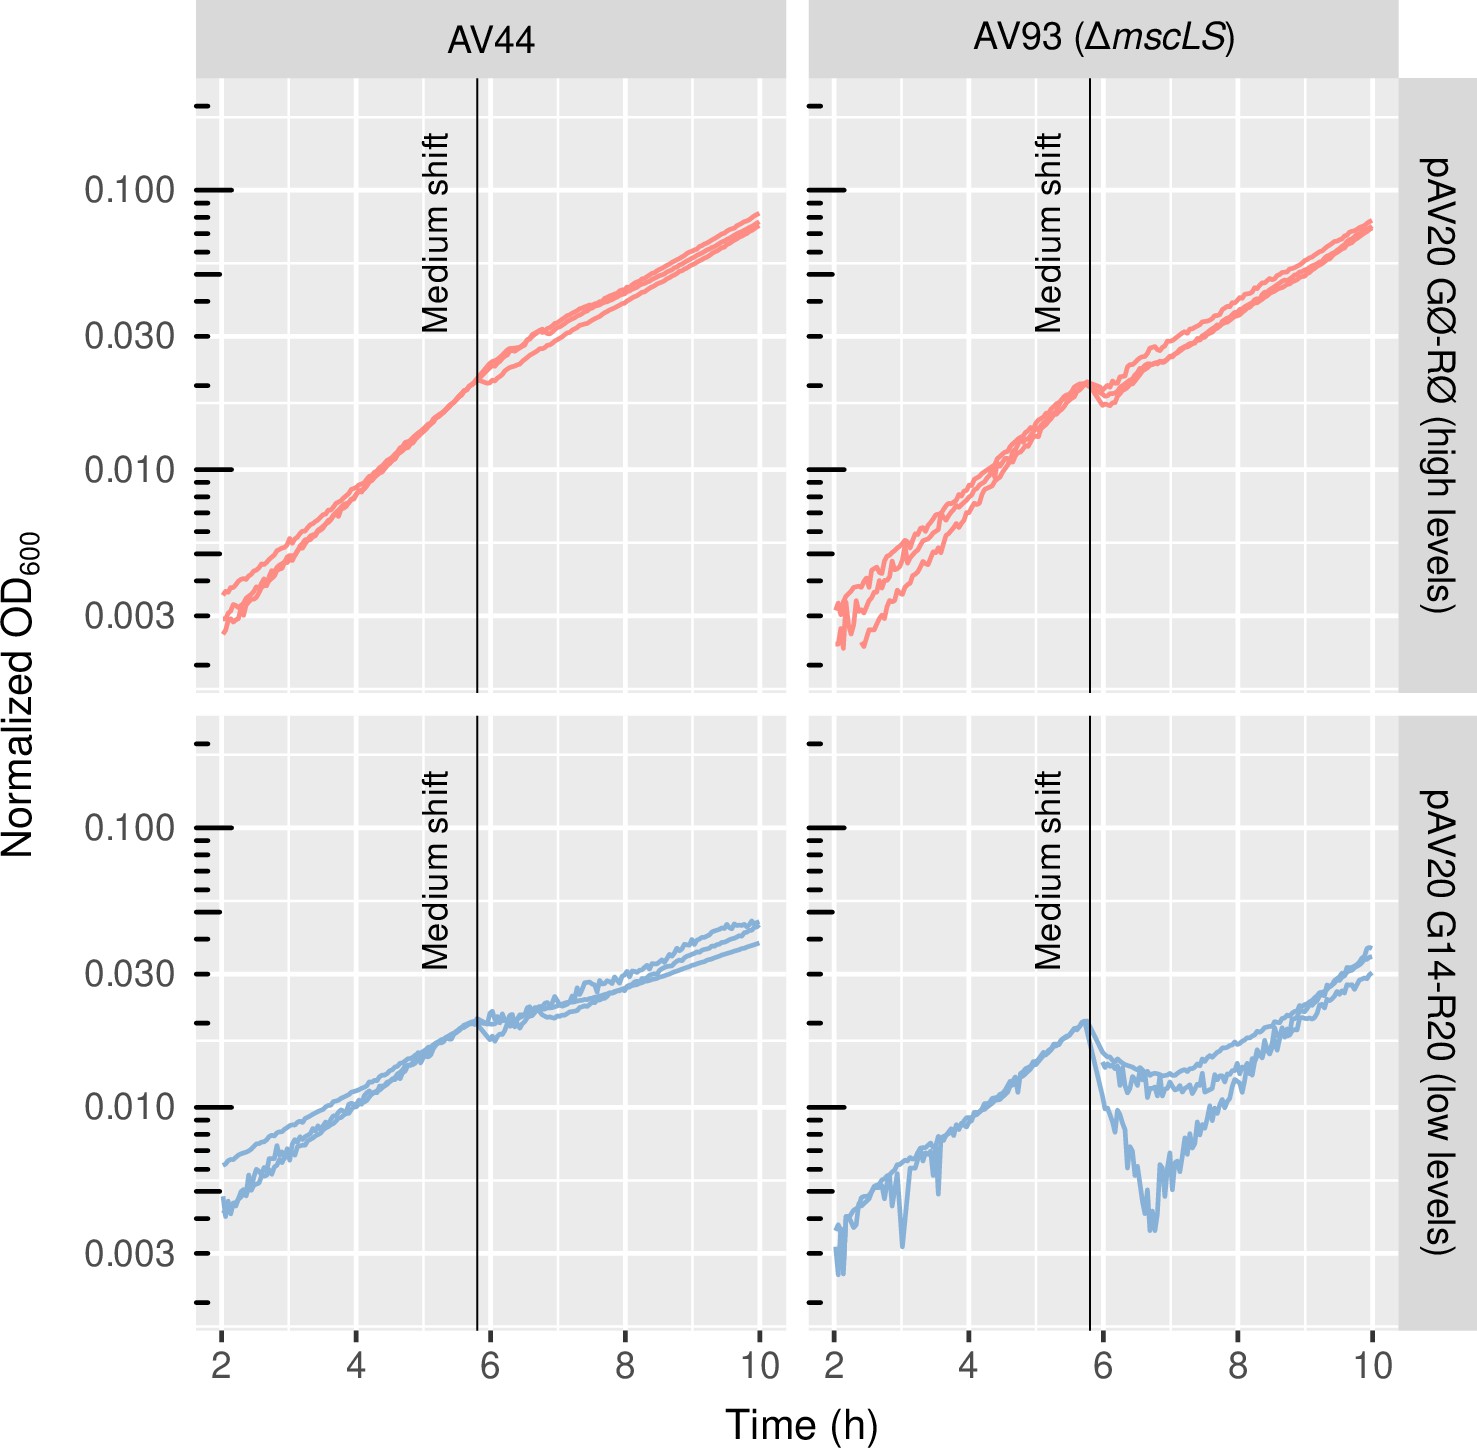
Growth curves before and after osmotic shock in minimal medium.
Strains are AV44 or AV93 (AV44 ΔmscSL) with either pAV20 GØ-RØ or G14-R20. Vertical lines mark the time of centrifugation, medium removal and resuspension in a medium of lower osmolarity. Normalized OD: Optical density normalized with respect to the value at the time of the medium shift. Each curve is one biological replicate. Experiment done in a plate-reader.
Figure 2—video 1
Video of sample cells in phase-contrast microscopy during an osmotic downshock.
Cells are expanding when the lower-osmolarity medium is flushed in the tunnel. The 1 osm/L osmotic downshock happens at 6 s. Corresponds to Figure 2B.
Figure 3 with 9 supplements
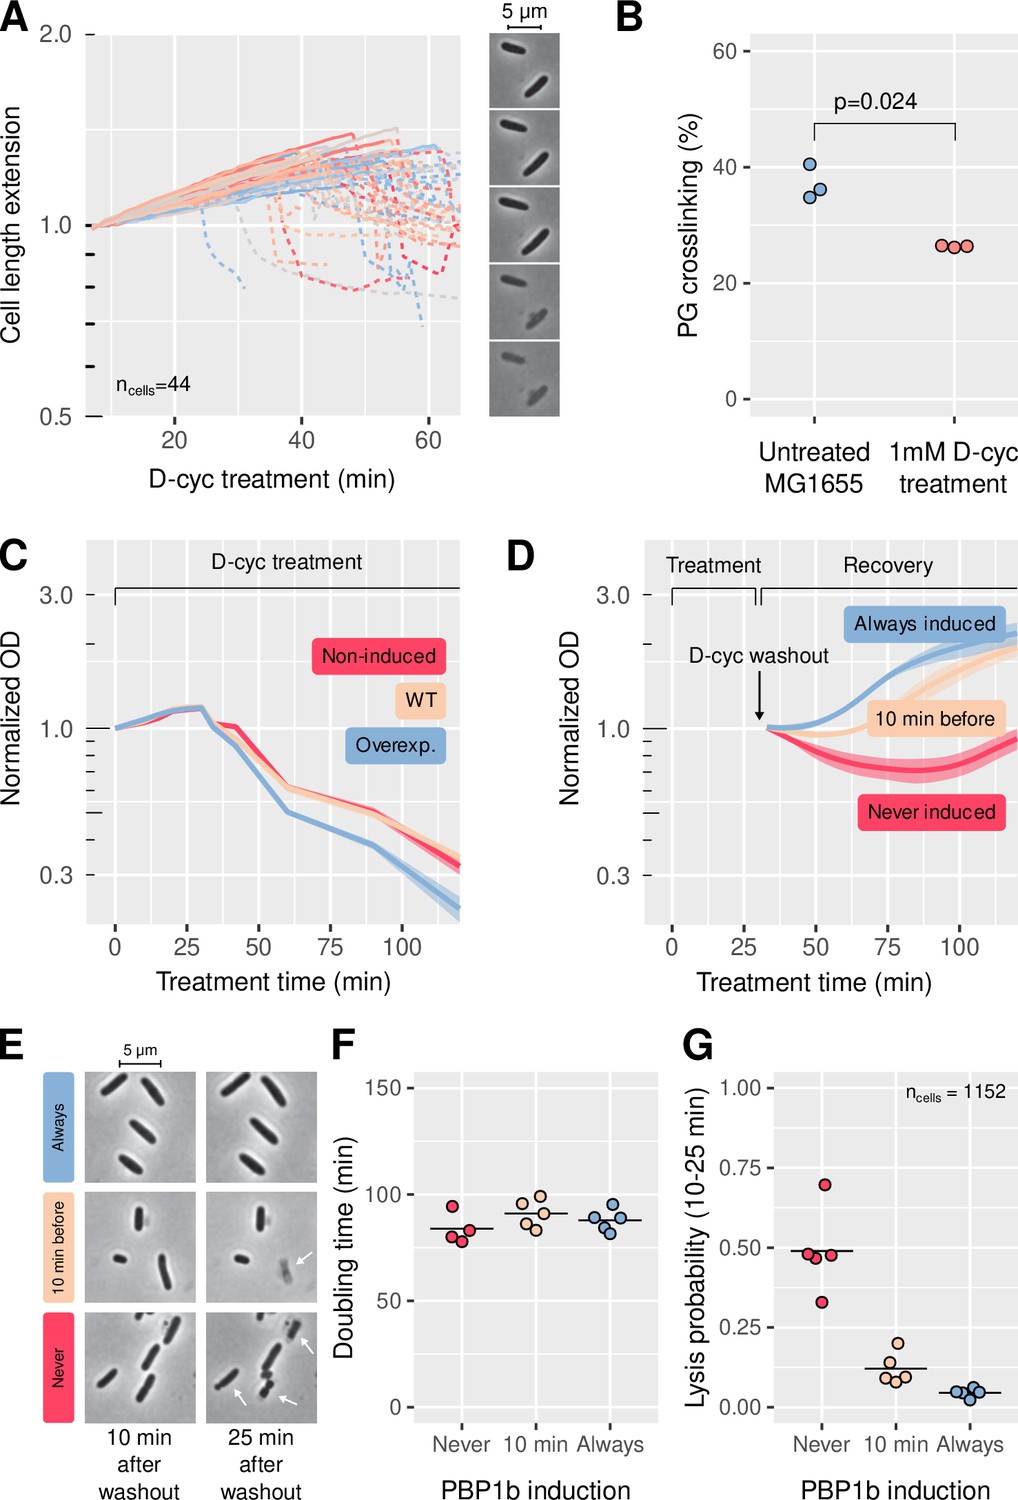
PBP1b facilitates quick recovery from transient inhibition of peptidoglycan synthesis.
(A) Cell elongation before lysis from D-cycloserine treatment (1 mM) under the microscope, including sample snapshots. Strain is MG1655. Length is normalized to the length at the beginning of the movie. Solid lines describe growing cells, dashed lines correspond to phase-bright, lysing cells. Colors are arbitrary. (B) Effect of 1 mM D-cycloserine treatment on the cell-wall cross-linking rate, measured by UPLC on MG1655 before and after 1 hr of treatment. (C) Sensitivity to 1 mM D-cycloserine, for MG1655 (WT) and B150 (ΔPBP1b)/pBC03 (pBAD33-ParaPBP1b) with arabinose (overexp.) or without arabinose (non-induced). (D) Recovery after washout from 32 min of D-cycloserine treatment (1 mM), for B150/pBC03. PBP1b is either always induced, never induced, or induced 10 min before D-cycloserine washout. In (C-D), shaded areas correspond to mean ± standard deviation of three biological replicates. (E) Sample images of B150/pBC03 taken 10 min and 25 min after washout from 1 mM D-cycloserine. PBP1b is either induced from the beginning, induced 10 min before washout, or never induced. White arrows point to cells that died during the 15 min imaging window. (F) Doubling time measured from single living cells, over the 15 min imaging window, for the three different PBP1b induction times. Each point represents a field of view with 80 ± 40 cells (total 1152). (G) Fraction of the cells that visibly lysed during the 15 min imaging window. WT: wild-type. Normalized OD: optical density normalized to the initial value, at the beginning of the treatment or recovery. All panels are done in M63 minimal medium, except cultures on panel B that were prepared in LB.
-
Figure 3—source data 1
Data used to generate Figure 3 and its supplements.
- https://cdn.elifesciences.org/articles/51998/elife-51998-fig3-data1-v2.xlsx
Figure 3—figure supplement 1
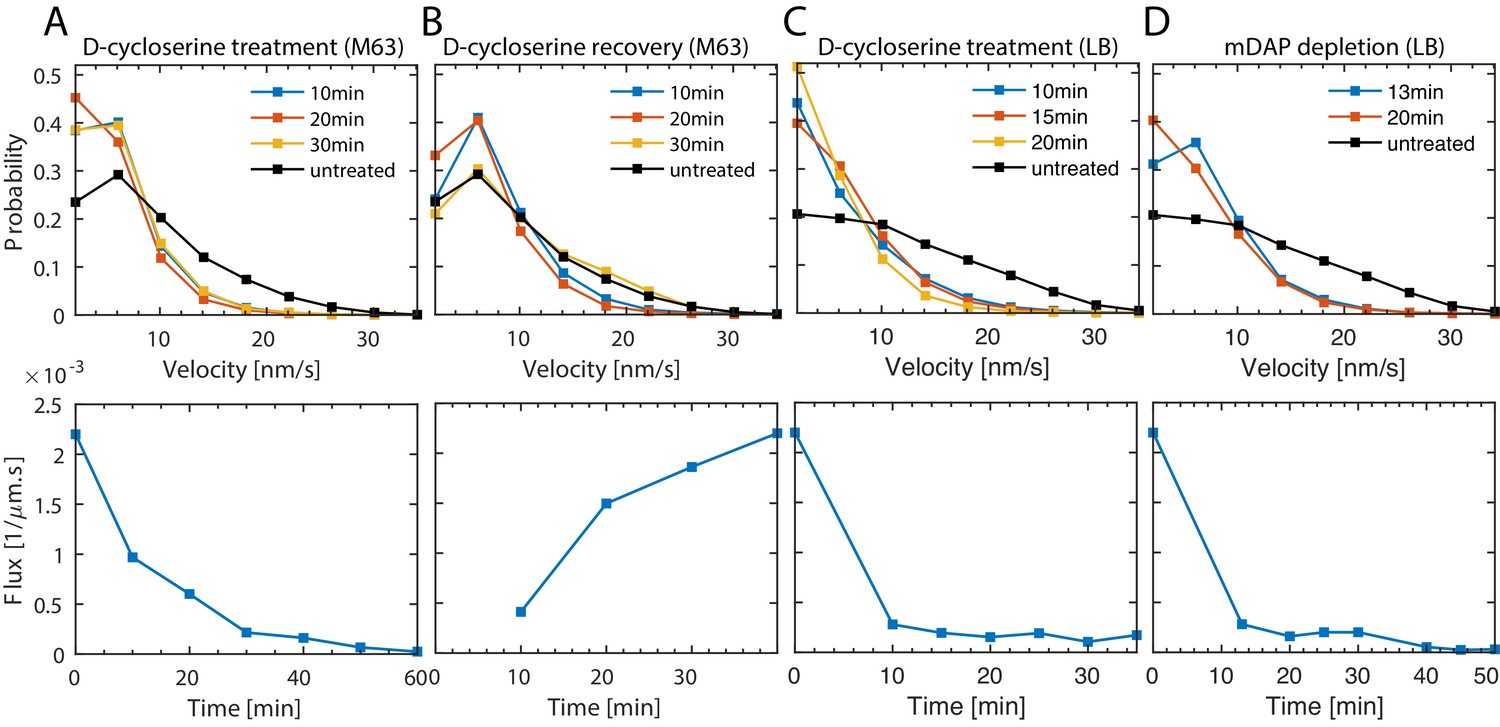
Effect of depletion of peptidoglycan precursors measured by MreB motion.
Top: Probability distributions of the instantaneous velocity of MreB-msfGFP measured upon D-cycloserine treatment using strain B172 (MG1655 mreB::mreB-msfgfp) (A–C), or during depletion of mDAP in an auxotroph, B176 (MG1655 asd-1, mreB::mreB-msfgfp) (D). Bottom: Flux of MreB-msfGFP corresponding to the experiments in A, B, respectively. Flux is calculated as sum of track end-to-end distances divided by total cell area and movie duration. Medium is M63 minimal medium or LB, as indicated.
Figure 3—figure supplement 2
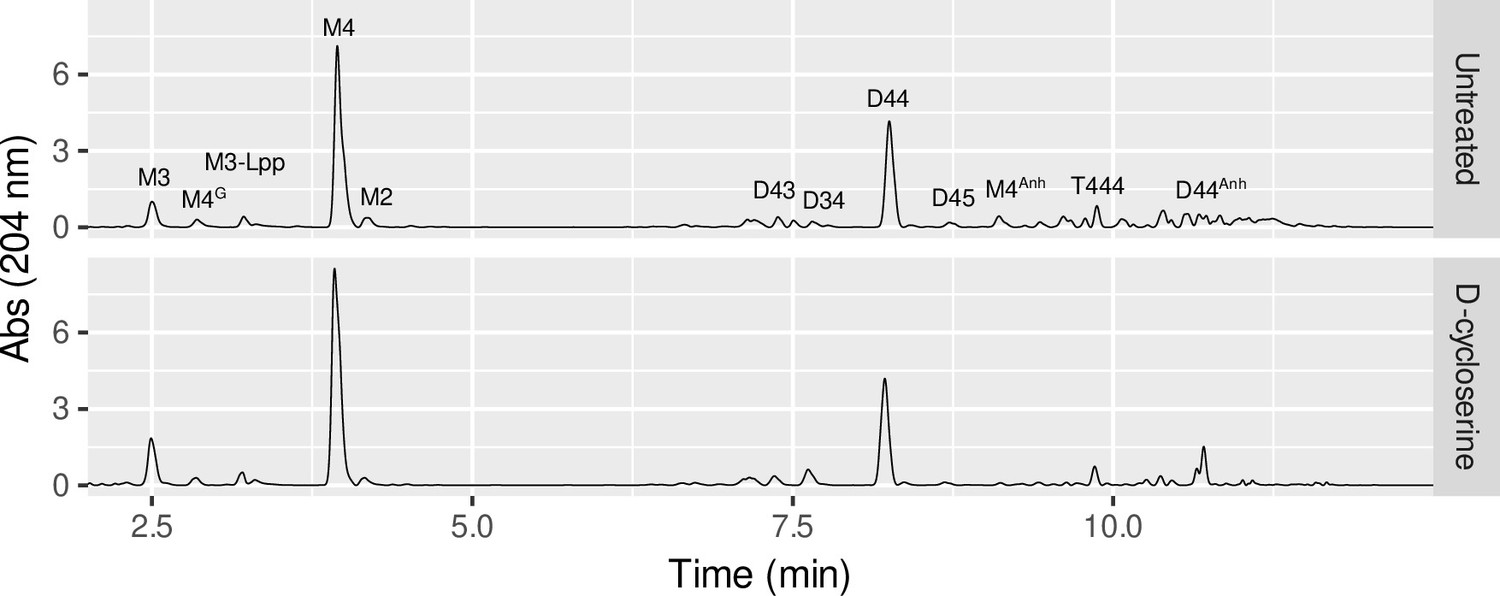
UPLC-UV analysis of the peptidoglycan, either on cells grown without treatment, or after 1 hr of 1 mM D-cycloserine treatment in MG1655 in LB.
Figure 3—figure supplement 3
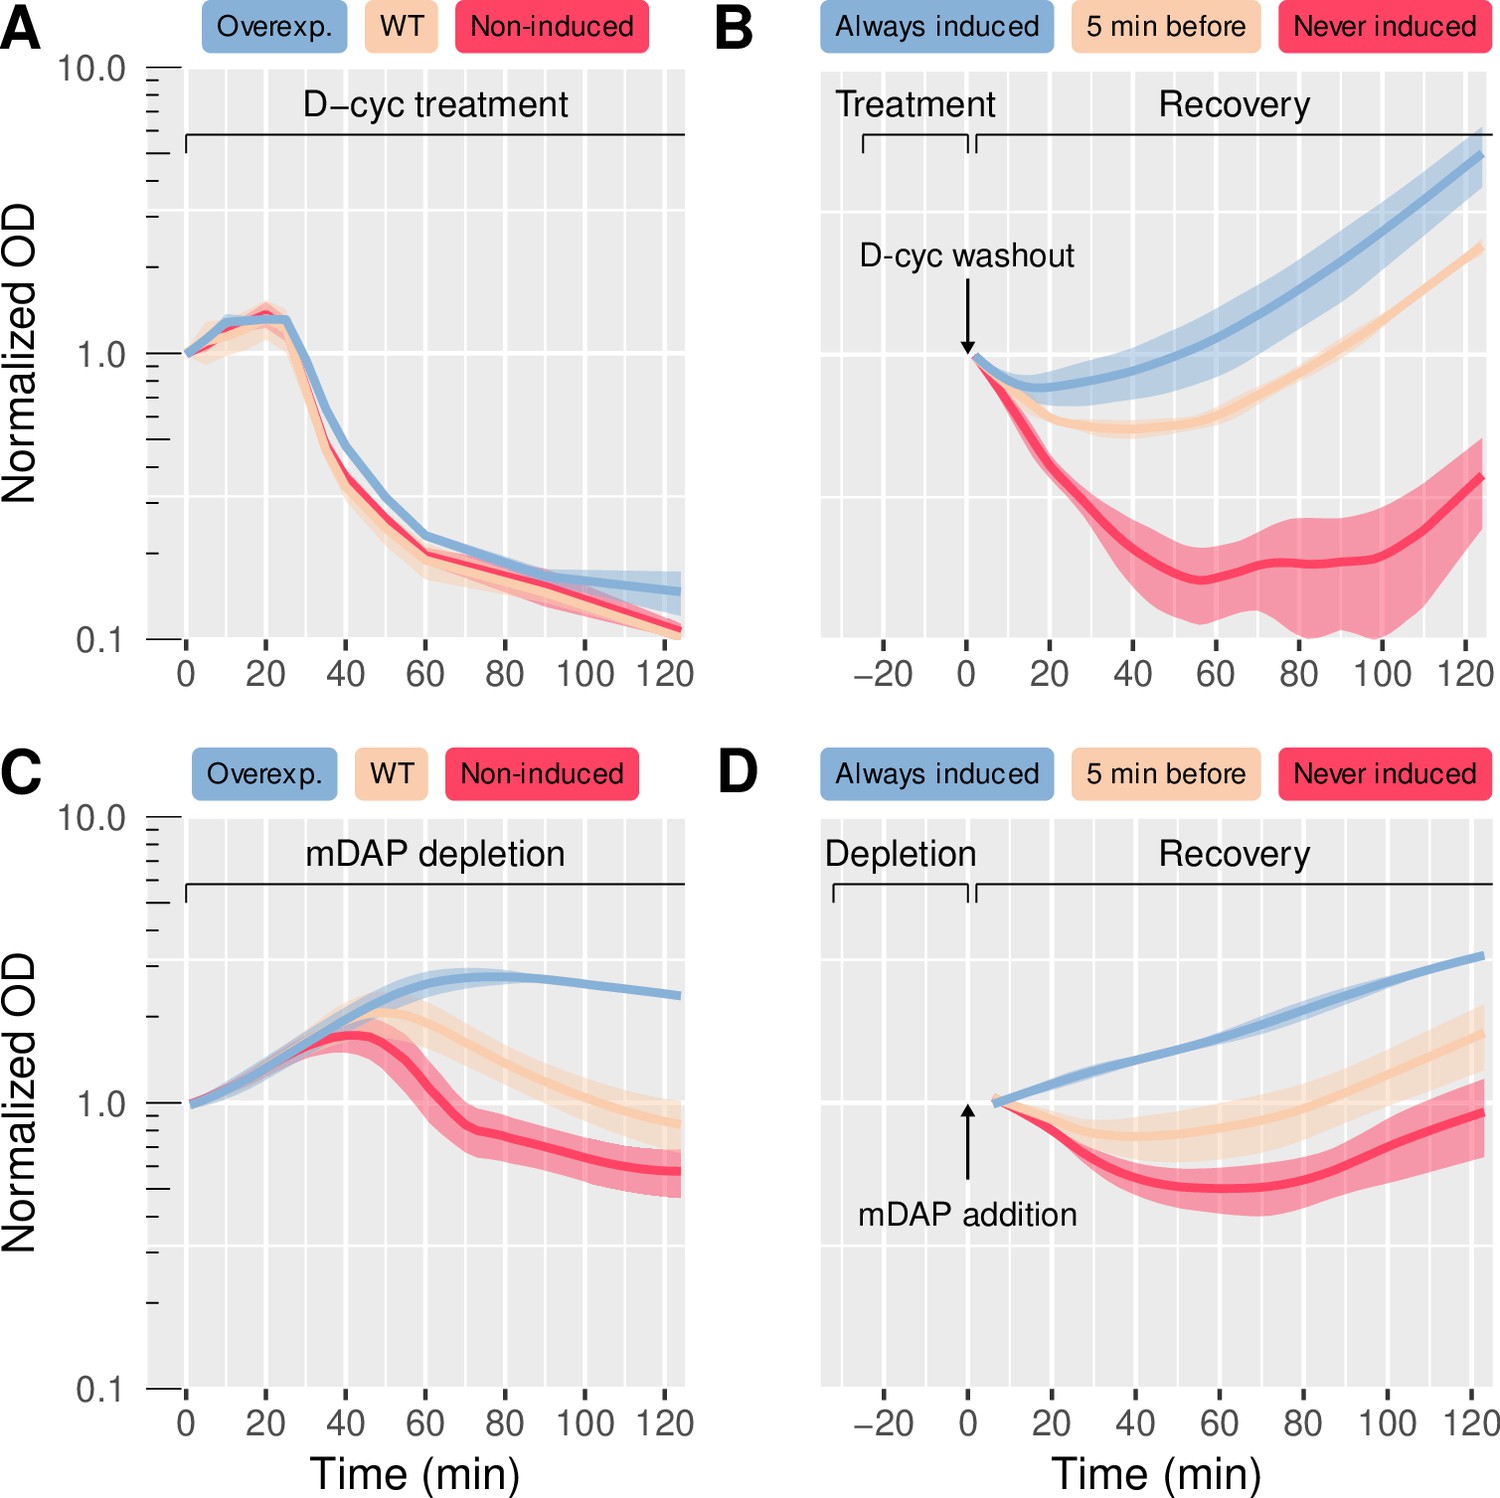
Damage sensitivity and recovery in LB.
(A) Sensitivity to 1 mM D-cycloserine, for MG1655 (WT) and B150 (ΔPBP1b)/pBC03 (pBAD33-ParaPBP1b) with arabinose (overexp.) or without arabinose (non-induced). (B) Recovery after washout from 22 min of D-cycloserine treatment (1 mM), for B150/pBC03. PBP1b is either always induced, never induced, or induced 5 min before D-cycloserine washout. (C) Sensitivity to mDAP depletion in the mDAP auxotroph B151 (FB83 asd-1 van Teeffelen et al., 2011) for WT or B157 (FB83 ΔPBP1b asd-1)/pBC03 for non-induced/overexp. PBP1b is expressed at different levels like in (A). (D) Recovery of B157 (FB83 ΔPBP1b asd-1)/pBC03 after 32 min of mDAP depletion. PBP1b is either always induced, never induced, or induced 5 min before mDAP repletion/recovery. Shaded areas correspond to mean ± standard deviation of three biological replicates. Growth measurements are performed in shaking flasks (A) or microplate reader (B–D) in LB. WT: wild-type. Normalized OD: optical density normalized to the initial value, at the beginning of the treatment or recovery.
Figure 3—figure supplement 4

Detection of lysis events during D-cycloserine recovery.
Sample images from movies taken during recovery from 32 min of 1 mM D-cycloserine treatment, with PBP1b never induced (top) or induced 10 min before drug washout (bottom). Two frames are super-imposed: 10 min after washout (red) and 25 min after washout (cyan). Growing cells have extended and thus appear to have cyan extremities. Lysed cells have typically shrunk and appear to have red extremities. They can also have bulged, making a cyan protrusion appear on the side of the cell. Cells that were already lysed on the first frame were not counted.
Figure 3—figure supplement 5
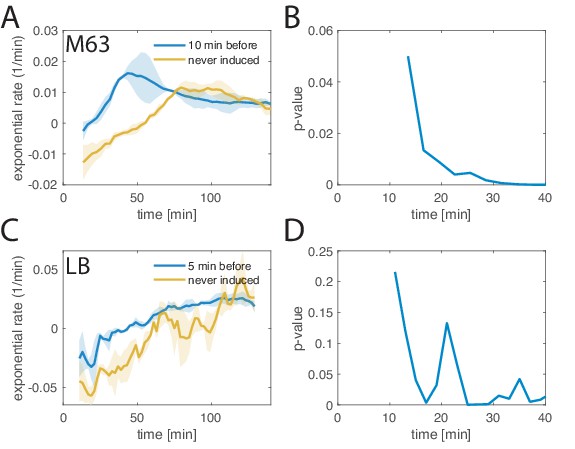
Alleviating effect of PBP1b expression after transient D-cycloserine treatment.
(A,C) Instantaneous effective growth rate (sum of rates of growth and lysis) of B150/pBC03 as a function of time after drug washout following 32 min (A) or 22 min (C) of D-cycloserine treatment (1 mM) in minimal medium (A) or LB (C). PBP1b was induced either never (yellow) or right before washout (blue). Growth rate is calculated from an exponential fit to OD600 measurements (Figure 3D for minimal medium, Figure 3—figure supplement 3B for LB) from three consecutive time points. (B) Two-sided t-test between instantaneous growth rates at different time points indicates that PBP1b-expressing strains undergo significantly less lysis than non-expressing cells within 20 min after drug washout. The x-axis displays the last of the three time points considered for growth-rate calculation.
Figure 3—figure supplement 6
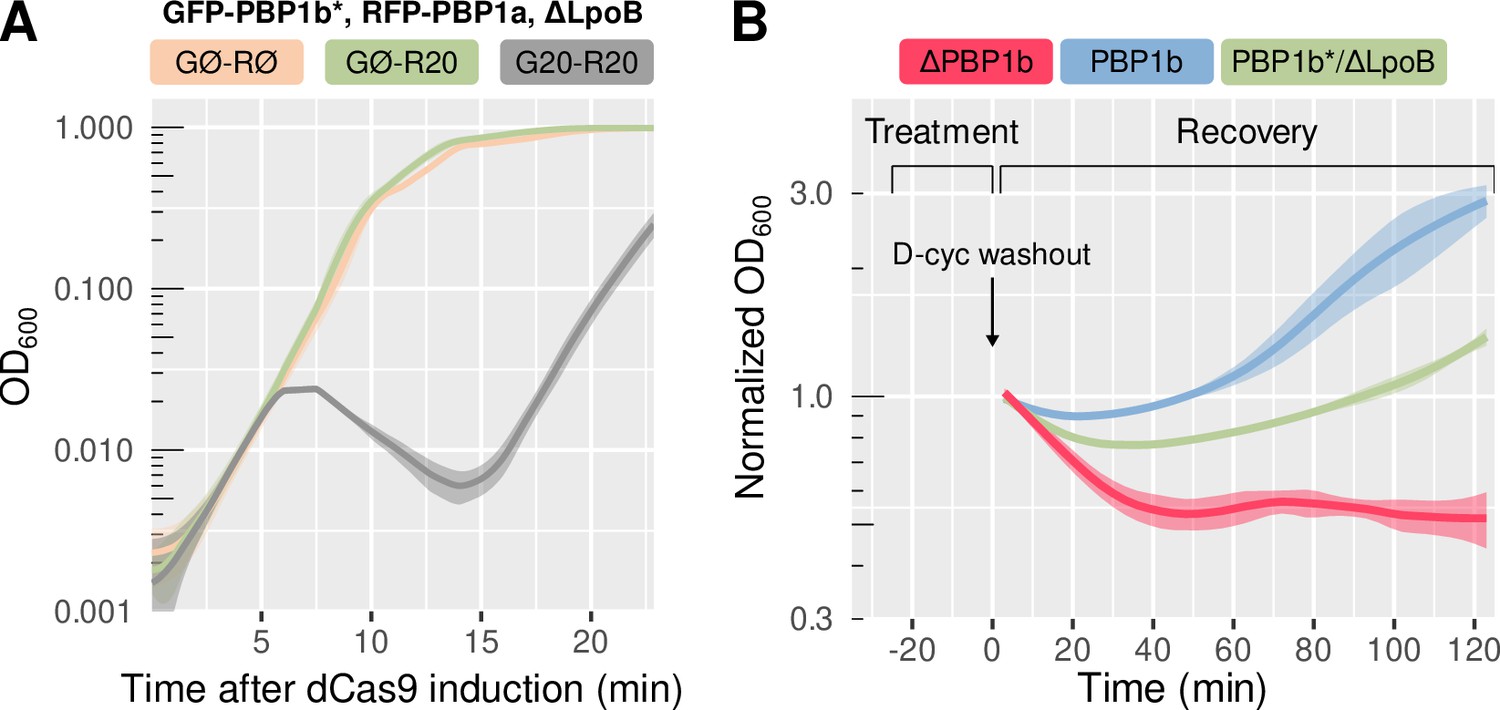
The E313D mutant of PBP1b (PBP1b*) enables growth without LpoB, but does not rescue D-cycloserine recovery.
(A) Verification of PBP1b*’s functionality in ΔLpoB, in AV130 (GFP-PBP1b*, RFP-PBP1a, ΔLpoB) with single-guide RNAs carried by pAV20. With pAV20 GØ-RØ, both PBP1a and PBP1b* are expressed to high levels. With pAV20 GØ-R20, PBP1a is repressed strongly and only PBP1b* remains. With pAV20 G20-R20, both PBP1a and PBP1b* are strongly repressed, leading to culture collapse. (B) Recovery of AV29 (ΔPBP1b), AV31 (GFP-PBP1b) and AV128 (GFP-PBP1b*, ΔLpoB) after 32 min of 1 mM D-cycloserine treatment. Shaded areas correspond to mean ± standard deviation of 3 biological replicates. OD: optical density. All measurements are done in M63 minimal medium using a plate reader.
Figure 3—figure supplement 7
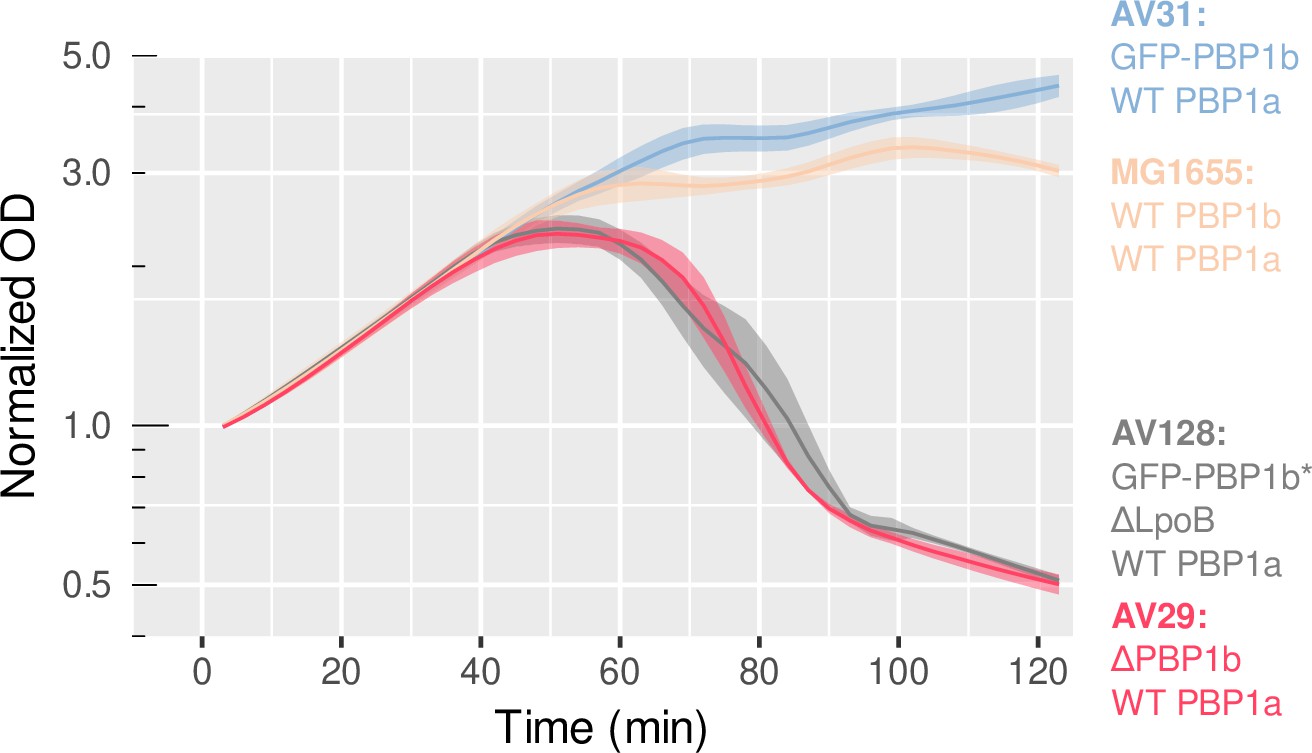
Sensitivity to 100 μM D-cycloserine at different levels of PBP1b.
Growth curves of AV29 (ΔPBP1b), AV31 (GFP-PBP1b), MG1655 and AV128 (GFP-PBP1b*, ΔLpoB) in LB, measured with a plate reader. The fusions to GFP are expected to be over-expressed to about 370% of WT level. Shaded areas correspond to mean ± standard deviation of three biological replicates. Normalized OD: Optical density normalized to its value at the time of washout.
Figure 3—video 1
Movie of MG1655 cells lysing following D-cycloserine treatment in LB.
Timestamps start at the moment when the cells are transfered on the agarose pad with D-cycloserine. Corresponds to Figure 3A.
Figure 3—video 2
Sample of movies used for single-molecule tracking of MreB-GFPSW, with overlaid trajectories.
Top: Untreated cells, Middle: D-cyc treatment (20 min time point), Bottom: mDAP depletion (30 min time point). Corresponds to Figure 3—figure supplement 1.
Figure 4 with 5 supplements
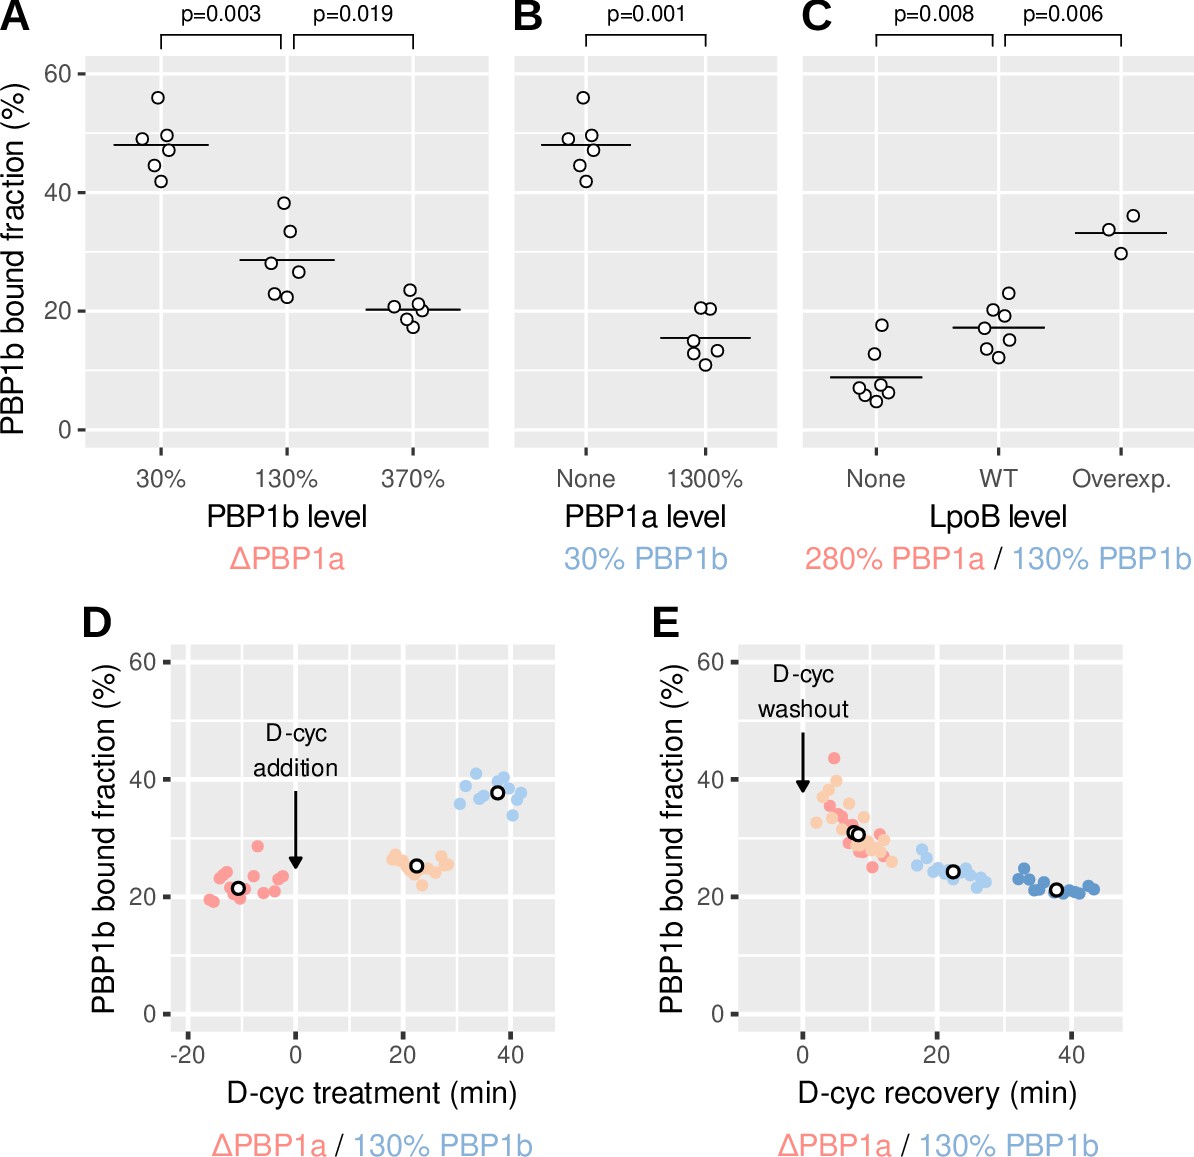
PBP1b localizes depending on the need for peptidoglycan synthesis.
(A-C) Calculated bound fraction of PBP1b at different levels of PBP1b, PBP1a and LpoB, using strains AV44, AV51 (ΔPBP1a) or AV110 (ΔLpoB). For GFP-PBP1b, sgRNA G14 (in pAV20), crRNA G10 (in pCRRNAcos) and crRNA GØ (in pCRRNAcos) are used to reach 30%, 130% and 370%, respectively. For RFP-PBP1a, sgRNA R20 (in pAV20), crRNA R18 (in pCRRNAcos) and crRNA RØ (in pCRRNAcos) are used to reach 20%, 280% and 1300%, respectively. Each point represents a biological replicate comprising at least 5000 tracks. Horizontal lines are means. p-Values are from permutation tests. (D-E) Bound fraction of PBP1b at different times during 1 mM D-cycloserine treatment (D) and during recovery from 30 min of D-cycloserine treatment (E) in the strain AV51/pCRRNAcos G10-RØ. Colored points are individual movies and white points are medians from one sample. Corresponding free diffusion coefficients are shown in Figure 4—figure supplement 4.
-
Figure 4—source data 1
Data used to generate Figure 4 and its supplements.
- https://cdn.elifesciences.org/articles/51998/elife-51998-fig4-data1-v2.xlsx
Figure 4—figure supplement 1
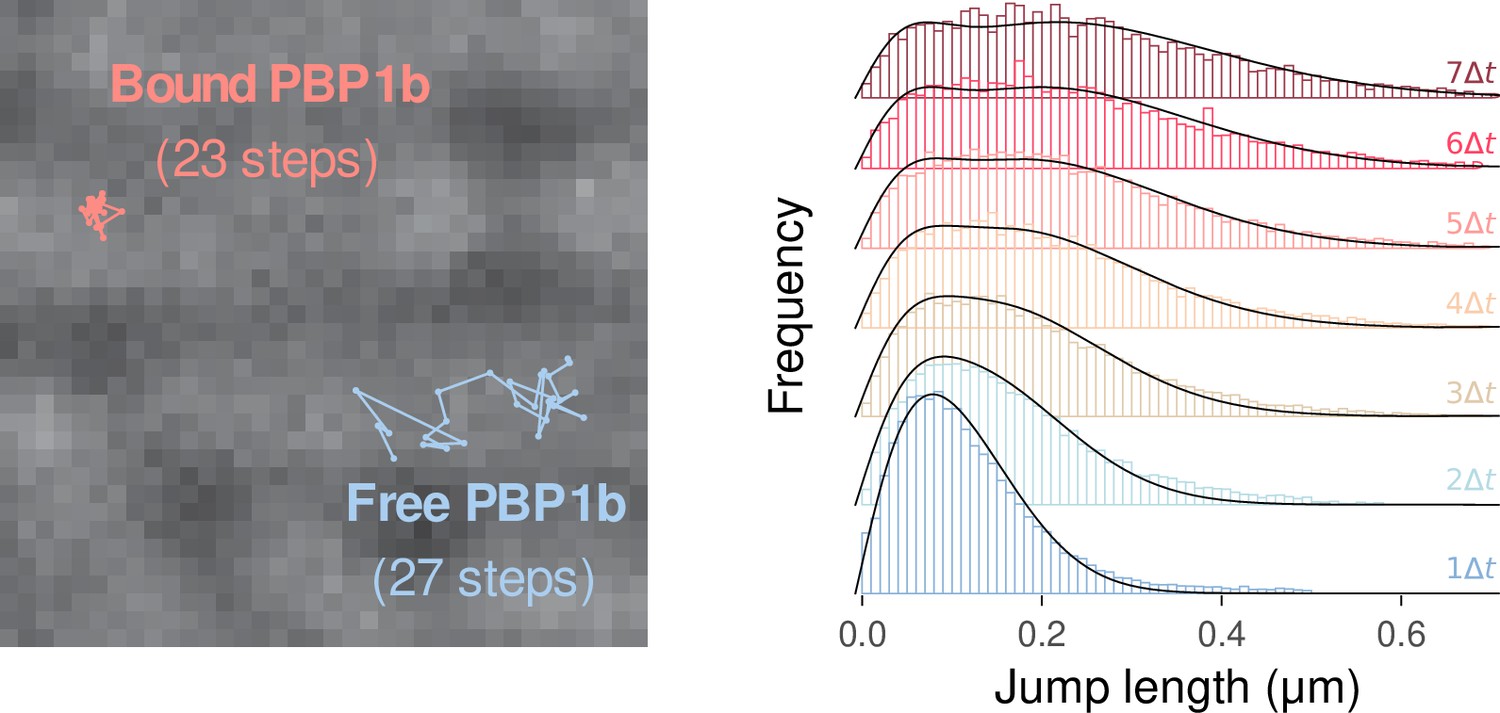
Tracking of single molecules and quantification of the fraction of bound molecules.
Left: Sample tracks corresponding to bound and diffusive GFP-PBP1b molecules, overlaid on a brightfield image using strain AV44/pCRRNAcos G10-R18 (280% PBP1a, 130% PBP1b). Right: Observed and fit distributions of particle jump lengths over time steps of each, obtained using the Spot-On tool. Samples distributions are for one replicate of strain AV44/pCRRNAcos G10-R18.
Figure 4—figure supplement 2
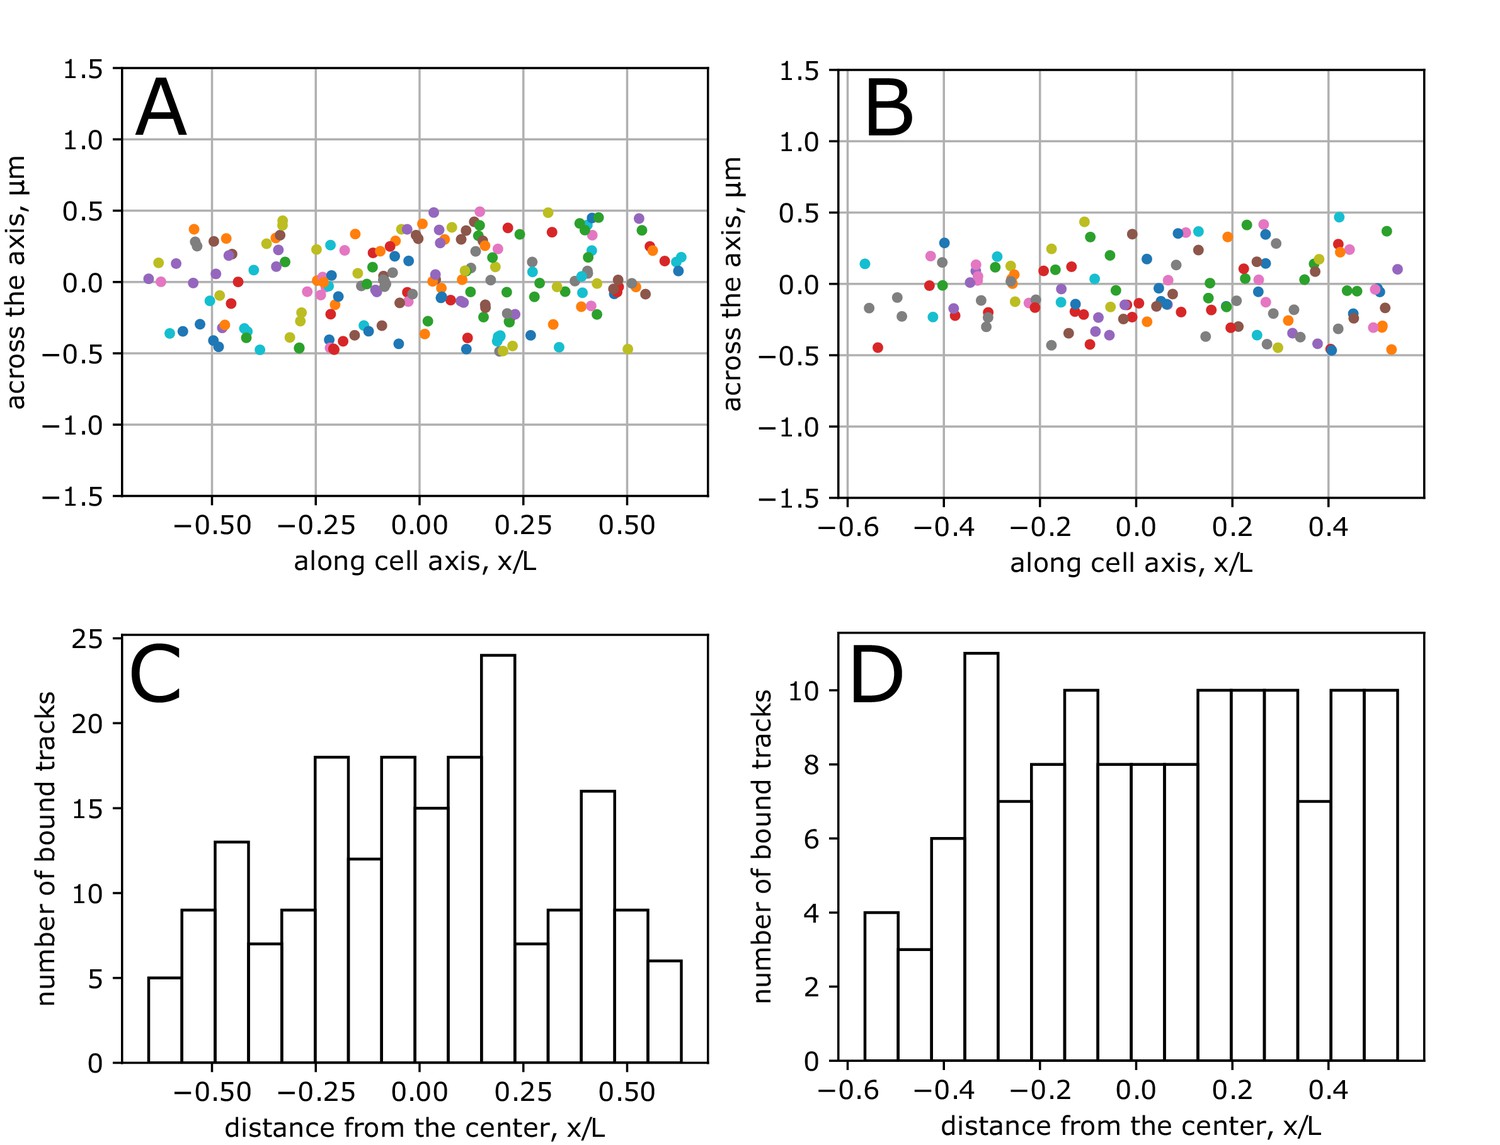
Localization of bound molecules.
(A-B) Mean positions of bound molecules with respect to a normalized cell-coordinate system, using 195 tracks in 67 cells of AV51 (AV44 ΔPBP1a)/pCRRNAcos with crRNA G10 (130% PBP1b with respect to WT) (A) and 130 tracks in 58 cells of AV44/pCRRNAcos with crRNA G10-R18 (130% PBP1b, 280% PBP1a with respect to WT) (B). Bound molecules were identified among tracks with at least five time points according to their MSD (). Tracks were assigned to a cell if the distance from the axis of the cell was below 0.5 μm. The average length of cells was 3.5 μm. x-coordinate: Position of the track along the cell centerline, normalized by cell length. y-coordinate: Distance from cell centerline. C-D: Histograms of mean track positions along cell centerline normalized by cell length.
Figure 4—figure supplement 3
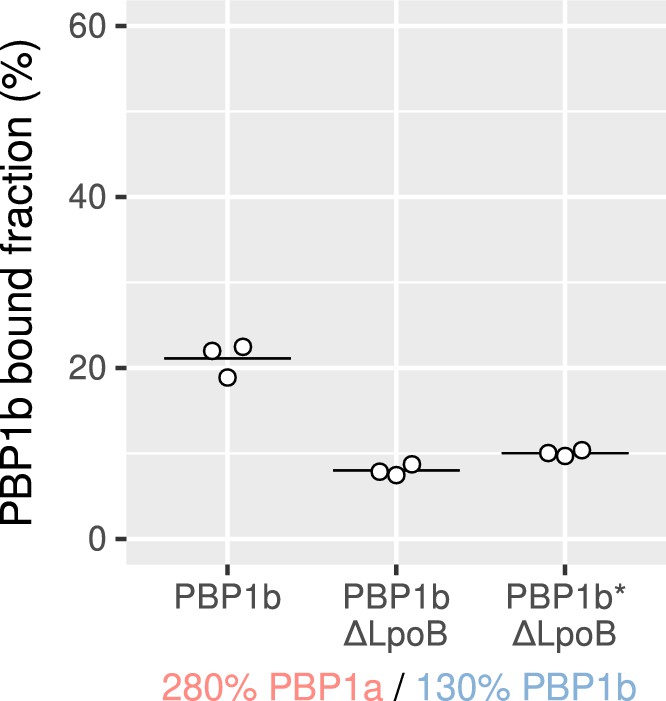
Calculated bound fraction of the PBP1b* mutant, compared to PBP1b with and without LpoB.
The strains are AV44 (GFP-PBP1b, RFP-PBP1a), AV110 (GFP-PBP1b, RFP-PBP1a, ΔLpoB) and AV130 (GFP-PBP1b*, RFP-PBP1a, ΔLpoB). The PBP1a and PBP1b variants are repressed to 280% and 130% of WT level respectively using pAV20 G10-R18. Horizontal lines are means. p-Values are from permutation tests.
Figure 4—figure supplement 4
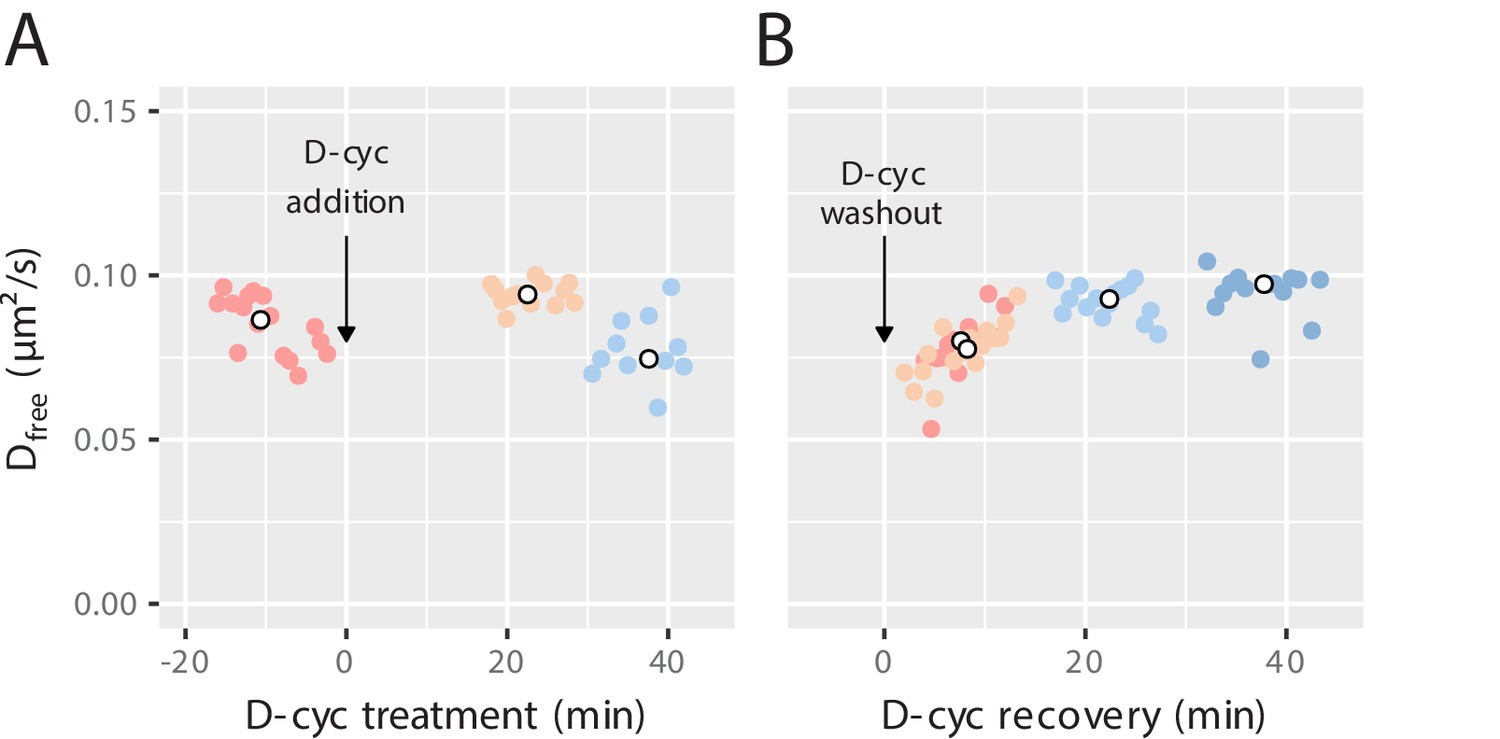
Diffusion coefficient of non-bound molecules during D-cycloserine treatment or recovery.
free of GFP-PBP1b at different times during 1 mM D-cycloserine treatment (A) and during recovery from 30 min of 1 mM D-cycloserine treatment (B) in the strain AV51/pCRRNAcos G10-RØ. Corresponding bound fractions are provided in Figure 4D and E.
Figure 4—video 1
Sample of TIRF-microscopy movies used for single-molecule tracking of GFP-PBP1b, with overlaid trajectories.
Left: AV51/pAV20 G14-RØ (PBP1b at 30% of WT, ΔPBP1a). Right: AV44/pAV20 G14-RØ (PBP1b at 30% of WT, PBP1a at 1300% of WT). These samples correspond to the conditions in Figure 4B.
Tables
Table 1
Levels of PBP1ab expressed from different cassettes, and repressed using different sgRNA or crRNA.
The levels are determined using either fluorescence microscopy, SDS-PAGE with fluorescence detection, or mass spectrometry (DIA: Data-Independent Acquisition or PRM: Parallel Reaction Monitoring.), as described in the Materials and methods. RFP-PBP1a is either non-repressed (AV44) or deleted (AV51 and AV58). GFP-PBP1b is either non-repressed (AV44) or deleted (AV50 and AV63). Levels relative to LC69 are obtained by multiplying the levels relative to AV44 by the levels obtained by DIA for AV44, with propagated error. Ø: Control guides producing no repression. n.d.: not determined.
| Relative and absolute quantification of PBP1b | ||||||||
|---|---|---|---|---|---|---|---|---|
| Strain | Promoter | System | Guide | Fluorescence (% of AV44) | Fluorescence (% of LC69) | Dia (%) | SDS-PAGE (copy/cell) | PRM (copy/cell) |
| LC69 | Wild-type | n.d. | n.d. | 100 | n.d. | 166 ± 28 (100%) | ||
| AV44 | Native fusion | sgRNA | G20 | 1.0 ± 0.04 | 3.8 ± 0.4 | n.d. | n.d. | n.d. |
| AV44 | Native fusion | sgRNA | G14 | 6.6 ± 0.79 | 24 ± 2.9 | 27 ± 2 | 40 ± 5 | 46 (28%) |
| AV51 | Native fusion | sgRNA | G14 | n.d. | n.d. | 33 ± 3 | 67 ± 14 | 56 ± 7 (33%) |
| AV51 | Native fusion | crRNA | G20 | 4.1 ± 2.0 | 15 ± 7.6 | n.d. | n.d. | n.d. |
| AV51 | Native fusion | crRNA | G14 | 12 ± 3.1 | 44 ± 12 | n.d. | n.d. | n.d. |
| AV51 | Native fusion | crRNA | G10 | 36 ± 2.8 | 131 ± 15 | n.d. | n.d. | n.d. |
| AV51 | Native fusion | crRNA | GØ | 97 ± 13 | 356 ± 57 | n.d. | n.d. | n.d. |
| AV44 | Native fusion | crRNA | GØ | 100 ± 5.4 | 367 ± 38 | 367 ± 32 | 688 ± 115 | 547 ± 52 (330%) |
| AV58 | Para | crRNA | GØ | 509 ± 57 | 1870 ± 265 | n.d. | n.d. | n.d. |
| Relative quantification of PBP1a | ||||||||
| Strain | Promoter | System | Guide | Fluorescence (% of AV44) | Fluorescence (% of LC69) | Dia (%) | ||
| LC69 | Wild-type | n.d. | n.d. | 100 | ||||
| AV44 | Native fusion | sgRNA | R20 | n.d. | n.d. | 20 ± 2 | ||
| AV50 | Native fusion | crRNA | R20 | 3 ± 4 | 43 ± 56 | n.d. | ||
| AV50 | Native fusion | crRNA | R18 | 21 ± 4 | 278 ± 139 | n.d. | ||
| AV50 | Native fusion | crRNA | R11 | 46 ± 6 | 620 ± 298 | n.d. | ||
| AV50 | Native fusion | crRNA | RØ | 100 ± 1 | 1337 ± 615 | n.d. | ||
| AV44 | Native fusion | crRNA | RØ | 100 ± 7 | 1337 ± 622 | 1337 ± 615 | ||
| AV63 | Para | crRNA | R18 | 166 ± 14 | 1549 ± 786 | n.d. | ||
| AV63 | Para | crRNA | R11 | 355 ± 22 | 4750 ± 2204 | n.d. | ||
| AV63 | Para | crRNA | RØ | 691 ± 50 | 9243 ± 4304 | n.d. | ||
-
Table 1—source data 1
Data used to generate Table 1.
- https://cdn.elifesciences.org/articles/51998/elife-51998-table1-data1-v2.xlsx
Key resources table
| Reagent type (species) or resource | Designation | Source or reference | Identifiers | Additional information |
|---|---|---|---|---|
| Strain, strain background (E. coli) | LC69 | Cui et al., 2018 | 186::Ptet-dcas9 | |
| Strain, strain background (E. coli) | AV03 | Vigouroux et al., 2018 | 186::Ptet-dcas9, HK022::P, λ::P | |
| Strain, strain background (E. coli) | AV04 | Vigouroux et al., 2018 | 186::Ptet-dcas9, λ::P-mcherry | |
| Strain, strain background (E. coli) | AV08 | Vigouroux et al., 2018 | 186::Ptet-dcas9, mrdA::mcherry-mrdA | |
| Strain, strain background (E. coli) | AV29 | This work | 186::Ptet-dcas9, ΔmrcB | Supplementary file 1 |
| Strain, strain background (E. coli) | AV31 | This work | 186::Ptet-dcas9, mrcB::msfgfp-mrcB | Supplementary file 1 |
| Strain, strain background (E. coli) | AV44 | This work | 186::Ptet-dcas9, mrcB::msfgfp-mrcB, mrcA::mcherry-mrcA | Supplementary file 1 |
| Strain, strain background (E. coli) | AV47 | This work | 186::Ptet-dcas9, HK022::P-msfgfp, λ::P-mcherry | Supplementary file 1 |
| Strain, strain background (E. coli) | AV50 | This work | 186::Ptet-dcas9, mrcA::mcherry-mrcA, ΔmrcB | Supplementary file 1 |
| Strain, strain background (E. coli) | AV51 | This work | 186::Ptet-dcas9, mrcB::msfgfp-mrcB, ΔmrcA | Supplementary file 1 |
| Strain, strain background (E. coli) | AV58 | This work | 186::Ptet-dcas9, mrcB::msfgfp-mrcB, ΔmrcA, HK022::Para-msfgfp-mrcB | Supplementary file 1 |
| Strain, strain background (E. coli) | AV63 | This work | 186::Ptet-dcas9, mrcA::mcherry-mrcA, ΔmrcB, HK022::Para-mCherry-mrcA | Supplementary file 1 |
| Strain, strain background (E. coli) | AV67 | This work | 186::Ptet-dcas9, mrcB::msfgfp-mrcB, mrcA::mcherry-mrcA, ΔpbpC | Supplementary file 1 |
| Strain, strain background (E. coli) | AV80 | This work | 186::Ptet-dcas9, mrcB::msfgfp-mrcB, mrcA::mcherry-mrcA, ΔpbpC, ΔmtgA | Supplementary file 1 |
| Strain, strain background (E. coli) | AV84 | This work | 186::Ptet-dcas9, mrcB::msfgfp-mrcB, mrcA::mcherry-mrcA, ΔpbpC, ΔmtgA, ΔlysA | Supplementary file 1 |
| Strain, strain background (E. coli) | AV88 | Dion et al., 2019 | 186::Ptet-dcas9, mreB::mreB-msfGFP | |
| Strain, strain background (E. coli) | AV92 | This work | 186::Ptet-dcas9, mrcB::msfgfp-mrcB, mrcA::mcherry-mrcA, ΔpbpC, ΔmtgA, ΔmscS | Supplementary file 1 |
| Strain, strain background (E. coli) | AV93 | This work | 186::Ptet-dcas9, mrcB::msfgfp-mrcB, mrcA::mcherry-mrcA, ΔpbpC, ΔmtgA, ΔmscS, ΔmscL | Supplementary file 1 |
| Strain, strain background (E. coli) | AV100 | This work | 186::Ptet-dcas9, ΔmrcA, ΔmrcB, HK022::Para-msfgfp-mrcB | Supplementary file 1 |
| Strain, strain background (E. coli) | AV101 | This work | 186::Ptet-dcas9, ΔmrcA, ΔmrcB, HK022::Para-mcherry-mrcA | Supplementary file 1 |
| Strain, strain background (E. coli) | AV105 | This work | 186::Ptet-dcas9, ΔmrcB, mrcA::mcherry-mrcA, ΔpbpC, ΔmtgA, ΔlysA | Supplementary file 1 |
| Strain, strain background (E. coli) | AV109 | This work | 186::Ptet-dcas9, mrcB::msfgfp-mrcB, mrcA::mcherry-mrcA, ΔlpoA | Supplementary file 1 |
| Strain, strain background (E. coli) | AV110 | This work | 186::Ptet-dcas9, mrcB::msfgfp-mrcB, mrcA::mcherry-mrcA, ΔlpoB | Supplementary file 1 |
| Strain, strain background (E. coli) | AV124 | This work | 186::Ptet-dCas9, mrcB::msfgfp-mrcB(E313D) | Supplementary file 1 |
| Strain, strain background (E. coli) | AV128 | This work | 186::Ptet-dCas9, mrcB::msfgfp-mrcB(E313D), ΔlpoB | Supplementary file 1 |
| strain, strain background (E. coli) | AV130 | This work | 186::Ptet-dCas9, mrcB::msfgfp-mrcB(E313D), mrcA::mcherry-mrcA, ΔlpoB | Supplementary file 1 |
| Strain, strain background (E. coli) | NO34 | Ouzounov et al., 2016 | mreB::mreB-msfgfpsw-kanR | |
| Strain, strain background (E. coli) | B150 | This work | ΔmrcB | Supplementary file 1 |
| Strain, strain background (E. coli) | B151 | van Teeffelen et al., 2011 | FB83, asd-1 | |
| Strain, strain background (E. coli) | B157 | This work | FB83, asd-1, ΔmrcB | Supplementary file 1 |
| Strain, strain background (E. coli) | B172 | This work | mreB::mreB-msfgfpsw-kanR | Supplementary file 1 |
| Strain, strain background (E. coli) | B174 | This work | ΔmrcB, mreB::mreB-msfgfpsw-kanR | Supplementary file 1 |
| Strain, strain background (E. coli) | B176 | This work | FB83, asd-1, mreB::mreB-msfgfpsw-kanR | Supplementary file 1 |
| Strain, strain background (E. coli) | B178 | This work | FB83, asd-1, ΔmrcB, mreB::mreB-msfgfpsw-kanR | Supplementary file 1 |
| Software, algorithm | Trackmate | Tinevez et al., 2017 | ||
| Software, algorithm | ThunderStorm | Ovesný et al., 2014 | ||
| Software, algorithm | SpotOn | Hansen et al., 2018 | ||
| Software, algorithm | Morphometrics | Ursell et al., 2017 | ||
| software, algorithm | TrackPy | Allan et al., 2016 | ||
| Software, algorithm | MicroManager | Edelstein et al., 2010 |
Additional files
-
Supplementary file 1
Strains, plasmids, DNA fragments and oligonucleotides used in this study.
All gene deletions were done by P1 transduction from the Keio collection (Baba et al., 2006). Ptet-dcas9 refers to the cassette described in Cui et al. (2018) that minimizes the ‘bad seed’ effect. MG1655 is a gift from Didier Mazel.
- https://cdn.elifesciences.org/articles/51998/elife-51998-supp1-v2.xlsx
-
Supplementary file 2
Relative abundance of the different peaks of muramidase-digested peptidoglycan, measured by UPLC.
- https://cdn.elifesciences.org/articles/51998/elife-51998-supp2-v2.xlsx
-
Transparent reporting form
- https://cdn.elifesciences.org/articles/51998/elife-51998-transrepform-v2.docx
Download links
A two-part list of links to download the article, or parts of the article, in various formats.
Downloads (link to download the article as PDF)
Open citations (links to open the citations from this article in various online reference manager services)
Cite this article (links to download the citations from this article in formats compatible with various reference manager tools)
Class-A penicillin binding proteins do not contribute to cell shape but repair cell-wall defects
eLife 9:e51998.
https://doi.org/10.7554/eLife.51998


