A neurobiological association of revenge propensity during intergroup conflict
- School of Psychological and Cognitive Sciences, PKU-IDG/McGovern Institute for Brain Research, Beijing Key Laboratory of Behavior and Mental Health, Peking University, China
- Department of Psychology, University of Maryland, United States
- Department of Radiology, The 7th Medical Center of PLA General Hospital, China
- Peking-Tsinghua Center for Life Sciences, Peking University, China
Figures
Figure 1
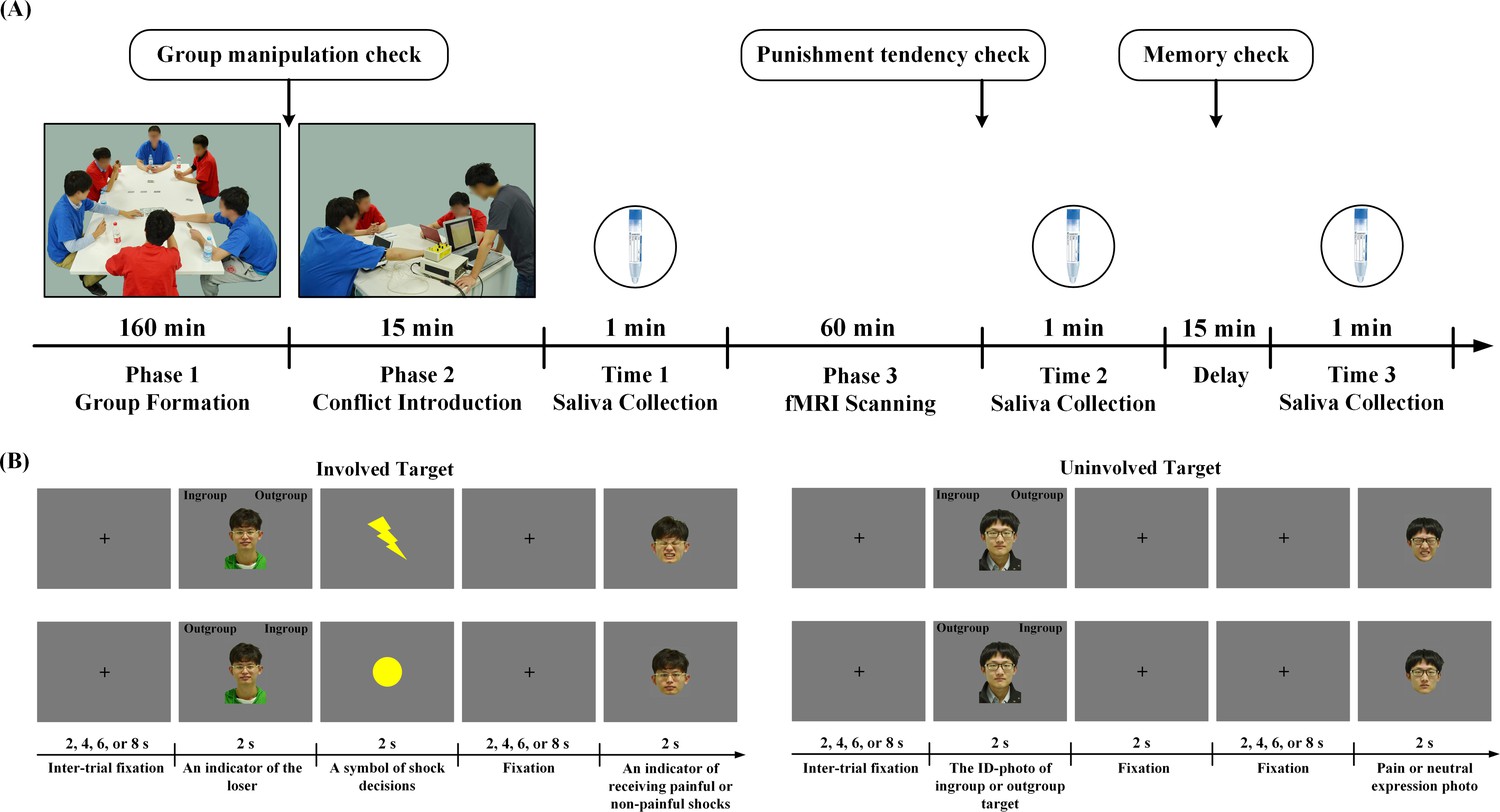
Experimental procedure and behavioral results.
(A) Experimental procedure. Phase 1 assigned four participants and two confederates into two groups who played a game to create group affiliation. In Phase two, the experimenter (in a grey T-shirt) introduced a participant (in a red T-shirt facing the experimenter) to witness a conflict between an ingroup member and an outgroup member (both played by the confederates) who played a competitive game. During fMRI scanning (Phase 3), the participant witnessed ingroup and outgroup members who were directly involved or uninvolved in conflict. Saliva was collected at three points in time. (B) Trial structure during fMRI scanning. An ID-photo of Involved_Ingroup or Involved_Outgroup target indicated the loser of the game and the participant had to judge his group identity. A yellow circle or lightning symbol then indicated a non-painful or painful shock. After a fixation, a photo of the loser's face with a painful or neutral expression was displayed to indicate that he was experiencing a painful or non-painful shock. When ID-photos of uninvolved targets were presented, the participant also judged their group identities and passively viewed a following photo of the target with neutral or painful expression.
Figure 2 with 1 supplement
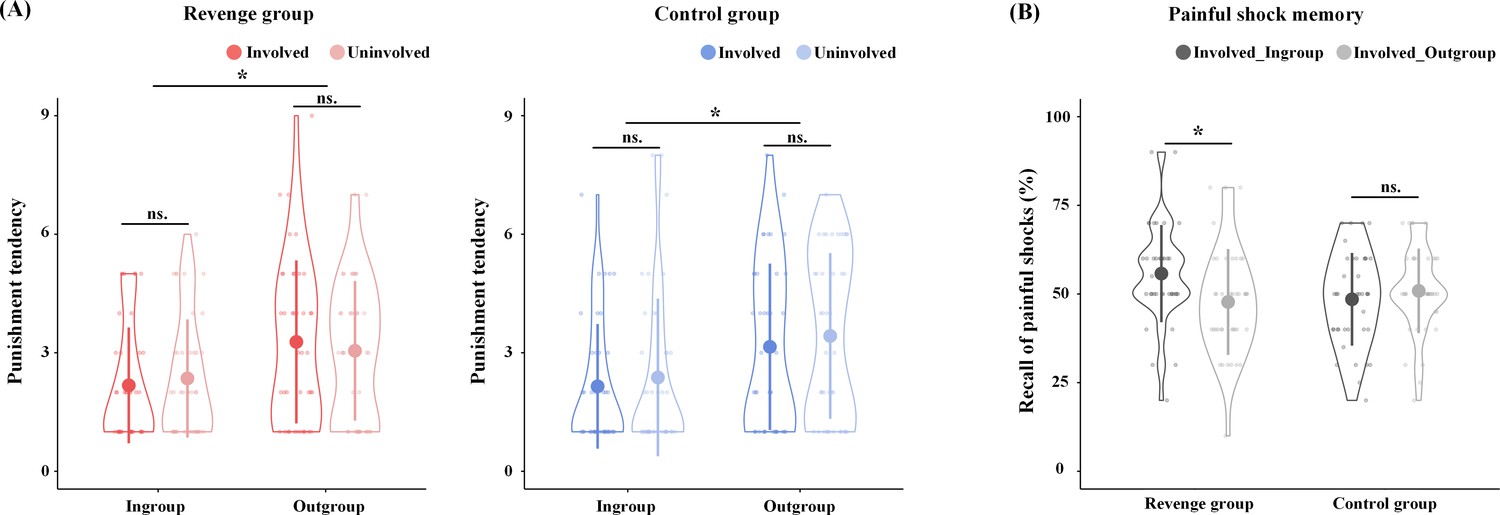
Behavioral results.
(A) Self-report of punishment tendencies. (B) Memory of painful shocks applied to Involved_Ingroup and Involved_Outgroup targets during scanning. Shown are group means (big dots), standard deviations (bars), measures for each individual (small dots), and distribution (violin shape).
-
Figure 2—source data 1
Source data for Figure 2A.
- https://cdn.elifesciences.org/articles/52014/elife-52014-fig2-data1-v2.csv
-
Figure 2—source data 2
Source data for Figure 2B.
- https://cdn.elifesciences.org/articles/52014/elife-52014-fig2-data2-v2.csv
Figure 2—figure supplement 1
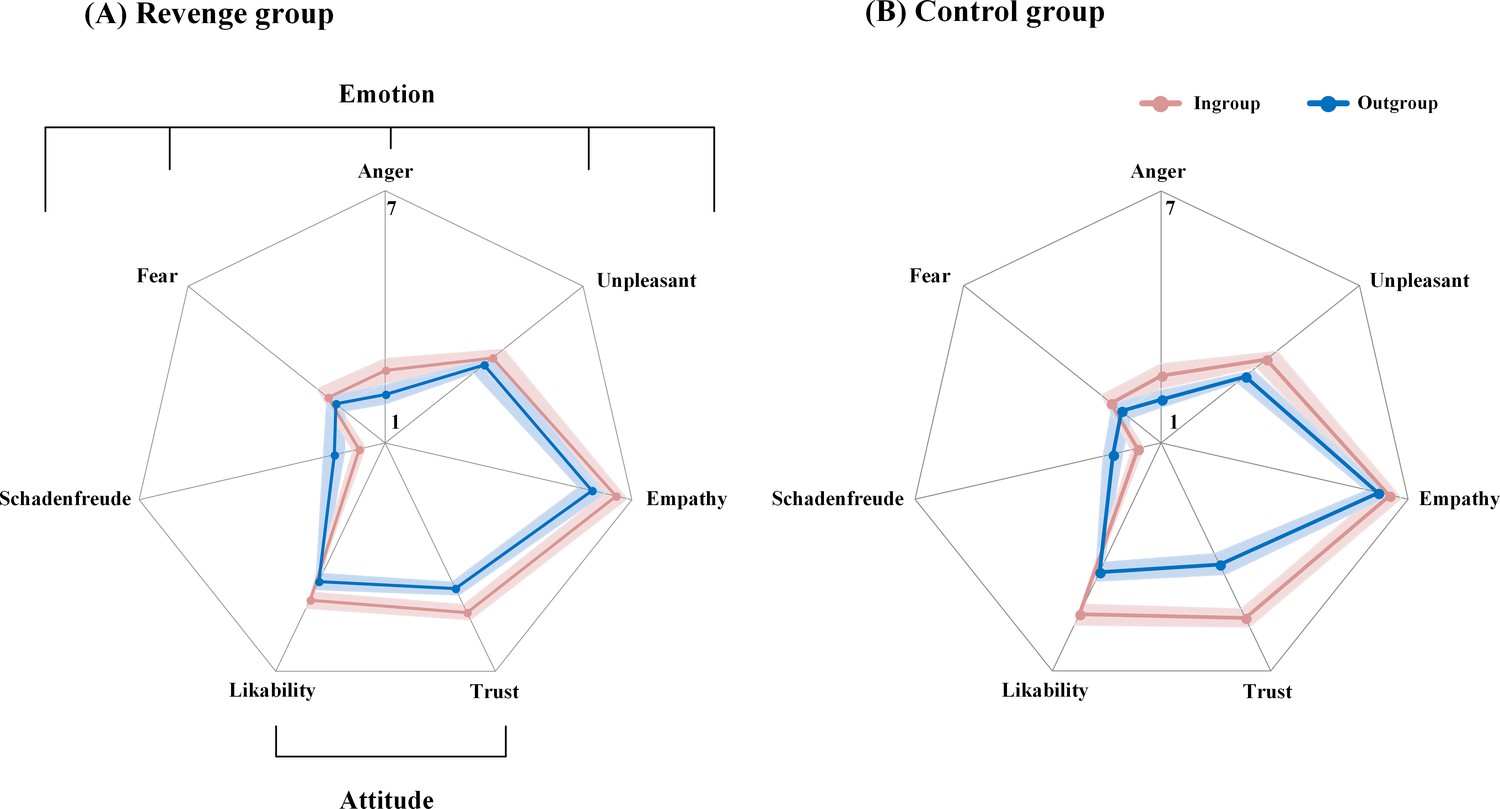
Illustration of behavioral results.
(A) The results of attitude and emotion ratings (from 1 to 7) related to ingroup and outgroup targets in the Revenge group. (B) The results of attitude and emotion ratings (from 1 to 7) related to ingroup and outgroup targets in the Control group.
Figure 3 with 1 supplement
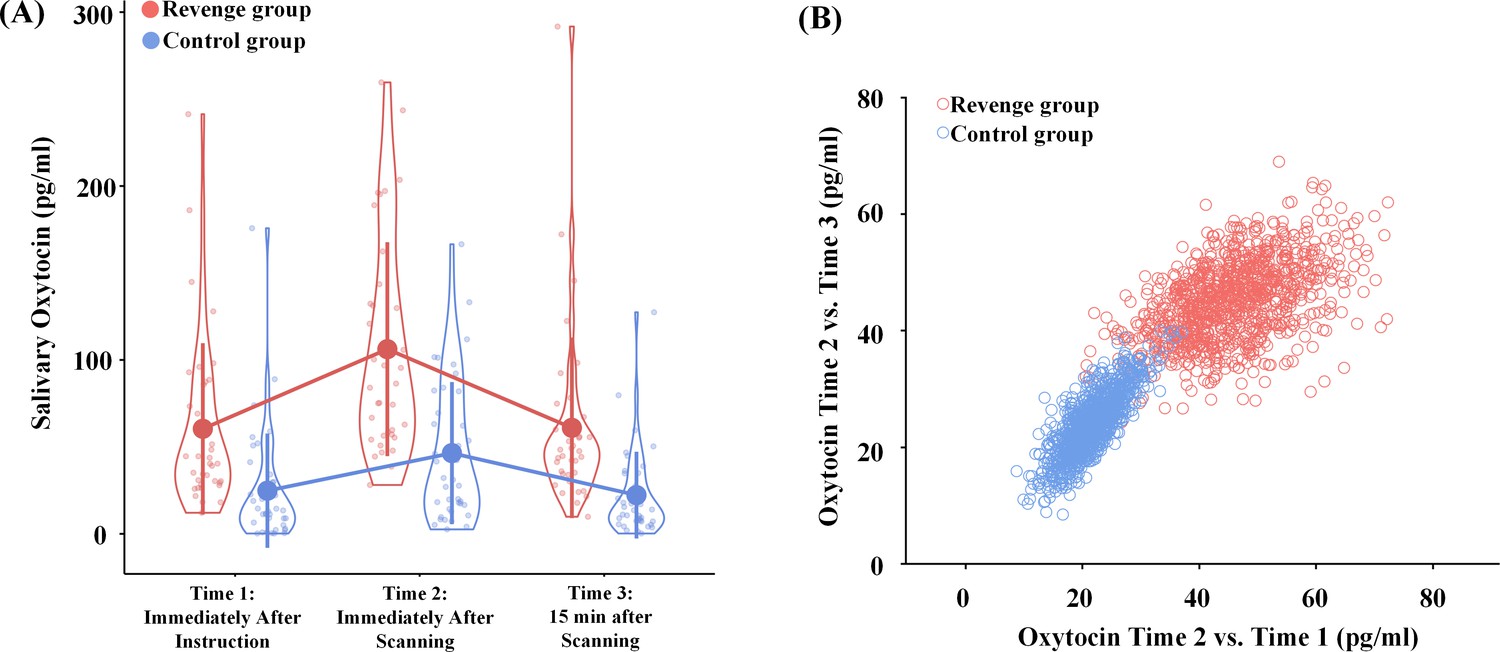
Effects of intergroup conflict on endogenous OT.
(A) Salivary OT levels at three time points during the experimental procedure. Shown are group means (big dots), SD (bars), measures of each individual (small dots), and distribution (violin shape). (B) Results of bootstrapping analyses. Increased OT levels were calculated by subtracting either Time-1 and Time-3 measures from the Time-2 measure for the two bootstrapped samples.
-
Figure 3—source data 1
Source data for Figure 3A.
- https://cdn.elifesciences.org/articles/52014/elife-52014-fig3-data1-v2.csv
-
Figure 3—source data 2
Source data for Figure 3B.
- https://cdn.elifesciences.org/articles/52014/elife-52014-fig3-data2-v2.csv
Figure 3—figure supplement 1
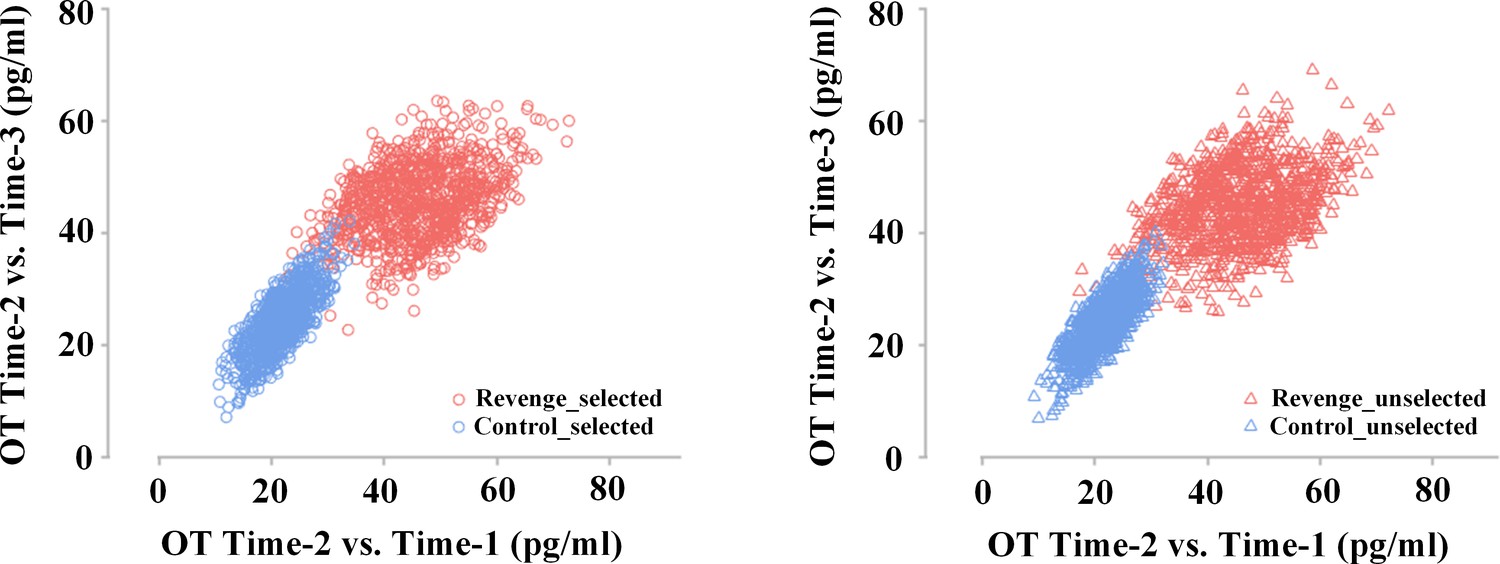
Results of the modified bootstrapping analysis.
The left panel shows the distinct patterns of OT increase of the selected samples. The right panel shows the distinct patterns of OT increase of the unselected samples. Increased OT levels were calculated by subtracting Time-1 and Time-3 measures from the Time-2 measure for each participant. Thereafter, from this data set of each group, half of the participants were randomly selected without replacement as the selected sample, leaving the other participants in the unselected sample. The means of the selected and unselected samples were then calculated and plotted as one of the points (x, y) in a panel with the horizontal (x) and vertical (y) axes showing OT increases at Time-2 relative to Time-1 and Time-2 relative to Time-3. The same procedure was repeated 1000 times to estimate the population means and variations for the selected and unselected samples of each participating group. To confirm the separation of the Revenge and Control groups in both the selected and unselected samples, we calculated the Euclidean distance between the selected samples of the Revenge and Control groups and between unselected samples of the Revenge and Control groups, respectively. The mean distance between the Revenge and Control groups in the selected sample is 31.51, with a 95% confidence interval of 9.92–53.41 that does not include 0. Similarly, the mean distance between the Revenge and Control groups in the unselected sample is 32.83, with a 95% confidence interval of 10.08–54.90 that likewise does not include 0. These results indicate that the selected and unselected samples similarly showed distinct patterns of OT increase between the Revenge and Control groups. Furthermore, to test the similarity between the selected and the unselected samples of each participant group, we calculated the Euclidean distance between the selected and unselected sample in the Revenge and Control groups, respectively. The mean distance between the selected and unselected samples in the Revenge group was −0.75, with the 95% confidence interval of −39.18 – 35.70] that includes 0. The mean distance between the selected and unselected samples in the Control group was 0.57, with the 95% confidence interval of −21.66 – 24.25 that also includes 0. The results suggest similar patterns of OT increases in the selected and the unselected samples of each participant group.
Figure 4 with 2 supplements
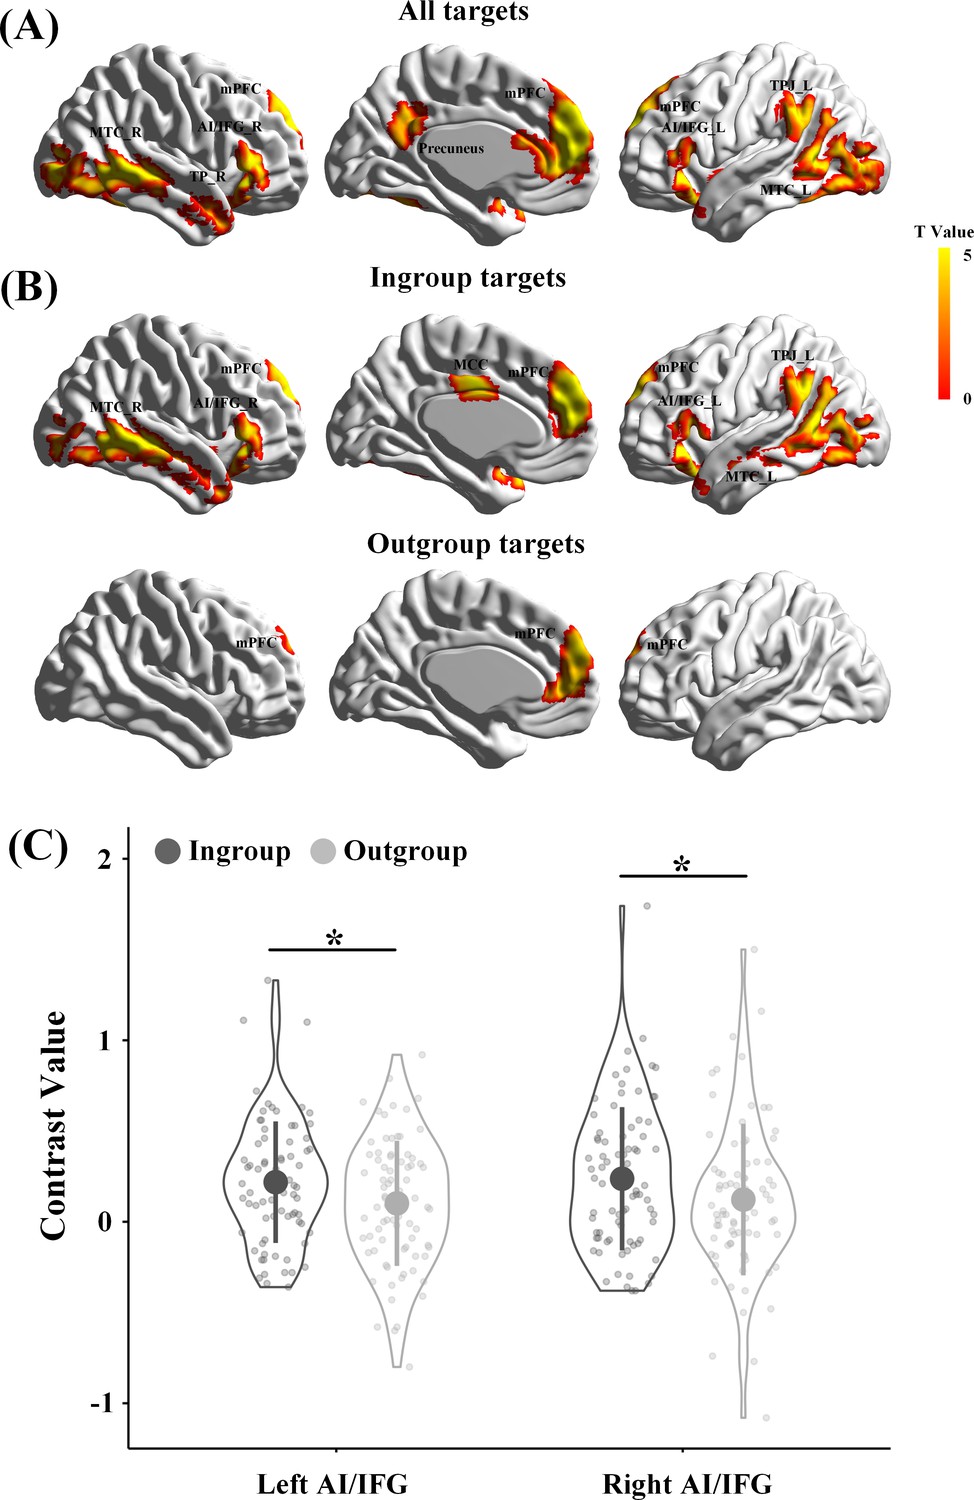
Brain activities in response to painful vs neutral expressions.
(A) Illustrations of brain responses to painful vs. neutral expressions of all targets perceived during scanning across all participants from Revenge and Control groups and collapsing involved and uninvolved targets. (B) Illustrations of brain responses to painful vs. neutral expressions of ingroup targets and outgroup targets across all participants. (C) The contrast values of neural responses to painful (vs. neutral) expressions in the left and right AI/IFG. Shown are group means (big dots), SD (bars), measures of each individual (small dots), and distribution (violin shape). mPFC, medial prefrontal cortex; MCC, midcingulate cortex; MTC, middle temporal cortex; AI/IFG, anterior insula and inferior frontal cortex; TPJ, temporoparietal junction; TP, temporal pole.
-
Figure 4—source data 1
Source data for Figure 4A.
- https://cdn.elifesciences.org/articles/52014/elife-52014-fig4-data1-v2.csv
-
Figure 4—source data 2
Source data for Figure 4B _Ingroup.
- https://cdn.elifesciences.org/articles/52014/elife-52014-fig4-data2-v2.zip
-
Figure 4—source data 3
Source data for Figure 4B _Outgroup.
- https://cdn.elifesciences.org/articles/52014/elife-52014-fig4-data3-v2.zip
-
Figure 4—source data 4
Source data for Figure 4C.
- https://cdn.elifesciences.org/articles/52014/elife-52014-fig4-data4-v2.zip
Figure 4—figure supplement 1
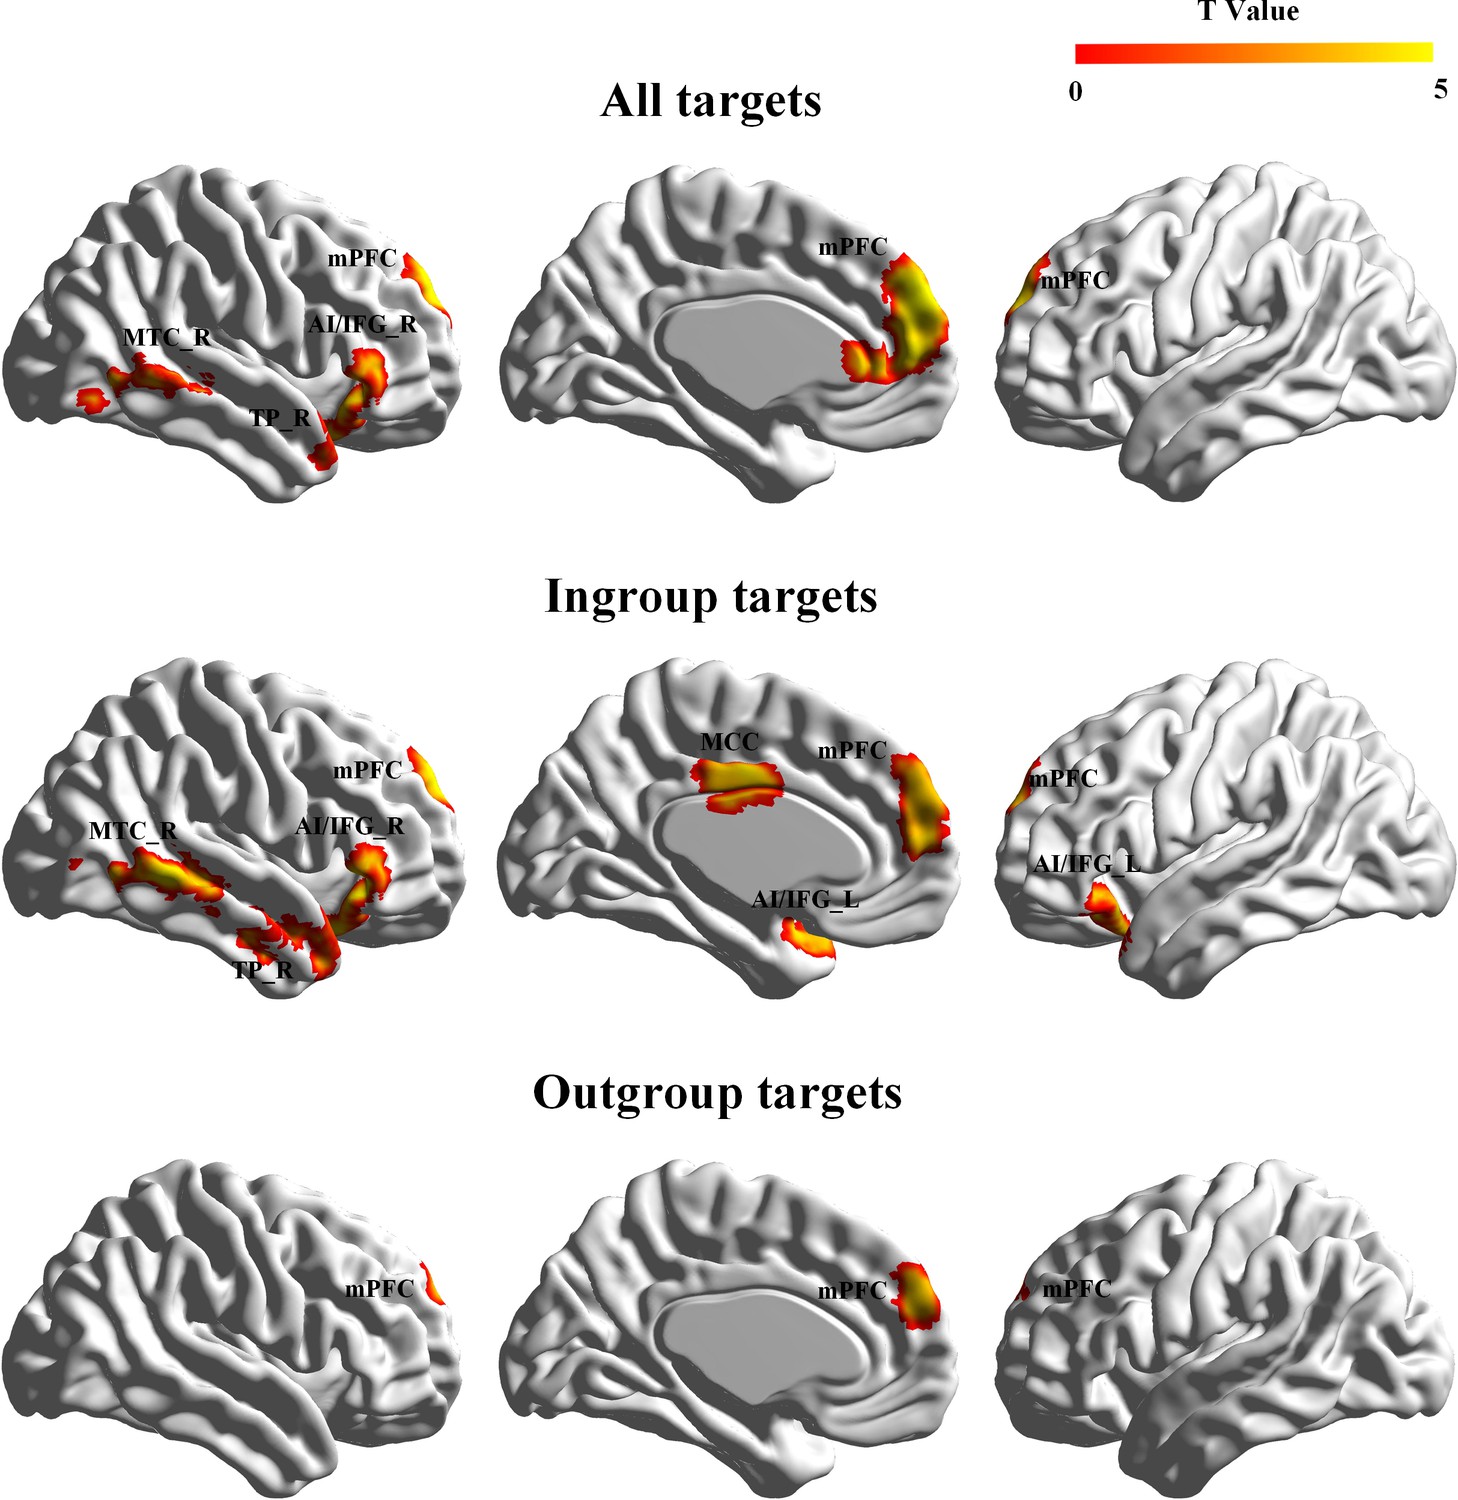
Illustrations of brain responses to painful vs. neutral expressions across participants and collapsed involved and uninvolved targets in the Revenge group (a voxel level threshold p<0.001, uncorrected and a cluster level threshold of p<0.05, FWE corrected).
Activations in response to images of all targets, ingroup targets, and outgroup targets are shown separately. mPFC, medial prefrontal cortex; MCC, midcingulate cortex; MTC, middle temporal cortex; AI/IFG, anterior insula and inferior frontal cortex; TP, temporal pole.
Figure 4—figure supplement 2
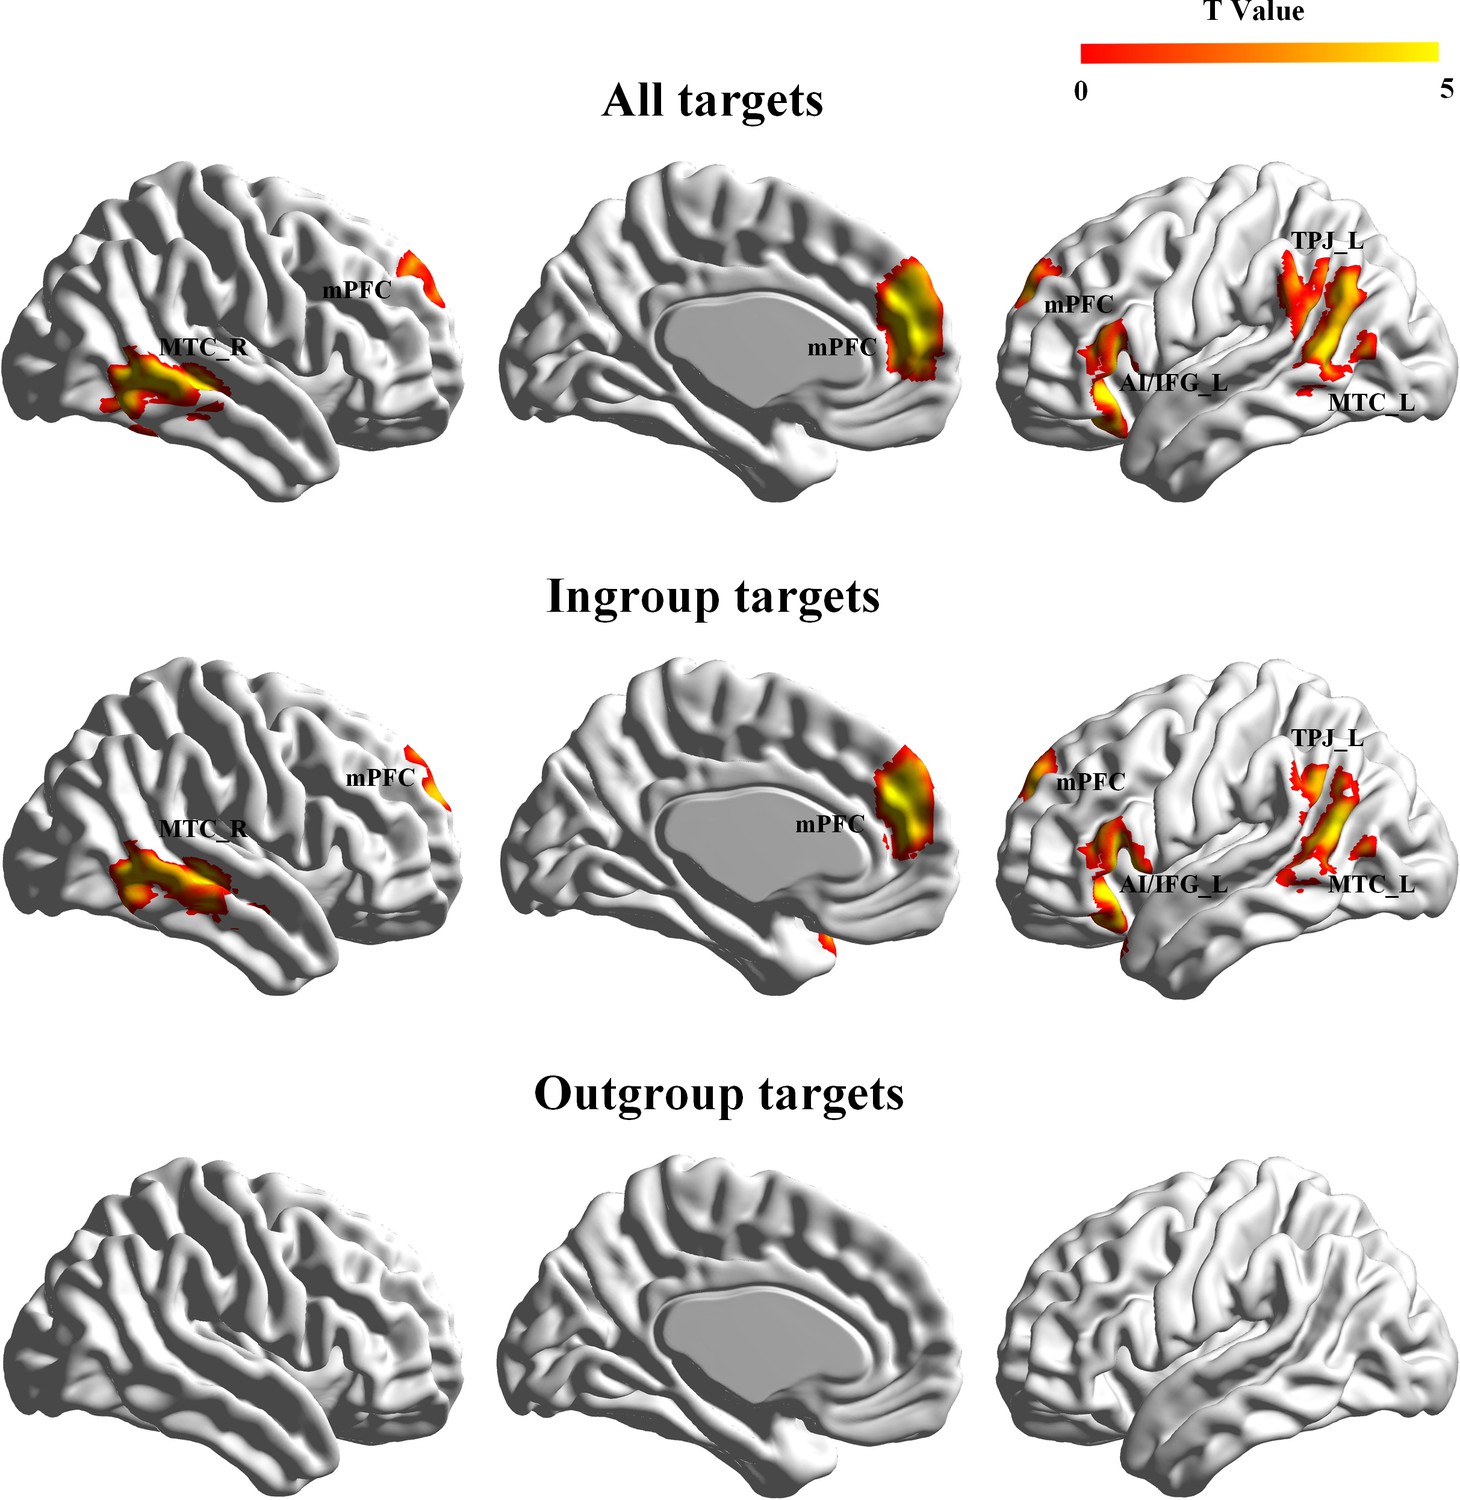
Illustration of brain responses to painful vs. neutral expressions across participants and collapsed involved and uninvolved targets in the Control group (a voxel level threshold p<0.001, uncorrected and a cluster level threshold of p<0.05, FWE corrected).
Activations in response to images of all targets, ingroup targets, and outgroup targets are shown separately. mPFC, medial prefrontal cortex; MCC, midcingulate cortex; MTC, middle temporal cortex; AI/IFG, anterior insula and inferior frontal cortex; TPJ, temporoparietal junction.
Figure 5
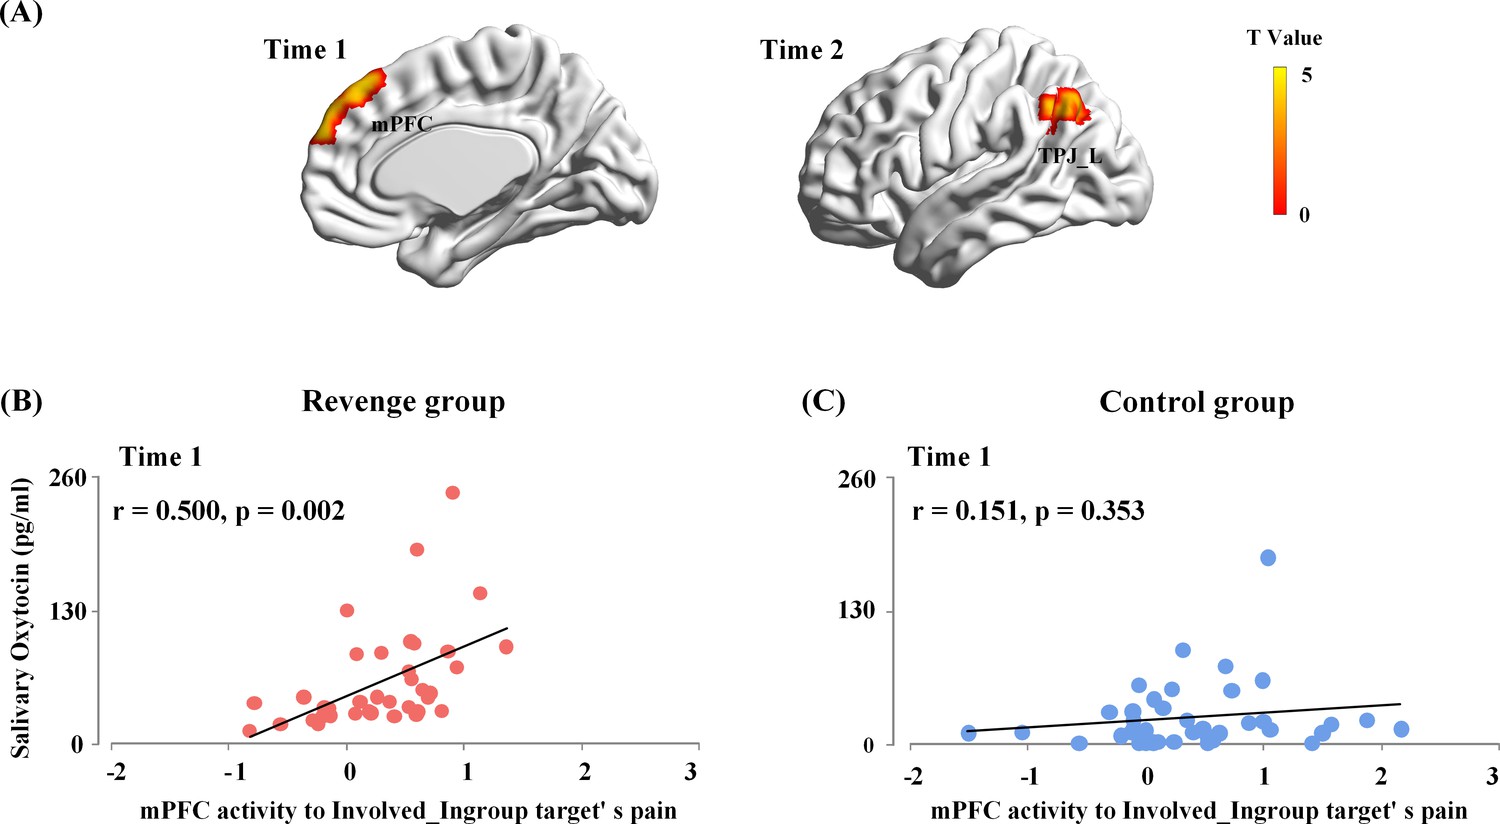
Associations between endogenous OT and brain activity in response to others’ suffering.
(A) The mPFC activity to Involved_Ingroup target's pain associated with the endogenous OT at Time-1 in the Revenge group. The OT level at Time-2 reliably predicted the left TPJ activities in response to the Involved_Ingroup target's pain in the Revenge group. A voxel-level threshold of p<0.001 and a cluster-level threshold of p<0.05, FWE corrected, was used to identify and to visualize brain activations. (B) The associations between endogenous OT-levels at Time-1 with the mPFC activity in response to the Involved_Ingroup target's pain for the Revenge group. (C) No significant correlation between endogenous OT-levels and the mPFC activity in response to Involved_Ingroup target's pain was found for the Control group. Note: the results of the moderation analysis indicate a significant group difference in the association between endogenous OT-levels at Time-1 and the mPFC activity in response to Involved_Ingroup target's pain.
-
Figure 5—source data 1
Source data for Figure 5A _Time 1.
- https://cdn.elifesciences.org/articles/52014/elife-52014-fig5-data1-v2.zip
-
Figure 5—source data 2
Source data for Figure 5A _Time 2.
- https://cdn.elifesciences.org/articles/52014/elife-52014-fig5-data2-v2.zip
-
Figure 5—source data 3
Source data for Figure 5B.
- https://cdn.elifesciences.org/articles/52014/elife-52014-fig5-data3-v2.csv
-
Figure 5—source data 4
Source data for Figure 5C.
- https://cdn.elifesciences.org/articles/52014/elife-52014-fig5-data4-v2.csv
Figure 6
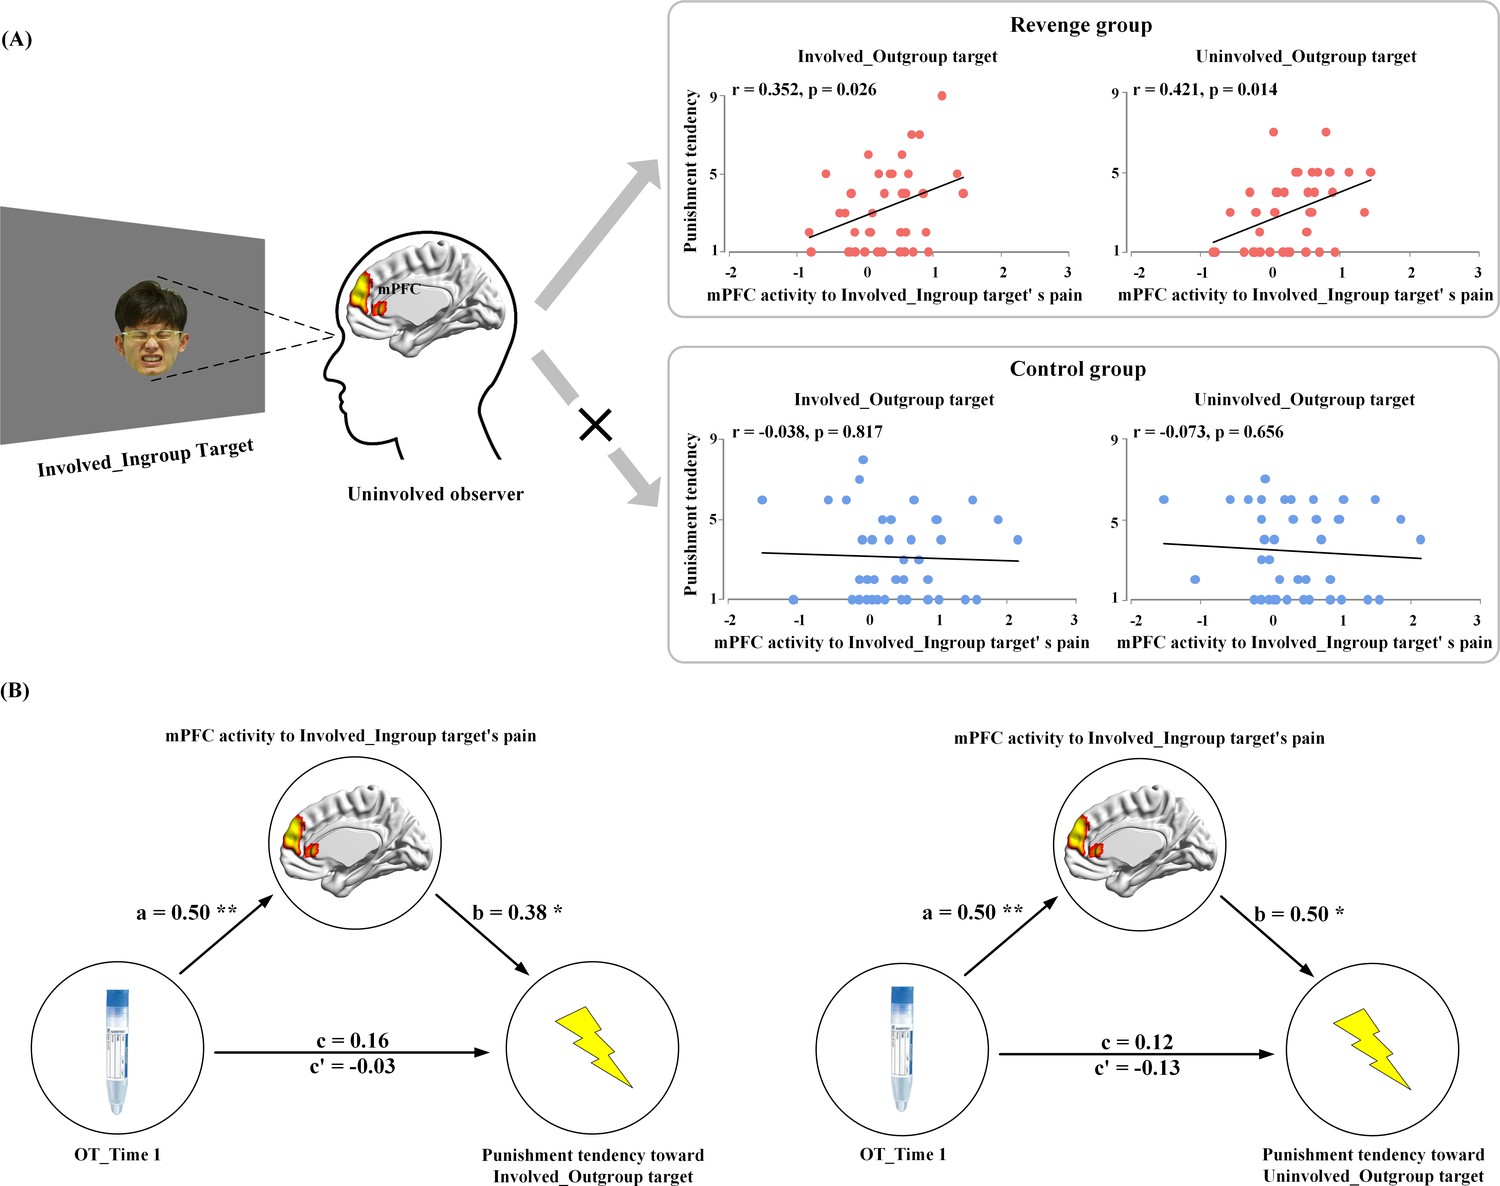
Results of brain-propensity associations and mediation analyses.
(A) Brain-propensity associations in the Revenge group. The mPFC activity in response to Involved_Ingroup target's pain in an uninvolved observer from the Revenge (but not the Control) group predicted his punishment tendencies toward both Involved_Outgroup and Uninvolved_Outgroup targets. (B) The mPFC mediation of endogenous OT and punishment tendencies. The mPFC activity to Involved_Ingroup targets' pain mediates the relationship between the salivary level of endogenous OT at Time-1 and punishment tendencies toward Involved_Outgroup targets (left) and Uninvolved_Outgroup targets (right). mPFC mediation of association between endogenous OT and outgroup punishment.
-
Figure 6—source data 1
Source data for Figure 6A.
- https://cdn.elifesciences.org/articles/52014/elife-52014-fig6-data1-v2.csv
Tables
Table 1
Salivary OT levels (pg/ml) across three time points and the results of simple effect analyses.
| Revenge (mean ± SD) | Control (mean ± SD) | F | p | η2p | |
|---|---|---|---|---|---|
| OT at Time-1 | 60.40 ± 49.25 | 24.68 ± 32.46 | 10.54 | 0.002 | 0.136 |
| OT at Time-2 | 106.19 ± 61.52 | 47.42 ± 40.83 | 22.90 | <0.001 | 0.255 |
| OT at Time-3 | 60.96 ± 51.92 | 21.72 ± 24.87 | 16.47 | <0.001 | 0.197 |
Additional files
-
Source code 1
Scripts for the Bootstrap analysis of OT levels in Figure 3B.
- https://cdn.elifesciences.org/articles/52014/elife-52014-code1-v2.m
-
Source code 2
Scripts for the whole-brain analysis in Figure 4A.
- https://cdn.elifesciences.org/articles/52014/elife-52014-code2-v2.m
-
Source code 3
Scripts for the whole-brain analysis in Figure 4B _Ingroup.
- https://cdn.elifesciences.org/articles/52014/elife-52014-code3-v2.m
-
Source code 4
Scripts for the whole-brain analysis in Figure 4B _Outgroup.
- https://cdn.elifesciences.org/articles/52014/elife-52014-code4-v2.m
-
Source code 5
Scripts for the whole-brain regression analysis _Time 1.
- https://cdn.elifesciences.org/articles/52014/elife-52014-code5-v2.m
-
Source code 6
Scripts for the whole-brain regression analysis _Time 2.
- https://cdn.elifesciences.org/articles/52014/elife-52014-code6-v2.m
-
Supplementary file 1
Demographic information and psychological traits of the participants in the fMRI experiment.
This file shows the means (SD) and statistics for comparisons between the Revenge and Control groups.
- https://cdn.elifesciences.org/articles/52014/elife-52014-supp1-v2.docx
-
Supplementary file 2
Results of group manipulation check.
This file shows the means (and SD) of emotions and attitudes and statistics for comparisons between the Revenge and Control groups.
- https://cdn.elifesciences.org/articles/52014/elife-52014-supp2-v2.docx
-
Supplementary file 3
Factorial models of emotion and attitude rating items.
This files shows the results of a factorial analysis that tested the discriminant validity of the eight items related to measures of emotions and attitudes. The analysis revealed two factors, which explained 62.60% of total variance. Factor one was the emotion factor (explaining 37.65% of variance), which included five items: empathy (0.653), unpleasant (0.906), anger (0.748), fear (0.837), and schadenfreude (–0.349). Factor 2 was the attitude factor (explaining 24.95% of variance), which included two items: likability (0.907) and trust (0.918).
- https://cdn.elifesciences.org/articles/52014/elife-52014-supp3-v2.docx
-
Supplementary file 4
Brain activations elicited by painful vs. neutral expressions across the Revenge and Control groups.
This file shows the MNI coordinates of activated brain regions, cluster sizes, and Z values.
- https://cdn.elifesciences.org/articles/52014/elife-52014-supp4-v2.docx
-
Supplementary file 5
Brain activations elicited by painful vs. neutral expressions in the Revenge group.
This file shows the MNI coordinates of activated brain regions, cluster sizes, and Z values.
- https://cdn.elifesciences.org/articles/52014/elife-52014-supp5-v2.docx
-
Supplementary file 6
Brain activations elicited by painful vs. neutral expressions in the Control group.
This file shows the MNI coordinates of activated brain regions, cluster sizes, and Z values.
- https://cdn.elifesciences.org/articles/52014/elife-52014-supp6-v2.docx
-
Supplementary file 7
The results of the moderation analysis.
This file shows the statistical details of the moderation analysis that examined how group identity (Revenge vs. Control group) moderated the relationship between endogenous OT (Time-1) and mPFC activity in response to Involved_Ingroup target's pain.
- https://cdn.elifesciences.org/articles/52014/elife-52014-supp7-v2.docx
-
Supplementary file 8
The results of the mediation analysis.
This file shows the statistical details of the moderation analysis that examined whether the mPFC activity mediated the relationship between endogenous OT (Time-1) and punishment tendencies towards the Involved_Outgroup target.
- https://cdn.elifesciences.org/articles/52014/elife-52014-supp8-v2.docx
-
Supplementary file 9
The results of the mediation analysis.
This file shows the statistical details of the moderation analysis that examined whether the mPFC activity mediated the relationship between endogenous OT (Time-1) and punishment tendencies towards the Uninvolved_Outgroup target.
- https://cdn.elifesciences.org/articles/52014/elife-52014-supp9-v2.docx
-
Supplementary file 10
Demographic information and psychological traits of the participants in the new behavioral experiment.
This file shows the means (SD) and statistics for comparisons between the Revenge and Control groups.
- https://cdn.elifesciences.org/articles/52014/elife-52014-supp10-v2.docx
-
Supplementary file 11
Ingroup favoritism in self-report of emotions, attitudes, punishment tendencies, and punishment decisions in the new behavioral experiment.
This file shows the means (SD) and statistics for comparisons between the Revenge and Control groups.
- https://cdn.elifesciences.org/articles/52014/elife-52014-supp11-v2.docx
-
Transparent reporting form
- https://cdn.elifesciences.org/articles/52014/elife-52014-transrepform-v2.docx
Download links
A two-part list of links to download the article, or parts of the article, in various formats.
Downloads (link to download the article as PDF)
Open citations (links to open the citations from this article in various online reference manager services)
Cite this article (links to download the citations from this article in formats compatible with various reference manager tools)
A neurobiological association of revenge propensity during intergroup conflict
eLife 9:e52014.
https://doi.org/10.7554/eLife.52014


