In vivo single-cell lineage tracing in zebrafish using high-resolution infrared laser-mediated gene induction microscopy
- The Hong Kong University of Science and Technology, China
- South China University of Technology, China
Figures
Figure 1 with 2 supplements

IR-LEGO heat-shock microscopy and fluorescent thermometry.
(A) Schematic diagram of the integrated heat-shock microscope system and fluorescent thermometry. A 1,342 nm continuous-wave (CW) IR laser was used for localized heat shock, and a femtosecond laser was used for TPEF imaging and spectroscopy. The femtosecond laser and CW laser beams were individually controlled by two pairs of galvanometer scanners. DM: dichroic mirror; PMT: photomultiplier tube; FM: foldable mirror; SP: short-pass filter; FB: fiber bundle; EMCCD: electron multiplying charge-coupled device; L1-L6: relay lens; SHG: second harmonic generation signals. (B, C) TPEF spectra of TAMRA and FITC at different temperatures, respectively. (D) Calibration of temperature sensitivity: fluorescence intensity ratio (TAMRA/FITC) as a function of temperature in water, 3% agarose (tissue phantom) and zebrafish muscle in vivo. (E) Representative results of measured temperature vs. actual temperature in 3% agarose. Slope of linear fitting: 0.998.
Figure 1—figure supplement 1
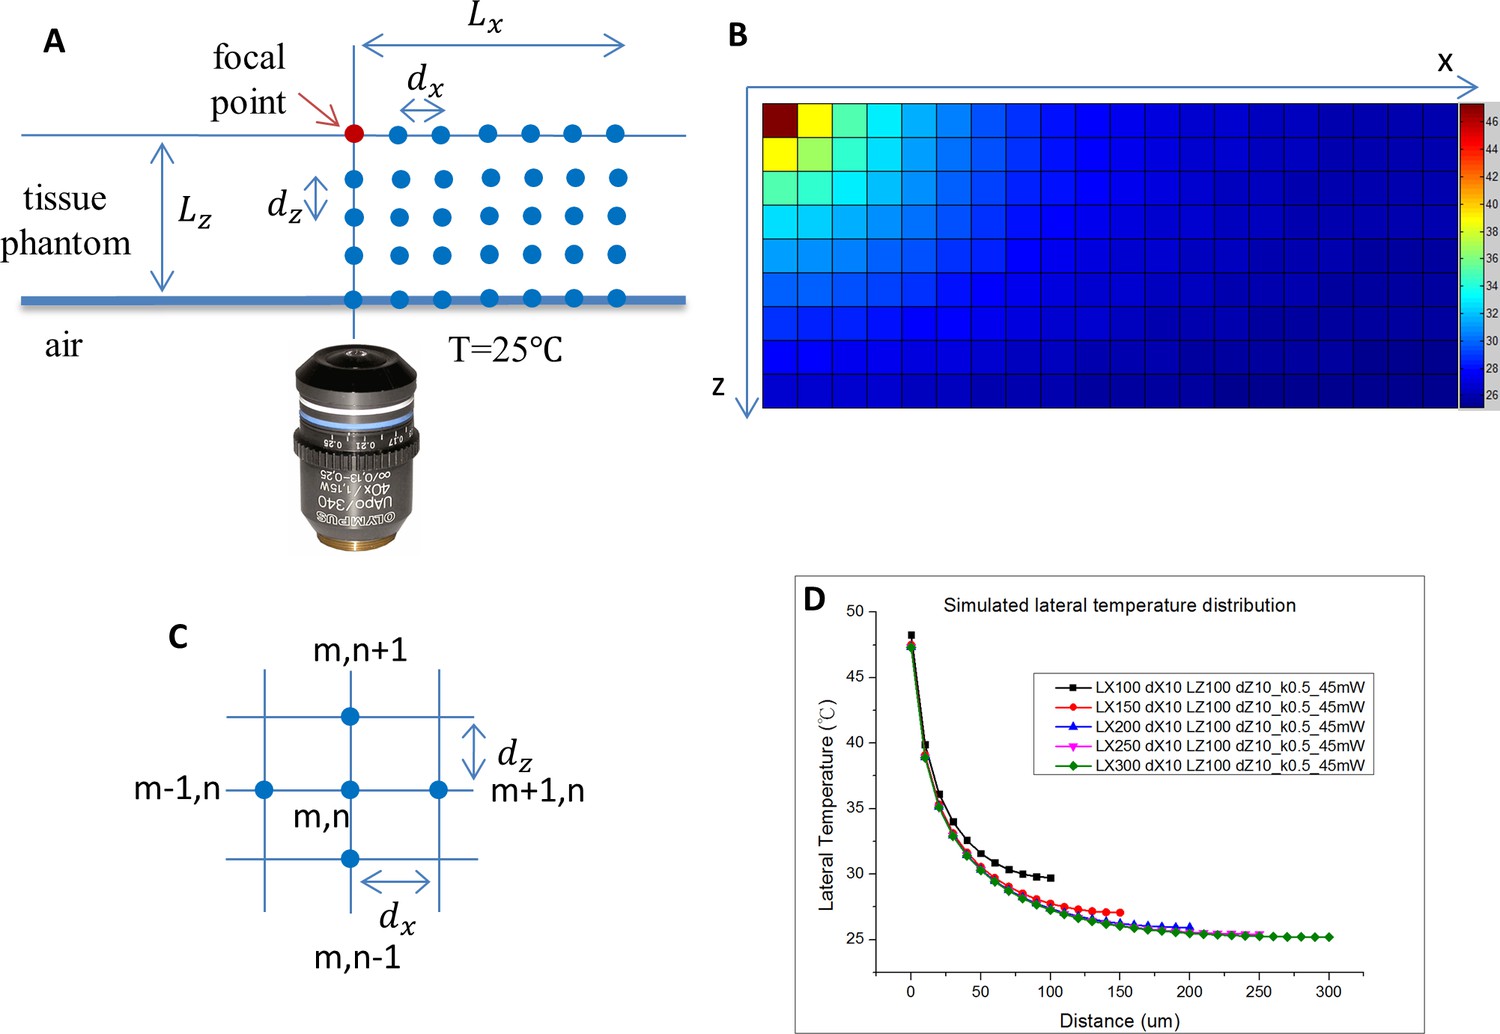
Simulation of heat diffusion from a point-heating source.
(A) Finite–difference simulation model of point heating produced by a highly focused IR laser. In the numerical analysis, the laser heating is simplified as a point heat source at the focal point of the IR laser. The dimensions of the simulated tissue in the lateral and axial directions are Lx and Lz, with unit intervals of dx and dz respectively. (B) Simulated two-dimensional temperature distribution of the tissue model in a steady state using the finite-difference method (Lx = 200 µm, Lz = 90 µm, dx = dz = 10 µm). (C) Two-dimensional node model of the finite-difference numerical method. The temperature at the central node (m, n) is determined by the temperature of the four surrounding nodes. (D) Simulation results of the lateral temperature distribution with different lateral distances Lx. The Lx value is associated with the approximation at the boundary nodes and thus influences the simulated temperature distribution. When Lx is larger than 200 µm, the simulated temperature distributions are no longer significantly affected by the boundary conditions.
Figure 1—figure supplement 2
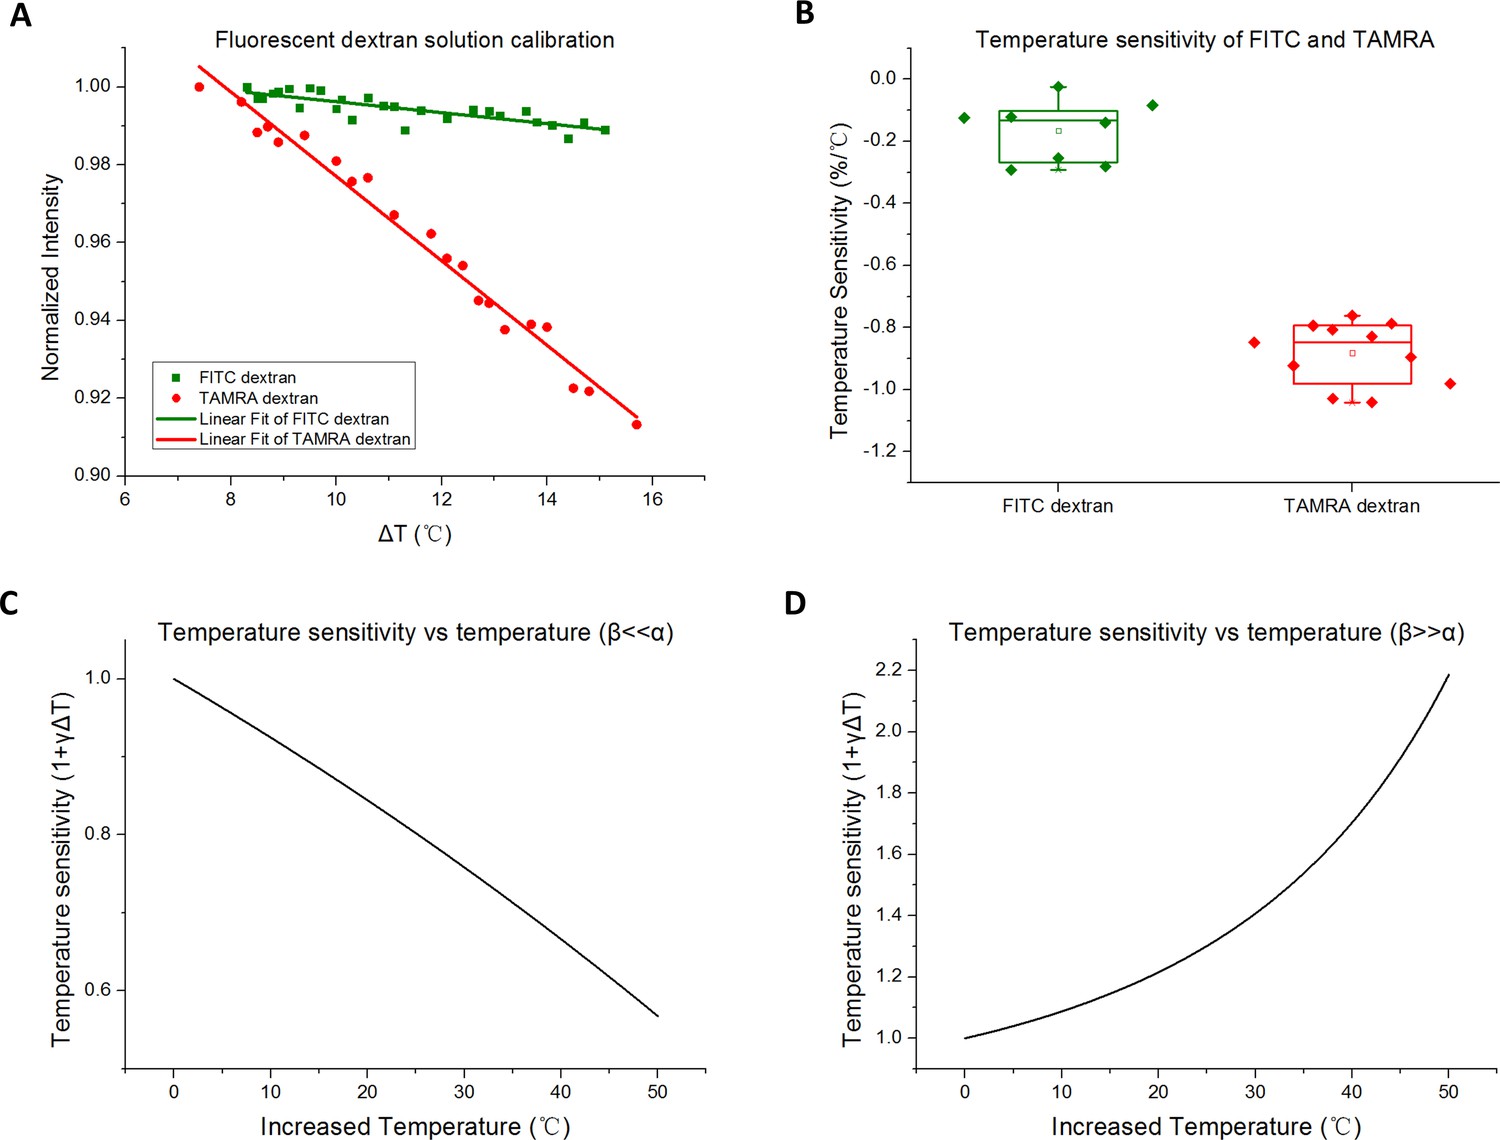
Temperature sensitivity of fluorescent thermometry.
(A) Calibration of temperature sensitivity of FITC and TAMRA: fluorescence intensity as a function of temperature in water solution. (B) Statistics of temperature sensitivities of FITC and TAMRA fluorescence. (C) In the theoretical model, the fluorescence intensity ratio of TAMRA/FITC (β << α) decreases almost linearly as the environmental temperature increases. (D) In the theoretical model, the fluorescence intensity ratio of FITC/TAMRA (β >> α) increases nonlinearly as the environmental temperature increases. Therefore, linear fitting is applied for the temperature sensitivity calibration of the ratio of TAMRA/FITC, instead of FITC/TAMRA.
-
Figure 1—figure supplement 2—source data 1
Statistics of temperature sensitivities of FITC and TAMRA fluorescence.
- https://cdn.elifesciences.org/articles/52024/elife-52024-fig1-figsupp2-data1-v2.xlsx
Figure 2 with 4 supplements
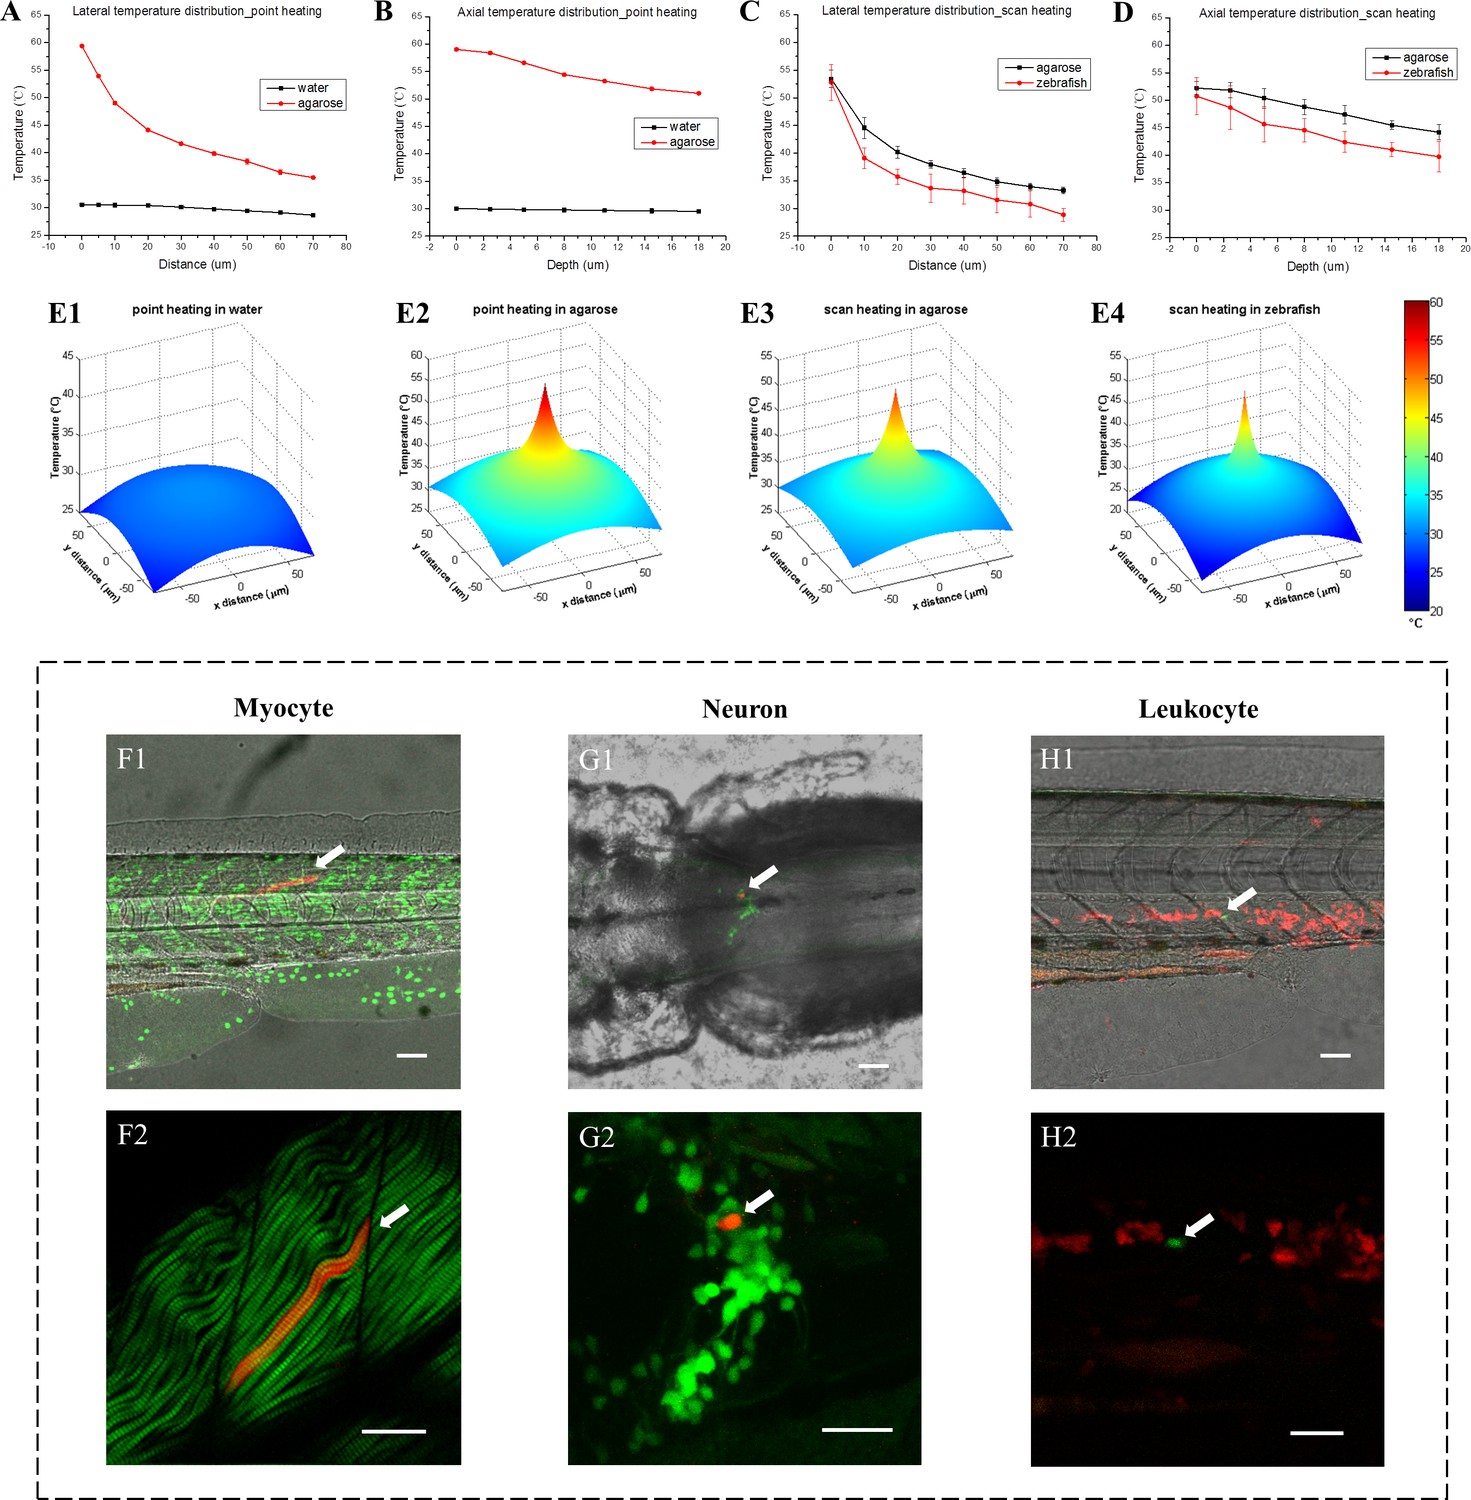
3D temperature distribution measured through fluorescent thermometry and single-cell gene induction in zebrafish.
(A) Lateral temperature distributions with IR laser heating in water and 3% agarose (95 mW IR laser was focused in samples for point heating). (B) Corresponding axial temperature distributions in water and 3% agarose. (C) Lateral temperature distributions with IR laser scan heating in 3% agarose and zebrafish muscle in vivo (95 mW IR laser was scanned in an 8 µm × 8 µm region during heating to avoid tissue injury). (D) Corresponding axial temperature distributions in 3% agarose and zebrafish muscle in vivo. Each statistical distribution curve in (A–D) is shown in terms of the mean with the standard deviation over more than five measurements. (E1–E4) 3D view of lateral temperature distributions with IR laser point and scan heating in water, 3% agarose and zebrafish muscle, respectively. (F1) A merged image of bright-field (gray) middle trunk, Dendra2-labeled nuclei (green) and a single myocyte expressing DsRedx via heat shock gene induction (red) in a one dpf zebrafish. (F2) A merged image of second harmonic generation (SHG) of muscle fibers (green) and the single myocyte expressing DsRedx (red). (G1) A merged image of bright-field (gray) hindbrain, GFP-labeled tyrosine hydroxylase-positive (th-positive) neurons (green) and a single neuron expressing DsRedx via heat shock gene induction (red) in a three dpf zebrafish. (G2) An enlarged image of (G1) with GFP and DsRedx-labeled neurons (by maximum projections). (H1) A merged image of bright-field (gray) middle trunk, DsRedx-labeled leukocytes (red) and a single cell expressing GFP via heat shock gene induction (green) in a two dpf zebrafish. (H2) An enlarged image of (H1) with merged DsRedx and GFP-labeled leukocytes. Arrows in (F–H): heat-shock labeled single myocyte, neuron and leukocyte, respectively. Scale bars: 50 µm (F1–H1); 30 µm (F2–H2).
-
Figure 2—source data 1
3D temperature distribution in water, tissue phantom and zebrafish during IR laser heat shock.
- https://cdn.elifesciences.org/articles/52024/elife-52024-fig2-data1-v2.xlsx
Figure 2—figure supplement 1
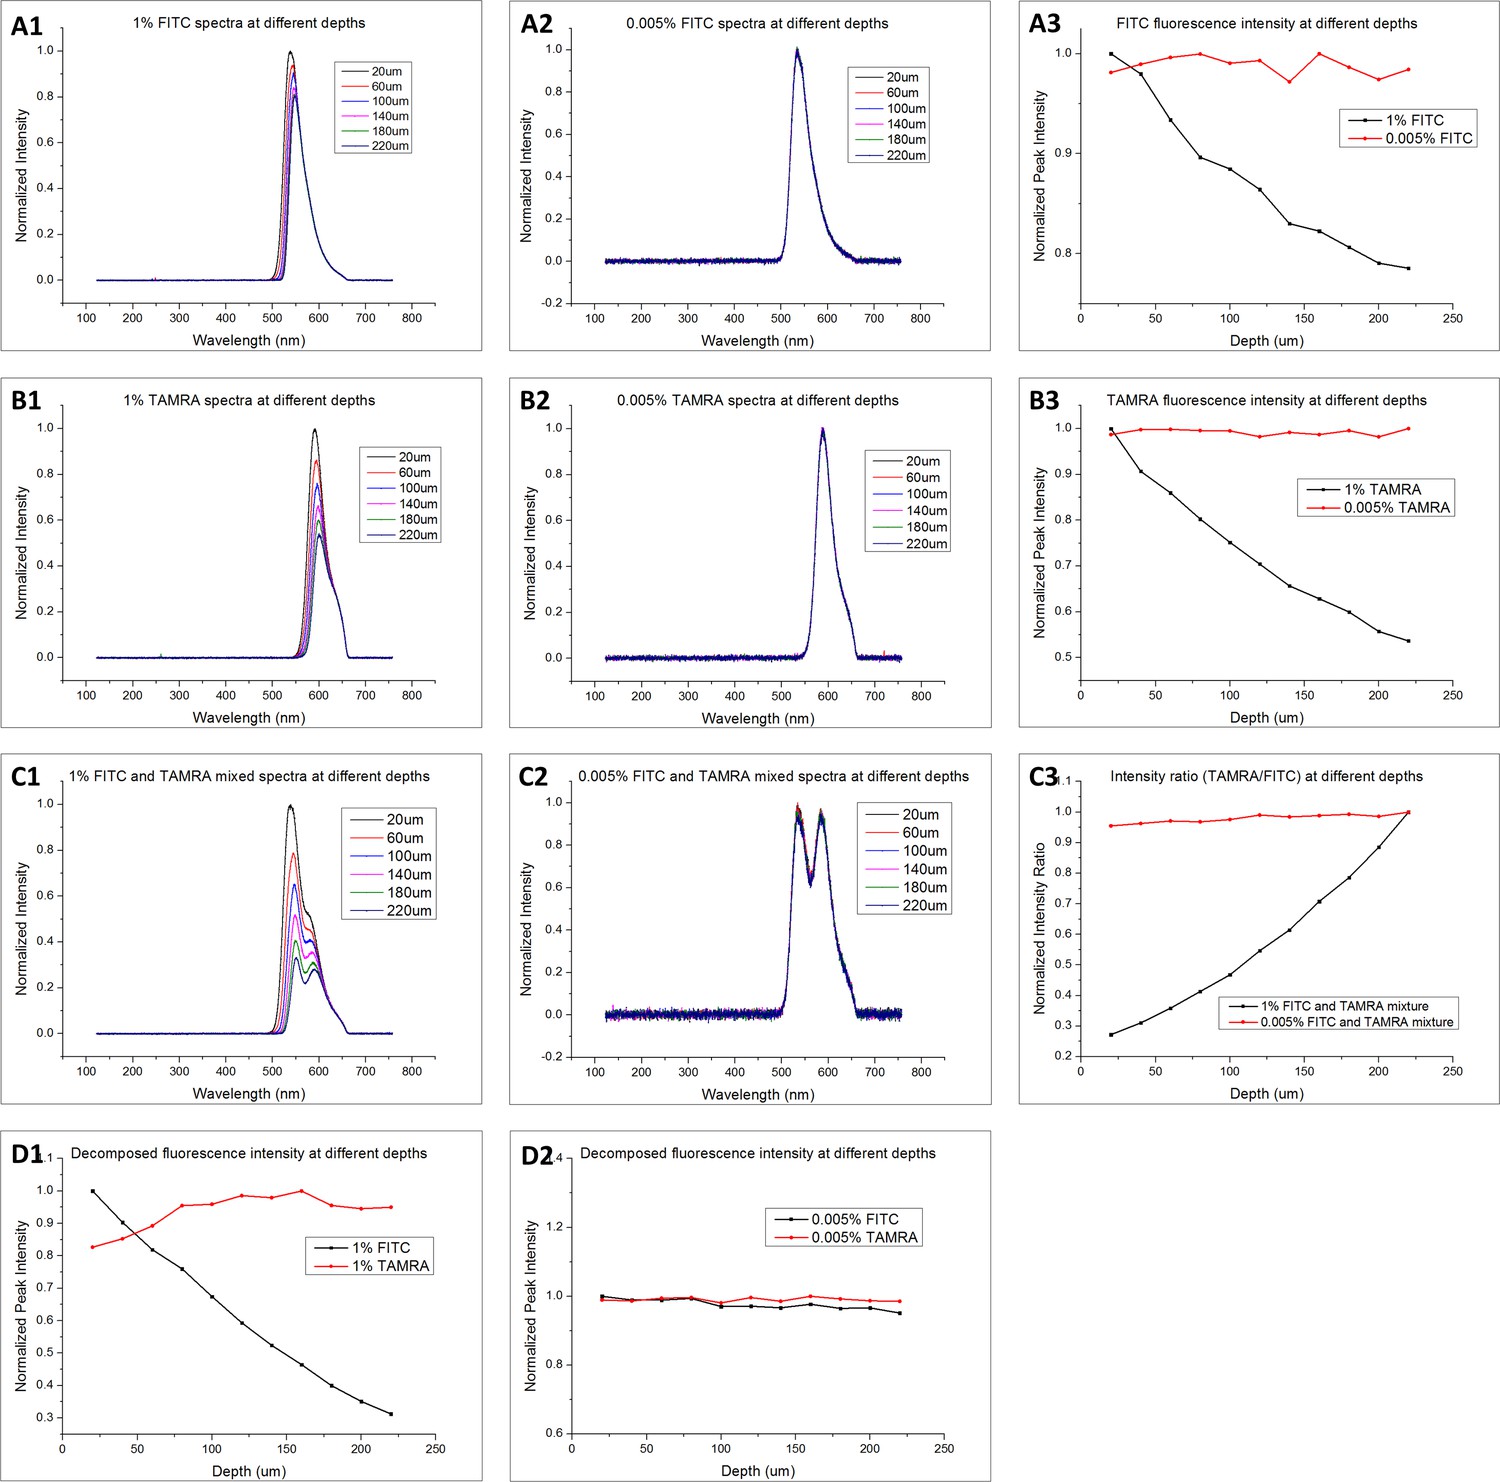
Self-absorption and FRET of FITC and TAMRA.
(A1–A2) Fluorescence spectra of 1% and 0.005% FITC solution measured at different depths, respectively. (A3) Normalized fluorescence intensity of FITC solutions at different depths. (B1–B2) Fluorescence spectra of 1% and 0.005% TAMRA solutions measured at different depths, respectively. (B3) Normalized fluorescence intensity of TAMRA solutions at different depths. (C1–C2) Fluorescence spectra of 1% and 0.005% FITC-TAMRA mixture solution measured at different depths, respectively. (C3) Normalized fluorescence intensity ratio (TAMRA/FITC) of FITC-TAMRA mixture solutions at different depths. (D1) Normalized fluorescence intensity of FITC and TAMRA decomposed from 1% mixture solution at different depths. (D2) Normalized fluorescence intensity of FITC and TAMRA decomposed from 0.005% mixture solution at different depths. The self-absorption and FRET become negligible at a low concentration (0.005%) of FITC-TAMRA mixture solution.
Figure 2—figure supplement 2
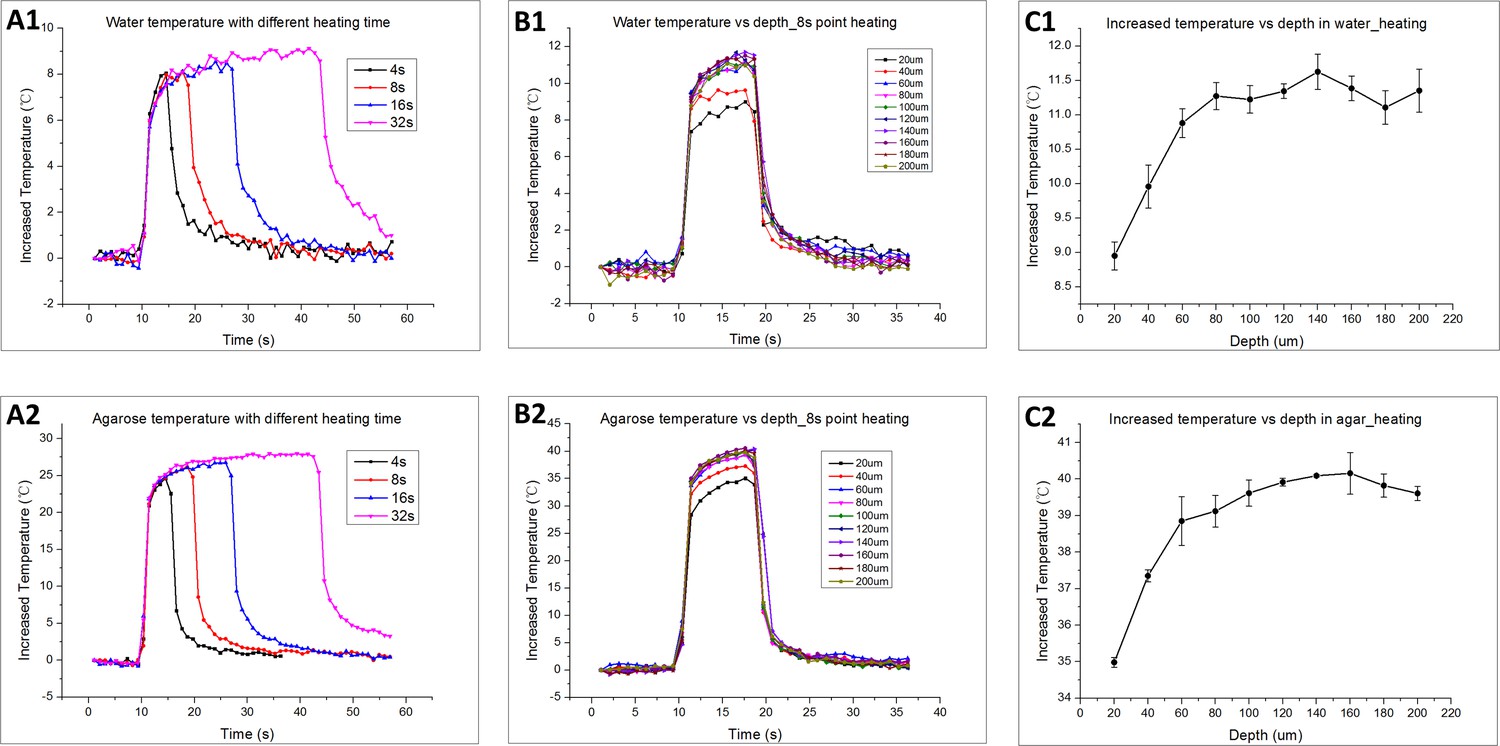
Temperature rise measured at focal point of IR laser under different heating conditions.
(A1–A2) Dynamic temperature profile with IR laser heating at the same depth (100 µm) for different durations (4 s, 8 s, 16 s, 32 s) in water and 3% agarose, respectively. The local temperature changed quickly when the IR laser was turned on and off. (B1–B2) Dynamic temperature profile with IR laser heating over 8 s at different depths in water and 3% agarose respectively. (C1–C2) Maximal temperature rise with IR laser heating over 8 s at different depths in water and 3% agarose, respectively. Lower temperature at depths of less than 100 µm was caused by the convection at interface of media.
Figure 2—figure supplement 3
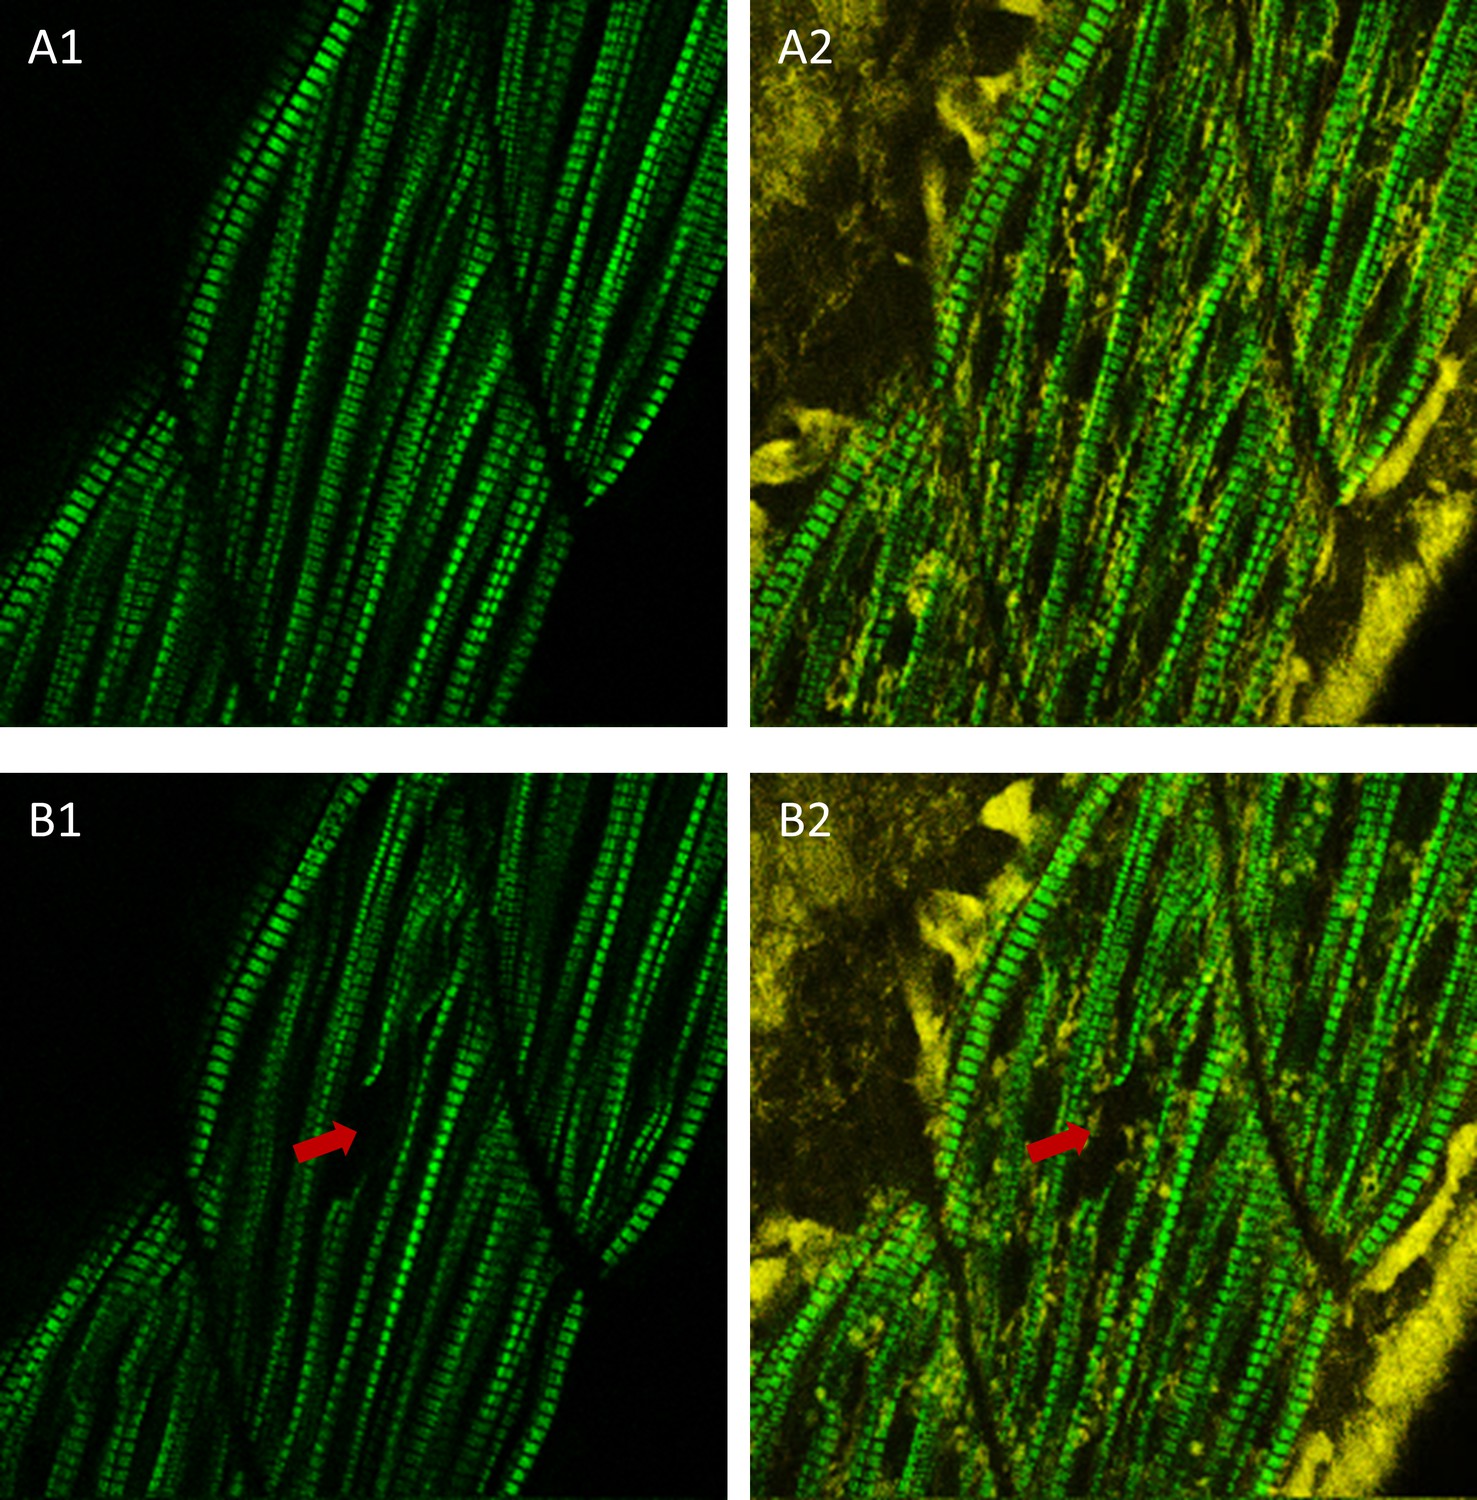
Laser-induced injury in zebrafish muscle.
(A1) SHG image of zebrafish muscle before laser heating. (A2) Merged image of SHG and reduced nicotinamide-adenine dinucleotide (NADH) autofluorescence signals of zebrafish muscle before laser heating. (B1) SHG image of zebrafish muscle after focusing 85 mW IR laser to a single fiber for heating over 3 s. (B2) Merged image of SHG and NADH autofluorescence signals of zebrafish muscle after IR laser heating. The arrows in (B) indicate the laser heating point, where the sarcomere structure disappeared, indicating that muscle fiber was injured. To optimize the heat shock gene induction and avoid cell damage, scan heating should be performed for in vivo heat shock in zebrafish. The field of view of (A) and (B): 100 µm × 100 µm.
Figure 2—figure supplement 4
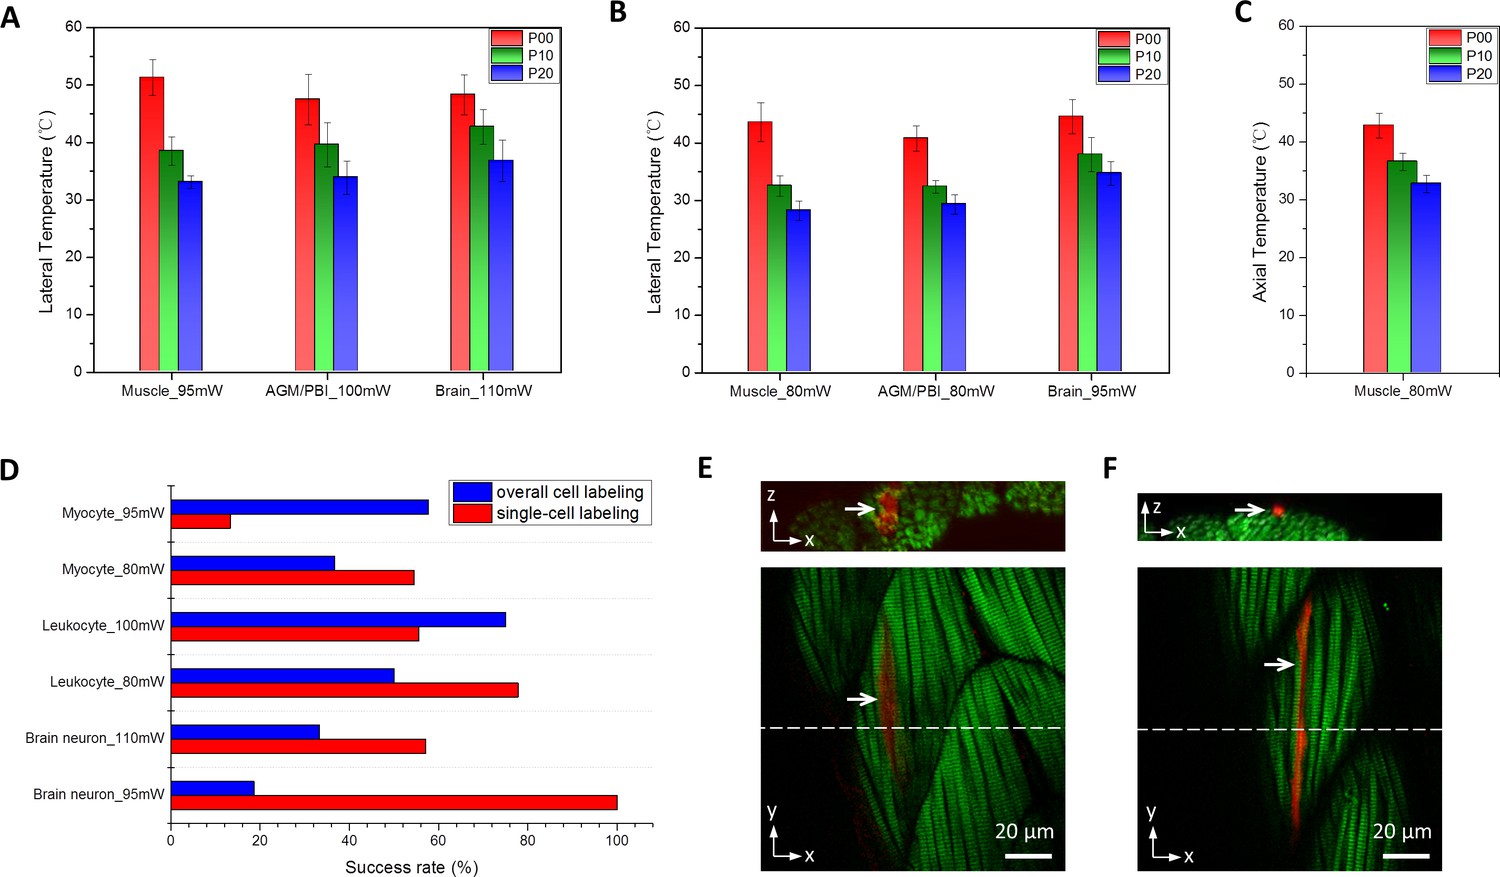
Temperature distribution measurement and efficiency of single-cell labeling in different tissues of zebrafish.
(A–B) In vivo measured temperature distributions under different heat shock conditions in three different tissues, including muscle, hematopoietic tissue at the AGM and PBI, and brain. P00, P10 and P20: positions at 0 µm, 10 µm and 20 µm away from the IR laser heating center in the XY plane, respectively. (C) In vivo measured temperature distribution along Z axis in muscle under low power heat shock condition. P00, P10 and P20: positions at 0 µm, 10 µm and 20 µm away from the IR laser heating center in the Z axis, respectively. The temperature gradient along Z axis is smaller than that in the XY plane. Each statistical bar in (A–C) is shown in terms of mean with standard deviation over more than ten measurements. (D) Efficiency of overall cell labeling (blue) and single-cell labeling (red) within myocytes, leukocytes at AGM/PBI, and brain neurons with different heat shock conditions. In the three tested tissues, single cell of myocyte, coro1a+ leukocyte and neuron are heat shocked by IR-LEGO system, respectively. The number of zebrafish collected for each statistical bar is provided in Supplementary file 1b. (E–F) Representative images of muscle fibers (SHG, green) with multiple (E) or single (F) myocyte labeled (DsRedx, red). The Z stack image in (E) shows that the myocytes along z axis are more likely to be labeled due to the smaller temperature gradient in axial direction.
-
Figure 2—figure supplement 4—source data 1
Temperature distributions under different heat shock conditions in three different tissues of zebrafish.
- https://cdn.elifesciences.org/articles/52024/elife-52024-fig2-figsupp4-data1-v2.xlsx
Figure 3 with 3 supplements
The high-precision IR-LEGO-mediated single HE lineage tracing.
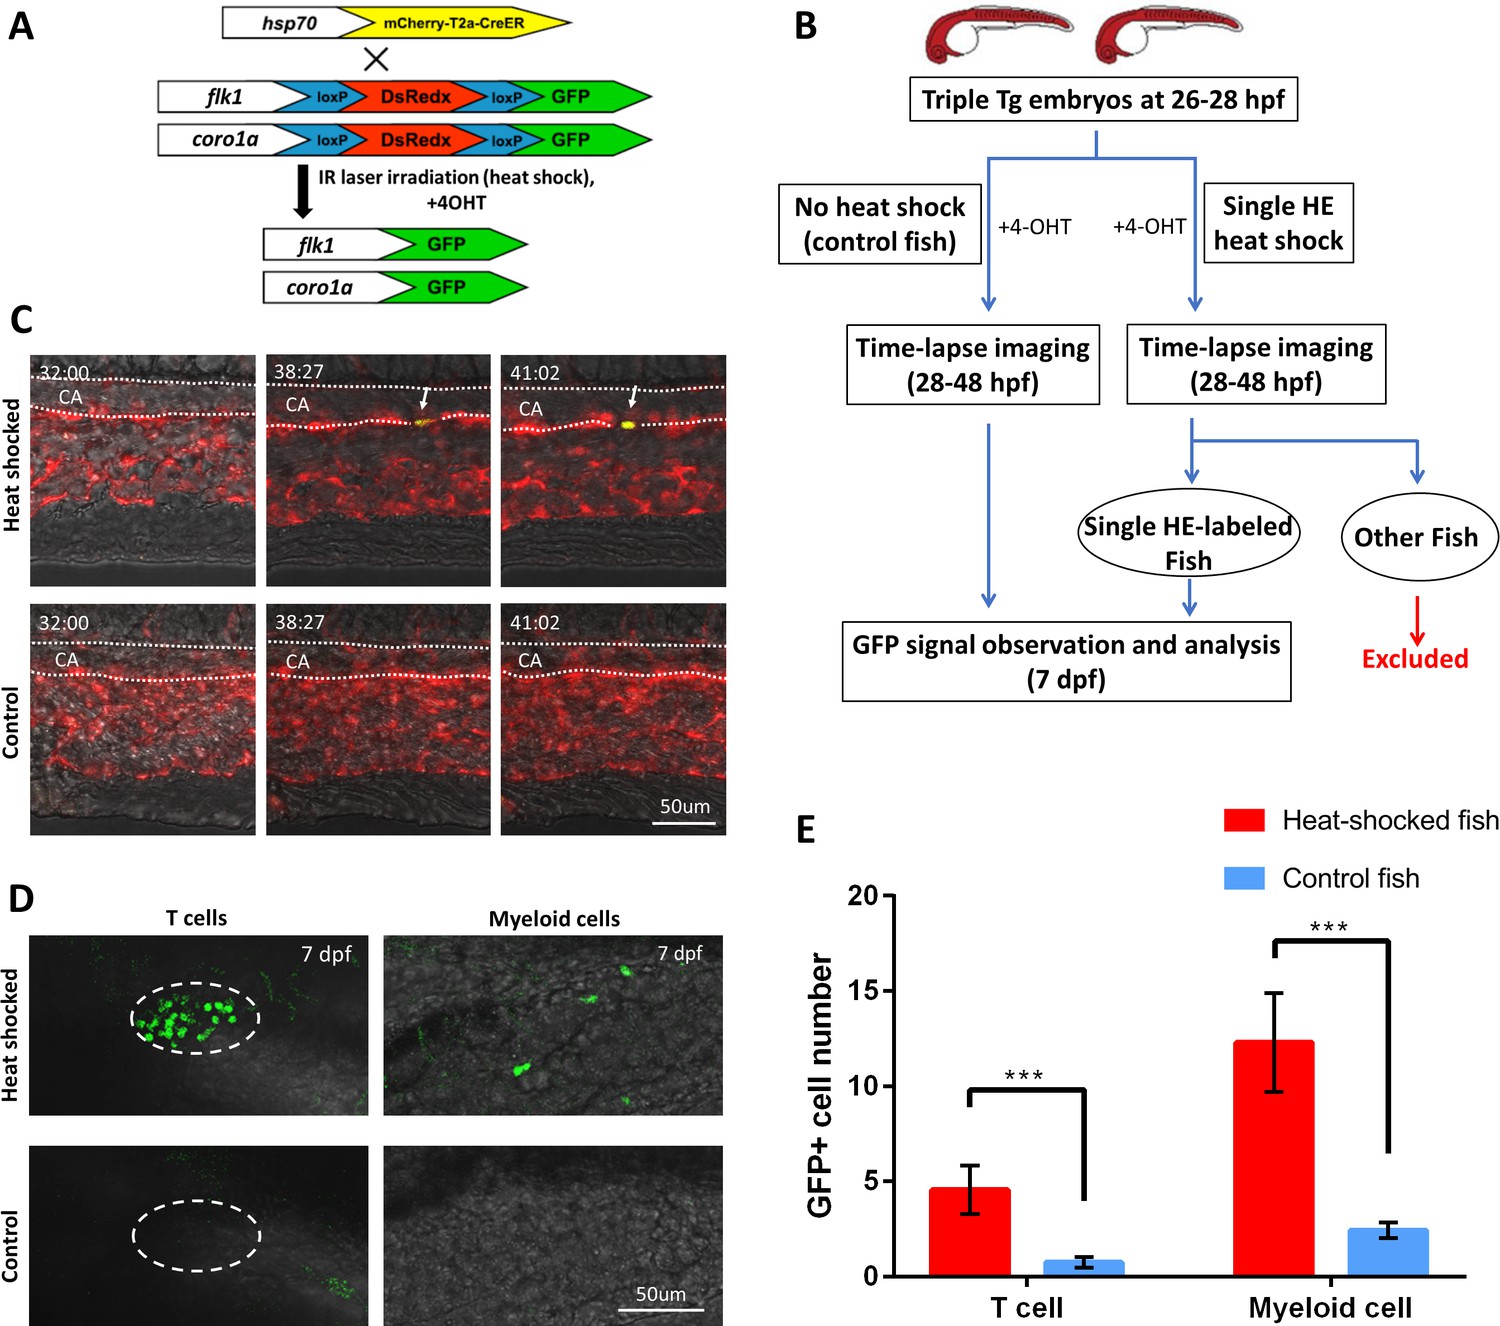
(A) The genetic labeling diagram of the lineage tracing experiment. The heat shock-induced CreERT2 line Tg(hsp70l:mCherry-T2a-CreERT2) is crossed with the double reporter fish Tg(kdrl:loxP-DsRedx-loxP-EGFP;coro1a:loxP-DsRedx-loxP-EGFP) to obtain triple transgenic Tg(kdrl:loxP-DsRedx-loxP-EGFP; coro1a:loxP-DsRedx-loxP-EGFP; hsp70l:mCherry-T2a-CreERT2) embryo. Upon IR laser illumination, the targeted HEs will express CreER. After 4-OHT treatment, the CreER will enter the cell nucleus and remove the DsRedx cassettes flanked by loxP from the genome. After that, the target HEs and their hematopoietic progenies will express GFP signal, thus be distinguished from the unlabeled DsRedx+ cells. (B) The work flow of the IR-LEGO-mediated single HE lineage tracing assay. (C) Representative time-lapse images of the single-HE heat-shocked embryos (upper row) and control embryos (lower row). Dotted lines depict the caudal aorta (CA) in the PBI region (dorsal wall on the top). Number at the top left corner in each image indicates the developmental stage of the embryos (hh:mm post fertilization). The heat-shock labeled HE (white arrow) on the ventral wall of CA gradually turns on the expression of GFP without affecting neighbor HEs, while the HEs in control embryos do not express GFP during time-lapse imaging. (D) Images of GFP+ T cells and myeloid cells in single-HE labeled fish and control fish at 7 dpf (back on the top). The left column shows small and round coro1a:GFP+ T cells in the thymus (depicted by dashed lines). The right column shows coro1a:GFP+ myeloid cells on the trunk, which have irregular shape. While GFP+ T cells and myeloid cells are persistently observed in many of the labeled fish (upper row), rare GFP signals are detected in most of the control fish (lower row). (E) Quantification of GFP+ T cells and myeloid cells in both single HE-labeled fish (n=27) and control fish (n=109) at 7 dpf. Statistical analysis indicates that for both T cells and myeloid cells, the GFP+ cell number in heat-shock labeled fish is significantly higher than that in control fish. The cell numbers are shown in terms of mean ± standard error of the mean. The Mann–Whitney–Wilcoxon rank-sum test was used for significance test. ***P < 0.001.
Figure 3—figure supplement 1
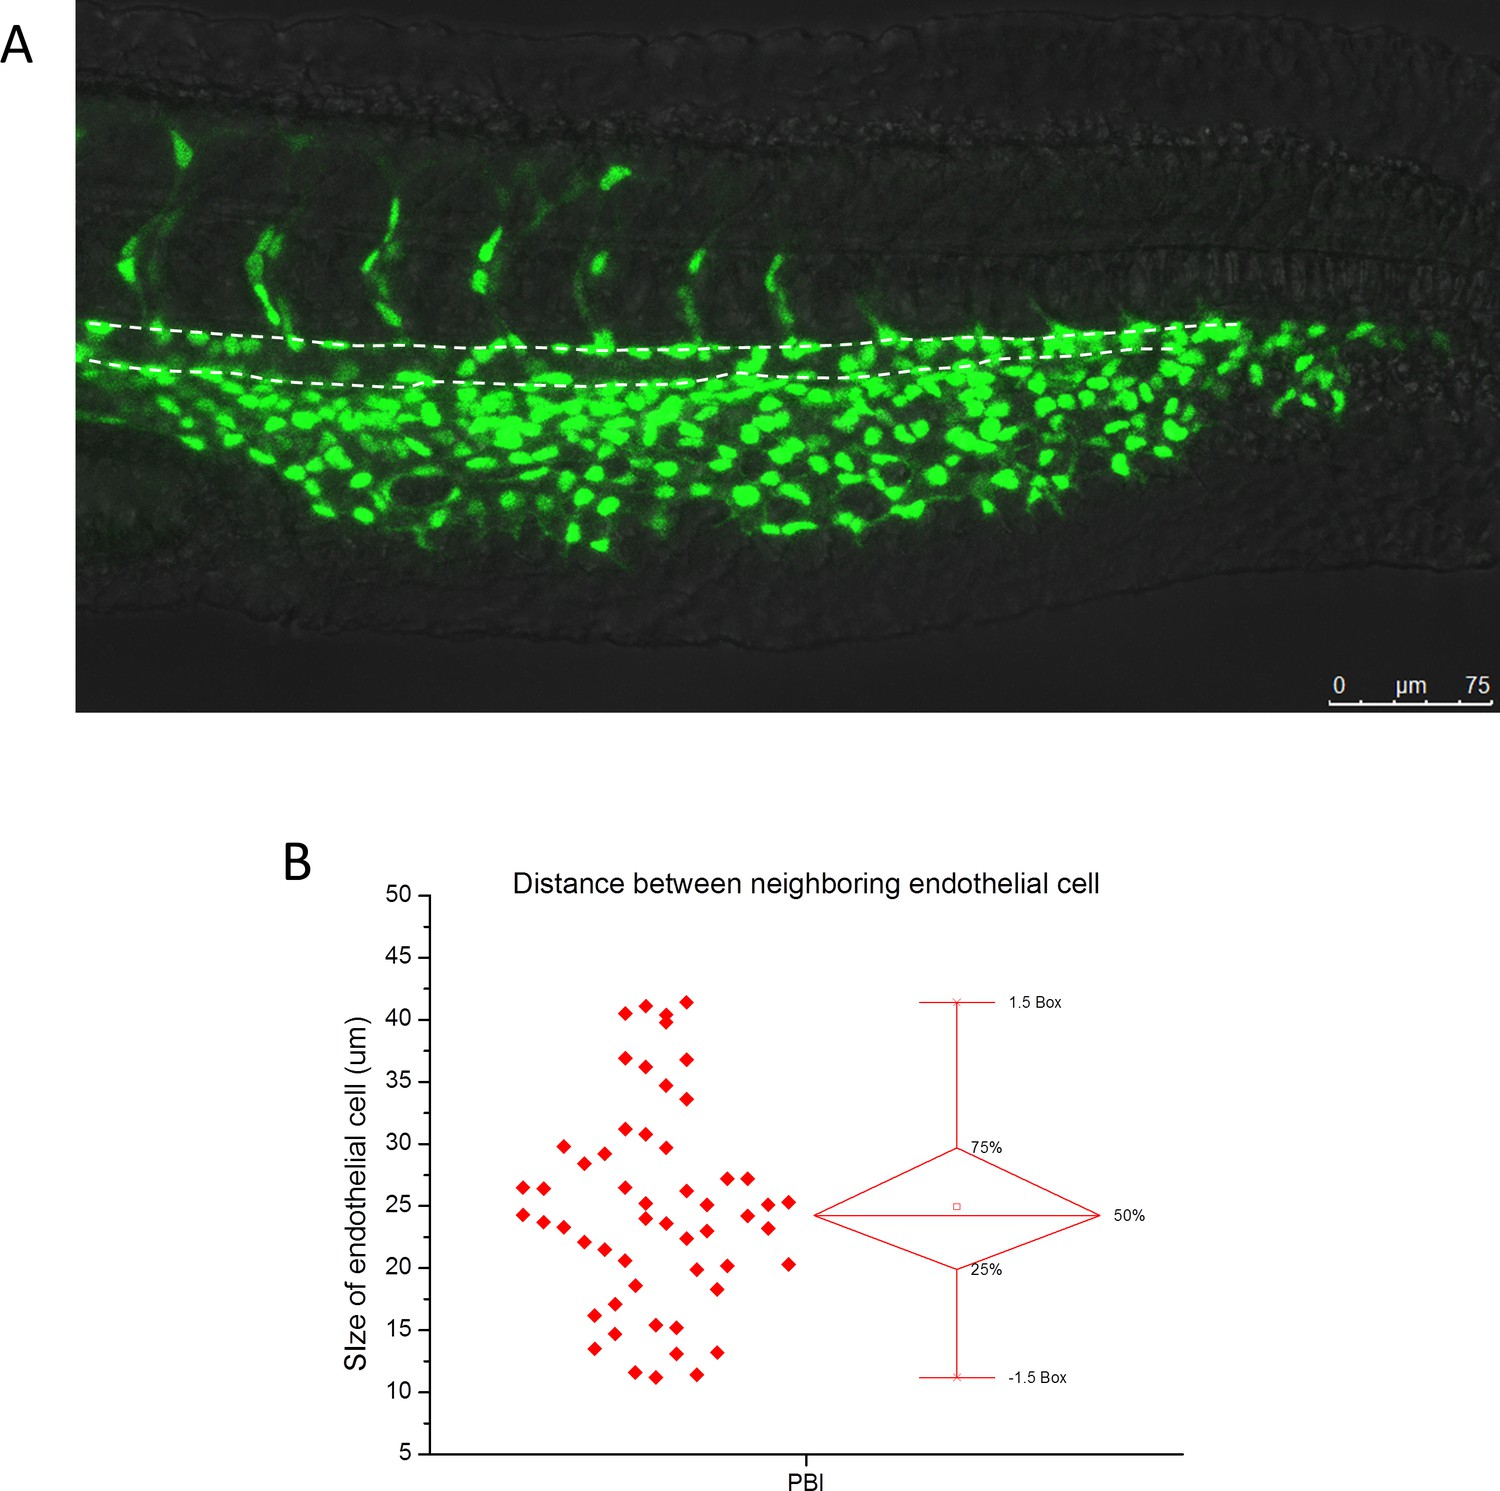
Size of endothelial cells on the ventral wall of aorta in the PBI region.
(A) The representative fluorescence image of a 28 hpf Tg(kdrl:GFP; kdrl:nlsEOS) zebrafish with endothelial nuclei labeled by nls-EOS (green). The region marked by dashed lines indicates aorta in the PBI. (B) Statistics of the distance between the nuclei of neighboring endothelial cells on the aortic floor (bottom dashed line in (A)) in the PBI region. The average distance is 24.9 µm and the standard deviation is 8.2 µm. The total number of endothelial cells is 54 from three zebrafish.
-
Figure 3—figure supplement 1—source data 1
Statistics of the size of endothelial cells on the aortic floor.
- https://cdn.elifesciences.org/articles/52024/elife-52024-fig3-figsupp1-data1-v2.xlsx
Figure 3—figure supplement 2
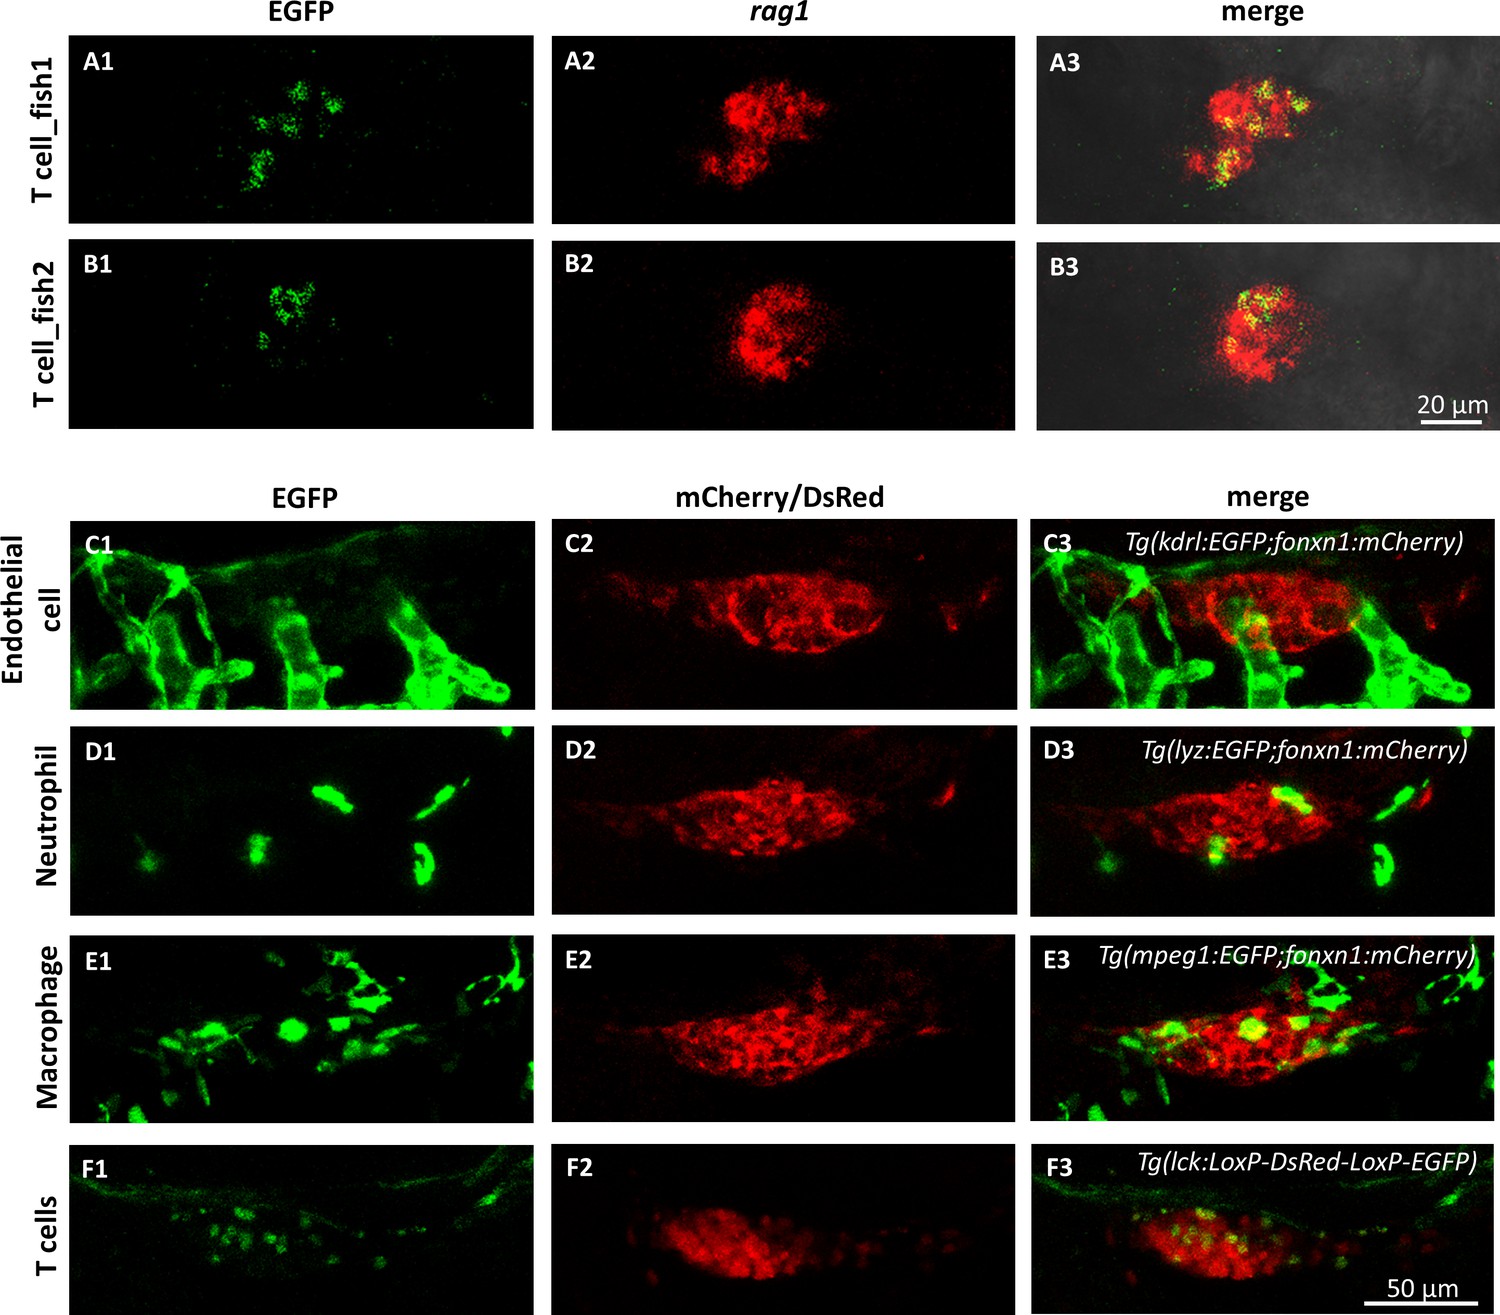
Verification of T cells in the thymus of the single-HE labeled zebrafish at 7dpf.
(A1 and B1) The representative images (by maximum projections) of antibody stained EGFP+ cells in the thymus of triple Tg zebrafish. (A2 and B2) The patterns of rag1 expression in the thymus (by maximum projections) revealed by whole-mount in situ hybridization. (A3 and B3) The colocalization of EGFP with rag1 expression indicates that the EGFP+ cells in the thymus of 7dpf zebrafish are T cells. In addition, T cells (F) can be distinguished from other cell types (C–E) in the thymus based on their small and round shapes. (C) In vivo dual-color imaging of blood vessel endothelium (EGFP) and thymus epithlium (mCherry). (D) In vivo dual-color imaging of neutrophils (EGFP) and thymus epithlium (mCherry). (E) In vivo dual-color imaging of macrophages (EGFP) and thymus epithlium (mCherry). (F) In vivo dual-color imaging of heat shocked T cells (EGFP) and non-heat shocked T cells in thymus (DsRed).
Figure 3—figure supplement 3
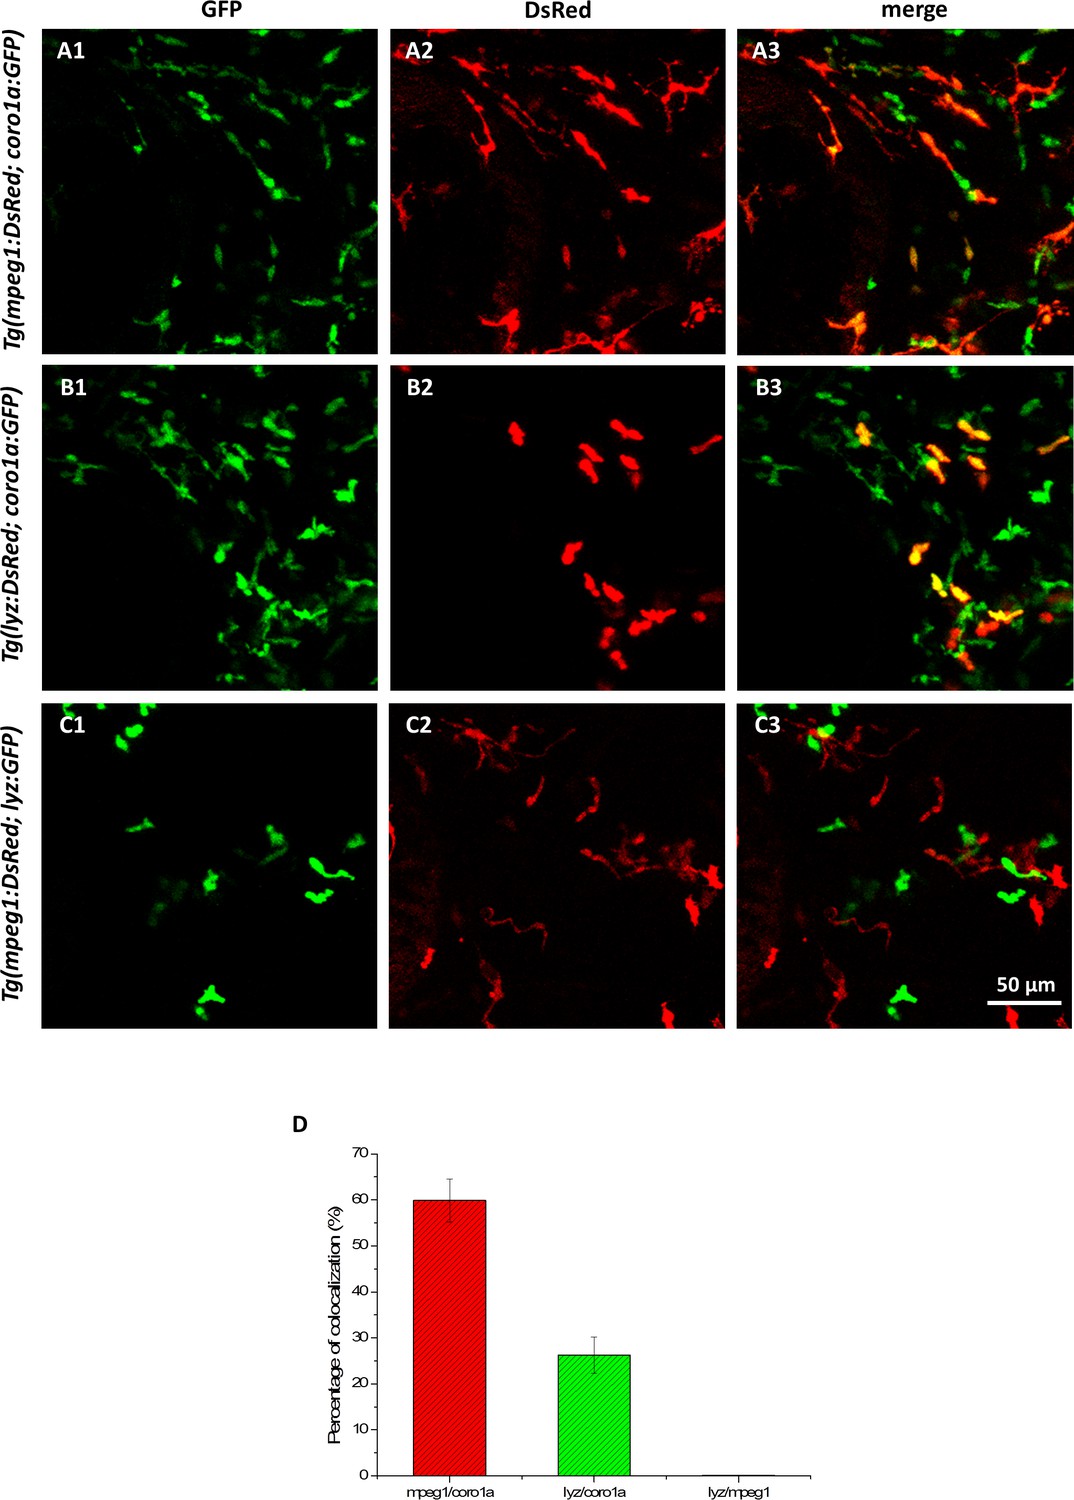
Verification of myeloid cells on the trunk of the single-HE labeled zebrafish at 7dpf.
(A1–A3) In vivo dual-color imaging of leukocytes (coro1a:GFP) and macrophages (mpeg1:DsRed). (B1–B3) In vivo dual-color imaging of leukocytes (coro1a:GFP) and neutrophils (lyz:DsRed). (C1–C3) In vivo dual-color imaging of neutrophils (lyz:GFP) and macrophages (mpeg1:DsRed). (D) The colocalization percentages of mpeg1+/coro1a+ and lyz+/coro1a+ cells are 59.9% and 26.3%, respectively (n = 3), while lyz+ cells are not colocalized with mpeg+ cells, indicating that the majority of coro1a+ cells (86.2%) on the trunk are lyz+ or mpeg1+ myeloid cells.
-
Figure 3—figure supplement 3—source data 1
The colocalization percentages of mpeg1+, coro1a+ and lyz+ cells.
- https://cdn.elifesciences.org/articles/52024/elife-52024-fig3-figsupp3-data1-v2.xlsx
Figure 4 with 1 supplement
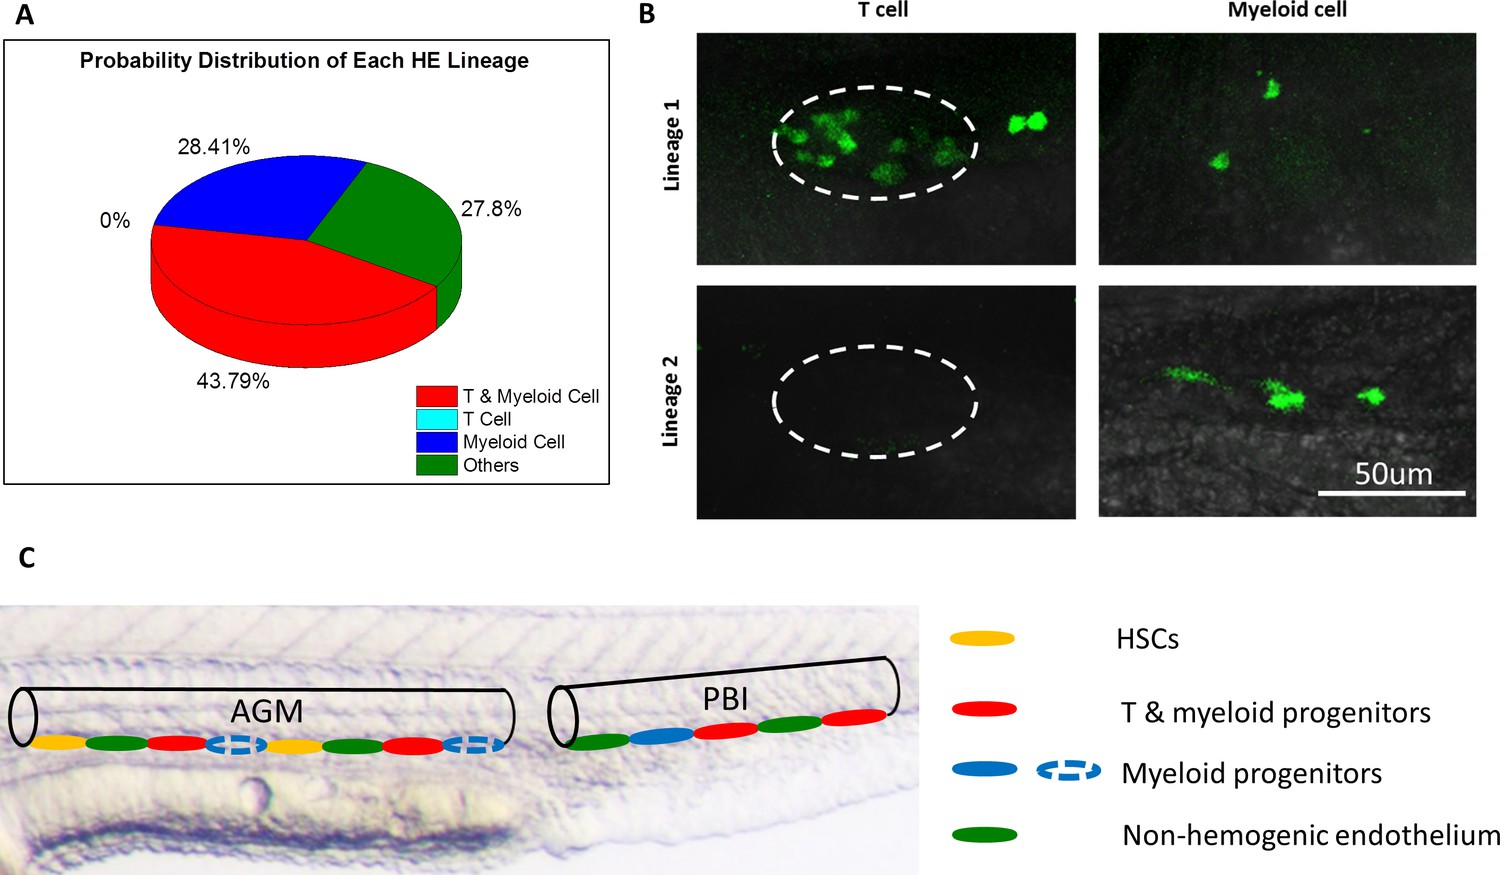
The heterogeneous hematopoietic lineages of HE.
(A) Distribution of probability of each HE subpopulation. At least two subpopulations of HEs with distinct hematopoietic potentials exist in the PBI. One group of HEs has lymphoid and myeloid potential, while the other group generates myeloid lineage only. HEs with lymphoid lineage potential only were not found. The total number of single-HE labeled zebrafish is 27. (B) Representative images of GFP+ T cells and myeloid cells derived from two distinct HE subpopulations. It shows that the myeloid-lymphoid bipotent HEs give rise to both T cells and myeloid cells (the upper row), while the myeloid unipotent HEs generate myeloid progenies exclusively (the lower row). The left column shows small and round coro1a:GFP+ T cells in the thymus (depicted by dashed lines). The right column shows coro1a:GFP+ myeloid cells on the trunk, which have irregular shape. (C) A schematic diagram illustrates the heterogeneity of hematopoietic potential of HEs. The aortic lumen in AGM and PBI are represented by black lines. The different HE subpopulations on the ventral floor of aorta are indicated by ellipses with different colors. The HEs in PBI give rise to T lymphoid-myeloid bipotent progenitors (red) and myeloid unipotent progenitors (blue), while the HEs in the AGM produce HSCs (orange) and T lymphoid-myeloid bipotent progenitors. It is possible that the AGM HEs can also generate myeloid unipotent progenitors (blue dotted ellipses), similar to their counterparts in the PBI.
Figure 4—figure supplement 1
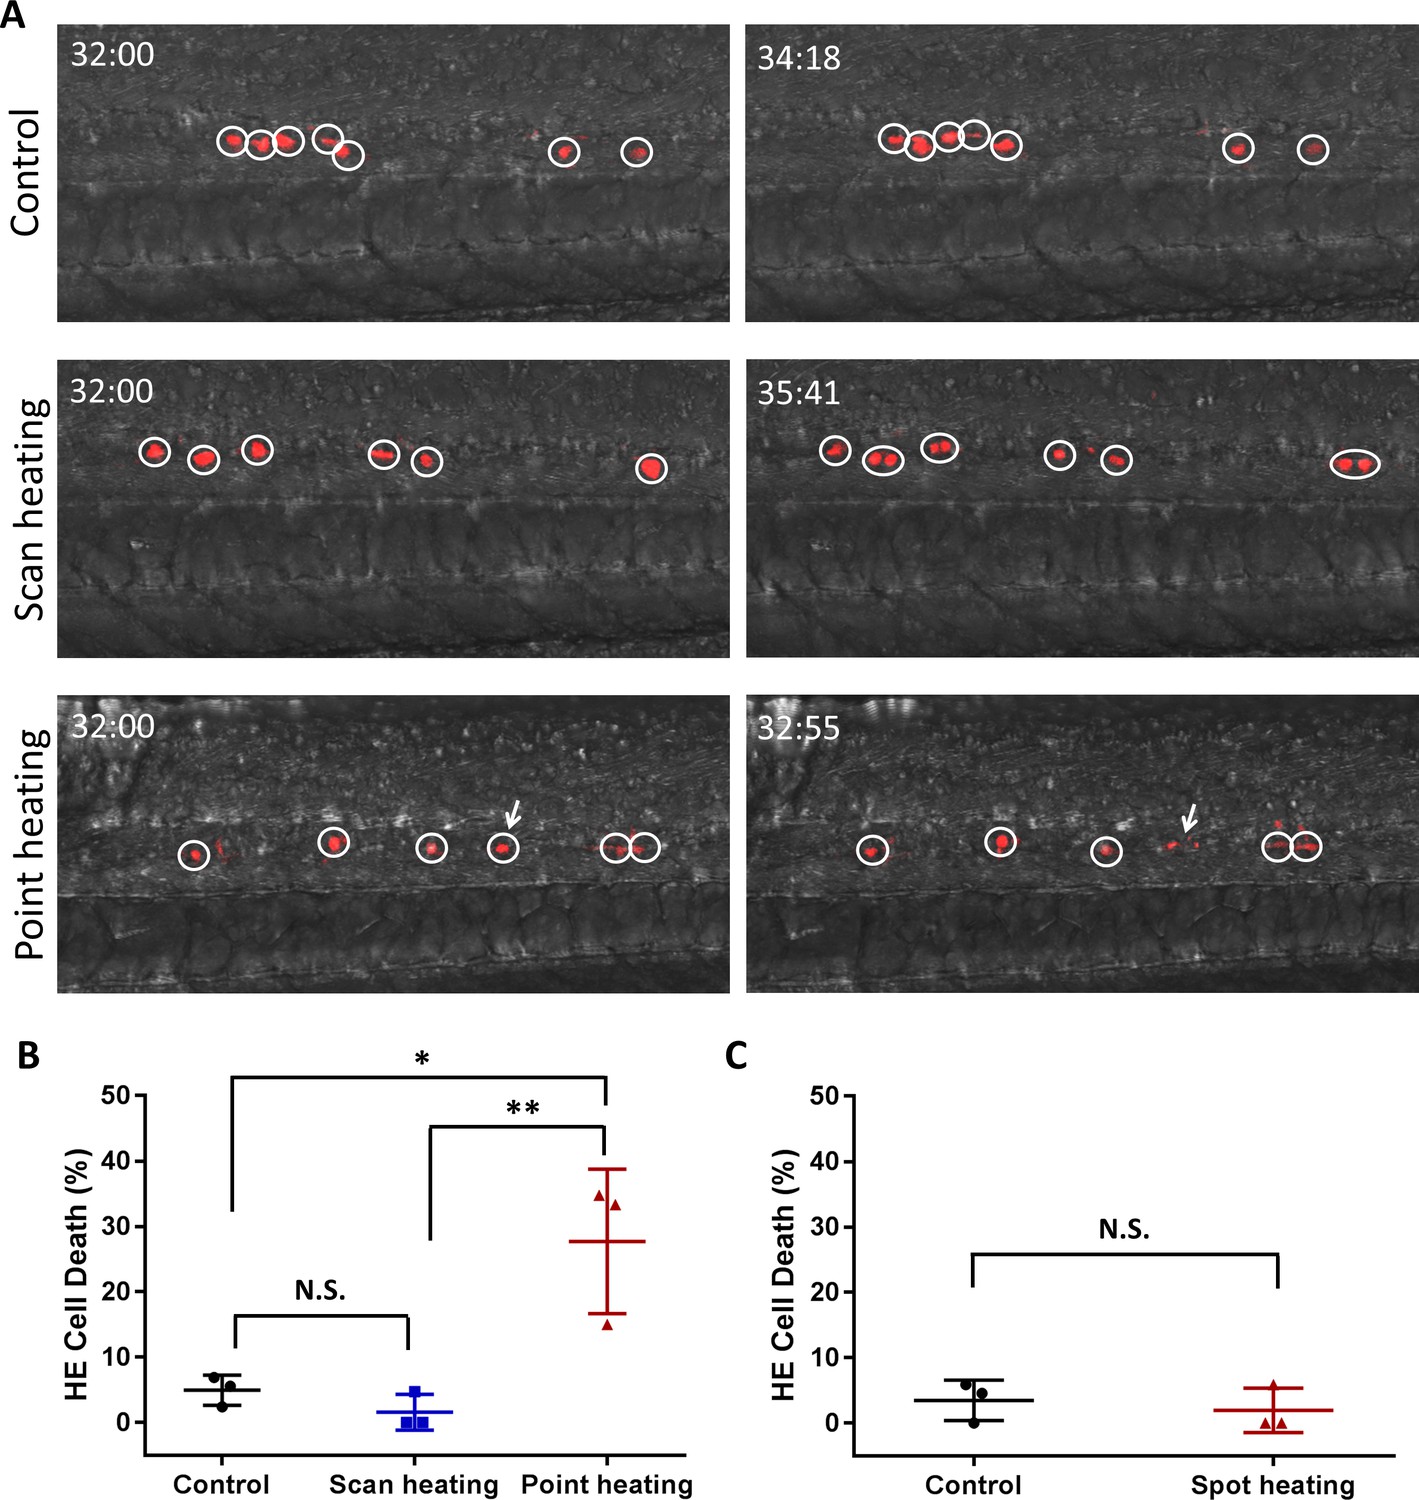
Assessment of HE cell damage caused by IR-LEGO heat shock.
(A) Representative time-lapse images of the control embryos (the first row), the scanning heat-shocked embryos (the second row), and the point heat-shocked embryos (the third row). Circles depict the individual converted HEs in the PBI region (dorsal wall on the bottom). Number at the top left corner in each image indicates the developmental stage of the embryos (hh:mm post fertilization). One of the point heat-shock HE (white arrow) burst into fragment, while the HEs in control embryos and scanning heat-shocked keep viability during time-lapse imaging. (B) Quantification of the HE cell death in the control embryos (three independent experiments, in which the number of dead cell/total cell are 1/18, 1/42 and 2/29, respectively. Totally 4 of 89 cells died.), the scanning heat-shocked embryos (three independent experiments, in which the number of dead cell/total cell are 1/21, 0/34 and 0/23, respectively. Totally 1 of 78 cells died.), and the point heat-shocked embryos (three independent experiments, in which the number of dead cell/total cell are 8/23, 9/27 and 3/20, respectively. Totally 20 of 70 cells died.). Statistical analysis indicates that the percentage of HE cell death in the scanning heat-shocked embryos has no difference from the control group, while heat shock fixed on a single point result in significantly more cell death. The percentages of cell death are shown in terms of mean ± standard deviation. One-way ANOVA was used for significance test. *P < 0.05; **P < 0.01. (C) Cell death test on the old IR-LEGO system used for bulk labeling previously. The IR laser beam was loosely focused by a low-NA lens and heat shocked the embryos on each spot for 2 minutes. Statistical analysis shows that the single spot heat shock used for bulk labeling would not cause cell damage.
-
Figure 4—figure supplement 1—source data 1
Quantification of the HE cell death under different heat shock conditions.
- https://cdn.elifesciences.org/articles/52024/elife-52024-fig4-figsupp1-data1-v2.xlsx
Appendix 1—figure 1
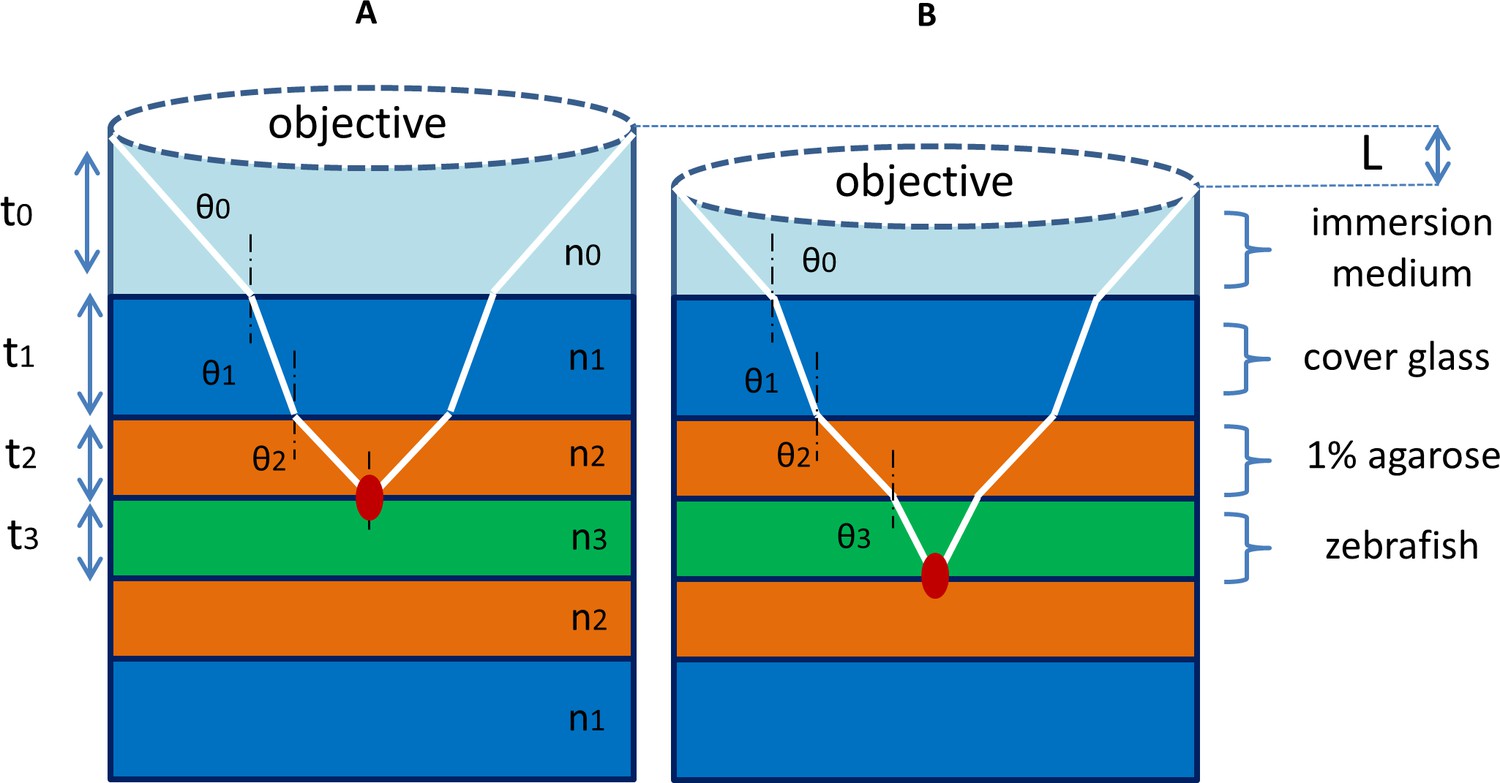
Multiple-media model for IR laser heat shock.
(A) For IR laser heat shock in vivo, there are multiple media along the optical path from the objective to the focal point of IR laser, including the immersion medium (water), cover glass, agarose and zebrafish tissues. The total absorbance is determined by the absorption coefficient and thickness of each medium. (B) When the IR laser is focused at different depths in the zebrafish tissues, the absorbance along the optical path changes with the alteration of thickness of the immersion medium and tissues. A water immersion objective can stabilize the heating effect at different depths in tissue because of the reduced mismatch of absorption coefficients between immersion medium and tissue.
Appendix 5—figure 1
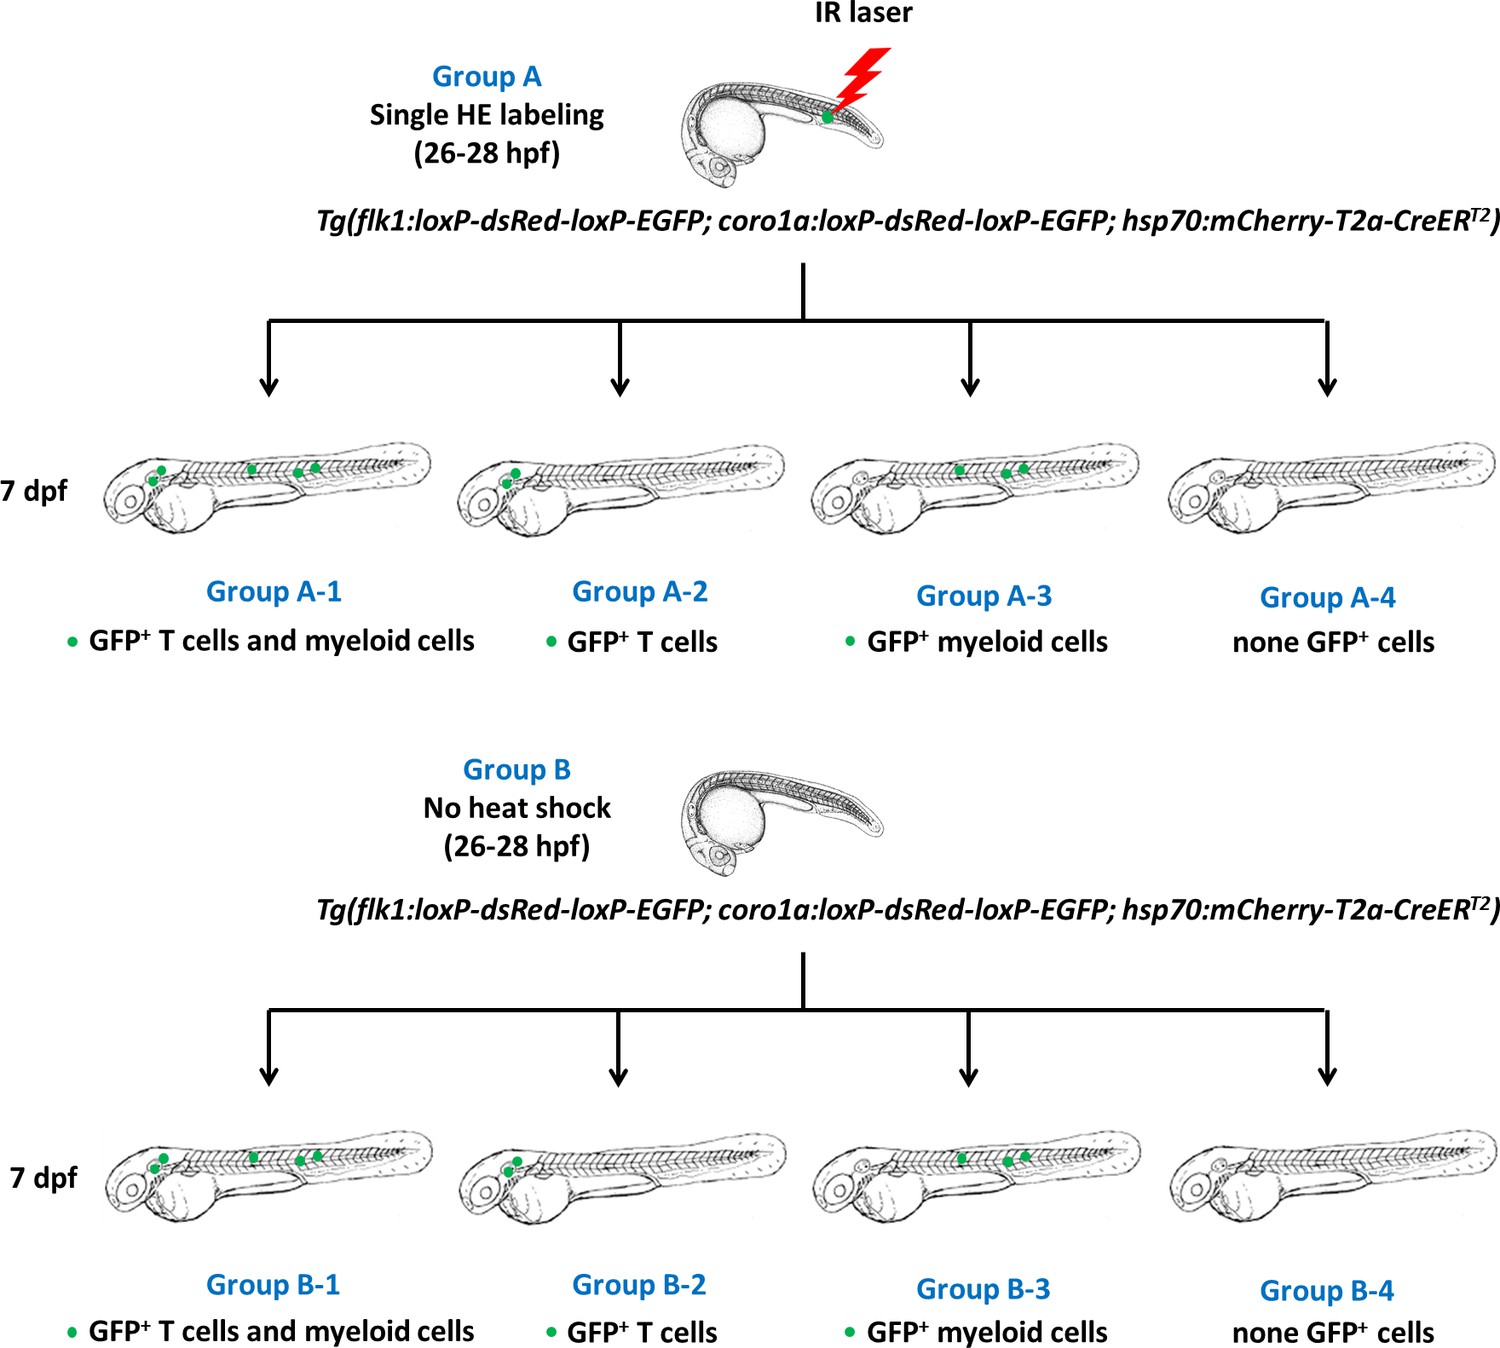
Classification for different subgroups of zebrafish in the single HE-labeled group and control group.
In Group A, a single HE at the PBI of triple Tg embryo was labeled through IR-LEGO heat shock, while no heat shock was performed in Group B. The embryos were raised to seven dpf and divided into four subgroups according to the distribution of GFP+ cells. Group A-1 and Group B-1 contained both GFP+ T lymphocytes and GFP+ myeloid cells. Group A-2 and Group B-2 contained GFP+ T lymphocytes only. Group A-3 and Group B-3 contained GFP+ myeloid cells only. Group A-4 and Group B-4 contained no GFP+ cells. Each subgroup of zebrafish corresponds to a specific lineage of HSC-independent hematopoietic progenitors.
Author response image 1

Videos
Video 1
The time-lapse live imaging of labeling a single caudal aorta endothelium cell in zebrafish.
Video 2
The time-lapse live imaging of non-labeling control zebrafish.
Video 3
The time-lapse live imaging of point heat shocked zebrafish.
Video 4
The time-lapse live imaging of scanning heat shocked zebrafish.
Video 5
The time-lapse live imaging of non-heat shocked control zebrafish.
Tables
Key resources table
| Reagent type (species) or resource | Designation | Source or reference | Identifiers | Additional information |
|---|---|---|---|---|
| Strain, strain background (Danio rerio) | Tg(coro1a:loxP-DsRedx-loxP-EGFP) | doi: 10.1016/j.devcel.2015.08.018. | ||
| Strain, strain background (Danio rerio) | Tg(hsp70l:mCherry-T2a-CreERT2) | doi:10.1182/blood-2014-09-601542 | ||
| Strain, strain background (Danio rerio) | Tg(bactin2:loxP-STOP-loxP-DsRedx) | doi:10.1038/nature08738 | ||
| Strain, strain background (Danio rerio) | Tg(kdrl:nls-EOS) | doi: 10.1016/j.ydbio.2014.06.015 | ||
| Strain, strain background (Danio rerio) | Tg(kdrl:loxP-DsRedx-loxP-EGFP) | This paper | Maintained in ZL. Wen lab | |
| Antibody | Anti-GFP | Abcam | ab6658 | 1:400 Overnight 4°C |
| Antibody | donkey-anti-goat-488 secondary antibody | Invitrogen | A11055 | 1:400 Overnight 4°C |
Appendix 5—table 1
The probability relationship among X, ε and Y.
 | (+,+) | (+,0) | (0,+) | (0,0) | |
|---|---|---|---|---|---|
| Prob. | p11 | p10 | p01 | p00 | |
| (+,+) | q11 | (+,+) | (+,+) | (+,+) | (+,+) |
| (+,0) | q10 | (+,+) | (+,0) | (+,+) | (+,0) |
| (0,+) | q01 | (+,+) | (+,+) | (0,+) | (0,+) |
| (0,0) | q00 | (+,+) | (+,0) | (0,+) | (0,0) |
Appendix 5—table 2
The probability distribution of Y.
| Type | 1 | 2 | 3 | 4 |
|---|---|---|---|---|
| Y | (+,+) | (+,0) | (0,+) | (0,0) |
| Prob. | p11q00+p11q01+p10q01+p11q10+p01q10+p11q11+p10q11+p01q11+p00q11 | p10q00+p00q10+p10q10 | p01q00+p00q01+p01q01 | p00q00 |
Appendix 5—table 3
The estimated probability distribution of each lineage.
| Type | 1 | 2 | 3 | 4 |
|---|---|---|---|---|
| Prob. | 0.4379 | 0.0000 | 0.2841 | 0.2780 |
Appendix 5—table 4
The estimated probability distribution of X, ε and Y.
 | (+,+) | (+,0) | (0,+) | (0,0) |
|---|---|---|---|---|
| (+,+) | 0.0321 | 0.0000 | 0.0208 | 0.0204 |
| (+,0) | 0.0038 | 0.0000 | 0.0024 | 0.0024 |
| (0,+) | 0.1727 | 0.0000 | 0.1121 | 0.1097 |
| (0,0) | 0.2293 | 0.0000 | 0.1487 | 0.1456 |
Additional files
-
Source code 1
Source code of maximum likelihood estimation.
- https://cdn.elifesciences.org/articles/52024/elife-52024-code1-v2.r
-
Supplementary file 1
Tables.
(a) Temperature sensitivity of fluorescent thermometry. (b) Temperature distribution with IR laser heat shock in zebrafish in vivo and efficiency of cell labeling in zebrafish tissues. (c) Numbers of GFP+ T lymphocytes and myeloid cells in each single HE-labeled zebrafish at seven dpf stage. (d) Numbers of GFP+ T lymphocytes and myeloid cells in each non-labeling control zebrafish at seven dpf stage. (e) The estimates and the corresponding 95% asymptotic confidence intervals of the probability for each hemogenic endothelium (HE) lineage in the single-HE labeled group. (f) The estimates and the corresponding 95% asymptotic confidence intervals of the probability for each type of zebrafish in the control group.
- https://cdn.elifesciences.org/articles/52024/elife-52024-supp1-v2.docx
-
Transparent reporting form
- https://cdn.elifesciences.org/articles/52024/elife-52024-transrepform-v2.docx
Download links
A two-part list of links to download the article, or parts of the article, in various formats.
Downloads (link to download the article as PDF)
Open citations (links to open the citations from this article in various online reference manager services)
Cite this article (links to download the citations from this article in formats compatible with various reference manager tools)
In vivo single-cell lineage tracing in zebrafish using high-resolution infrared laser-mediated gene induction microscopy
eLife 9:e52024.
https://doi.org/10.7554/eLife.52024


