Evolutionarily unique mechanistic framework of clathrin-mediated endocytosis in plants
- Institute of Science and Technology Austria, Austria
- Karlsruhe Institute of Technology, Germany
Figures
Figure 1 with 1 supplement
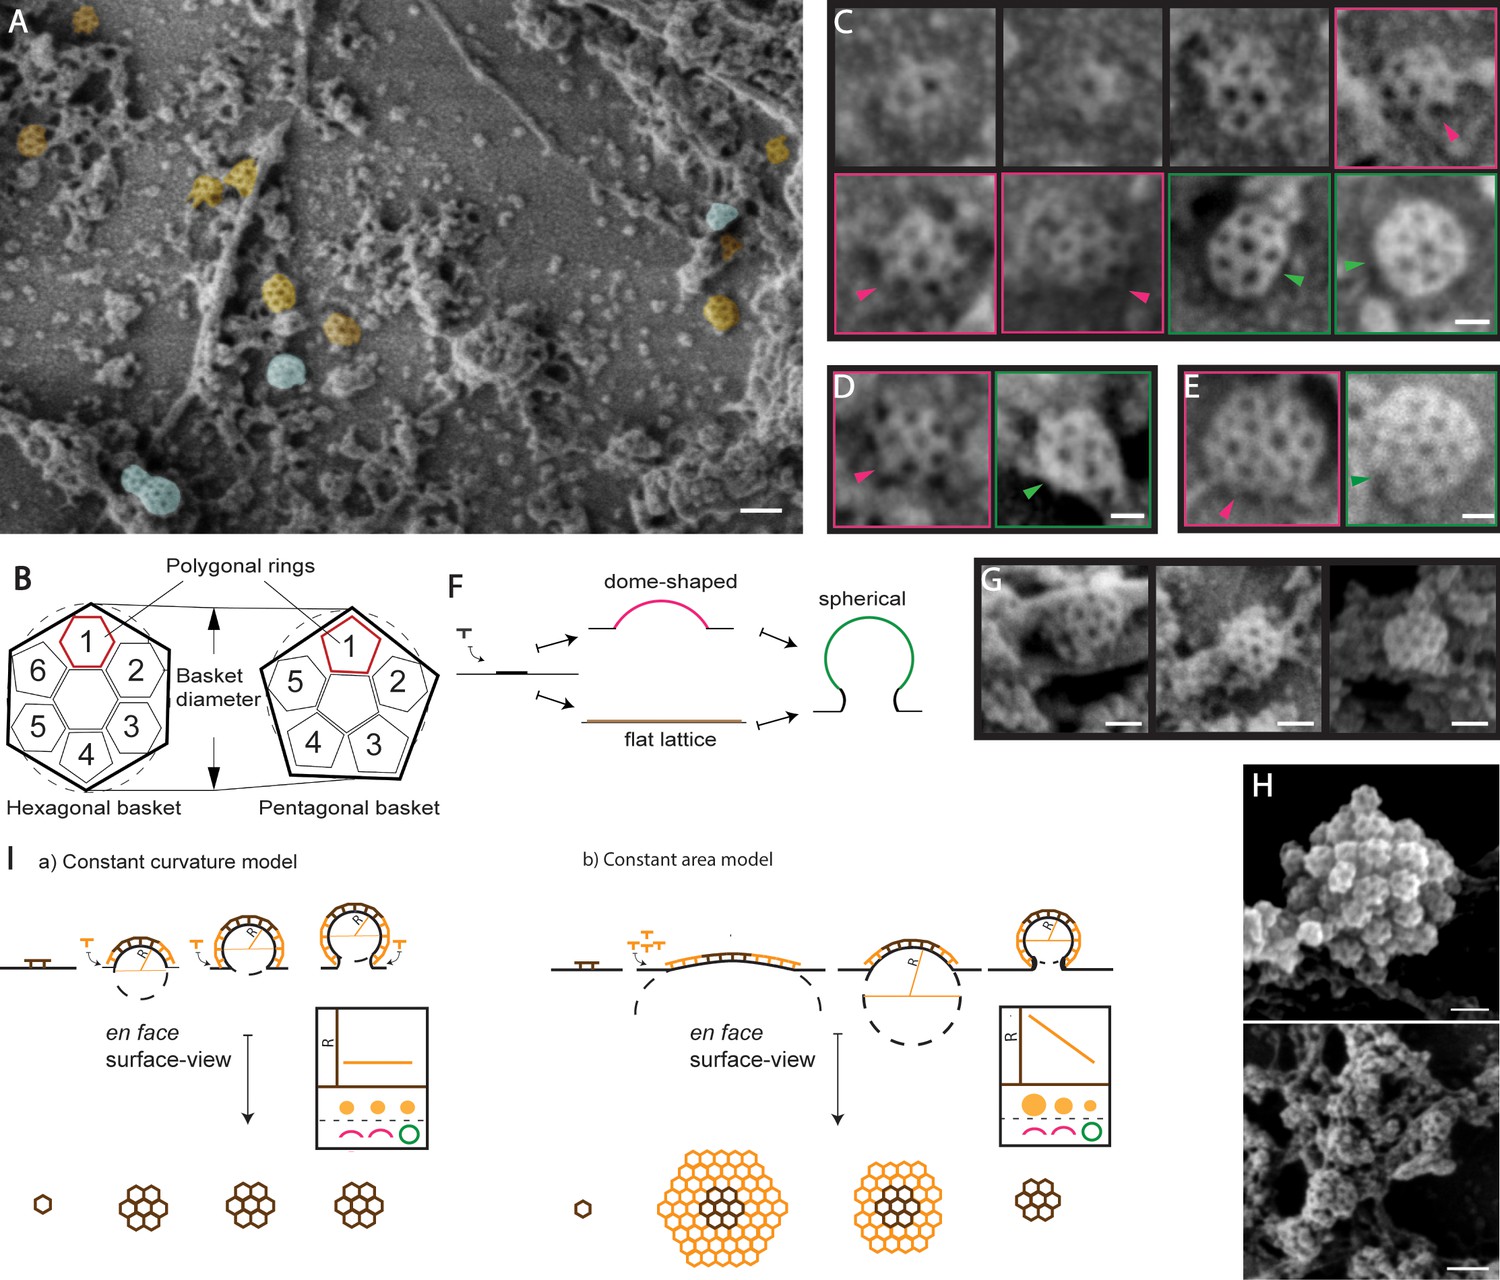
Ultrastructural characterization of clathrin-coated structures in unroofed protoplasts by SEM.
(A) SEM image showing CCSs found associated to the PM (orange) and intracellular membrane structures (blue). See also Figure 1—figure supplement 1A, B. (B) Illustration of the en face surface-view of ‘hexagonal’ (left) and ‘pentagonal’ (right) clathrin basket (as outlined in black), which is composed of 6 and 5 polygonal rings respectively. (C) Representative images depicting various stages of development of the hexagonal basket-type CCV. (D) Representative pentagonal basket type CCSs (left and E) irregular basket type CCSs (right) at the PM. Color-coded boxing corresponds to the membrane invagination assessment illustrated in 1F; dome-shaped basket - pink, spherical basket - green. Arrows show the side-view of the baskets. (F) Membrane invagination assessment illustrating the side-view of CCSs with different degrees of invagination. See also Figure 1—figure supplement 1H. (G) Representative images of isolated CCSs of pentagonal, hexagonal and irregular basket types at the intracellular membrane structures. (H) Example aggregated and partial fused CCSs at the intracellular membrane structures. See also Figure 1—figure supplement 1 E-G. (I) Two models of clathrin-mediated membrane bending differentiated by en face surface-view analysis: The constant curvature model where, the added clathrin bends the membrane and the en face view of the CCS, depicting the radius of curvature (R), stays the same. The constant area model where the en face view of the CCS converges from a flat lattice to a curved dome and further to spherical, thus progressively decreasing R. The graph represents the relationship among R, en face surface-view and the degree of membrane invagination of the CCSs. Scale bars; 100 nm (A, E upper panel), 30 nm (B, C), 50 nm (D) and 60 nm (E lower panel).
Figure 1—figure supplement 1
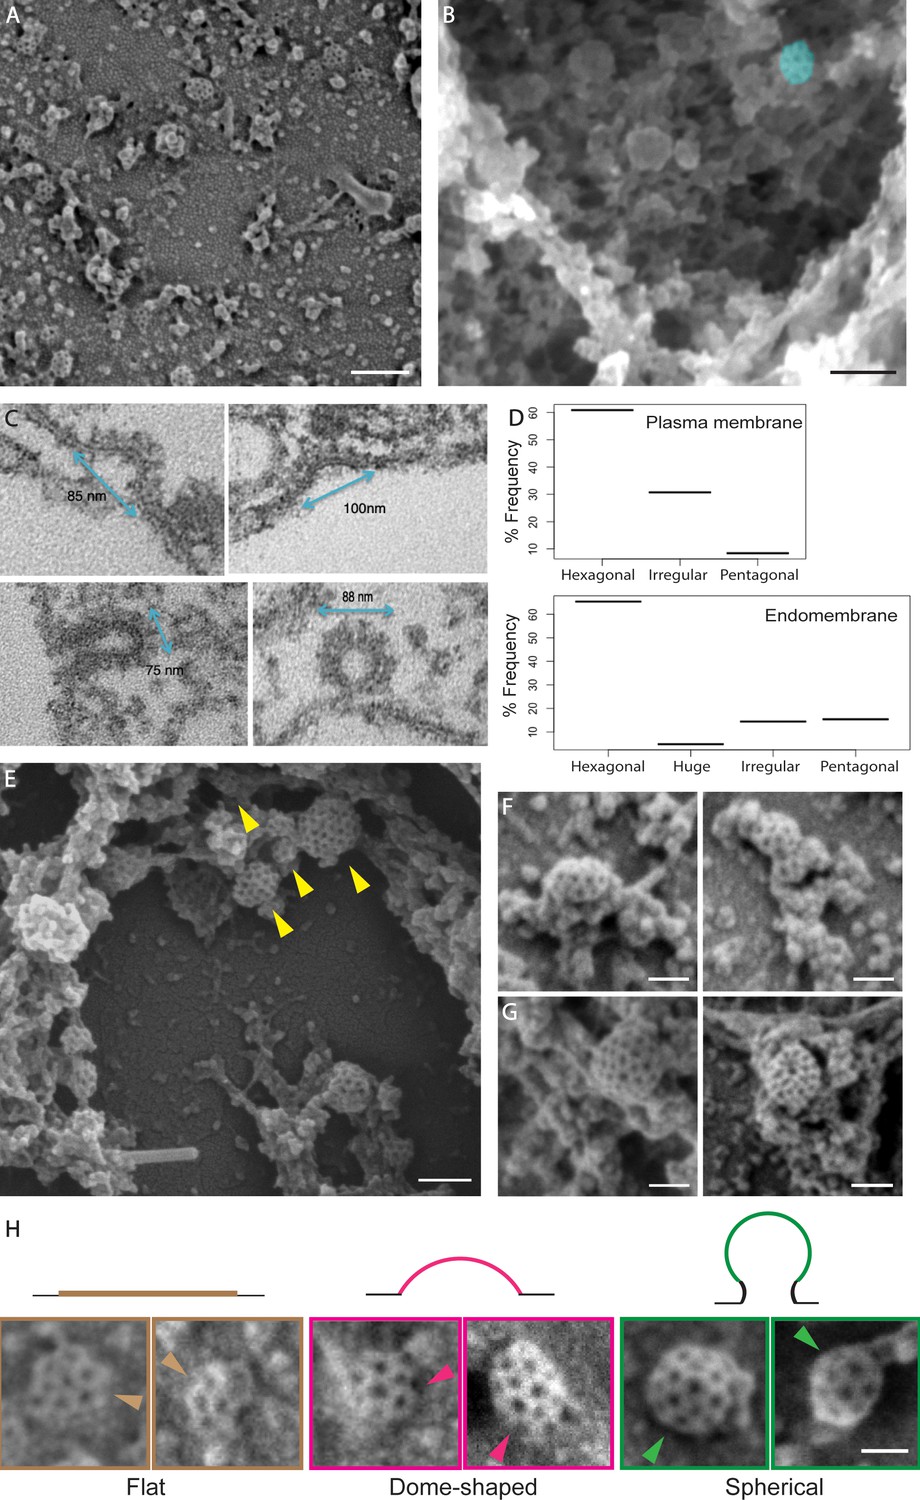
Ultrastructural characterization of clathrin-coated structures.
(A) A representative SEM image of metal replica of protoplasts shows CCPs in varying stages of development at the PM. Scale bar: 200 nm. (B) An example SEM image depicting the cytoskeletal and intracellular membrane structures deeper in the cell with a single CCS marked in blue. Scale bar: 100 nm. (C) The TEM images showcasing the invagination event of the resin embedded and sectioned protoplasts under hyper osmotic condition. N = 62 sections with a total of 4 invagination events captured. Note that predominantly the irregular population of CCSs with diameter >80 nm are captured. (D) Histograms showing the different populations of CCSs at the PM (left) and intracellular membrane structures (right). 166 CCSs from the PM and 104 CCSs from the EM structures pooled from N = 15 cells). (E - G) Example SEM images depicting arrangements of the CCSs in intracellular membrane structures. (F) Multiple-fused CCSs G) Isolated CCSs of huge basket type. Scale bars: 75 nm. (G) Aggregation of CCPs of distinct population types (indicated by arrows). Scale bar: 100 nm. (H) Example SEM images of the CCPs classified into flat, dome-shaped and spherical structures by membrane invagination assessment. The arrows mark the side-view of CCPs. Scale bar: 50 nm.
-
Figure 1—figure supplement 1—source data 1
Source data for the quantification in Figure 1—figure supplement 1.
- https://cdn.elifesciences.org/articles/52067/elife-52067-fig1-figsupp1-data1-v2.zip
Figure 2 with 3 supplements
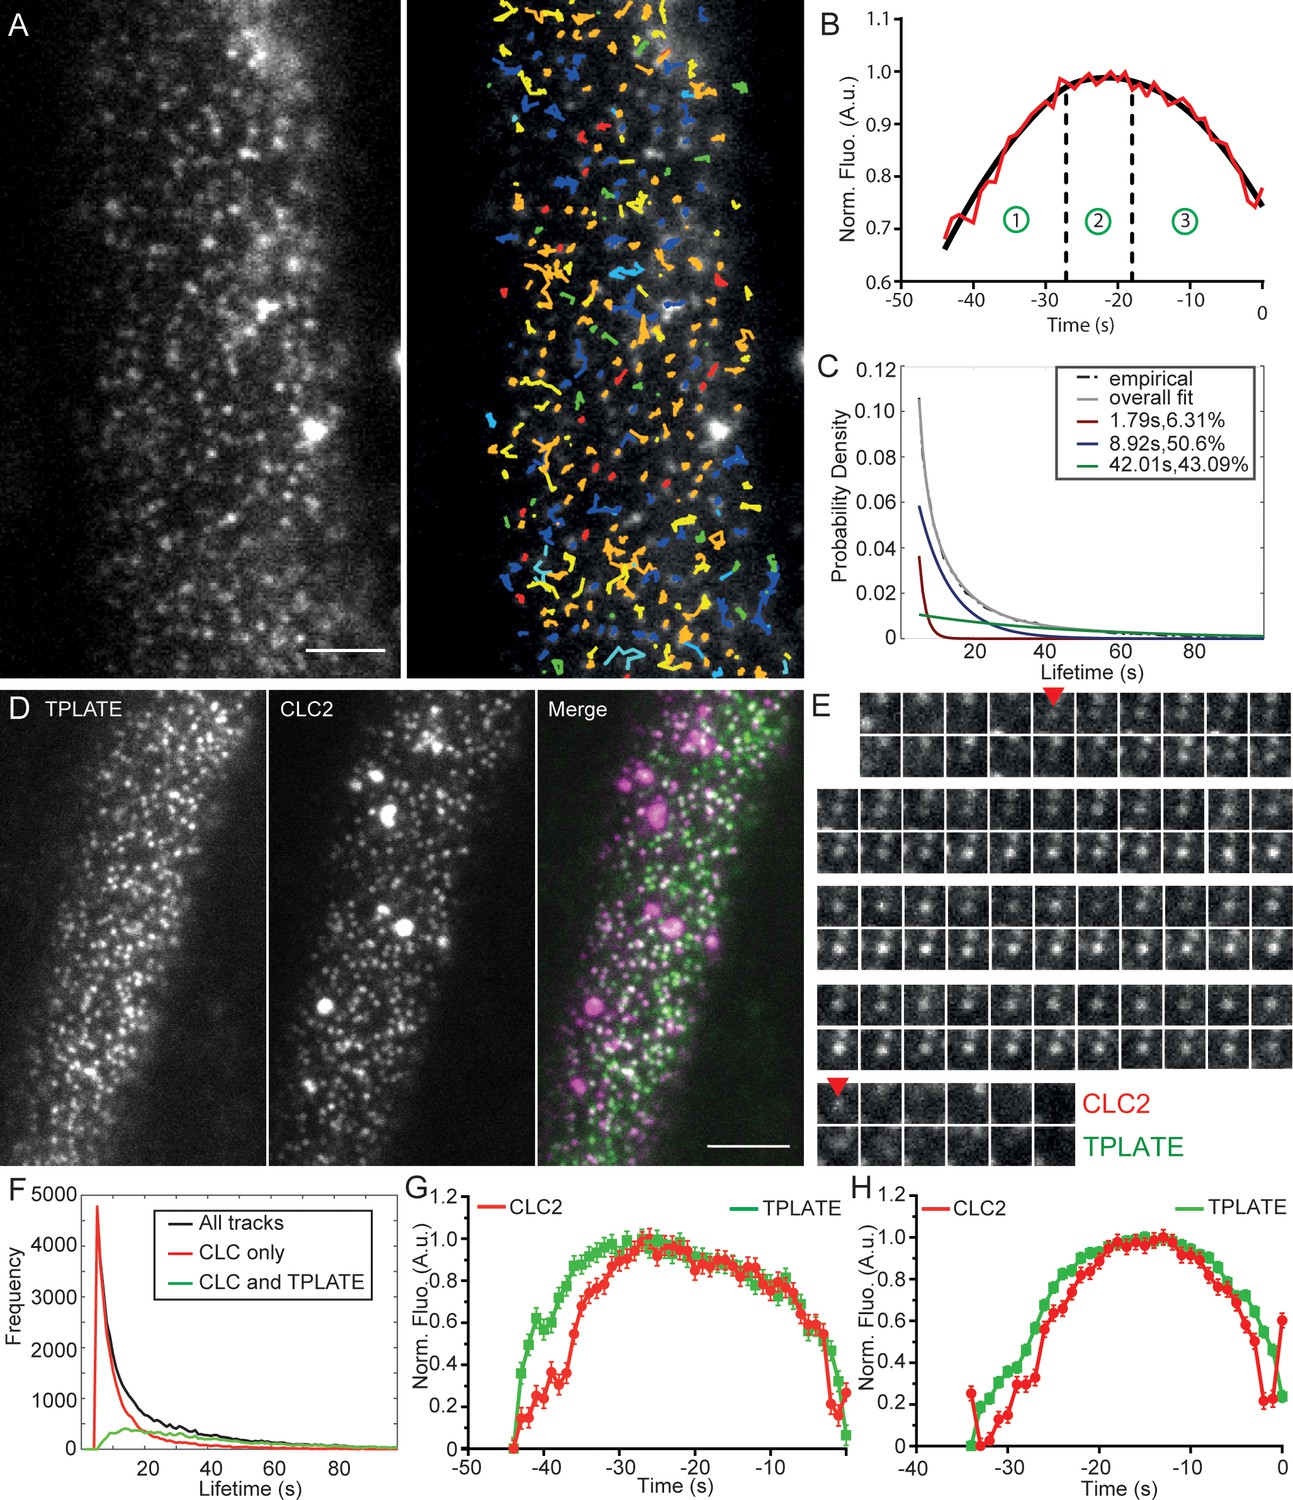
Characterization of clathrin kinetics at the cell surface.
(A) TIRF-M image of clathrin foci in the root epidermal cell expressing CLC2-GFP (left) and the automated tracking results (right). (B) Intensity-time course of the combined mean fluorescence profile (along with a smoothening curve) of CLC2-GFP in root epidermal cells. The intensity profile depicts different CCP developmental phases; (1) assembly, (2) maturation and (3) scission. The points represent mean ± SEM of the mean intensity of all the trajectories that have the mean lifetimes. N = 5 cells from individual roots, 182 trajectories. (C) Normalized histogram of CLC2-GFP tracks (black) with three exponential distributions fitted (red, blue and green). The inset denotes the mean lifetime and the percentage contribution to the total population of each sub population. N = 12 cells from individual roots, 149162 tracks. Also see Figure 2—figure supplement 2. (D) Representative dual channel TIRF-M image of root epidermal cell expressing TPLATE-GFP and CLC2-RFP. (E) Time series of an isolated endocytic event positive for CLC2-RFP and TPLATE-GFP. Arrows mark the appearance and the disappearance of CLC2. Quantification of this event is shown in figure S4. (F) Frequency distribution of the lifetimes of clathrin and TPLATE tracks. The inset indicates the color codes marking the frequency distributions of different sets of tracks. N = 6 cells from individual roots, 45337 tracks. (G) Clathrin departure assay of TPLATE-GFP and CLC-tagRFP in root epidermal cells. N = 6 cells from individual roots, 16756 tracks. (H) Clathrin departure assay of TPLATE-GFP and CLC-tagRFP in hypocotyl. N = 3 cells from individual hypocotyls, 1460 tracks. Scale bars; 10 µm (A and D).
-
Figure 2—source data 1
Source data and code for the quantification for Figure 2.
- https://cdn.elifesciences.org/articles/52067/elife-52067-fig2-data1-v2.zip
Figure 2—figure supplement 1
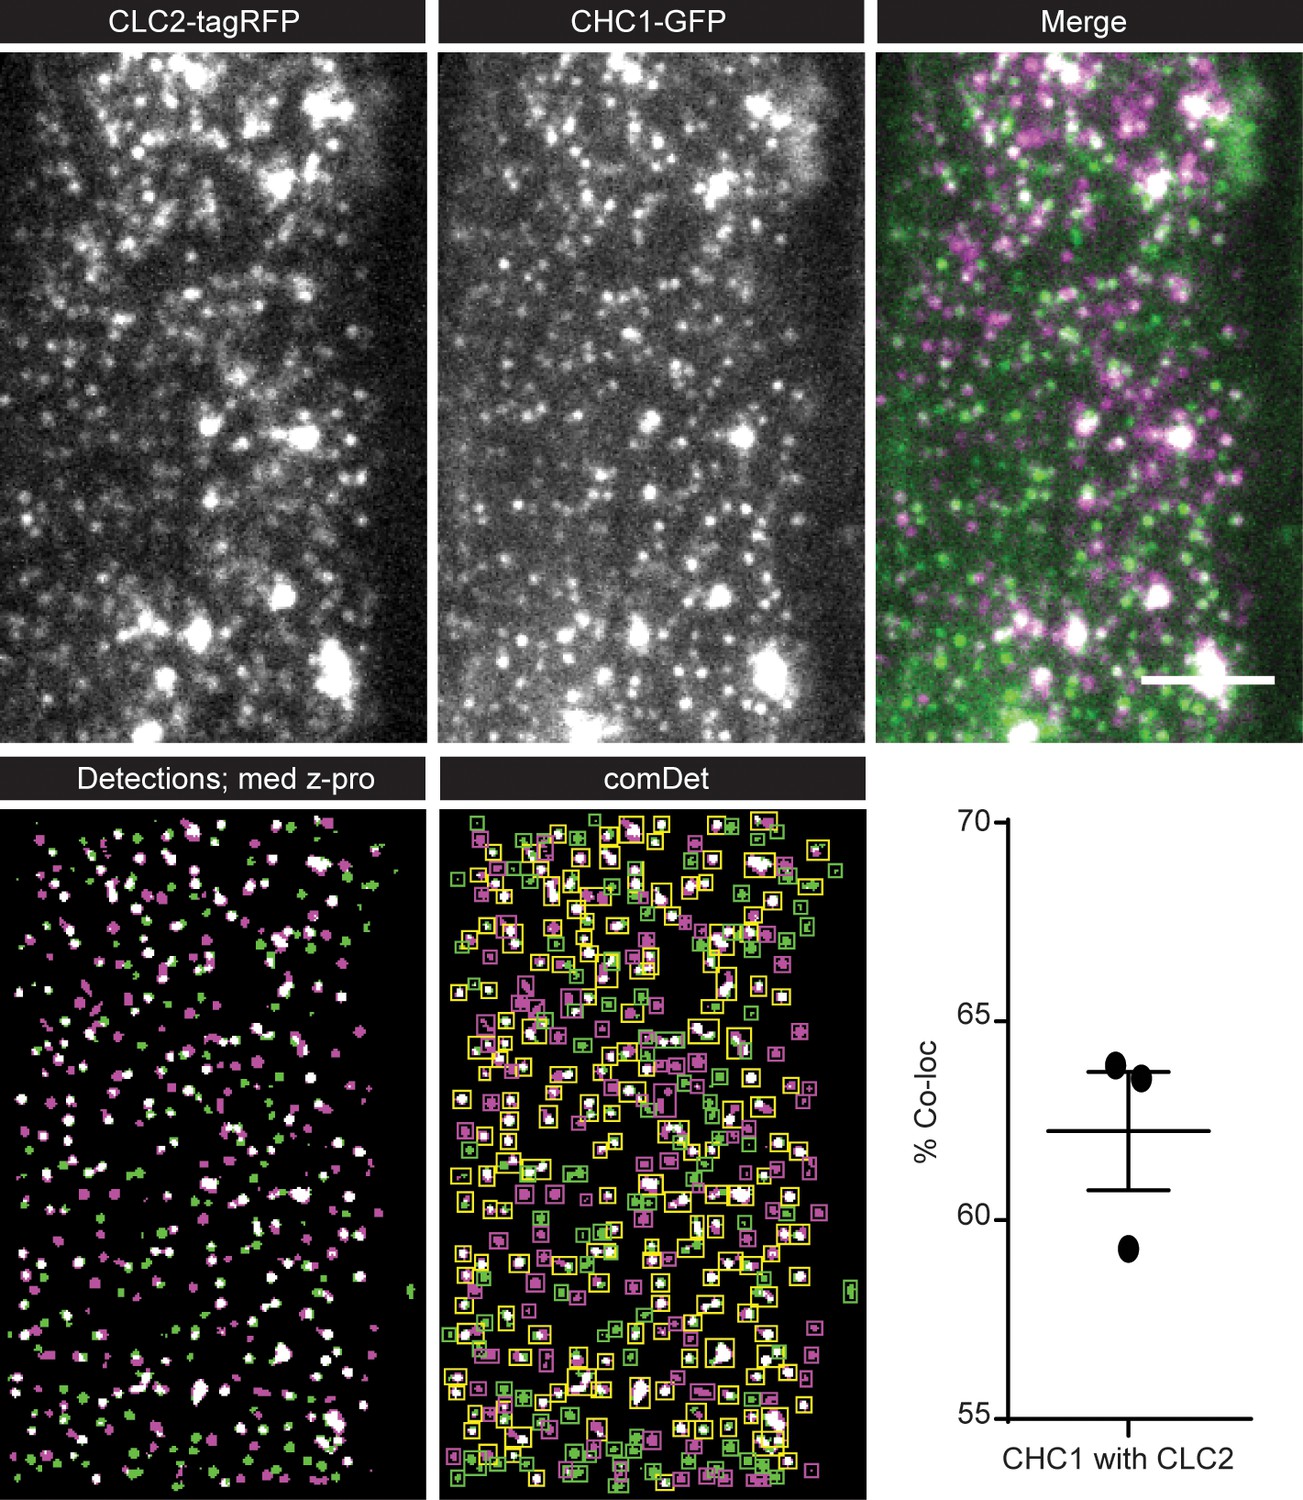
Co-localization of CHC1 and CLC2.
(Top row) Example TIRF-M image of a root epidermal cell expressing CHC1-GFP and CLC2-tagRFP. (Bottom row) A median max Z projection of 10 frames containing the automated significant detections for CHC1 (green) and CLC2 (magenta). Yellow squares denote co-localization detections. A bar chart showing the percentage of CHC1 which has a partner CLC2 foci. N = 3 individual roots. Scale bar, 5 µm.
Figure 2—figure supplement 2
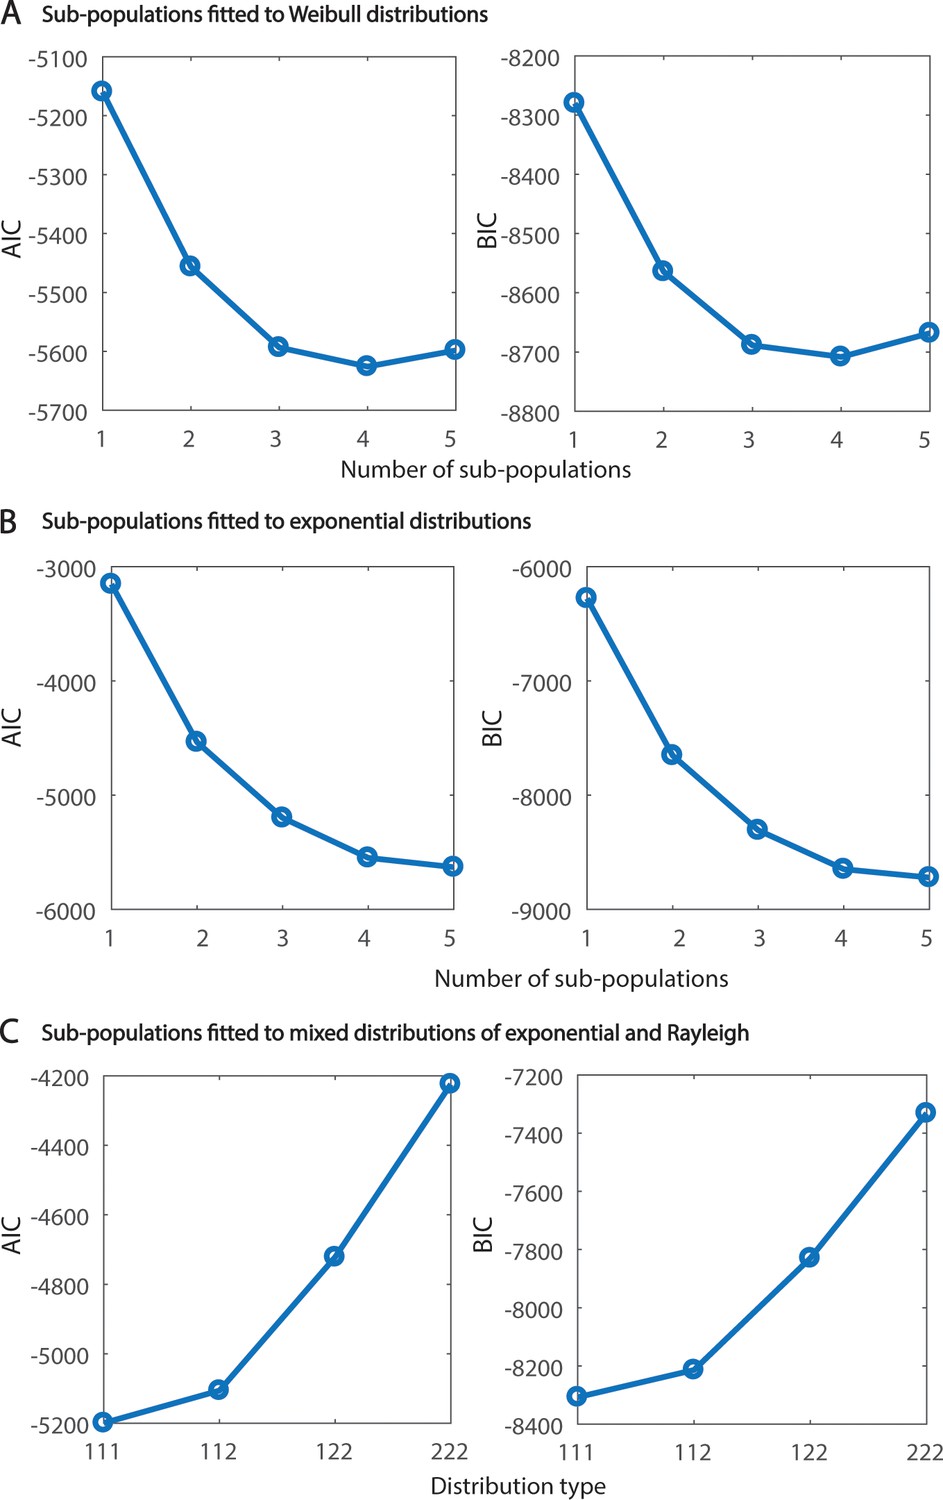
Goodness of fit analysis of clathrin sub-populations.
(A and B) AIC and BIC projecting the goodness of fit for the clathrin lifetime histogram subjected to fitting 1 to 5 sub-populations with Weibull distributions (A) or exponential distributions (B). (C) AIC and BIC projecting the goodness of fit for the clathrin lifetime histogram subjected to fitting three sub-populations with a both Rayleigh (λ = 2) and Exponential (λ = 1) distributions. Note that three exponential distributions produce the best fit.
Figure 2—figure supplement 3
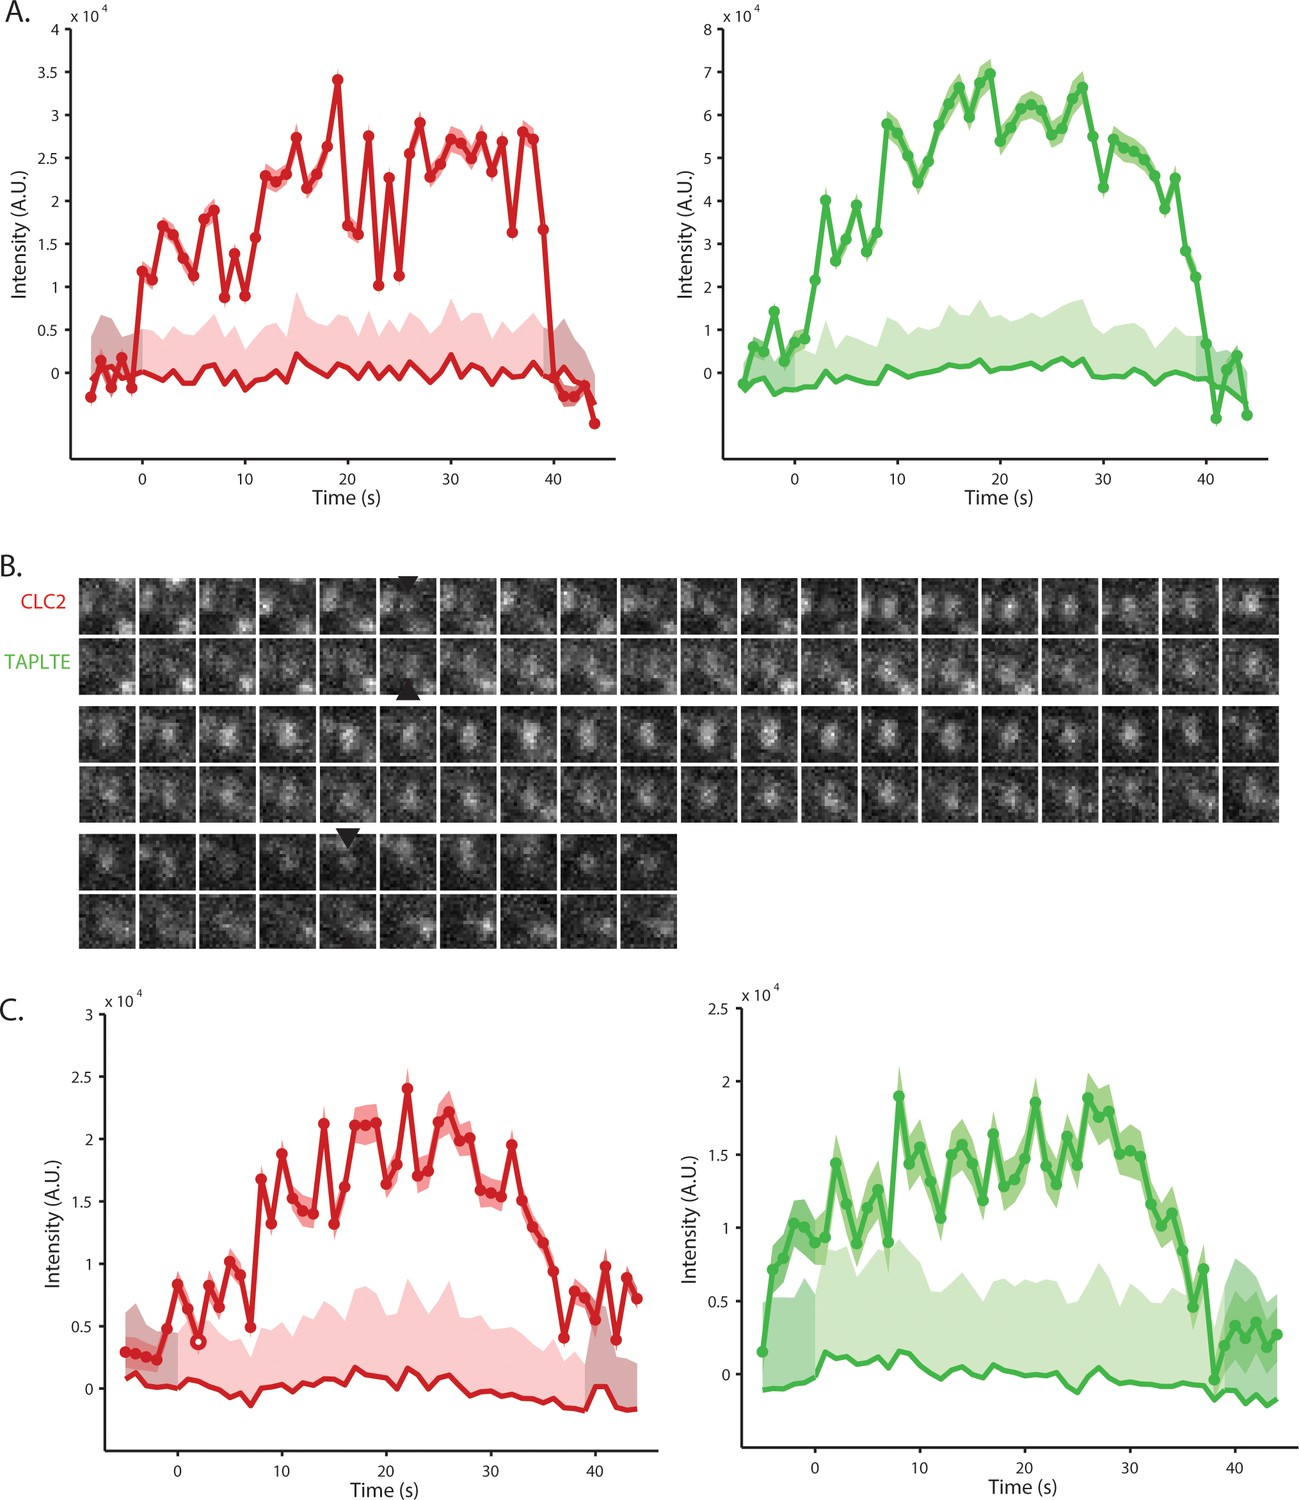
Example TPLATE and CLC2 positive events.
(A) Fluorescent quantification of the example TPLATE x CLC spot in Figure 2E. (B) A further example of a TPLATE x CLC events on the PM of root epidermal cells using TIRF-M. The black arrows note the detection of the event. (C) The Fluorescent quantification of the example event in B.
Figure 3 with 3 supplements

Localization and functional importance of actin during endocytosis.
(A) SEM image of the unroofed protoplasts showing the main and subsidiary filaments of actin in close proximity to the PM. (B) Dual channel TIRF image of hypocotyl epidermal cell expressing ABD2-GFP and CLC2-mKO. The insert (yellow box) shows a magnified merge of the channels. Also see Figure S4B. (C) Example confocal airy-scan images of root hair cell expressing Lifeact-YFP (left) and the root hair cell expressing DRP1C-GFP (right). (D) Normalized lifetime distributions, average lifetime and densities of CLC2-GFP of root (upper panel) and hypocotyl (lower panel) epidermal cells in the absence (black) or presence (red) of LatB (roots; 10 µM, 10 mins, hypocotyl; 10 µM, 1 hr), measured by TIRF-M. Root: mock, 5 cells from individual roots, (32991 tracks), LatB, 4 cells from individual roots, (25517 tracks). Hypocotyl: mock, 3 cells from individual hypocotyls, (10883 tracks), LatB, 4 cells from individual hypocotyls, (12623 tracks). Error bars represent mean ± SEM. Two-sided unpaired T tests found there were no significant differences (Average lifetimes: hypocotyl p=0.43; root p=0.53. Average density: hypocotyl p=0.42; root p=0.95). (See also Supplementary file 1 table 2 for other markers). (E) Smoothened CCP intensity profile of the mean long-lived CLC2-GFP population in root epidermal cells in the absence (black) or presence (red) of LatB (10 µM, 10 mins). Mock, 6 cells from individual roots, 182 trajectories, LatB, 4 cells from individual roots, 122 trajectories. The extrapolation lines mark the different CCP development phases. The bottom bar plot represents the phase transitions computed individually from the trajectories of each root. The dotted bars represent the whole time course of CCP development; the solid lines with error bars mark the mean ± SD of the transition point between phases. Note that there are no significant differences in the different phases in the presence of LatB. One-sided Mann-Whitney U test; assembly p=0.31, maturation p=0.48 (also see Figure S4D). (F) Confocal microscopy images of root epidermis expressing fABD2-GFP after mock or LatB treatment (20 µM, 30 mins). Actin cytoskeleton is disrupted but FM4-64 is still endocytosed. N = 2 experimental repeats; at least 10 seedlings per condition. (G) TIRF-M images of the hypocotyl epidermal cells expressing FLS2-GFP either with or without flg22 (10 µM, 0.5 hr) treatment, and also cells pretreated with 1 hr of mock or LatB (10 µM, 1 hr) with co-treatment of flg22. Yellow arrows highlight endosomal structures containing FLS2. N = 2 experimental repeats, with nine hypocotyls per condition. (H) PIN2-Dendra endocytic rate, determined by the change of PM PIN2 intensity over time, after LatB (10 µM, 45 mins) compared to mock treatment (top). The dots represent the mean intensity and the dotted lines represent the 95% CI. No significant difference is observed between the slope of the curves; LMER - random effects for position; χ2- 2.5923; df = 1; p=0.107; N = 2, five seedlings per condition. (Bottom) PIN2-Dendra endocytic rate with the mock induction conditions or induction of AXL2 over-expression (AXL2-OX) for 24 hr (bottom). The slope of the curve for AXL2-OX is significantly lower than control conditions; LMER - random effects for position; χ2 = 78.095; df = 1; p<2.2e-16 ***; N = 2 experimental repeats, four seedlings per condition; all the epidermal cells in the root meristem were considered. Scale bars; 0.5 µm (A), 5 µm (B,G), 4 µm (C), 10 µm (F).
-
Figure 3—source data 1
Source data and code for the quantification for Figure 3.
- https://cdn.elifesciences.org/articles/52067/elife-52067-fig3-data1-v2.zip
Figure 3—figure supplement 1
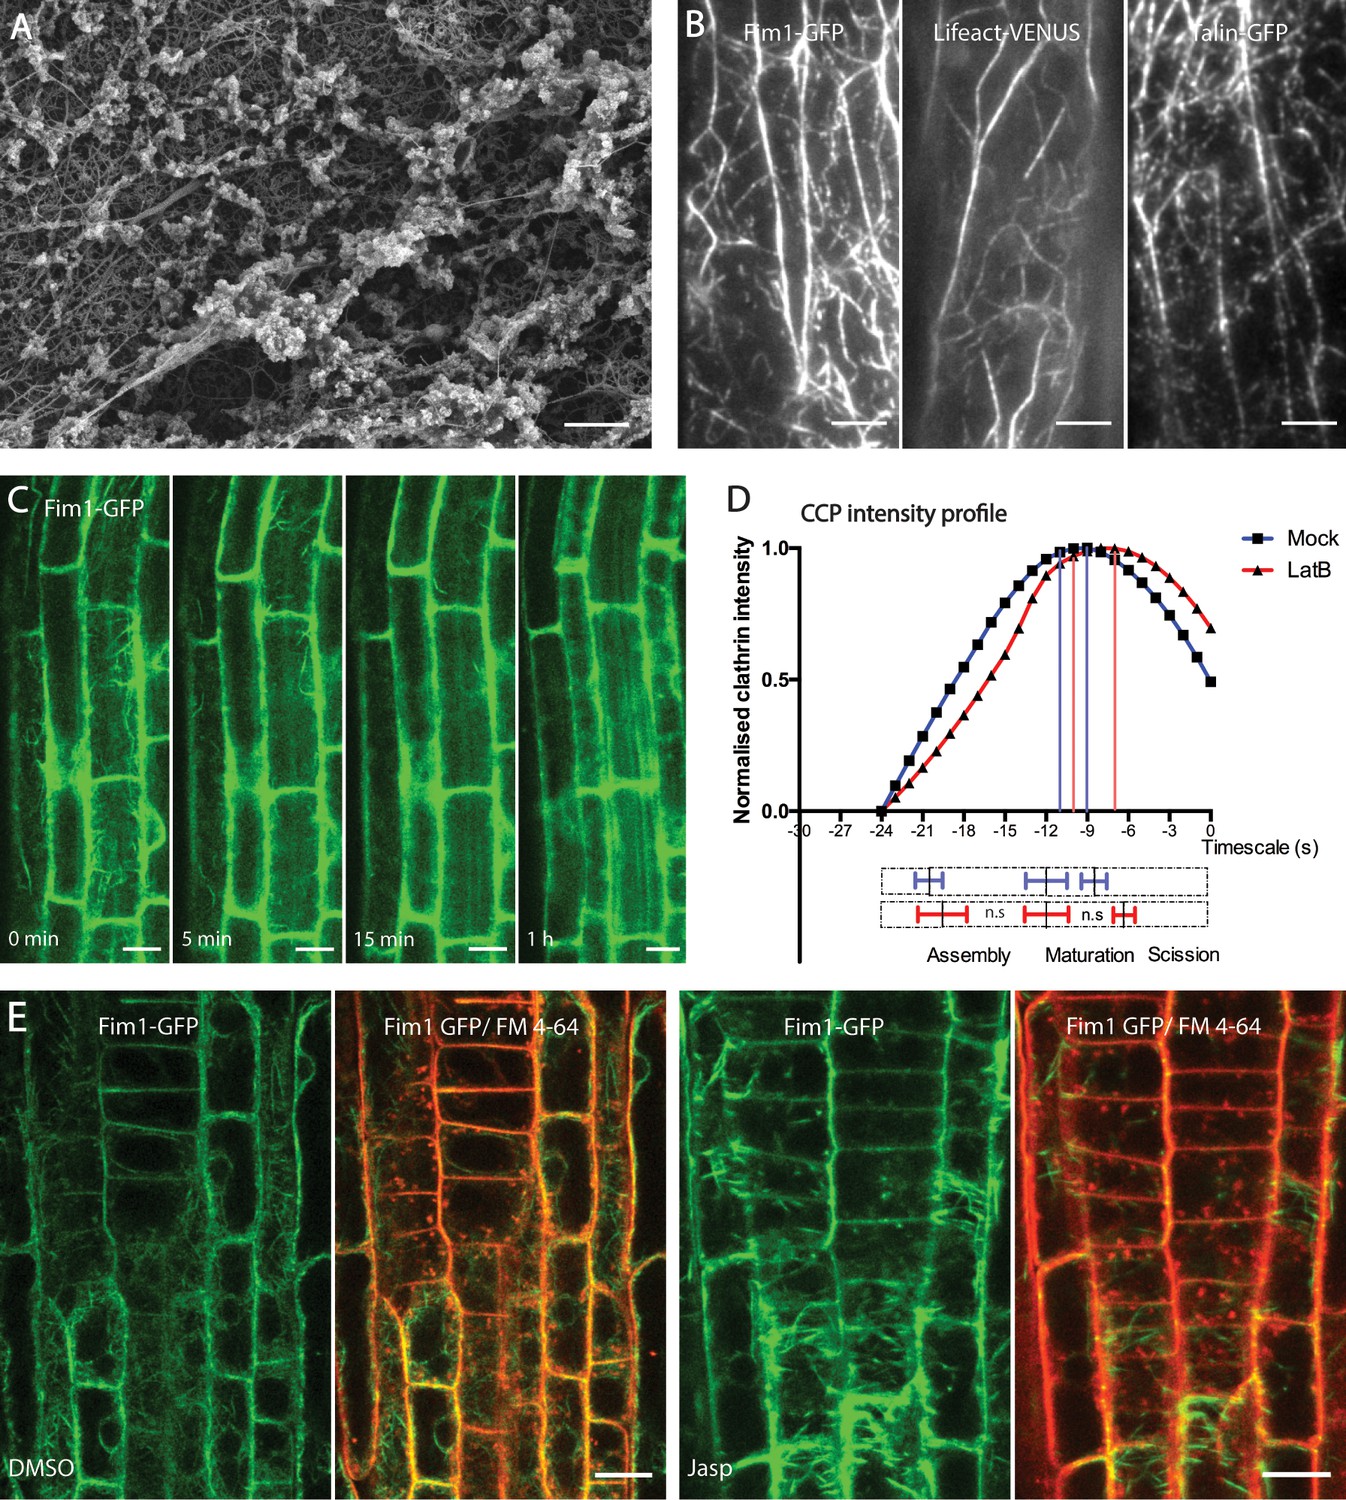
Localization and functional characterization of actin during endocytosis.
(A) Example SEM image of unroofed protoplast showing the cytoskeletal and intracellular membrane tightly linked with other cellular components. Scale bar: 0.5 µm. (B) Representative TIRF-M image showing the structure of cortical actin in hypocotyl expressing Fim1-GFP, Lifeact-VENUS and mTalin-GFP. Scale bar: 5 µm. (C) Representative confocal microscopy images of root epidermal cells expressing Fim1-GFP after LatB treatment. Note that majority of F-actin is depolymerized by 5 min. N = 2, with seven roots. Scale bar: 15 µm. (D) Smoothened CCP intensity profile of the CLC2-GFP population having the mean lifetimes of 17–24 s in root epidermal cells in the absence (black) or presence (red) of LatB (10 uM, 10 mins). N = 6 cells for mock, 487 trajectories; N = 4 cells for LatB treatment, 431 trajectories. The bottom bar plot represents the phase transitions computed individually from the trajectories of each root. The dotted bars represent the whole-time scale of CCP development; the solid lines with error bars mark the mean ± SD of the transition point between phases. Note that there is no significant change in the length of the assembly or the maturation phase after LatB treatment. One-sided Mann-Whitney U test - for assembly p=0.44 – for maturation p=0.08. (E) Representative confocal microscopy images of root epidermis expressing Fim1-GFP (marking actin) after mock of Jasp treatment (5 µM, 60 mins); eight seedlings per condition. FM4-64 internalization occurs uninhibited despite deformities in actin filaments. Scale bars: 10 µm.
Figure 3—video 1
Dynamics of CCVs after actin perturbation.
Dual channel TIRF-M imaging of hypocotyl epidermal cells expressing ABD2-GFP and CLC2-mKO after treatment with Jasp – 10 µM for 1.5 hr. Movie shows the arrested actin network and the CCVs still forming and getting removed after the treatment comparable to the mock condition. Time label is in seconds. Scale bars: 5 µm.
Figure 3—video 2
Dynamics of CCVs after actin perturbation.
Dual channel TIRF-M imaging of hypocotyl epidermal cells expressing ABD2-GFP and CLC2-mKO after treatment with LatB – 10 µM for 1 hr. Movie shows the depolymerized actin network and the CCVs still forming and getting removed after the treatment comparable to the mock condition. Time label is in seconds. Scale bars: 5 µm.
Figure 4 with 2 supplements
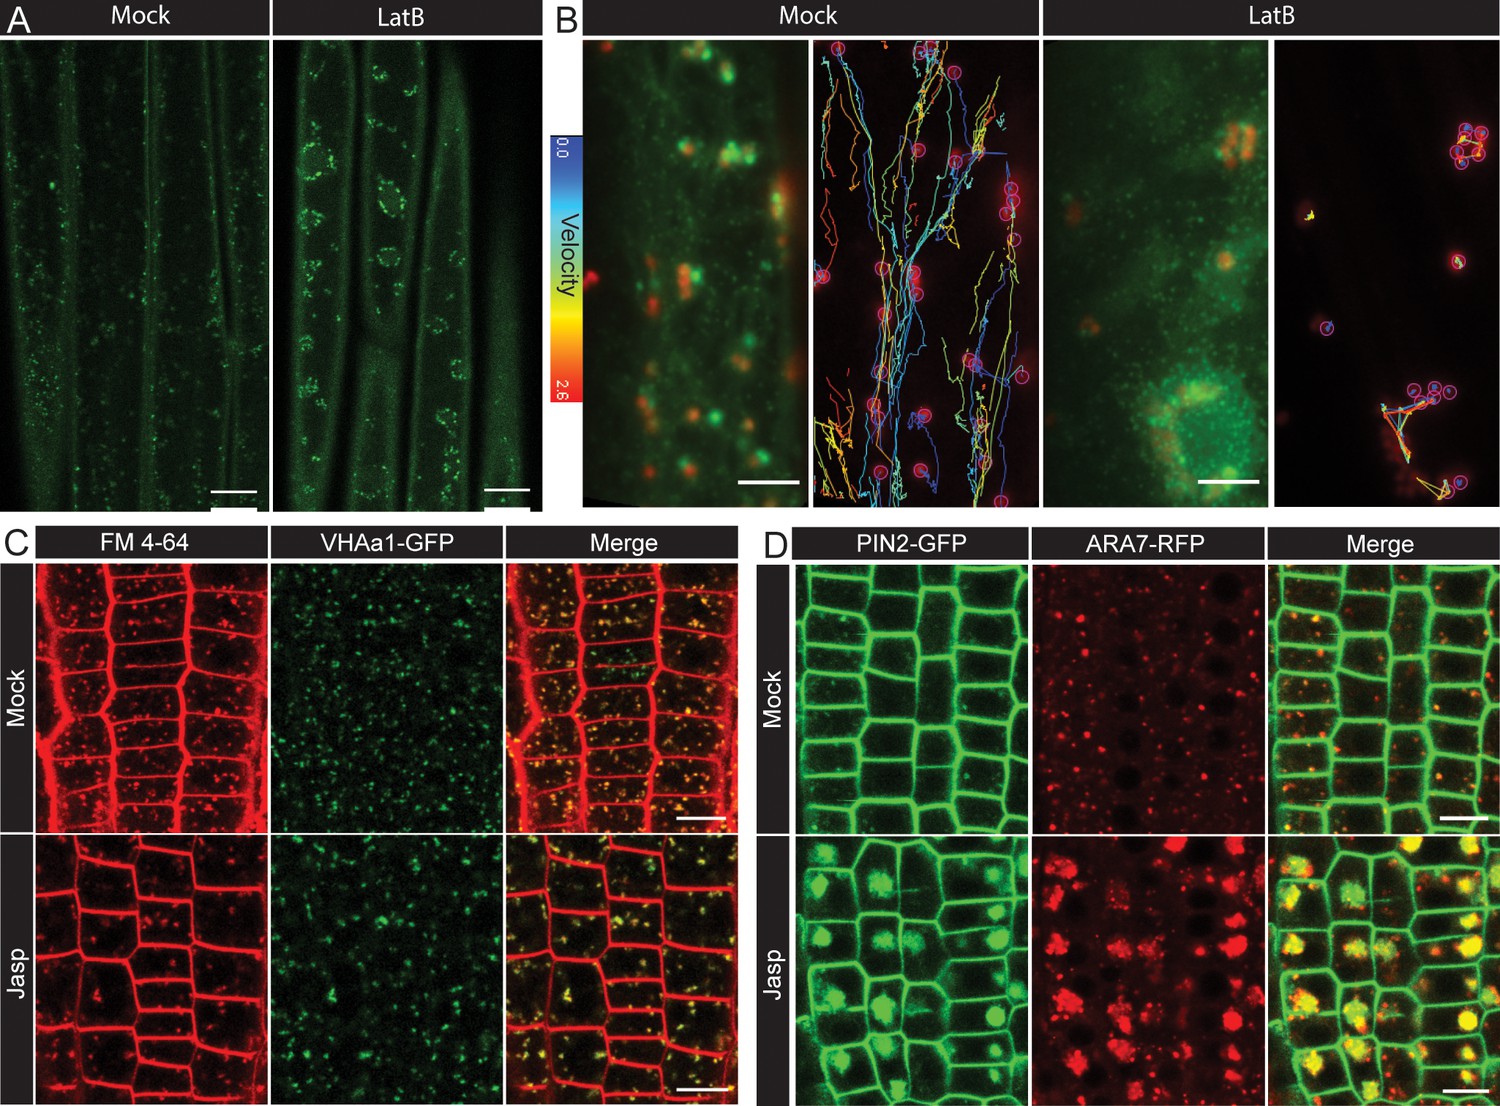
Role of actin in post-endocytic trafficking.
(A) Representative confocal microcopy images of EE/TGN (marked by CLC2-GFP) aggregated after mock or LatB (10 µM, 1 hr) treatment in hypocotyl epidermal cells. Observations were made from five individual hypocotyls per condition. (B) Representative TIRF-M images of Golgi (ST-RFP) and EE/TGN (CLC2-GFP) structures (left panel; see also the Figure 4—video 2) and the velocity profile by tracking the Golgi (right) after mock and LatB (10 µM; 1 hr) treatment. Observations were made from ≥15 cells per condition. The tracks are very short and belong to low velocity profile after LatB. (C) Representative confocal microcopy images of the root epidermis expressing VHA-a1-GFP with either mock or Jasp treatment (5 µM, 30 mins). Observations were make from seven roots per condition. (D) Representative confocal microcopy images of the root epidermis expressing PIN2-GFP and ARA7-RFP (marking LE) after mock of Jasp (5 µM, 5.5 hr). Observations were made from eight roots per condition. Scale bars; 15 µm (A), 5 µm (B), 10 µm (C, D).
Figure 4—video 1
Actin mediated dynamics of the EE/TGN system.
Dual channel TIRF-M imaging of hypocotyl epidermal cells expressing ABD2-GFP and CLC2-mKO. The EE/TGN could be observed to be constantly moving along the actin filaments. Time label is in seconds. Scale bar: 2 µm.
Figure 4—video 2
Dynamics of the Golgi- EE/TGN after actin perturbation.
Dual channel TIRF-M imaging of hypocotyl epidermal cells expressing ST-RFP and CLC2-GFP. The dynamics of the Golgi together with the EE/TGN after mock and LatB treatment (10 µM; 1 hr) are shown. The local aggregation of Golgi - EE/TGN after LatB could be clearly observed. Time label is in seconds. Scale bar: 5 µm.
Figure 5 with 3 supplements
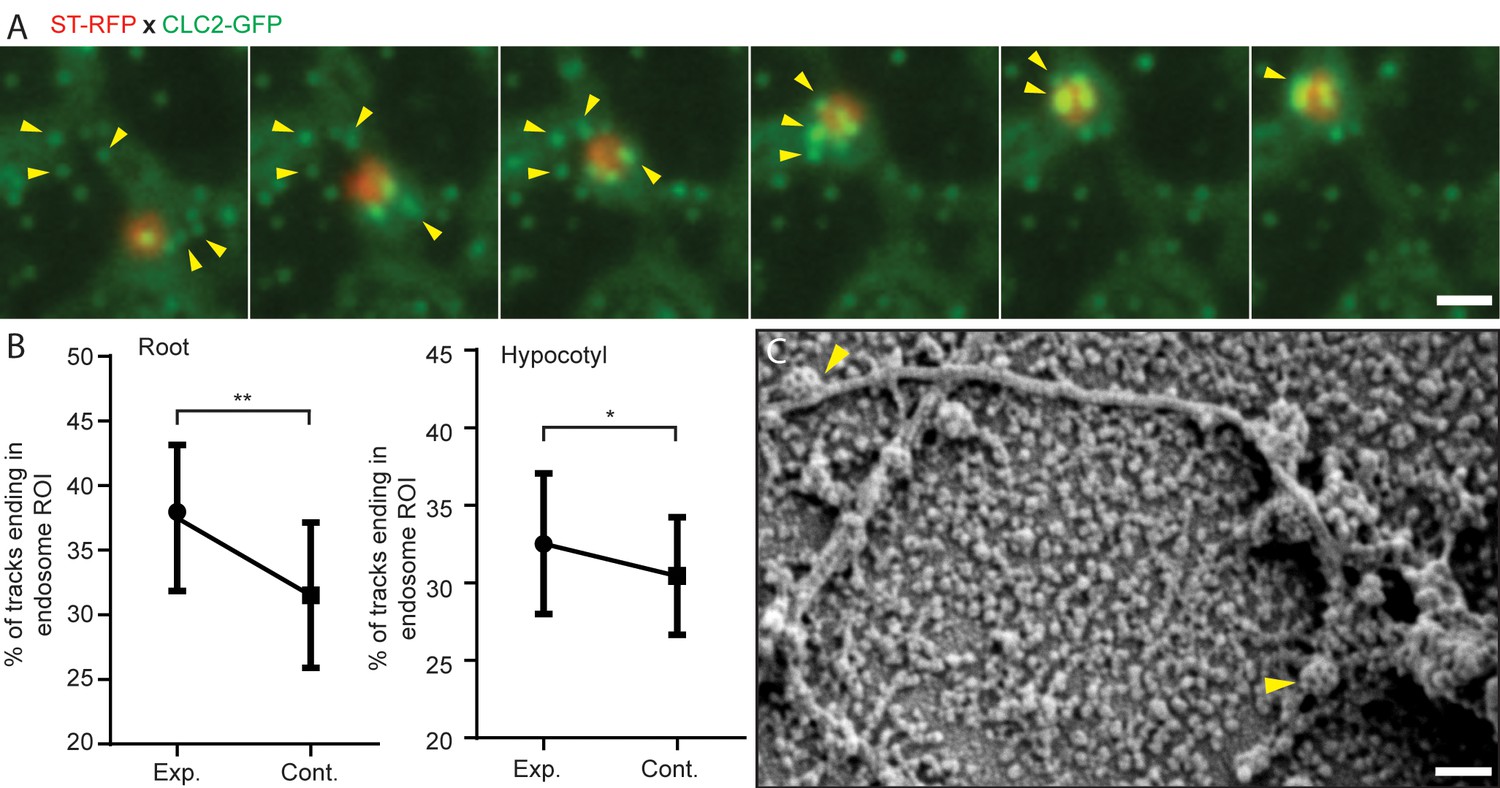
Role of actin and early endosome movement in CME.
(A) TIRF-M images of hypocotyl epidermal cells expressing ST-RFP and CLC2-GFP. The Golgi apparatus (marked by ST-RFP) which move towards the endocytosed CCVs (marked by CLC2-GFP) are marked by arrows. Time interval: 1.9 s. (See also Figure 5—video 2). (B) Endosomal pick-up analysis of CCVs positive for both CLC2-tagRFP and TPLATE-GFP in root (left) and hypocotyl (right) cells. Higher proportion of CME events terminates when EE passes by below the PM. N = 6 root cells and 622 endosome tracks, six hypocotyl cells and 1539 endosome tracks. The plot represents the mean ± SD. Paired two-sided t test p=0.0066** for root and p=0.0223* for hypocotyl. (C) SEM image of unroofed protoplasts, where arrows depict CCVs attached to a cytoskeleton filament. Scale bars, 1 µm (A), 100 nm (C).
-
Figure 5—source data 1
Source data for the quantification in Figure 5.
- https://cdn.elifesciences.org/articles/52067/elife-52067-fig5-data1-v2.zip
Figure 5—video 1
EE/TGN moving along actin picking up an endocytosed CCV.
Dual channel TIRF-M imaging of hypocotyl epidermal cells expressing ABD2-GFP and CLC2-mKO. The CCV (arrowed) could be observed being collected by the EE/TGN (boxed) moving along the actin filament. Time label is in seconds. Scale bar: 1.5 µm.
Figure 5—video 2
Collection of endocytosed CCVs by the EE/TGN.
Dual channel TIRF-M imaging of hypocotyl epidermal cells expressing ST-RFP and CLC2-GFP. Aggregation of the endocytosed CCVs (arrowed) on the trans-side of the Golgi could be observed as the Golgi is moved along the cortical surface. Time label is in seconds. Scale bar: 2 µm.
Figure 5—video 3
Dynamic endosomes enhancing the local rate of CME termination.
An example TIRF-M time lapse movie of root epidermal cells expression TPLATE-GFP and CLC-tagRFP, but only the CLC channel is shown. The left shows the mobile experimental endosome tracks (red circles and blue tracks). The right shows the control endosome tracks. Red squares denote the endosome ROI, green circles denote tracks present within these endosomal ROI and are positive for both TPLATE and CLC. Black astricts denote the termination of CME. Scale bar, 5 µm.
Figure 6 with 2 supplements
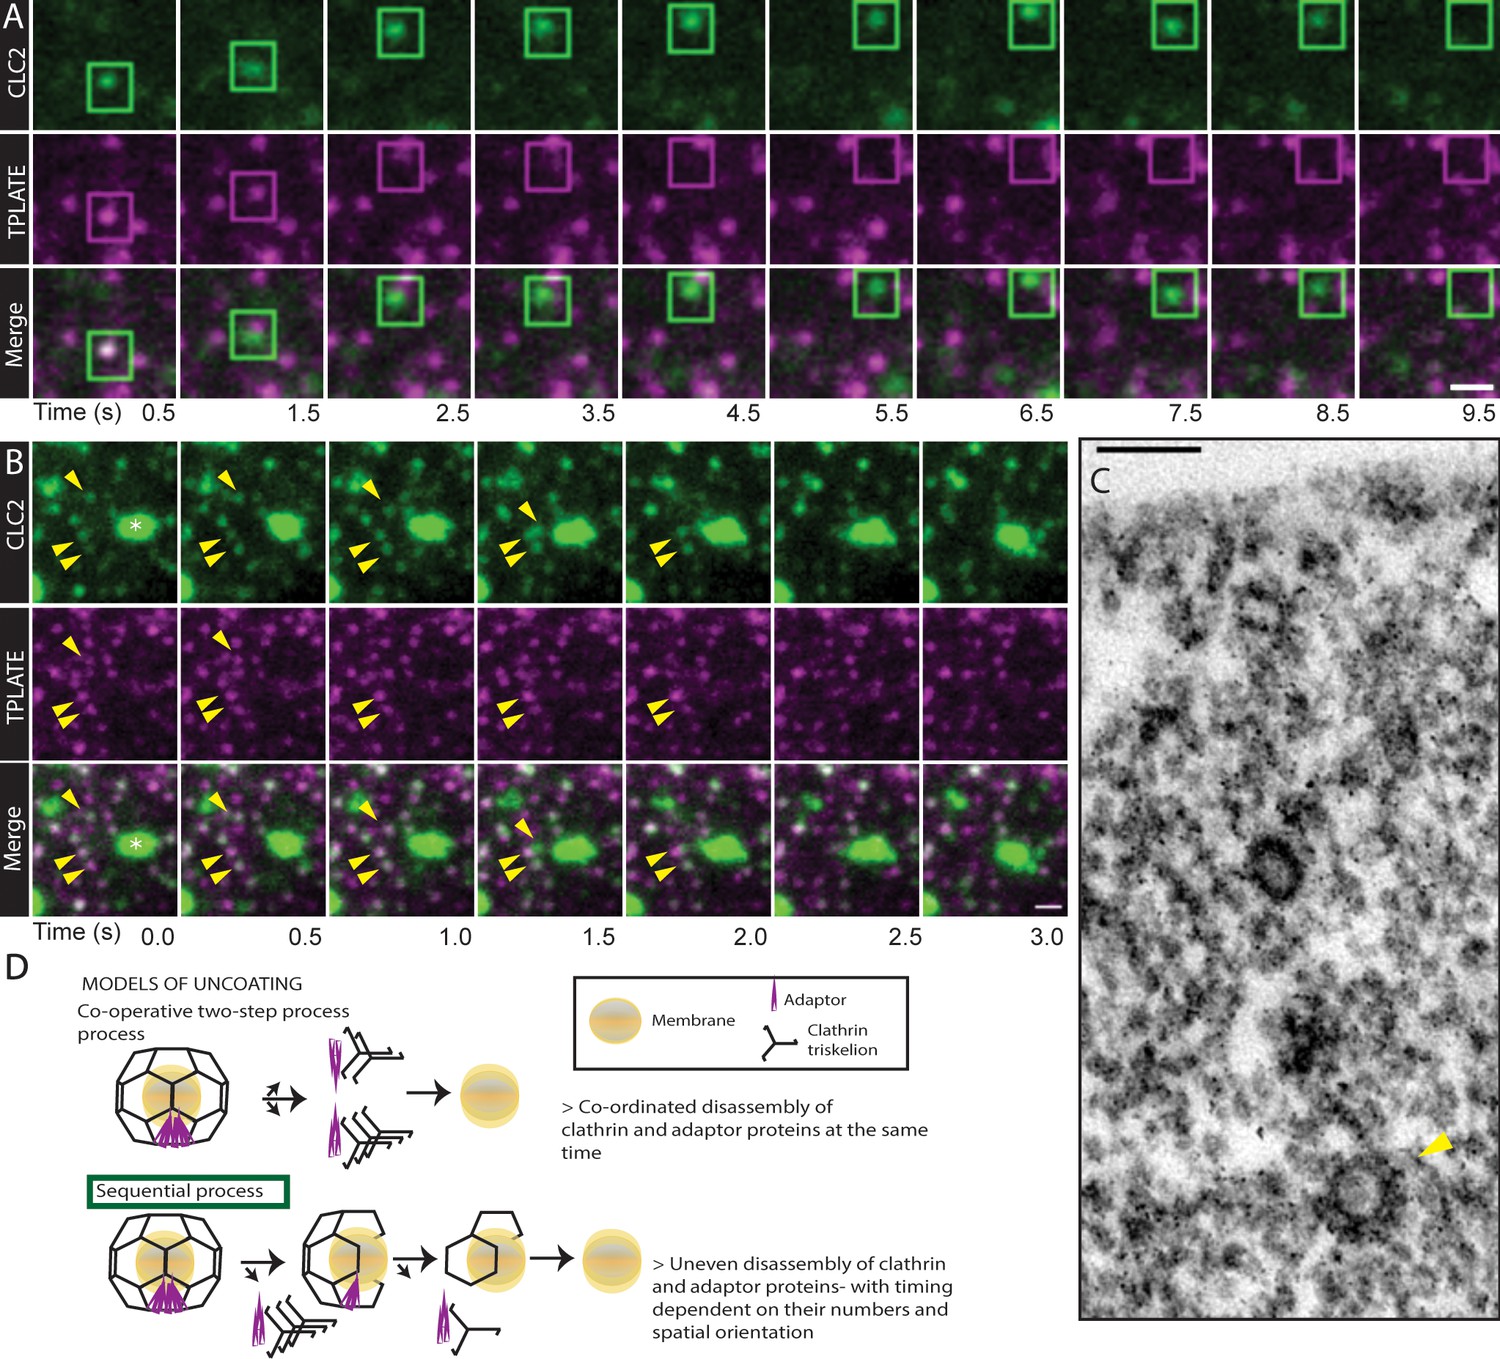
Uncoating of CCVs.
(A and B) TIRF-M images of hypocotyl epidermal cells expressing TPLATE-GFP and CLC2-tagRFP. CLC2 marks both endocytic foci (smaller foci) and the EE/TGN (larger structures). (A) The boxed CCV is followed after internalization into cytosol. Time interval: 1 s. See also Figure 6—video 2. N = 19 events pooled from 5 cells. (B) CCVs indicated by arrows reach the stationary EE/TGN while still containing clathrin (white asterisk). Time interval: 0.5 s. See also Figure 6—video 1. (C) TEM image of a resin embedded and ultra-thin sectioned protoplast. The yellow arrow denotes a CCV with partially removed coat deeper in the cytosol. (D) Models of clathrin coat removal. (top) Co-operative disassembly, where the disassembly of clathrin coat and adaptor TPLATE is temporally coordinated. (bottom) Sequential disassembly, where adaptor is able to disappear entirely before clathrin. Scale bars, 1 µm (A, B), 100 nm (C).
Figure 6—video 1
Uncoating process as the CCVs reach the stationary EE/TGN.
Dual channel TIRF imaging of hypocotyl epidermal cells expressing TPLATE-GFP x CLC2-RFP. CCVs (arrowed) moving to the stationary EE/TGN lose TPLATE signal by the time of reaching the EE/TGN compartment. Time label is in seconds. Scale bar: 1 µm.
Figure 6—video 2
Uncoating process of a fully developed CCV.
Dual channel TIRF imaging of hypocotyl epidermal cells expressing TPLATE-GFP x CLC2-RFP. CCV moving away from the PM after scission loses TPLATE signal before that of clathrin. Time label is in seconds. Scale bar: 1 µm.
Figure 7

Model for post-endocytic trafficking of CCVs.
Trafficking of the fully developed CCVs and the EE/TGN compartments along actin represented in different scenarios 1) Delayed sequential uncoating of the CCV during the transport to the EE/TGN 2) Actin subsidiary filament whipping away the CCV after scission transporting it to the EE/TGN 3) EE/TGN directly picking up the CCV after scission.
Videos
Video 1
Actin whipping away the CCVs.
Dual channel TIRF-M imaging of hypocotyl epidermal cells expressing ABD2-GFP and CLC2-mKO. Spatial and temporal correlation between appearance of actin subsidiary filaments and the disappearance of CCVs could be seen. Time label is in seconds. Scale bar: 1 µm.
Video 2
CCVs losing the coat.
TIRF imaging of hypocotyl epidermal cells expressing ST-RFP and CLC2-GFP. CCVs (arrowed) that leave the membrane lose the clathrin coat before reaching EE/TGN. Time label is in seconds. Scale bar: 2 µm.
Tables
Key resources table
| Reagent type (species) or resource | Designation | Source or reference | Identifiers | Additional information |
|---|---|---|---|---|
| Cell line (Arabidopsis thaliana, Col-0) | Suspension cultured root protoplasts | |||
| Biological sample (Arabidopsis thaliana, Col-0) | Seedlings | |||
| Gene (Arabidopsis thaliana) | AP2A1 | The Arabidopsis Information Resource | AT5G22770 | |
| Gene (Arabidopsis thaliana) | Axl2 | The Arabidopsis Information Resource | AT4G12770 | |
| Gene (Arabidopsis thaliana) | CHC1 | The Arabidopsis Information Resource | AT3G11130 | |
| Gene (Arabidopsis thaliana) | CLC2 | The Arabidopsis Information Resource | AT2G40060 | |
| Gene (Arabidopsis thaliana) | Fim1 | The Arabidopsis Information Resource | AT4G26700 | |
| Gene (Arabidopsis thaliana) | FLS2 | The Arabidopsis Information Resource | AT5G46330 | |
| Gene (Arabidopsis thaliana) | PIN2 | The Arabidopsis Information Resource | AT5G57090 | |
| Gene (Arabidopsis thaliana) | Tplate | The Arabidopsis Information Resource | AT3G01780 | |
| Gene (Arabidopsis thaliana) | VHA-a1 | The Arabidopsis Information Resource | At2g28520 | |
| Genetic reagent (Arabidopsis thaliana) | pCLC2::CLC2-GFP | (Konopka et al., 2008) | ||
| Genetic reagent (Arabidopsis thaliana) | pLAT52::TPLATE-GFP x pRPS5::CLC2-RFP | (Gadeyne et al., 2014) | ||
| Genetic reagent (Arabidopsis thaliana) | 35S::ABD2-GFP | (Kost et al., 1998) | ||
| Genetic reagent (Arabidopsis thaliana) | p35S::CLC2-mKO | (Naramoto et al., 2010) | ||
| Genetic reagent (Arabidopsis thaliana) | pFLS2::FLS2-GFP x pUBQ10::mRFP-ARA7 | (Beck et al., 2012) | ||
| Genetic reagent (Arabidopsis thaliana) | XVE >> Axl2 x pPIN2::PIN2-Dendra | (Adamowski et al., 2018) | ||
| Genetic reagent (Arabidopsis thaliana) | pVHA-a1::VHA-a1-GFP | (Dettmer et al., 2006) | ||
| Genetic reagent (Arabidopsis thaliana) | pPIN2::PIN2-GFP | (Xu and Scheres, 2005) | ||
| Genetic reagent (Arabidopsis thaliana) | p35S::ARA7-mRFP | (Ueda et al., 2004) | ||
| Genetic reagent (Arabidopsis thaliana) | p35S::ST-RFP x pCLC2::CLC2-GFP | (Ito et al., 2012) | ||
| Chemical compound | LatrunculinB | Sigma Aldrich | L5288 | |
| Chemical compound | Jasplakinolide | Santa Cruz Biotechnology | sc-202191 | |
| Chemical compound | FM4-64 | ThermoFisher Scientific | T3166 |
Additional files
-
Supplementary file 1
Supplementary tables.
- https://cdn.elifesciences.org/articles/52067/elife-52067-supp1-v2.docx
-
Transparent reporting form
- https://cdn.elifesciences.org/articles/52067/elife-52067-transrepform-v2.docx
Download links
A two-part list of links to download the article, or parts of the article, in various formats.
Downloads (link to download the article as PDF)
Open citations (links to open the citations from this article in various online reference manager services)
Cite this article (links to download the citations from this article in formats compatible with various reference manager tools)
Evolutionarily unique mechanistic framework of clathrin-mediated endocytosis in plants
eLife 9:e52067.
https://doi.org/10.7554/eLife.52067


