Integration of locomotion and auditory signals in the mouse inferior colliculus
- Institute for Basic Science (IBS), Republic of Korea
- School of Medicine, Sungkyunkwan University, Republic of Korea
- Sungkyunkwan University, Republic of Korea
Figures
Figure 1 with 1 supplement
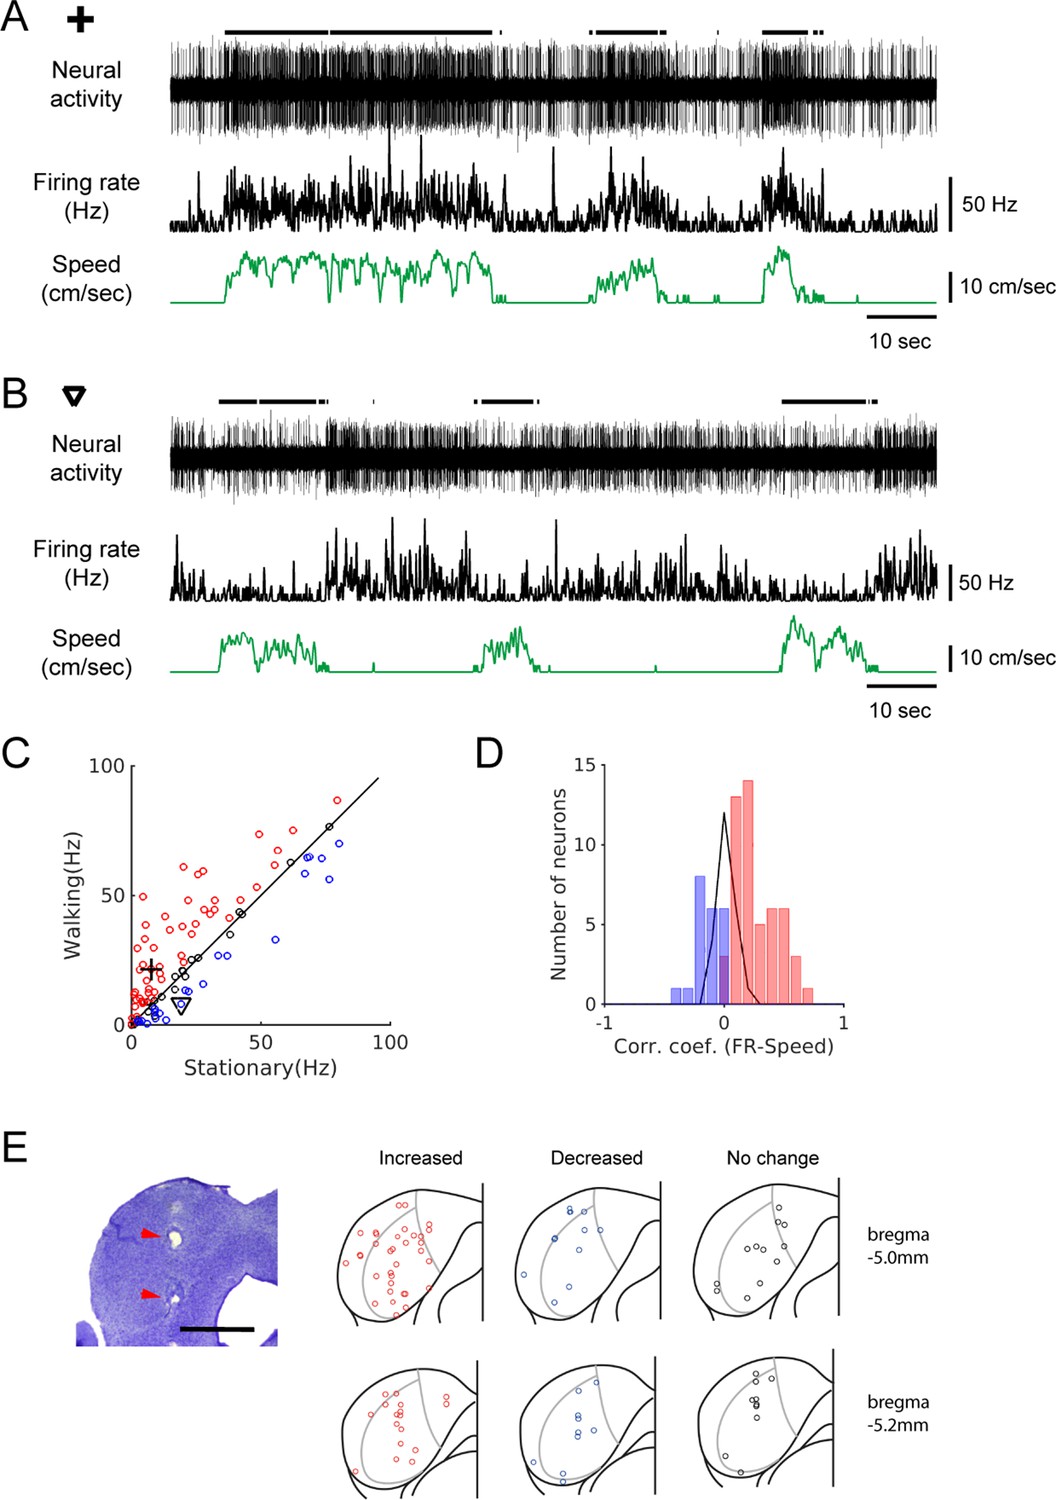
Spontaneous activity of IC neurons is modulated by locomotion.
(A-B) Example recordings of spontaneous activity in IC neurons. During walking periods, the neuron in A increased firing (from 7.6 Hz to 21.6 Hz), whereas the neuron in B decreased firing (from 19.1 Hz to 8.2 Hz). In both cases, the smoothed firing rates (black middle traces) exhibit significant correlations with the speed of the treadmill (green traces) (A: r = 0.59; B: r = −0.24). Thick black lines above the neural records indicate walking periods. (C) Population plot comparing average spontaneous firing rates between stationary and walking conditions (n = 96 neurons). Red circles: increased, blue: decreased, black: no significant change in firing. Values for the example neurons in A (cross) and B (triangle) are also shown. (D) Histogram of correlation coefficients between smoothed firing rate and speed (color code as in C). (E) Photomicrograph of a Nissl section with lesion sites marked with red arrow heads (scale bar = 1 mm), and reconstructed recording locations are shown in two transverse sections (5.0 and 5.2 mm posterior to the bregma, respectively). Color code as in C.
-
Figure 1—source data 1
Source data for spontaneous activity modulation, and walking sound recording and playback.
- https://cdn.elifesciences.org/articles/52228/elife-52228-fig1-data1-v2.xlsx
Figure 1—figure supplement 1
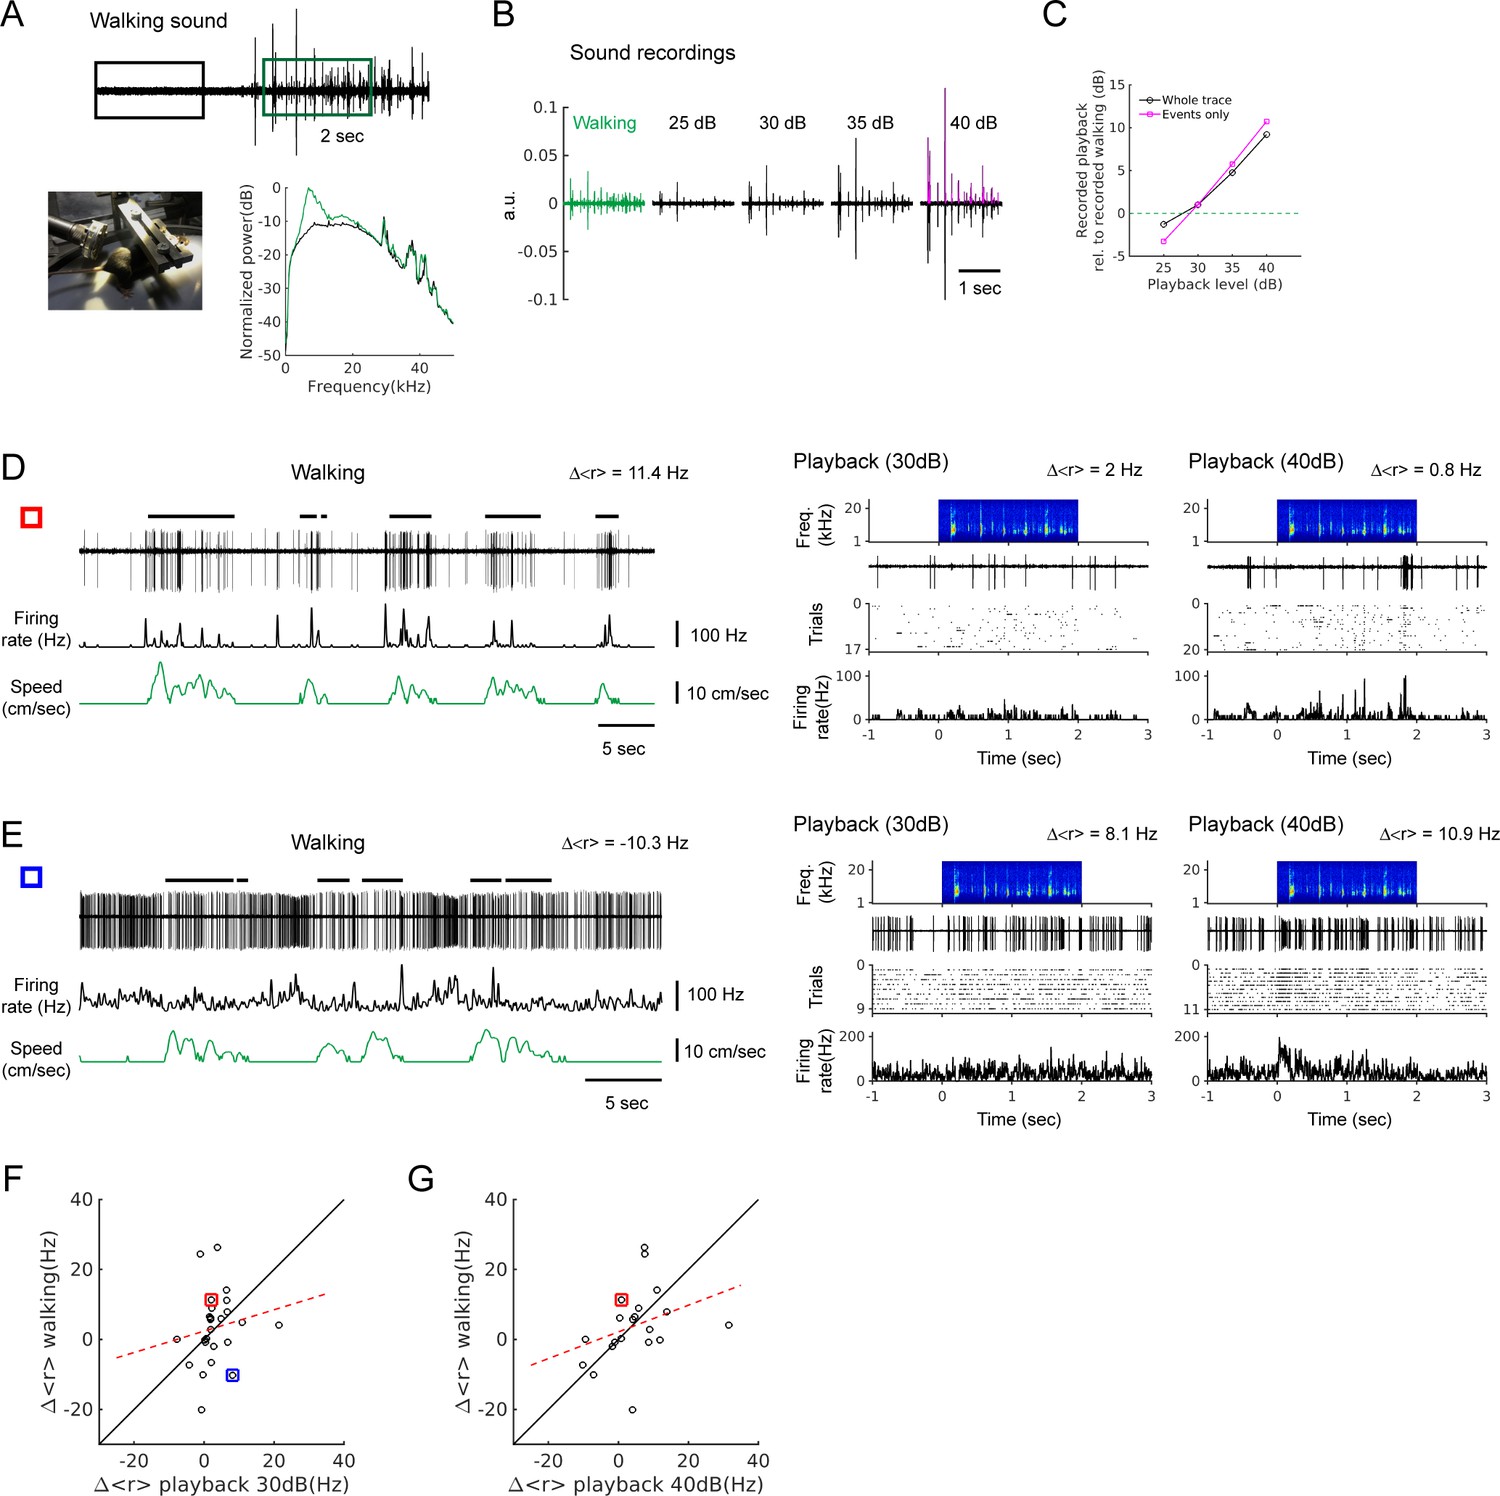
Recording of walking sounds and playback responses.
(A) Top: walking sound recording in sound pressure waveforms (black and green boxes denote 2 sec periods during baseline and walking, respectively, used for power spectrum calculation and playback). Bottom left: picture of the recording setup. Bottom right: normalized power spectrum (black trace: baseline, green trace: walking). (B) Recordings of walking sound (green), and walking sound playback at different sound levels (25, 30, 35, and 40 dB). The playback sound levels were determined from RMS values of thresholded events shown as magenta in the 40 dB waveform. (C) Sound levels of recorded playbacks in B, relative to the level of the walking sound recording (horizontal green dashed line). Sound levels were obtained from whole traces (black) or only from the events (magenta), In both cases, the recording of 30 dB playback was the closest to that of walking sounds. The same events were used for all playback levels and walking sound recording. (D) Example neuron showing a strong positive modulation during locomotion (left; ∆<r> = 11.4 Hz), but weak responses to playback (right; ∆<r> = 2.0 Hz at 30 dB, and ∆<r> = 0.8 Hz at 40 dB). (E) Example neuron showing a suppression during locomotion (left; ∆<r> = −10.3 Hz), but excitatory responses to playback (right, ∆<r> = 8.1 Hz at 30 dB and ∆<r> = 10.9 Hz at 40 dB; in this example, the first 0.5 s of the stimulus period was excluded for firing rate measurement due to the response during the initial baseline period). (F) Average firing rate changes (∆<r> ) during locomotion vs. the changes by walking sound playback at 30 dB (n = 25; r = 0.16, p=0.44). Red and blue squares represent the neurons in D and E, respectively. (G) Same as F, but for playback at 40 dB (n = 20, five neurons excluded due to substantial responses to the recording baseline; r = 0.33, p=0.15). Red square is the neuron in D. The neuron in E was one of the five excluded neurons.
Figure 2
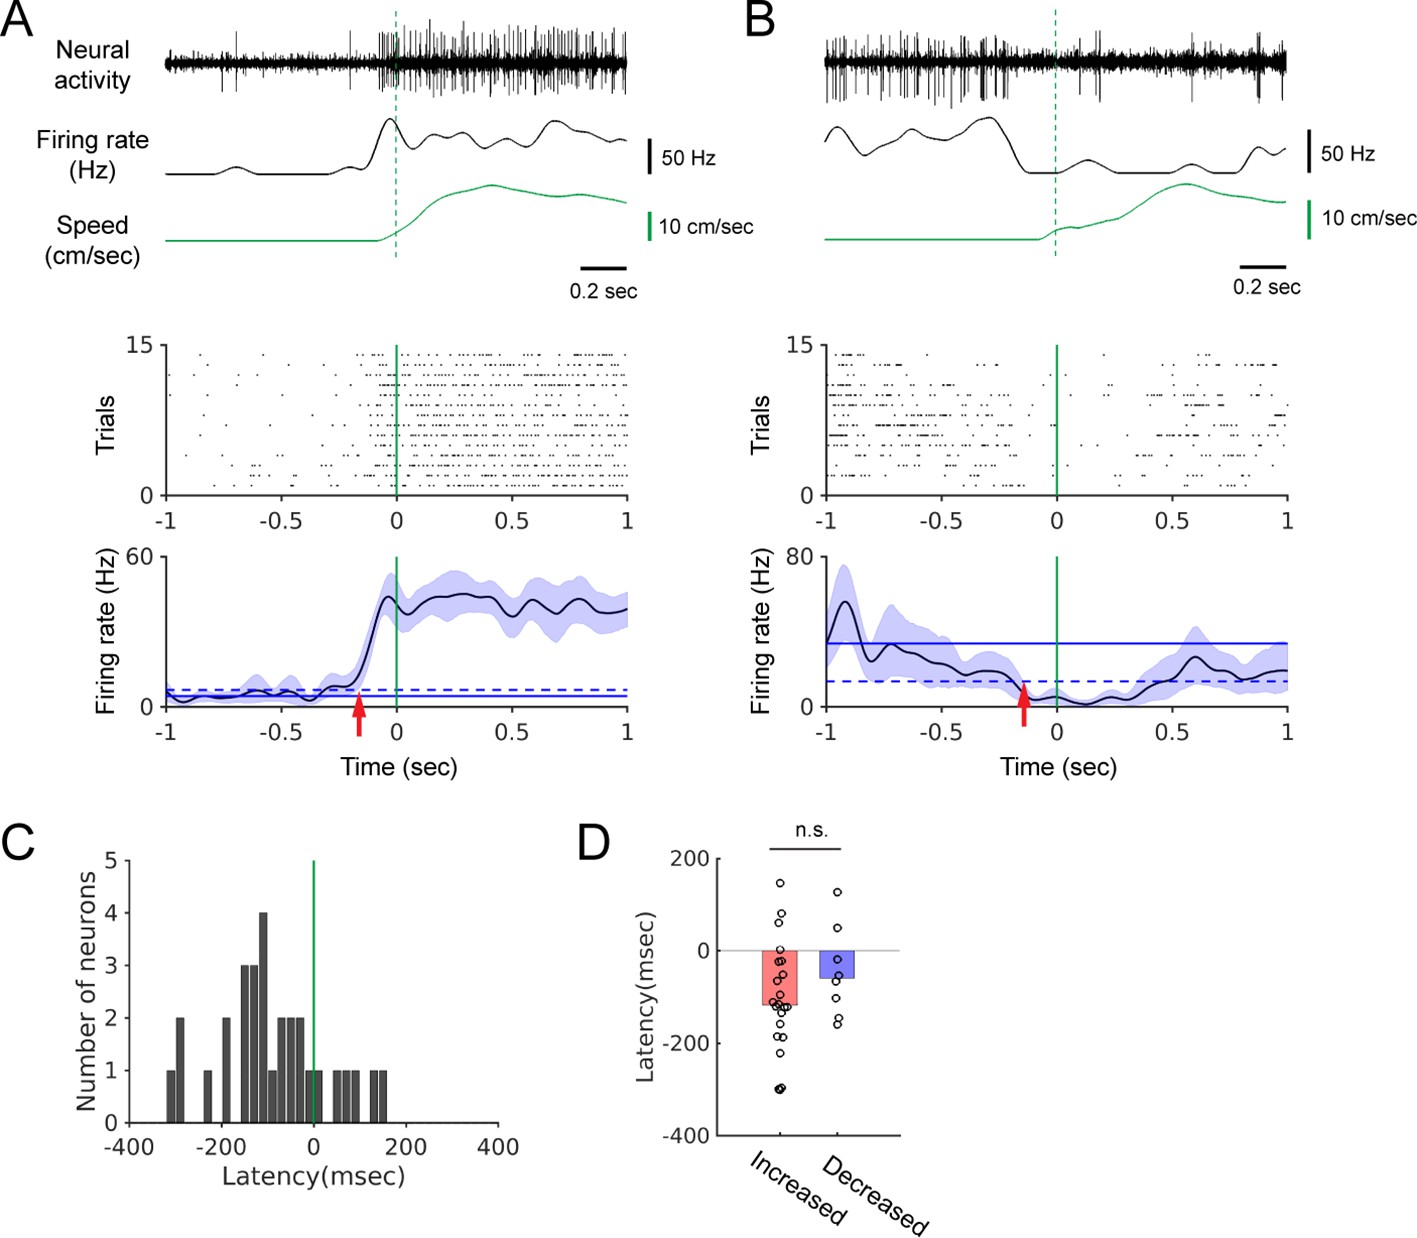
The onset of firing rate modulation precedes locomotion onset.
(A-B) Top: Example neural recordings, corresponding smoothed firing rates, and walking speed. Bottom: Spike rasters aligned at the onset of walking and the locomotion onset-triggered averages of firing rates. Blue shading indicates the 95% confidence interval of the average firing rates. Horizontal solid and dashed lines show the average spontaneous firing rate and the 2x standard deviation above (A) or below (B) the average, respectively. Vertical green lines indicate locomotion onset. Red arrows indicate modulation onset. (C) Histogram of the neural modulation latencies relative to locomotion onset (n = 30). Time zero indicates locomotion onset. (D) Modulation latencies for neurons with increased (red bar, n = 22) and decreased (blue bar, n = 8) firing during locomotion (Wilcoxon rank sum test, p=0.25). Bar graphs show the median latencies.
-
Figure 2—source data 1
Source data for locomotion onset-triggered firing rate averaging and neural modulation latencies.
- https://cdn.elifesciences.org/articles/52228/elife-52228-fig2-data1-v2.xlsx
Figure 3 with 1 supplement
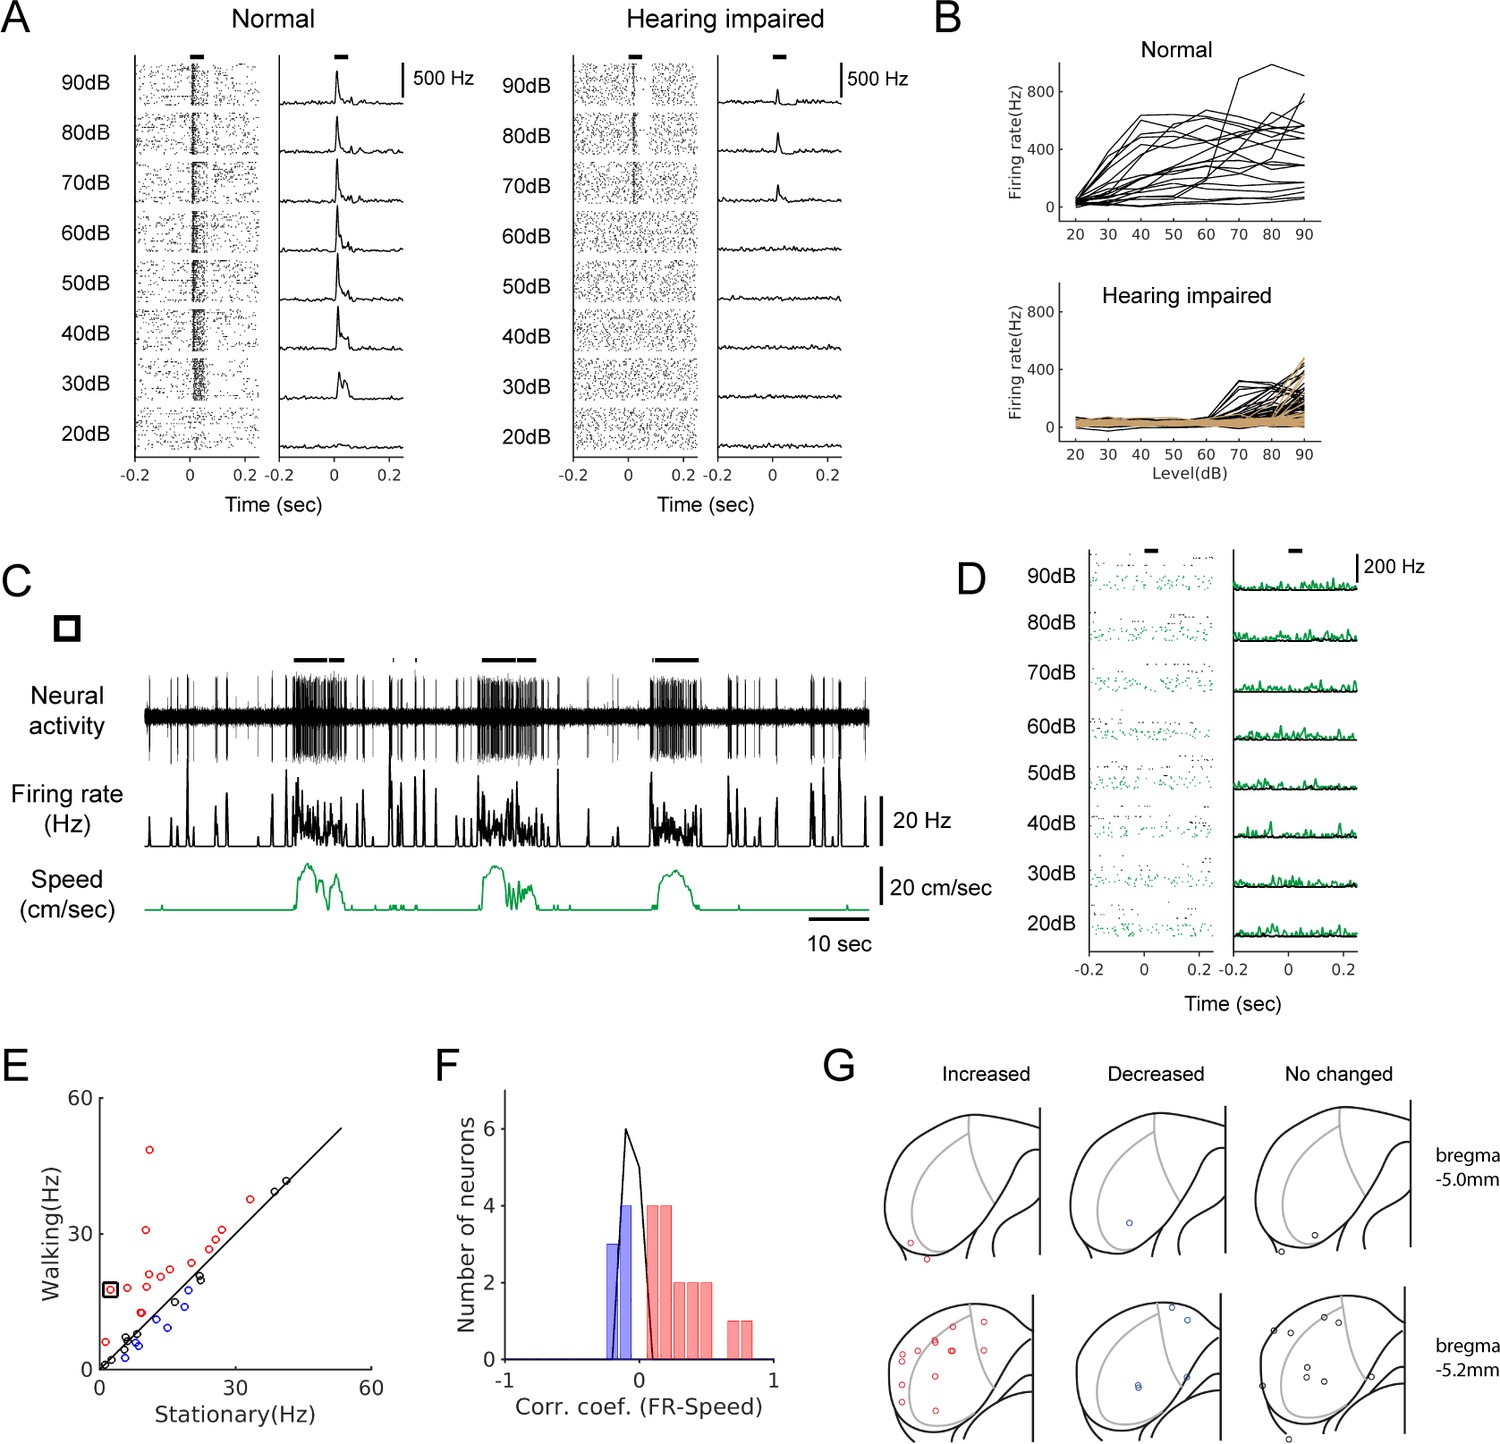
Locomotion modulates spontaneous activity in hearing-impaired mice.
(A) Raster plots (30 trials shown for each level) and PSTHs of multi-unit responses to broadband sound (2–64 kHz, 50 msec duration) in the example sites from normal (left) and hearing-impaired (right) mice. Horizontal bars at the top denote the period of stimulus presentation. (B) Rate-level functions from multi-unit sites from a normal mouse (top, 20 sites) and two hearing-impaired mice (bottom, 40 sites (black) and 57 sites (brown); colors represent different mice, and curves from only two mice are shown for clarity). (C) Example neuron from a hearing-impaired mouse that showed a robust modulation in firing rate during locomotion. Thick black lines above the neural record indicate walking periods. (D) The neuron in C did not show any auditory response to broadband noise (black: stationary, green: locomotion). In the raster plots, 30 stationary trials (black dots) and 8–10 walking trials (green dots) are shown for each level. (E) Scatter plot comparing the average spontaneous firing rates between stationary and walking conditions in hearing-impaired mice (n = 34). Red: increased; blue: decreased; black: no significant change. Black square indicates the neuron in C. (F) Histogram of correlation coefficients (color code as in E). (G) Reconstructed recording locations as in Figure 1. Color code as in E.
-
Figure 3—source data 1
Source data for the effects of deafening, locomotion-induced modulation in hearing-impaired mice, and comparison of modulation between normal and hearing-impaired mice.
- https://cdn.elifesciences.org/articles/52228/elife-52228-fig3-data1-v2.xlsx
Figure 3—figure supplement 1
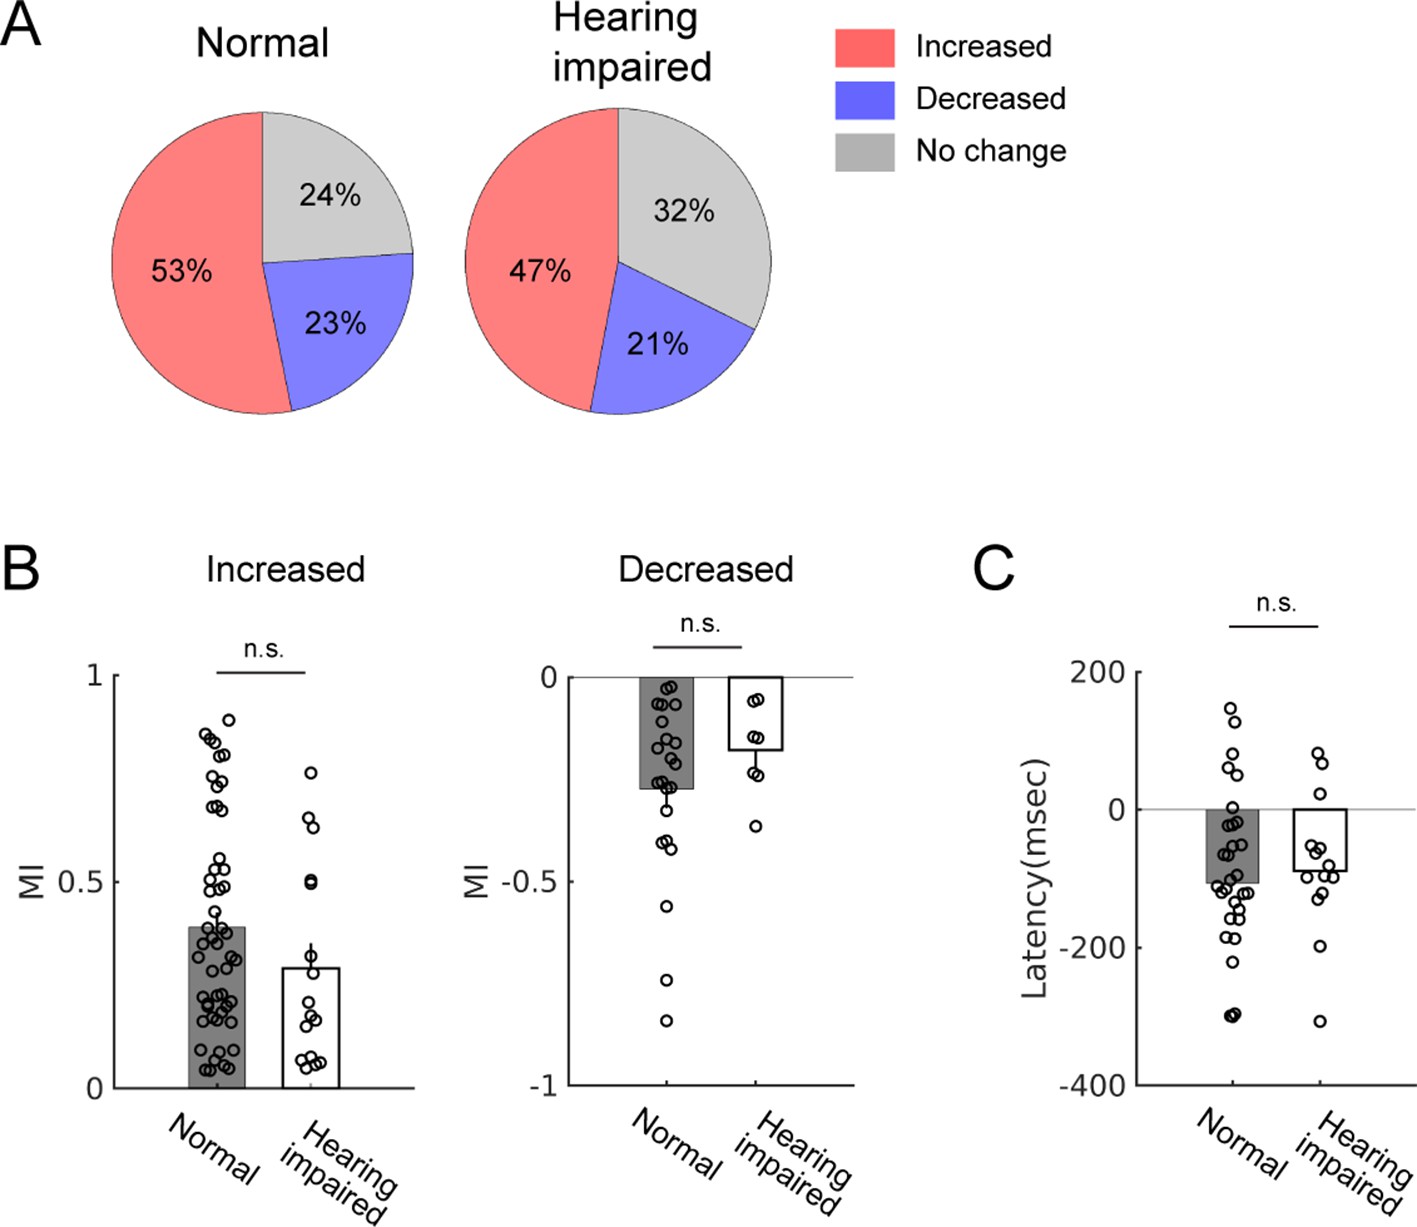
Modulation of spontaneous activity is similar between normal and hearing-impaired mice.
(A) Proportions of the types of modulation: increased, decreased, or no change. Normal: n = 96; hearing impaired: n = 34. (B) Modulation index (MI) comparison between normal and hearing-impaired mice in neurons that showed positive (left; normal: 0.39 ± 0.04, n = 51; hearing impaired: 0.29 ± 0.06, n = 16; t-test, p=0.18) or negative modulation (right; normal: −0.27 ± 0.05, n = 22; hearing impaired: −0.18 ± 0.04, n = 7; t-test, p=0.28). (C) Latencies of neural activity modulation onset relative to locomotion onset did not significantly differ (median latencies; normal: −107 msec, n = 30; hearing impaired: −89 msec, n = 14; Wilcoxon rank sum test, p=0.65).
Figure 4 with 2 supplements
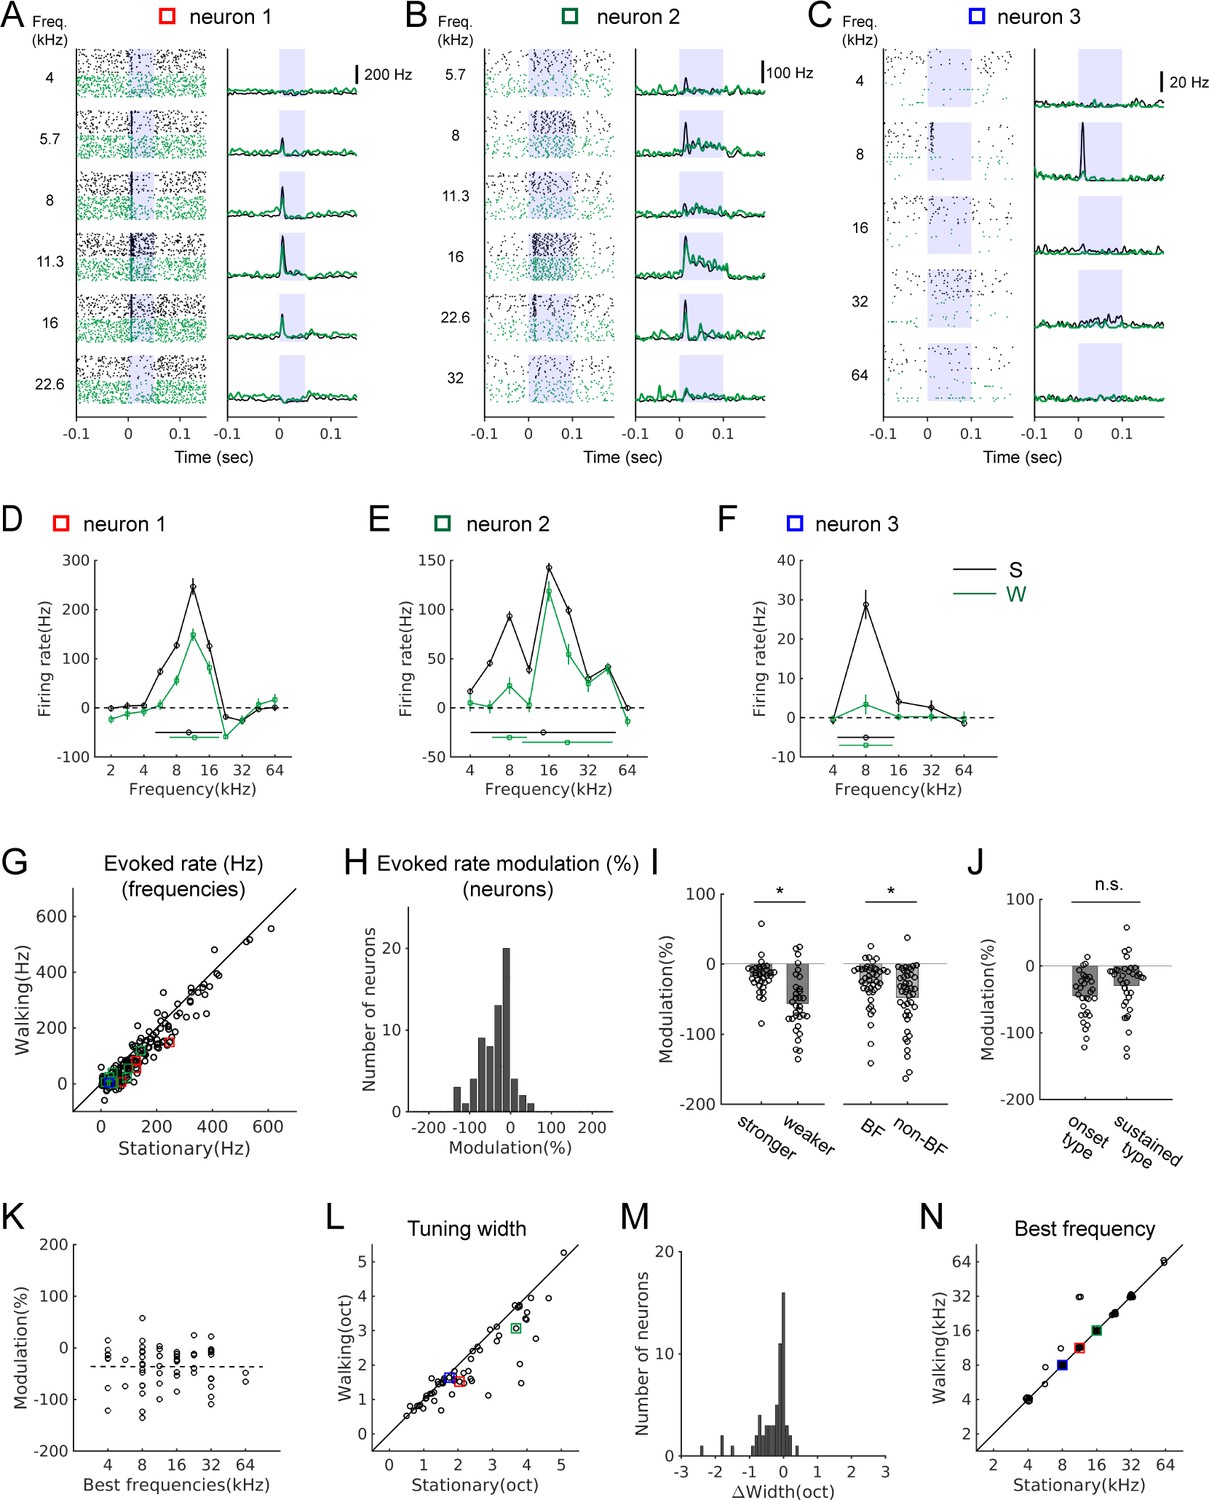
Sound-evoked activity of IC neurons is attenuated during locomotion.
(A-C) Tone-evoked responses from three example IC neurons. Black spike rasters and PSTHs are from stationary trials, and green from walking trials. In each neuron, the same number of trials is shown for each condition (A: 35 trials; B: 25 trials; C: 92 trials). Blue shading indicates the period of sound stimulus presentation. Squares in different colors indicate the data points corresponding to the examples in the population plots in G, L, and N. (D-F) Tuning curves (black: stationary, green: walking) based on baseline-subtracted average firing rates at stimulus onset (see Materials and methods). Tuning widths are shown as horizontal bars in each condition (with the centroid shown as a circle at the center). The tuning curves are from the neurons shown in A-C, respectively. (G) Comparison of evoked rates between the stationary and walking conditions at all frequencies with excitatory responses (178 tones, 65 neurons). Values from the example neurons in A-C are indicated as squares in corresponding colors. (H) Histogram of percent evoked-rate modulation across the recorded neurons (n = 65). One-sample t-test for the zero mean, p=1.4×10⁻¹⁰. (I) Comparison of the percent evoked-rate modulation between neurons with weaker and stronger responses (the left two bars; stronger: above the median, n = 33; weaker: below the median, n = 32; t-test, p=0.0175), or between best and non-best frequencies (BF vs. non-BF) (the right two bars; n = 43 of 65 neurons that had responses at both best and non-best frequencies; paired t-test, p=6.98×10⁻⁴). Each data point denotes a neuron. (J) Percent evoked-rate modulation in neurons with responses only at the onset vs. neurons with sustained responses (onset type: n = 30; sustained type: n = 35; t-test, p=0.103). (K) Scatter plot of percent evoked-rate modulation as a function of best frequencies (n = 65; r = −0.0031, p=0.98). (L) Frequency tuning widths in octaves for stationary and walking conditions. (M) Histogram of tuning width changes (n = 60, one sample Wilcoxon signed rank test, p=3.0×10⁻⁷; mean change = −0.29 octaves). (N) Comparison of best frequencies (n = 60). In L-N, neurons that lost all excitatory responses in the walking condition, yielding the tuning width of 0, were not included (n = 5).
-
Figure 4—source data 1
Source data for modulation of sound-evoked responses during locomotion, relationships between spontaneous and evoked activity modulation, and spontaneous activity modulation in different response types.
- https://cdn.elifesciences.org/articles/52228/elife-52228-fig4-data1-v2.xlsx
Figure 4—figure supplement 1

Relationships between the locomotion-related modulation of spontaneous and tone-evoked activity.
(A-D) Tone-evoked responses in four example neurons with different types of spontaneous activity modulation during locomotion: increased (A-B), decreased (C), or no change (D). In raster plots and PSTHs, black indicates stationary and green indicates walking trials. (E) Percent evoked-rate modulation in three different types of spontaneous activity modulation. Red: increased, −31 ± 6%, n = 41; blue: decreased, −42 ± 19%, n = 7; gray: no change, −48 ± 9%, n = 17. One-way ANOVA, p=0.27. (F-H) Plots of percent modulation in spontaneous vs. evoked activity in neurons with increased (F), decreased (G), or no change (H) in spontaneous activity during locomotion. No correlation was found between the degrees of spontaneous and evoked activity modulation in the increased (F; r = −0.16, p=0.32, n = 41) or no change group (H; r = 0.11, p=0.67, n = 17). In the decreased group (G), a positive correlation was found (r = 0.83, p=0.02, n = 7).
Figure 4—figure supplement 2
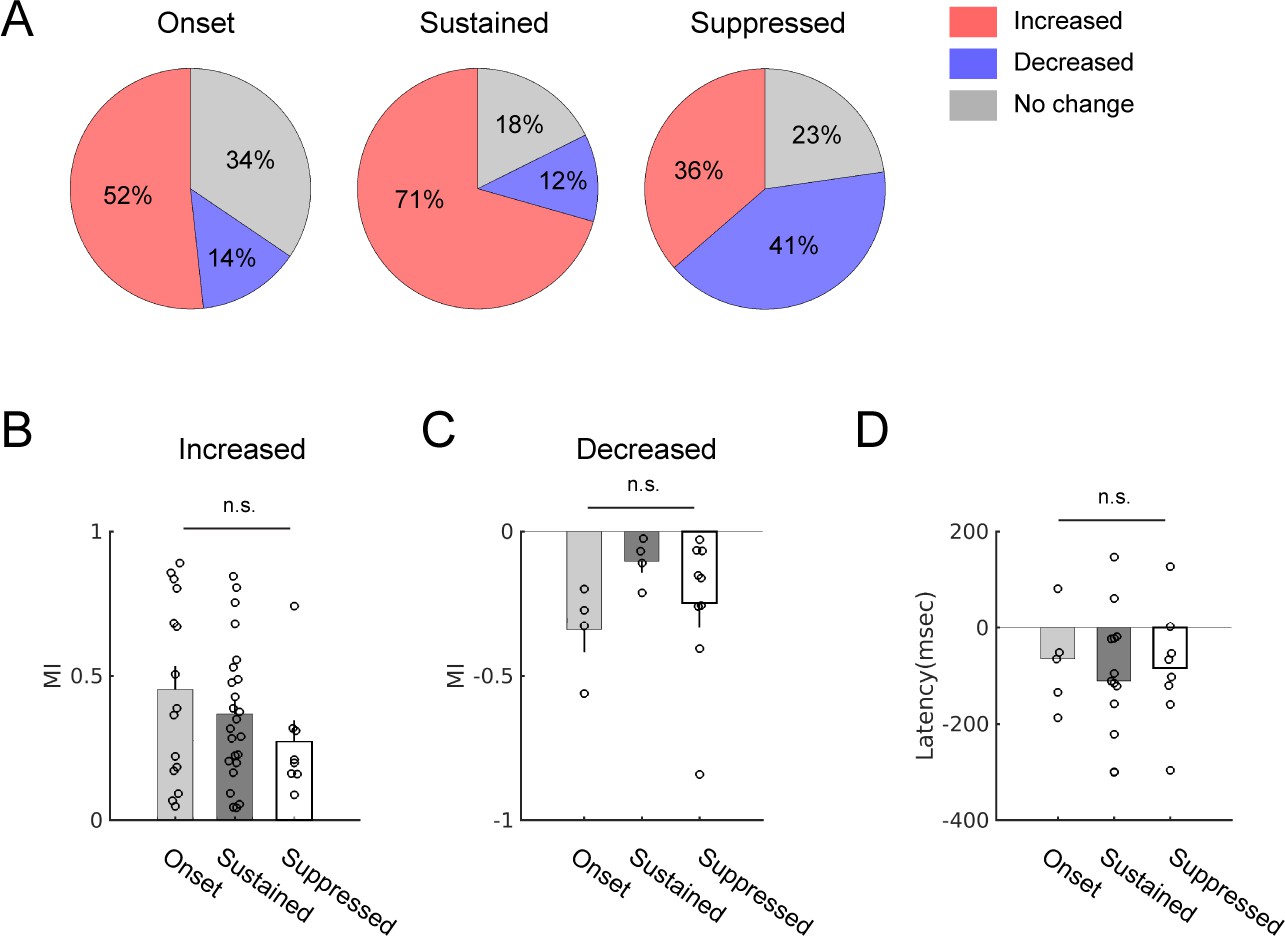
Spontaneous activity modulation during locomotion in neurons with different evoked response patterns.
(A) Proportions of modulation types in onset only (n = 29), sustained response (n = 34), or suppression only response type (n = 22). In the sustained group (center), the proportion of positive modulation was higher, while in the suppression only group (right), that of negative modulation was higher than in other response types. (B) Modulation index (MI) comparison across the three response types in neurons that showed positive modulation during locomotion. Onset: 0.45 ± 0.08 (n = 15); sustained: 0.37 ± 0.05 (n = 24); suppressed: 0.27 ± 0.07 (n = 8). One-way ANOVA, p=0.29. (C) MI comparison in neurons that showed negative modulation. Onset: −0.34 ± 0.08 (n = 4); sustained: −0.10 ± 0.04 (n = 4); suppressed: −0.25 ± 0.08 (n = 9). One way ANOVA, p=0.29. (D) Latencies of neural modulation relative to locomotion onset did not significantly differ across response patterns (median latencies: onset: −65 msec, n = 5; sustained: −111 msec, n = 13; suppressed: −84 msec, n = 8). Kruskal-Wallis test, p=0.94.
Tables
Key resources table
| Reagent type (species) or resource | Designation | Source or reference | Identifiers | Additional information |
|---|---|---|---|---|
| Strain, strain background (Mus musculus) | C57BL/6N | Orient Bio (Korea) | ||
| Genetic reagent (Mus musculus) | VGAT-ChR2-EYFP | The Jackson Laboratory | RRID:IMSR_JAX:0145498 | |
| Software, algorithm | MATLAB | MathWorks | RRID:SCR_001622 | All data analysis |
| Software, algorithm | Open Ephys GUI | Open Ephys | Neural data acquisition |
Additional files
Download links
A two-part list of links to download the article, or parts of the article, in various formats.
Downloads (link to download the article as PDF)
Open citations (links to open the citations from this article in various online reference manager services)
Cite this article (links to download the citations from this article in formats compatible with various reference manager tools)
Integration of locomotion and auditory signals in the mouse inferior colliculus
eLife 9:e52228.
https://doi.org/10.7554/eLife.52228


