Bacterial cell cycle control by citrate synthase independent of enzymatic activity
- Department of Microbiology and Molecular Medicine, Faculty of Medicine, University of Geneva, Switzerland
- Institute of Pharmaceutical Sciences of Western Switzerland (ISPSO), University of Geneva, Switzerland
- Swiss Centre for Applied Human Toxicology (SCAHT), Switzerland
Figures
Figure 1 with 2 supplements
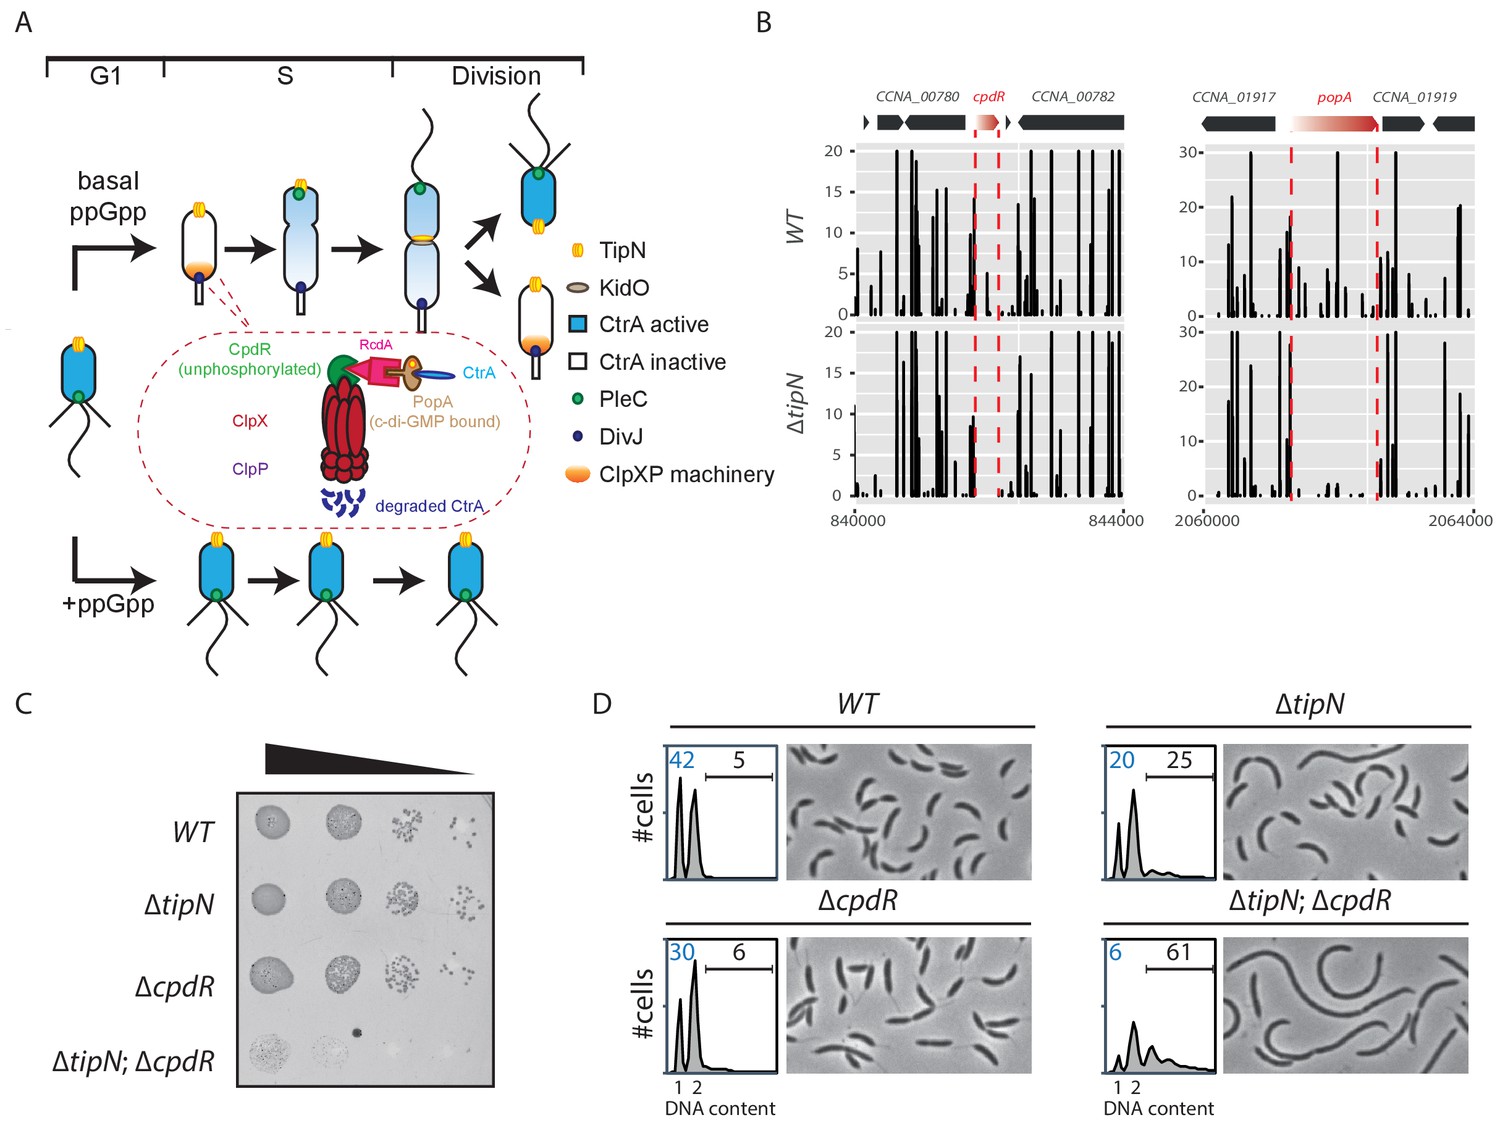
Synthetic sick interaction between tipN and proteolytic adaptor genes of the ClpXP machinery.
(A) Schematic of the different stages of the C. crescentus cell cycle (G1 phase, S phase and division are shown) in the normal condition (upper part). TipN (yellow dot) and KidO (brown circle) localization are represented throughout the cell cycle. Phosphorylated CtrA (blue) activates the transcription of G1 phase genes and prevents DNA replication in the swarmer cell. Upon transition from a swarmer to stalked cell, the ClpXP machinery (orange) and its adaptors CpdR (green component in the encircled ClpXP machinery), RcdA (pink component) and PopA (brown component) localize to the incipient stalked pole where it degrades CtrA, allowing DNA replication and cell division. In the pre-divisional cell, the antagonistic kinase/phosphatase pair, DivJ (purple dot) and PleC (green dot) indirectly influence the phosphorylation of CtrA with the stalked cell compartment or swarmer cell compartment, respectively. PleC promotes CtrA phosphorylation in the swarmer cell whereas DivJ prevents its phosphorylation in the stalked cell. Pili and flagella are depicted as straight and wavy lines, respectively. In the case of ppGpp production occurring under conditions of carbon or nitrogen starvation, the swarmer to stalked cell transition is prevented (bottom part). (B) Transposon libraries were generated in the wildtype (WT) and the ∆tipN mutant (MB556). The sites of Tn insertion were identified by deep sequencing and mapped onto the C. crescentus NA1000 reference genome (nucleotide coordinates depicted on the X-axis). Two regions of the genome are depicted. The height of each line reflects a relative number in sequencing reads (Y-axis) at a given nucleotide position, and all the graphs for WT and ∆tipN are scaled similarly. Tn insertions in cpdR and popA were reduced in the ∆tipN mutant when compared to the WT. (C) EOP (efficiency of plating) assays showing spot dilutions of the indicated strains (MB1 [WT], MB556 [∆tipN], MB2001 [∆cpdR], and MB2017 [∆tipN; ∆cpdR] from top to bottom). The four strains were grown overnight, adjusted at an OD600nm of 0.5 and ten-fold serially diluted. Eight microliters of each dilution were spotted onto PYE plates. (D) Flow cytometry profiles and phase contrast images of WT, ∆tipN, ∆cpdR or ∆tipN; ∆cpdR double mutants. Genome content (labelled as DNA content) was analyzed by fluorescence-activated cell sorting (FACS) during the exponential phase in peptone-yeast extract (PYE).
-
Figure 1—source data 1
Tn-Seq data ratio comparing Tn insertion efficiency in C. crescentus WT and mutant strains measured as sequencing reads.
The first sheet shows insertion ratios across the genome per coding sequence (CDS) and the second sheet shows the data per 100 bp window.
- https://cdn.elifesciences.org/articles/52272/elife-52272-fig1-data1-v2.xlsx
Figure 1—figure supplement 1
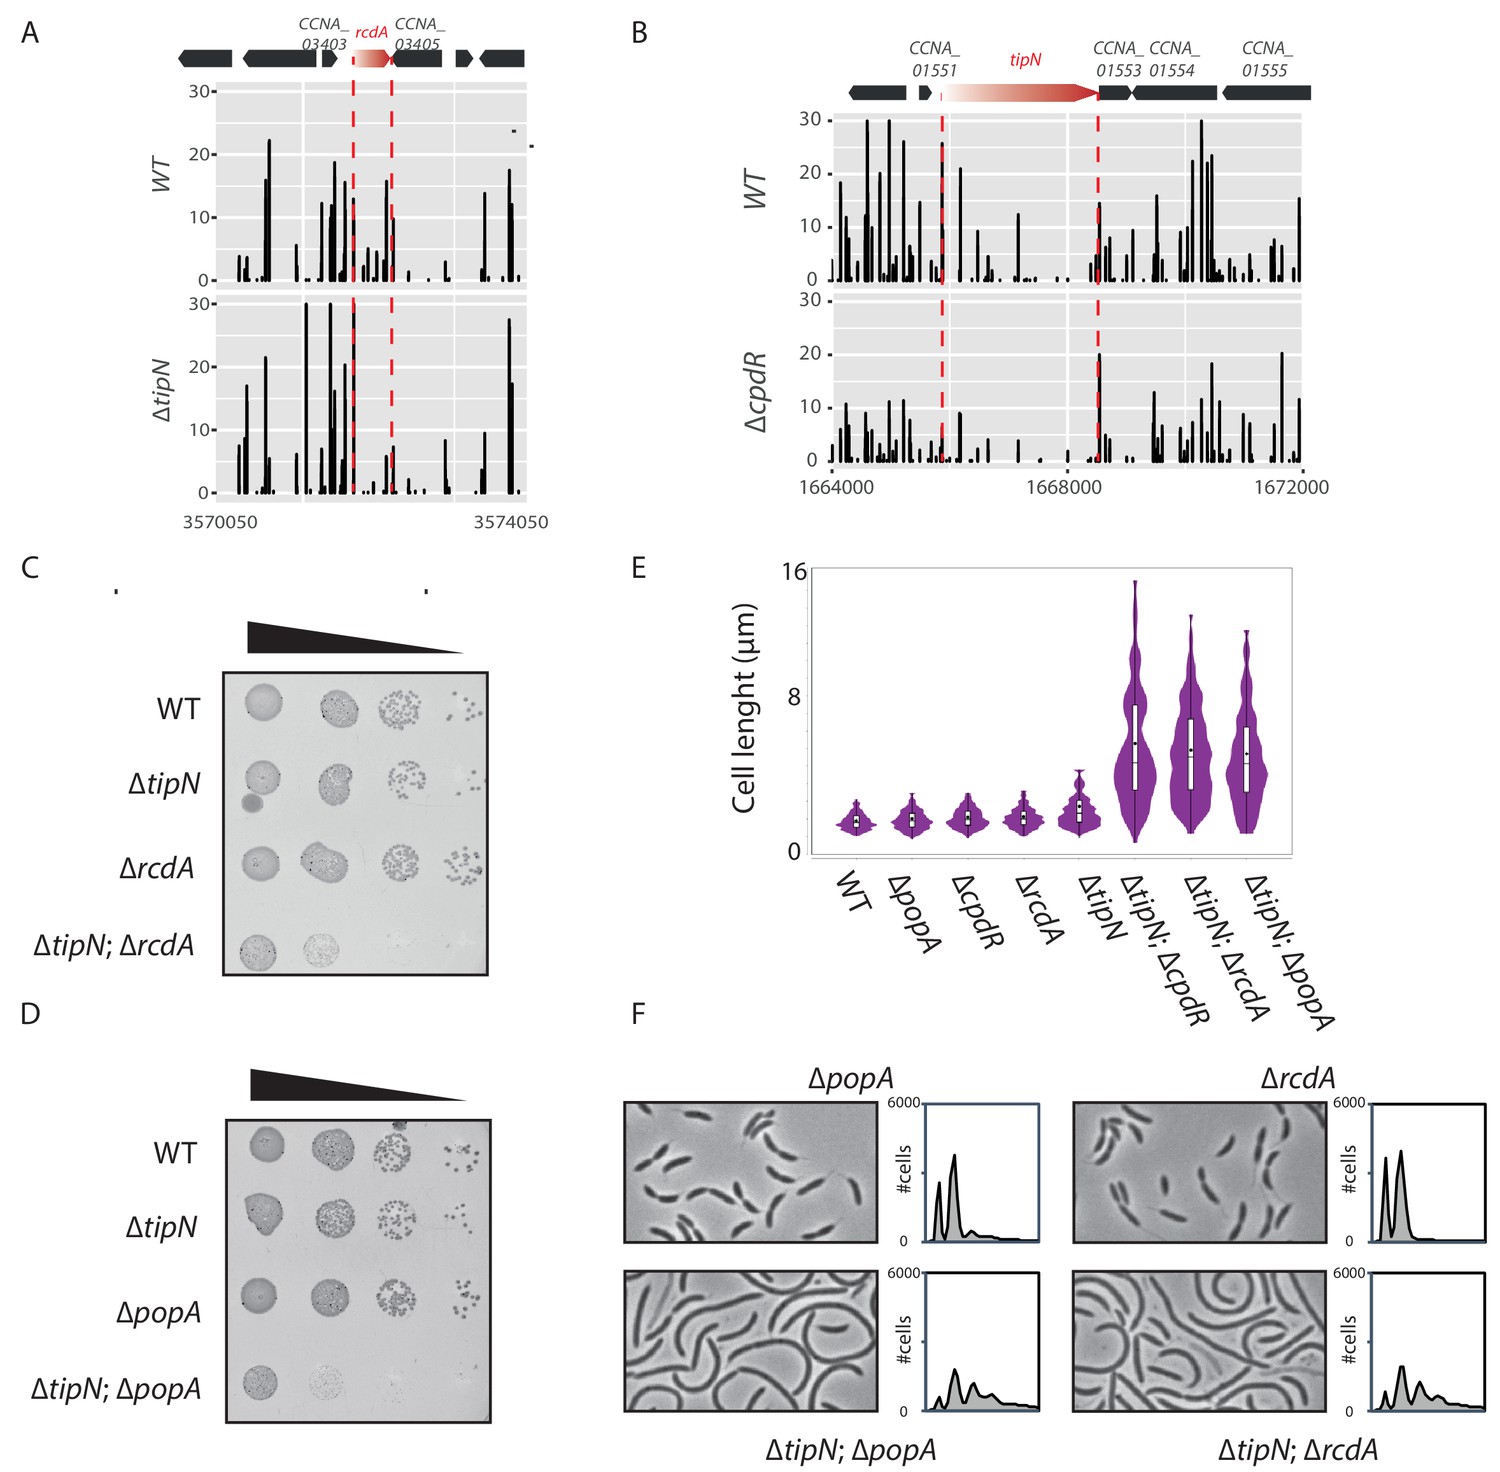
Genetic interactions between tipN and the genes encoding proteoyltic adaptors.
(A) Transposon libraries were generated in the WT and the ∆tipN mutant (MB556). The region of the rcdA locus is depicted. (B) Transposon libraries were generated in the WT and the ∆cpdR mutant (MB2001). The tipN coding sequence is represented showing a decrease in Tn insertions in the ∆cpdR compared to the WT. In panels A and B, the numbers on the X-axis represent the nucleotide coordinates of the C. crescentus reference genome and the Y-axis indicates the corresponding relative value in sequencing reads. (C) Spot dilutions (EOP assays) of the indicated strains (MB1 [WT], MB556 [∆tipN], MB48 [∆cpdR], and MB3079 [∆tipN; ∆cpdR] from top to bottom) carried out as described for Figure 1C. (D) Spot dilutions of the indicated strains (MB1 [WT], MB556 [∆tipN], MB46 [∆popA], and [∆tipN; ∆popA] MB3075 from top to bottom) done as described in Figure 1 panel (C). (E) Cell size distribution of WT (MB1) (n = 732), ∆popA (MB46) (n = 761), ∆cpdR (MB2001) (n = 645), ∆rcdA (MB48) (n = 741), ∆tipN (MB556) (n = 477), ∆tipN; ∆cpdR (MB2017) (n = 357), ∆tipN; ∆rcdA (MB3079) (n = 497) and ∆tipN; ∆popA (MB3075) (n = 449). Strains were grown in PYE media. The cell length was measured automatically using MicrobeJ. (F) Flow cytometry profiles and phase contrast images of WT (MB1), ∆popA (MB46), ∆rcdA (MB48), and ∆tipN; ∆popA (MB3075) or ∆tipN; ∆rcdA (MB3079) double mutants. Genome content was analyzed by FACS during exponential growth in PYE.
Figure 1—figure supplement 2
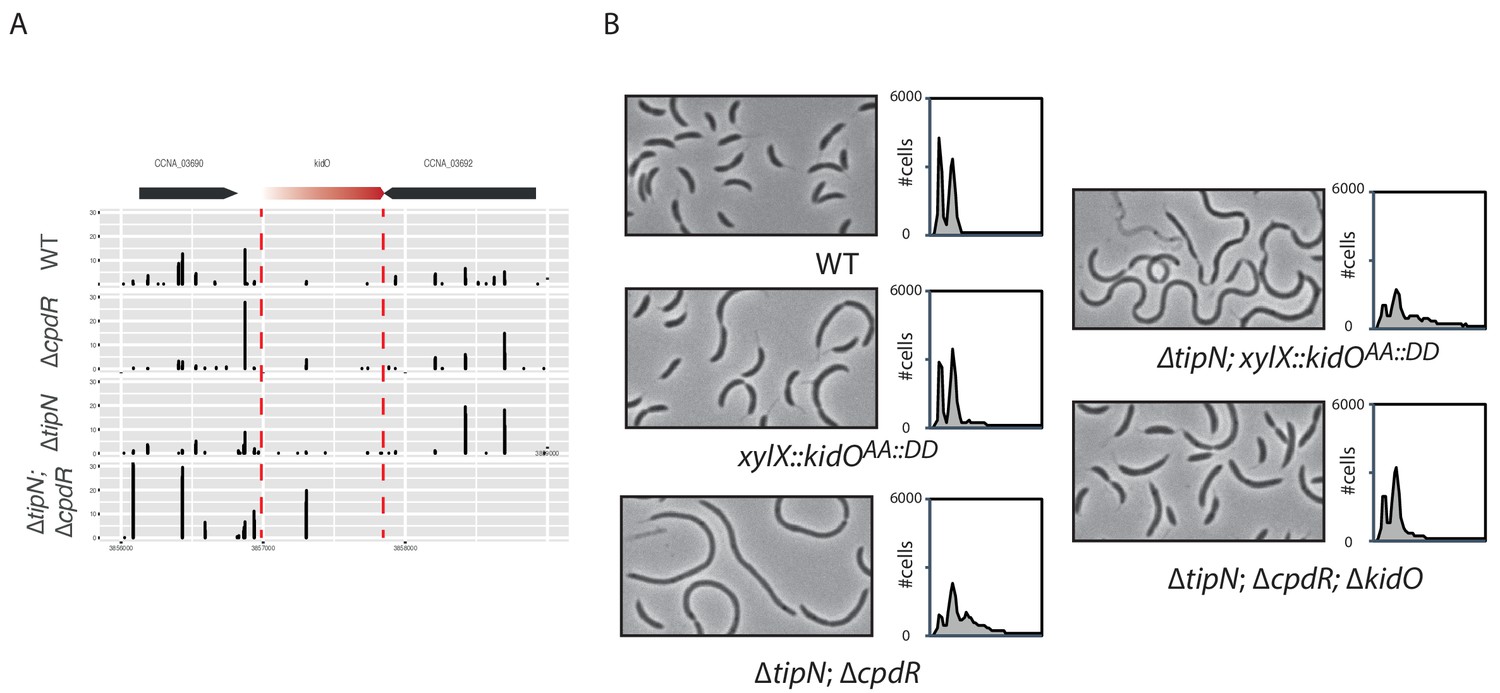
Cell length control by KidO in cells lacking both TipN and CpdR.
(A) Transposon libraries were generated in the WT, the ∆cpdR (CC2001) and ∆tipN (MBC556) single mutants and the ∆tipN; ∆cpdR double mutant (MB2017). The sites of Tn insertion were identified by deep sequencing and mapped onto the C. crescentus NA1000 reference genome. The kidO locus is depicted. The height of each line reflects the number of sequencing reads at this position. Tn insertions in kidO was increased in the ∆tipN; ∆cpdR double mutant compared to the WT or to the ∆tipN and ∆cpdR single mutants. (B) Flow cytometry profiles and phase contrast images of the WT (MB1), the ∆tipN; ∆cpdR double mutant (MB2017), the ∆tipN; ∆cpdR; ∆kidO triple mutant (MB2720) and the WT (MB1972) or ∆tipN mutant (MB2366) expressing a non-degradable version of KidO (KidOAA::DD) under the control of the xylose promoter at the xylX locus. Genome content was analyzed by FACS during exponential growth in PYE. Note that the expression of KidOAA::DD was not induced with xylose because the leakage of Pxyl was sufficient to induce strong filamentation in the ∆tipN mutant.
Figure 2 with 1 supplement

Genetic screen to identify Tn insertions that enhance CtrA.
(A) CtrA activity in WT (MB2325), ∆tipN (MB2337) and ∆cpdR (MB2329) single mutant cells, and in ∆tipN ∆cpdR (MB2331) double mutant cells, was monitored using a pilA::PpilA-GFP transcriptional reporter whose activity is dependent on CtrA. Fluorescence intensity was automatically quantified, and t-tests were performed to determine the significance with p<0.05 (**) and p<0.005 (***). (B) Spot dilutions of the indicated strains (MB2268 [WT], MB2271 [∆tipN; ∆cpdR], MB3056 [∆tipN; ∆cpdR; ∆citA::Tn], and MB3058 [∆tipN; ∆cpdR; ∆citA] from top to bottom) carrying the pilA::PpilA-nptII transcriptional reporter on PYE plates containing kanamycin (20 µg.mL−1). (C) FACS profiles and phase contrast images of the strains shown in panel (B). FACS profiles showing genome content (ploidy) of cells growing exponentially in PYE and then treated with rifampicin (20 µg.mL−1) for 3 hours to inhibit DNA replication. Numbers (%) of G1-phase cells and cells containing more than two chromosomes are indicated in blue and black, respectively.
Figure 2—figure supplement 1
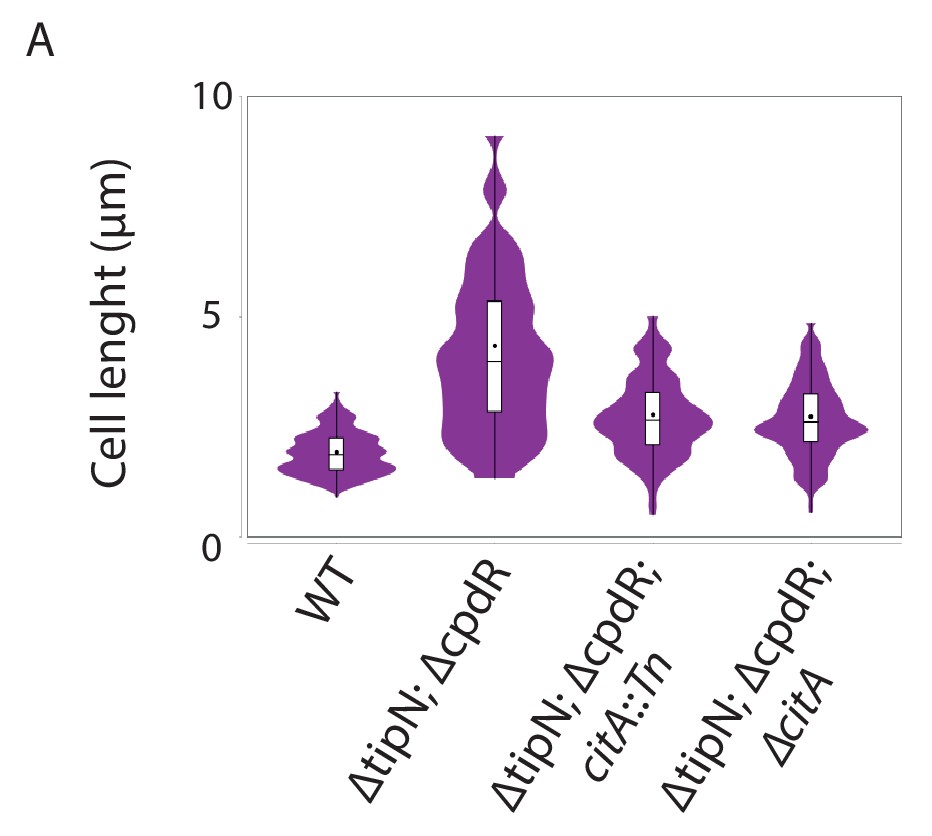
Loss of CitA attenuates the cell division defect of tipN cpdR double mutant cells.
(A) Cell size distribution of WT (MB2268) cells (n = 638), ∆tipN; ∆cpdR double mutant (MB2271) cells (n = 635), ∆tipN; ∆cpdR; citA::Tn triple mutant cells (MB3056) (n = 553), and ∆tipN; ∆cpdR; ∆citA triple mutant cells (MB3058) (n = 498). Strains were grown in PYE media. The cell length was measured automatically using MicrobeJ.
Figure 3 with 1 supplement

The C. crescentus genome encodes two functional citrate synthases.
(A) A schematic of the Krebs cycle and the corresponding gene products in C. crescentus. The two functional citrate synthases are indicated in blue. Essential gene products, as inferred from Tn-Seq (Christen et al., 2011), are highlighted in bold. (B) Spot dilutions (EOP assays) of the indicated WT and ∆gltA E. coli strains (eMB554 [WT], eMB556 [∆gltA + empty], eMB558 [∆gltA + citA], eMB560 [∆gltA + citB], eMB562 [∆gltA + citC] and eMB564 [∆gltA + gltA ] from top to bottom) on minimal medium containing glutamate or not. Only the strain carrying a functional citrate synthase can grow without glutamate. (C) LC-MS-based quantification of acetyl-CoA in extract of WT (MB1), citA::Tn (MB2622) and ∆citA (MB2559) cells grown in PYE liquid cultures. Error bars denote the standard deviation of the mean from three biological replicates. (D) ΦCR30-mediated generalized transduction frequencies of citA::Tn into WT (MB1) or ∆citBC double mutant cells (MB2679). For transduction, cells were normalized according to OD600nm ~1 and infected with the same amount of phage lysates from citA::Tn cells or with phage lysates from cells with a transposon insertion in the hetN gene (encoding gentamycin resistance) as a control for transduction. The transductants were selected on PYE plates containing gentamycin. The numbers of transduced colonies were counted after 3 days of incubation at 30°C. Error bars denote the standard deviation of the mean for three independent experiments. Cells harboring the ∆citBC mutation are not able to accept the citA::Tn mutation. (E) Same as in panel (D) using the ∆citA::kan allele or a deletion in the spoT gene (encoding kanamycin resistance, ∆spoT::kan) delivered by ΦCR30-mediated generalized transduction. Transductants were selected on PYE plates containing kanamycin.
-
Figure 3—source data 1
Metabolomic data sets showing the metabolites detected (sheet 1) and statistically significant changes in relative metabolite abundance between WT and citA::Tn mutant cells (sheet 2) or between WT and ∆citA mutant cells (sheet 3), presented as volcano plots.
- https://cdn.elifesciences.org/articles/52272/elife-52272-fig3-data1-v2.xlsx
Figure 3—figure supplement 1
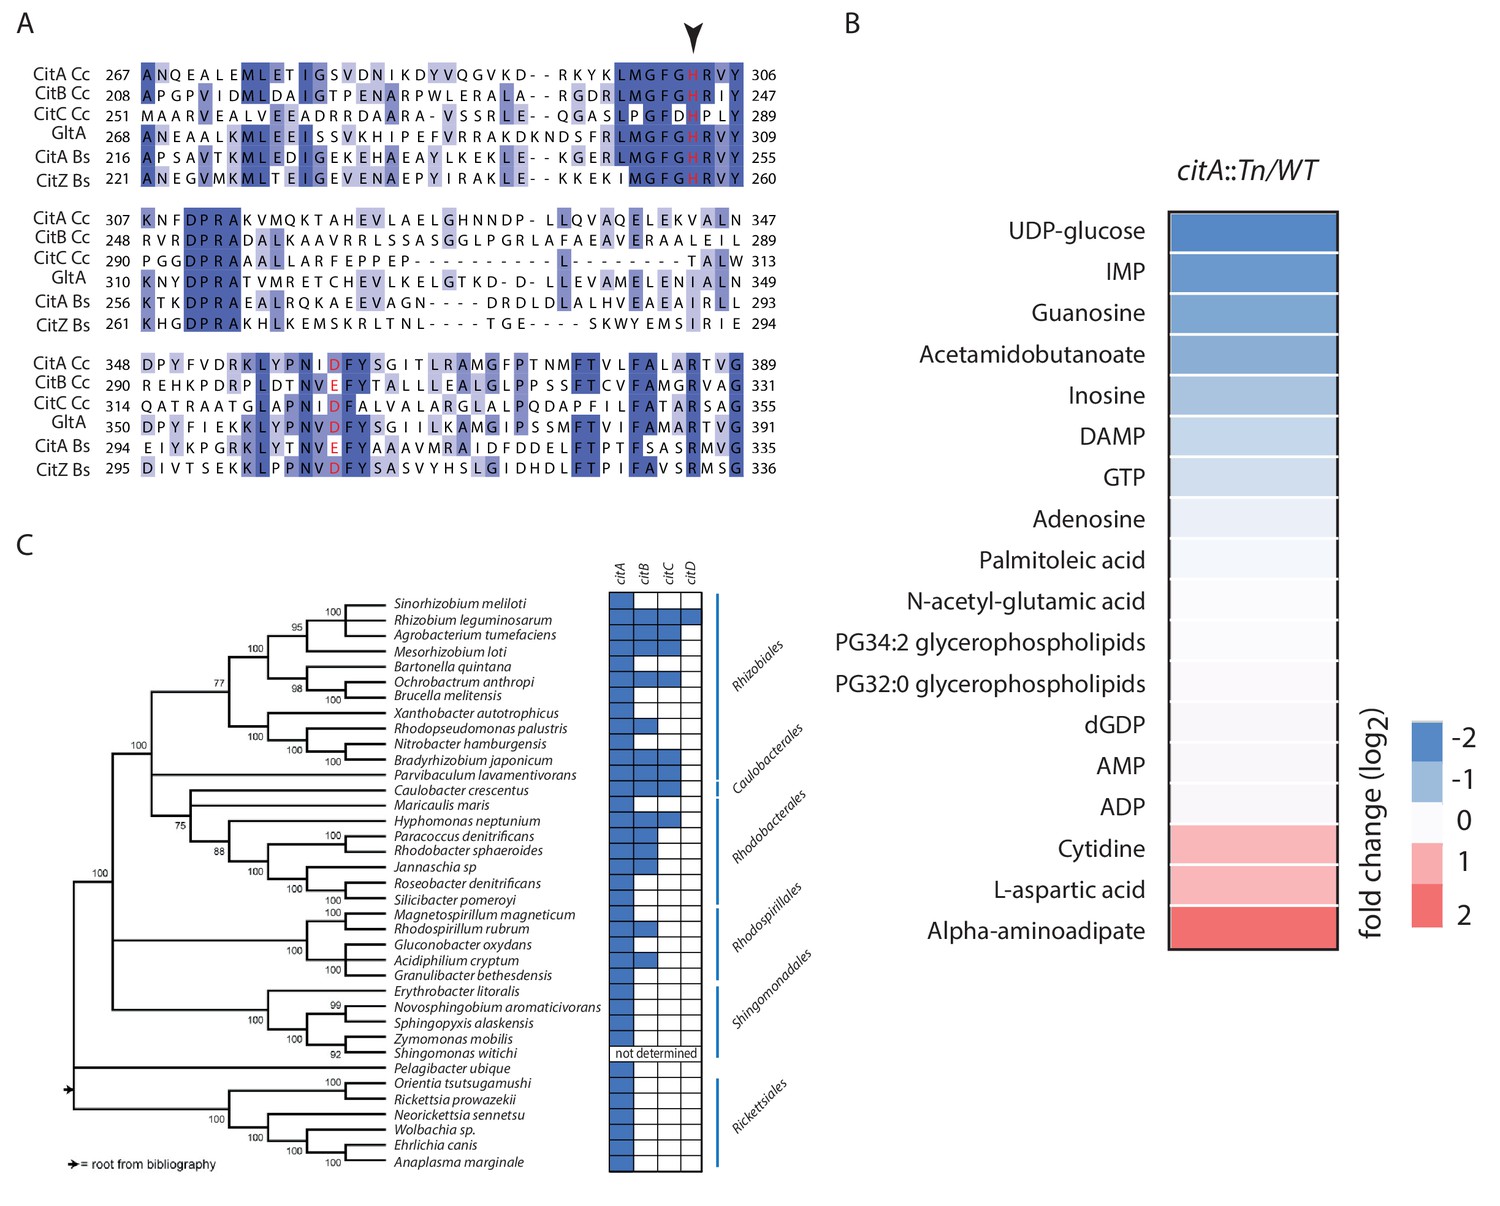
Primary structure alignment of CitA and homologs.
(A) Partial alignment of the active site of CitA (A0A0H3C985) with CitB (A0A0H3CCE2) and CitC (A0A0H3CD20) from C. crescentus, GltA (P0ABH7) from E. coli, CitA (P39119) and CitZ (P39120) from Bacillus subtilis. The histidine and aspartic acid catalytic residues are highlighted in red. An arrow indicates the alanine or tryptophan substitution that abolishes the catalytic activity of CitA (Figure 4). (B) Heatmap showing the changes in the level of various metabolites in WT and citA::Tn cells as measured by LC-MS. Cells were grown in PYE medium. Only the metabolites that were significantly increased or decreased in ∆citA compared to WT (p-value<0.05) are shown. Fold changes were calculated based on the mean of normalized ion counts from three biological replicates. (C) Distribution of citrate synthase paralogs encoded in various α-proteobacterial genomes. Blue and white boxes indicate the presence or absence, respectively, of a citrate synthase as identified by bi-directional BLASTP searches.
Figure 4 with 1 supplement
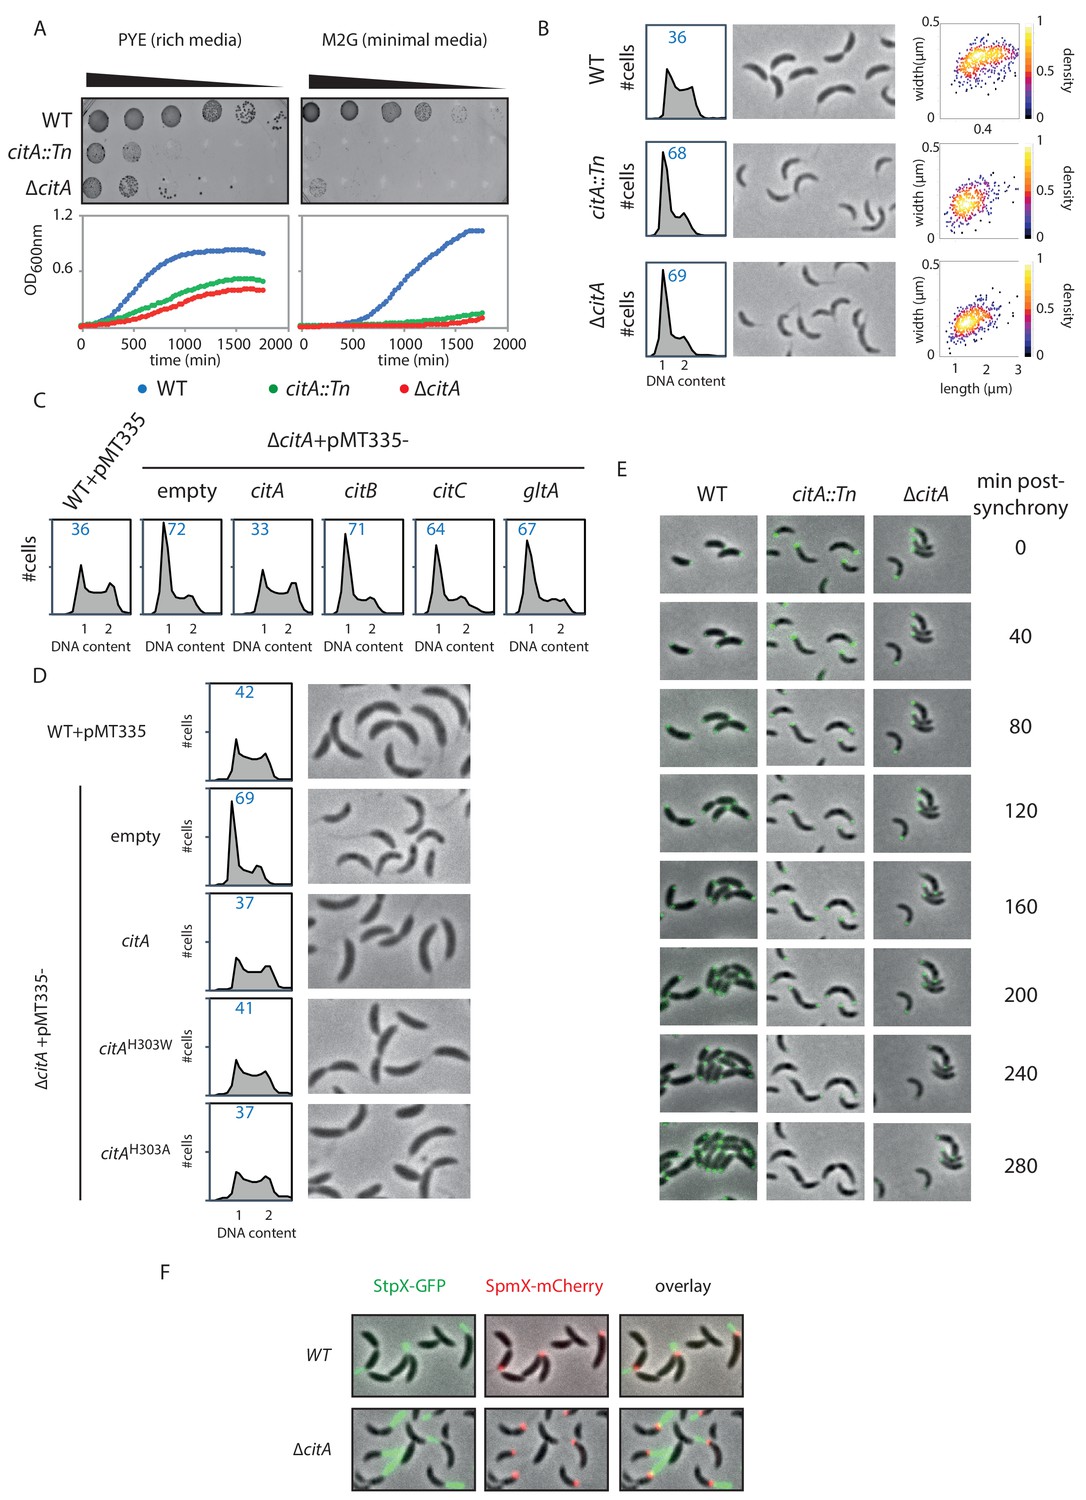
Inactivation of CitA induces a G1 block.
(A) Spot dilution (EOP assays) and growth curve measurements of WT (MB1), citA::Tn (MB2622) and ∆citA (MB2559) cells. For spot dilution, cells were grown overnight in PYE, adjusted to OD600nm ~0.5, and serially diluted on a rich (PYE) medium (left upper part) or on a minimal (M2G) medium (right upper part). For the growth curves, cells were grown overnight in PYE, washed twice with M2 buffer, and a similar amount of cellswas used to inoculate PYE medium (left bottom part) or M2G medium (right bottom part). (B) FACS profiles and phase contrast images of WT (MB1), citA::Tn (MB2622) and ∆citA (MB2559) cells growing exponentially in PYE. The right panel shows a scatter plot of the cell lengths and widths of each indicated population. (C) FACS profiles of ∆citA cells harboring an empty plasmid (MB3433), or a derivative with citA (MB3435), citB (MB3469), or citC (MB3471) from C. crescentus, or the citrate synthase gene (gltA) from E. coli (MB3473). WT cells harboring an empty pMT335 are also shown (MB1537). (D) FACS profiles and phase-contrast images of C. crescentus expressing a catalytic mutant of CitA. WT cells carrying an empty plasmid (MB1537), or ∆citA cells harboring an empty plasmid (MB3433) or a derivative with citA (MB3435), citAH303A (MB3439) or citAH303W (MB3437) are shown. (E) Time-lapse fluorescence microscopy of WT (MB557), citA::Tn (MB2452) and ∆citA (MB3467) cells harboring a parB::gfp-parB reporter. Cells were grown in PYE, synchronized and spotted on a PYE agarose pad. A picture was taken every 20 minutes. (F) Fluorescence microscopy of WT (MB334) and citA::Tn (MB3598) cells harboring a spmX::spmX-mCherry or a stpX::stpX-gfp reporter. Cells were grown exponentially in PYE. Each fluorescence channel is shown alone or together superimposed on phase contrast images.
Figure 4—figure supplement 1

Addition of glutamine does not ameliorate the citA mutant phenotype.
(A) Spot dilutions (EOP assays) of WT (MB1) and ∆citA (MB2559) cells. Each strain was grown overnight in PYE, adjusted to an OD600nm of 0.5, and ten-fold serially diluted on a PYE plate (upper part) or on minimal medium M2G (lower part) containing glutamine (right panel) or not (left panel). Eight microliters of each dilution were spotted onto the plates. (B) FACSprofiles of WT (MB1) and ∆citA (MB2559) cells during the exponential growth phase in PYE (upper panel) or in PYE containing glutamine (lower panel). (C) Spot dilutions of the WT E. coli carrying an empty plasmid (eMB554) or E. coli ∆gltA cells harboring an empty plasmid (eMB556) or a derivative expressing citAH303A (eMB583) or citAH303W (eMB581) on minimal medium containing glutamate (left panel) or not (right panel). Only the strain carrying a functional citrate synthase was able to grow without glutamate. (D) Immunoblot showing the abundance of CitA in the E. coli strains presented in panel (C) using an antibody to CitA. An asterisk indicates proteins that cross-react with the anti-CitA antibodies. All of the CitA variants are expressed at a similar level. (E) Immunoblot showing the abundance of CitA in the C. crescentus strains presented in Figure 4D using an antibody to CitA. All of the CitA variants are expressed at a similar level. CC_0164 serves as an immunoblot loading control. (F) Immunoblotting to determine the relative abundance of CitA and CtrA during the cell cycle of WT (MB1) C. crescentus. All strains were in synchronized in PYE and the Sw, St and Pd time point were taken at 0 minutes, 25 minutes and 60 minutes, respectively, post-synchrony. In the control, CtrA was probed to determine the quality of the synchrony. (G) FACS profiles on synchronized populations of the WT (MB1), citA::Tn (MB2622) and ∆citA (MB2559) to monitor DNA content throughout the C. crescentus cell cycle. WT (left panel), citA::gent (middle panel) and ∆citA (right panel) were synchronized and samples were withdrawn every 30 minutes and prepared for FACS analysis.
Figure 5 with 1 supplement
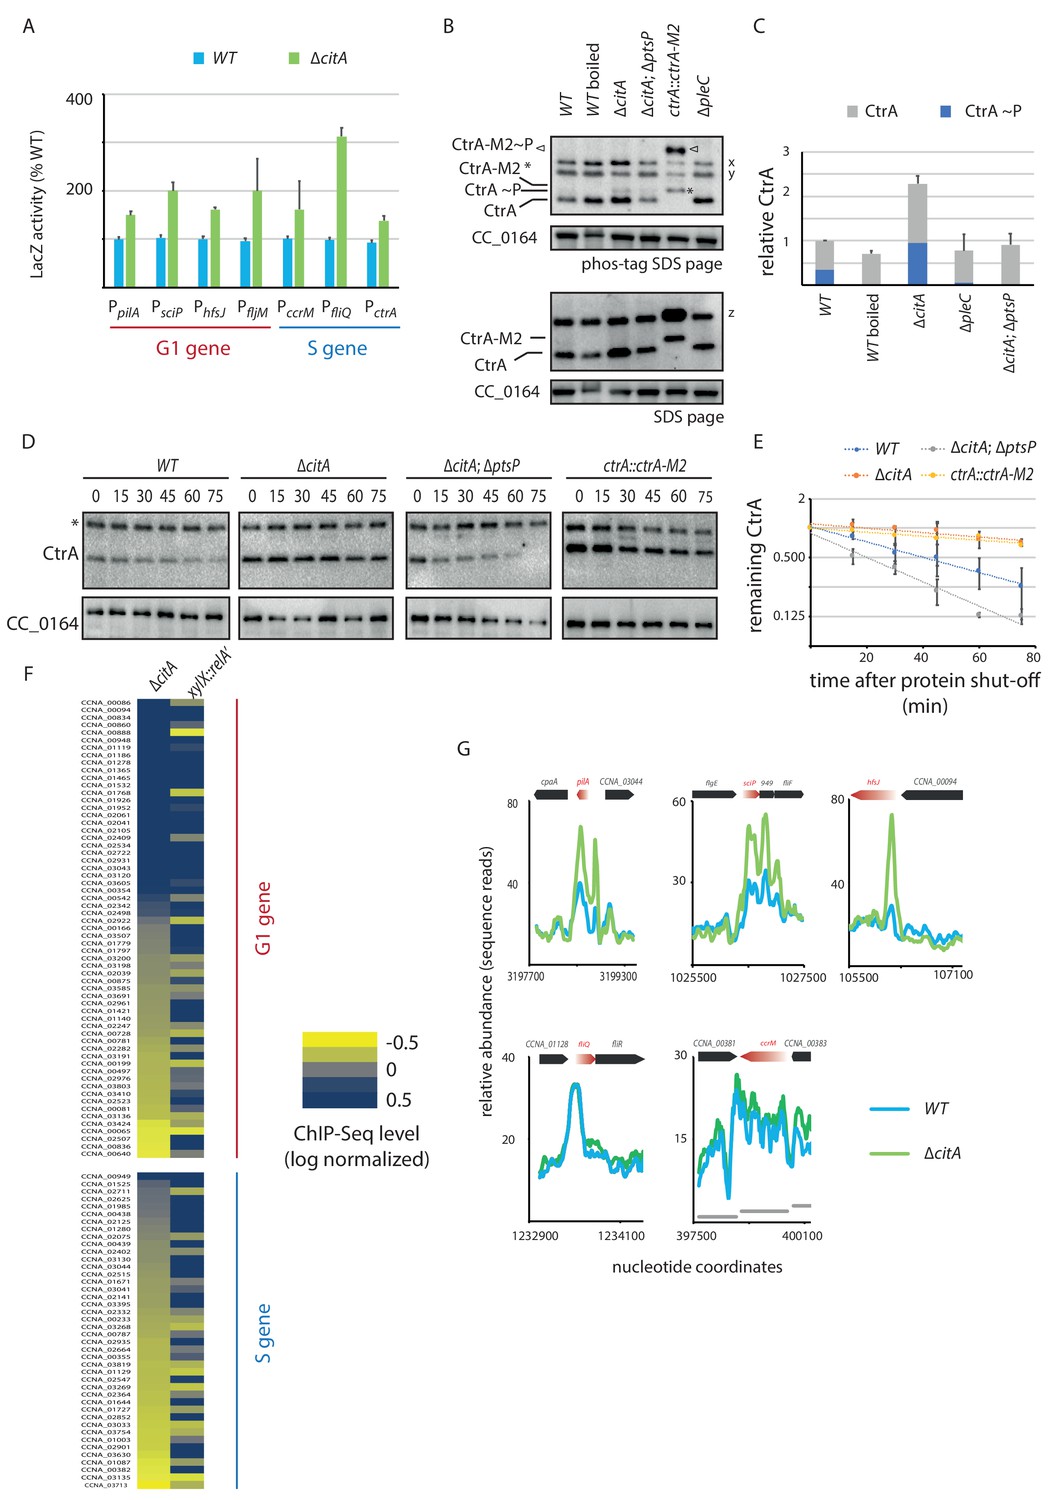
Absence of citA induces hyperactivation of CtrA.
(A) Promoter-probe assays of G1 (PpilA, PsciP, PhfsJ, PfljM) and S (PccrM, PfliQ, PctrA) transcriptional reporters that are directly activated by CtrA in WT or ∆citA cells. Values are expressed as relative values compared to the WT (activity in WT set at 100%). Error bars represent the standard deviation from the mean of three independent replicates. (B) Phos‐tag SDS‐PAGE (top part) immunoblots show phosphorylation of CtrA (CtrA ~P) in extracts from WT (MB1), ∆citA (MB2559) or ∆citA; ∆ptsP (MB2426) cells. As a control, boiling of a WT lysate leads to loss of detectable CtrA ~P. As additional controls, lysates from ∆pleC cells in which CtrA ~P levels are reduced (Biondi et al., 2006; Radhakrishnan et al., 2010) and from a strain harboring a tagged version (ctrA::ctrA-M2) as the only source CtrA (Domian et al., 1997) were analyzed. The same samples were analyzed by standard SDS-PAGE immunoblotting (bottom part) to measure total CtrA protein levels. In both cases, polyclonal antibodies to CtrA were used to reveal the immunoblot. The position of non-phosphorylated CtrA-M2 and phosphorylated CtrA-M2 (CtrA-M2 ~P) are indicated by a star and triangle, respectively. Non-specific bands that resulted from cross-reactivity of the antiserum to CtrA are indicated as x, y and z on the right of the immunoblots. (C) Graph showing quantification of band intensities from panel (B); the averages from two independent replicates are represented with error bars showing the standard deviations. (D) Immunoblot showing the stability of CtrA in WT (MB1), ∆citA (MB2529); ∆ptsP citA::Tn (MB2426) cells and in a strain expressing a stable variant of CtrA (NA1000; ctrA::ctrA-M2). Exponentially growing cultures were treated with chloramphenicol (50 μg.mL−1) to shut off protein synthesis. The abundance of CtrA and CC_0164 (as a loading control) was monitored over time. An asterisk indicates a contaminant band that cross-reacts with the CtrA antibody. (E) Graph showing quantification of band intensities from panel (C); averages from three independent replicates are represented with standard deviations shown as error bars. (F) Heat map to compare ChIP-Seq (chromatin immunoprecipitation coupled to deep-sequencing) performed with antibodies recognizing the RNAP on chromatin from WT (MB1), ∆citA (CC2529) and a strain expressing relA’-FLAG from the xylX promoter (MB3282). Direct targets of CtrA, classified into two classes—G1 and S—are represented. The color key indicates the degree to which the occupancy of RNAP is altered in the different genetic background compared to WT expressed as log2 ratio. (G) ChIP-Seq traces of RNAP on different CtrA target promoters in WT (MB1) (blue line) or ∆citA (MB2529) (green line) cells. Genes encoded are represented as boxes on the upper part of the graph, red genes indicate the gene of interest represented.
-
Figure 5—source data 1
ChIP-Seq data set showing RNAP peak abundance measured as sequencing reads of a 20-bp window across the genome of WT, ∆citA and xylX::Pxyl-relA’-FLAG cells (in sheet 1). Sheet two shows the peaks sorted for CtrA-activated promoters that fire in G1-phase, and sheet three shows the peaks for CtrA-activated promoters that fire in late S-phase.
- https://cdn.elifesciences.org/articles/52272/elife-52272-fig5-data1-v2.xlsx
Figure 5—figure supplement 1

Delayed polar development of cells lacking CitA.
(A) Fluorescence microscopy of WT (MB3566) and citA::Tn (MB3613) cells harboring a spmX::spmX-mCherry or a tipF::tipF-gfp reporter. Cells were grown in PYE. Each channel is shown individually, and an overlay is presented. (B) Motility plates (0.3% agar) inoculated with WT (MB1), ∆citA (MB2529), ∆ptsP citA::Tn (MB2426) and a strain expressing relA’-FLAG from the xylX promoter (MB3282) containing xylose (right panel) or not (left panel) to induce the relA’-FLAG construct. In the case of xylose induction, hypermotility of the MB3282 strain is observed contrary to the other strain. (C) Fluorescence microscopy 60 min post synchrony of WT (MB3568) cells and citA::Tn (MB3615) cells harboring a spmX::spmX-mCherry or a xylX::mipZ-yfp reporter. Cells were grown in PYE and induced by 0.3% xylose 1 hr before the beginning of the synchrony. Each channel is shown individually, and an overlay is presented. Black arrows indicate cells containing one spot of SpmX, which have not duplicated their chromosome, as shown by the MipZ foci. (D) Scatter plot comparing RNAP occupancy (log normalized) in WT (x-axis) and ∆citA (y-axis) strains (left panel) or in WT (x-axis) and xylX::relA’-FLAG (y-axis) strains (right panel). Blue: G1 gene; red: S gene; gray: others (E) Promoter-probe assays of G1 (PpilA, PhfsJ) transcriptional reporters that are direct targets of CtrA in WT or ∆popA or ∆rcdA cells. Values are expressed as relative values compared to the WT value (activity in WT set at 100%). Error bars represent the standard deviations of the means from three independent replicates.
Figure 6 with 1 supplement
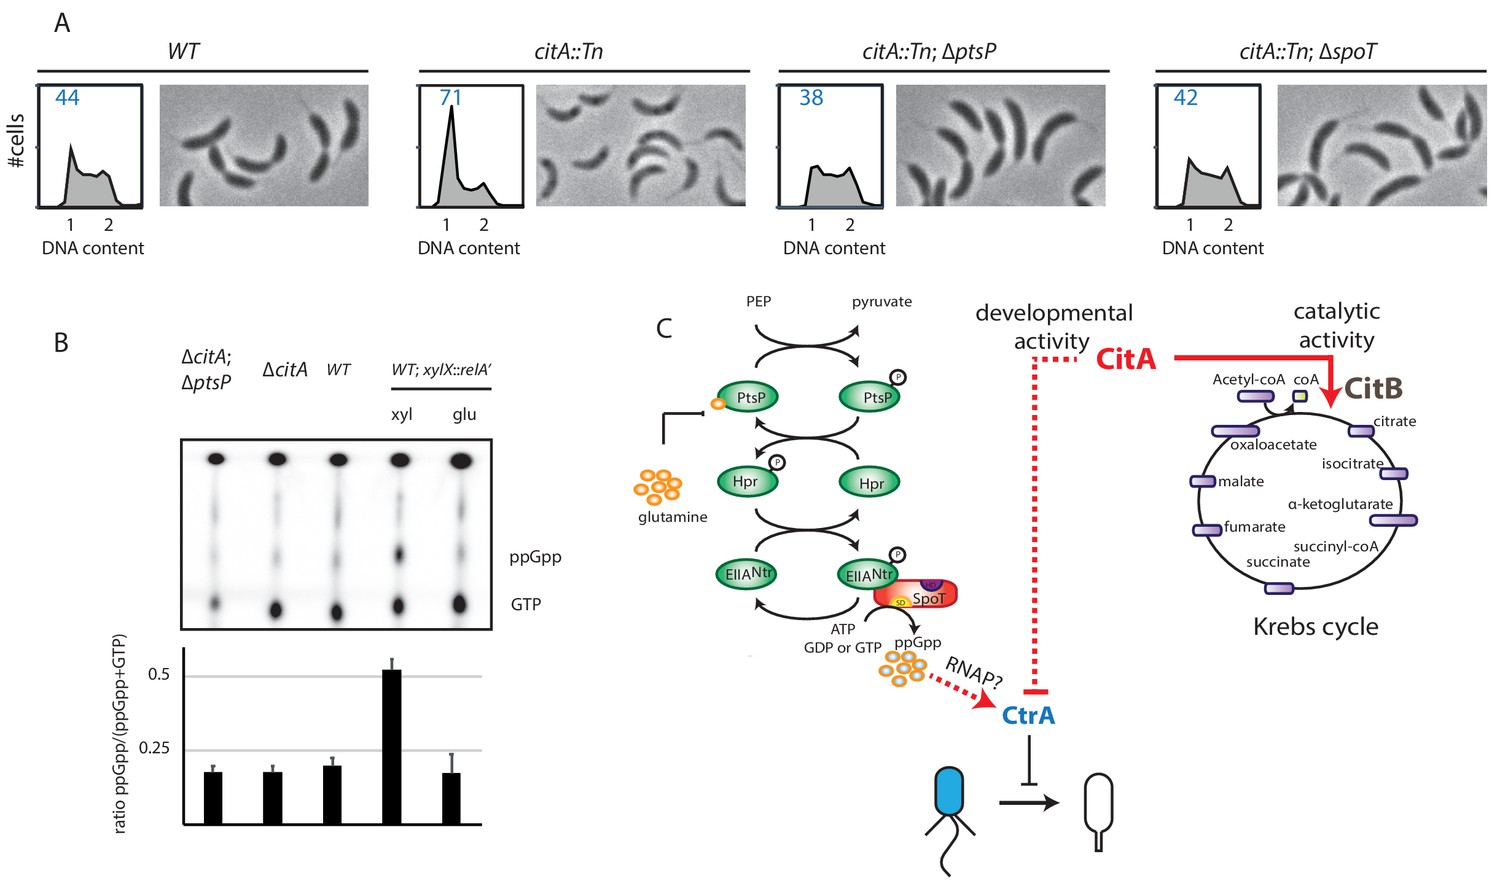
Absence of (p)ppGpp counteracts the ∆citA phenotype.
(A) Flow cytometry profiles and phase contrast images of WT (MB1), citA::Tn (MB2622), ∆spoT citA::Tn (MB2413) and ∆ptsP citA::Tn (MB2426) cells. Genome content was analyzed by FACS during the exponential growth phase in PYE. (B) Intracellular levels of (p)ppGpp in WT, ∆citA (MB2529), ∆citA; ∆ptsP (MB2426) and (as a positive control) RelA’-FLAG-expressing cells (MB3282). Cells were cultivated in PYE. MB3282 was cultivated in PYE for 3 hours and, then, cultures were divided in two. Glucose 0.2% or xylose 0.3% was added to repress or induce the induction of relA’-FLAG for one hour. The TLC autoradiograph image shown in the upper part of the figure was used to calculate the ppGpp/(GTP+ppGpp) shown in the lower panel. Error bars represent the standard deviations of the means from three independent replicates. (C) Scheme of the PtsNtrsignalling pathway (Ronneau et al., 2016) Intracellular glutamine regulates the autophosphorylation of PtsP. Under nitrogen starvation, the glutamine pool drops, triggering PtsP phosphorylation that leads to an increase of phosphorylated EIINtr. Once phosphorylated, EIINtr inhibits the hydrolase activity of SpoT, leading to the accumulation of (p)ppGpp, which acts as a positive regulator of CtrA and is bound by RNA polymerase (RNAP). The two functions of CitA are represented, one as a metabolic enzyme in the Krebs cycle and the other in the development of C. crescentus involving negative activity on CtrA that is independent of its catalytic activity. Dashed lines indicate that the suspected action on CtrA is indirect.
Figure 6—figure supplement 1
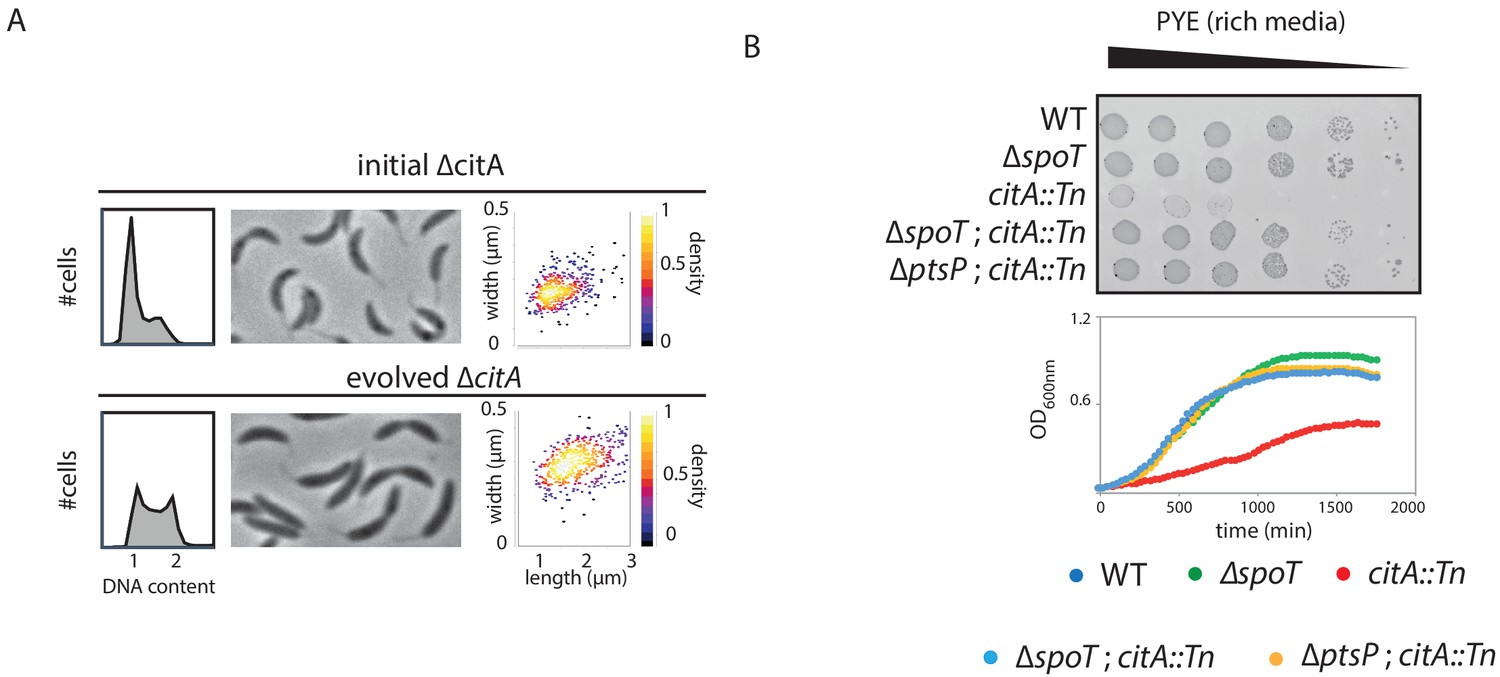
Bypass of the citA mutation by inactivation of ptsP or spoT.
(A) FACS profiles and phase-contrast images of ∆citA (initial strain, upper part) or ∆citA after the evolution experiment (evolved strain, bottom part). Cells were exponentially grown in PYE and genome content was analyzed by FACS. The right part shows scatter plots of cell lengths and widths of each indicated population. (B) Spot EOP assays) dilution and growth curve of WT (MB1), ∆spoT (MB2403), citA::Tn (MB2622), ∆spoT; citA::Tn (MB2413) and ∆ptsP; citA::Tn (MB2426) cells. For spot dilution, cells were grown overnight in PYE, adjusted to OD600nm ~0.5, and serially diluted on a rich PYE medium (upper part). For growth curve, cells were grown overnight in PYE, and a similar amount of each strain was used to inoculate PYE medium (bottom part).
Tables
Key resources table
| Reagent type (species) or resource | Designation | Source or reference | Identifiers | Additional information |
|---|---|---|---|---|
| Strain, strain background (Caulobacter crescentus NA1000) | Caulobacter crescentus NA1000 | Evinger and Agabian; PMID:334726 | See Supplementary file 1 | |
| Antibody | CtrA Rrabbit polyclonal | Delaby et al., 2019 PMID:31598724 | CtrA antibody are home-made raised against the full-length protein of C. crescentus. | Immunoblot: 1/5000 dilution. Figure 4—figure supplement 1 |
| Antibody | CitA Rrabbit polyclonal | This study | CitA antibody are home-made raised against the full-length protein of C. crescentus. | Immunoblot: 1/5000 dilution Figure 4—figure supplement 1 |
| Antibody | E. coli RNA Polymerase Antibody Sampler Kit Mouse monoclonal | Biolegend | 699907 | Mix 1:1:1:1 between all sera. ChIP-Seq: 1/500 dilution, Figure 5 |
| Commercial assay or kit | Phos-tag | FUJIFILM Wako Chemicals | Distributor 300–93523 Manufacturer AAL-107M | 25 μM final, Figure 5 |
| Chemical compound | H332PO4 | Hartmann Analytic | Cat n° P-RB-1 | |
| Chemical compound | Acetonitrile OPTIMA LC/MS grade | Fisher Scientific | A955-212 | |
| Chemical compound | Methanol OPTIMA LC/MS grade | Fisher Scientific | A456-212 | |
| Chemical compound | Water LC/MS grade | Fisher Scientific | W/0112/17 | |
| Chemical compound | Formic acid | Biosolve | 069141 | |
| Chemical compound | Ammonium hydroxide solution 25% | Sigma-Aldrich | 30501 | |
| Chemical compound | Mass Spectrometry Metabolite Library | Sigma-Aldrich | MSMLS-1EA | |
| Chemical compound | Major Mix IMS TOF calibration kit | Waters | 186008113 | |
| Chemical compound | Leucine Enkephalin | Waters | 700004768–1 | Waters TOF G2-S Sample Kit −2 (700008892) |
| Software, algorithm | UNIFI V.1.9.3 | Waters | ||
| Software, algorithm | Progenesis QI v2.3 | Nonlinear Dynamics, Waters | ||
| Software,algorithm | SIMCA-P 15.0 | Umetrics | ||
| Software, algorithm | MicrobeJ | Ducret, 2017 PMID:27572972 | ||
| Software, algorithm | SeqMonk | Babraham Bioinformatics Institute | V1.40.0 | |
| Other | Polyethyleneimine (PEI) plate | Sigma-Aldrich | Ref Z122882-25EA | Figure 6 |
| Other | Merck SeQuant ZIC-pHILIC column (150 × 2.1 mm, 5 µm) | Merck Millipore | 1504600001 | |
| Other | Merck SeQuant ZIC-pHILIC Guard kit (20 × 2.1 mm, 5 µm) | Merck Millipore | 1504380001 |
Additional files
-
Supplementary file 1
Table of C. crescentus and E. coli strains used in this study.
- https://cdn.elifesciences.org/articles/52272/elife-52272-supp1-v2.docx
-
Supplementary file 2
Table of plasmids used in this study.
- https://cdn.elifesciences.org/articles/52272/elife-52272-supp2-v2.docx
-
Supplementary file 3
Table of oligonucleotides used in this study.
- https://cdn.elifesciences.org/articles/52272/elife-52272-supp3-v2.docx
-
Supplementary file 4
Key resources table: table of reagents and antibodies used in this study.
- https://cdn.elifesciences.org/articles/52272/elife-52272-supp4-v2.docx
-
Transparent reporting form
- https://cdn.elifesciences.org/articles/52272/elife-52272-transrepform-v2.pdf
Download links
A two-part list of links to download the article, or parts of the article, in various formats.
Downloads (link to download the article as PDF)
Open citations (links to open the citations from this article in various online reference manager services)
Cite this article (links to download the citations from this article in formats compatible with various reference manager tools)
Bacterial cell cycle control by citrate synthase independent of enzymatic activity
eLife 9:e52272.
https://doi.org/10.7554/eLife.52272


