The metalloproteinase Papp-aa controls epithelial cell quiescence-proliferation transition
- Department of Molecular, Cellular, and Developmental Biology, University of Michigan, United States
- College of Ocean and Earth Sciences, Xiamen University, China
- Department of Molecular Biology and Genetics, Aarhus University, Denmark
Figures
Figure 1
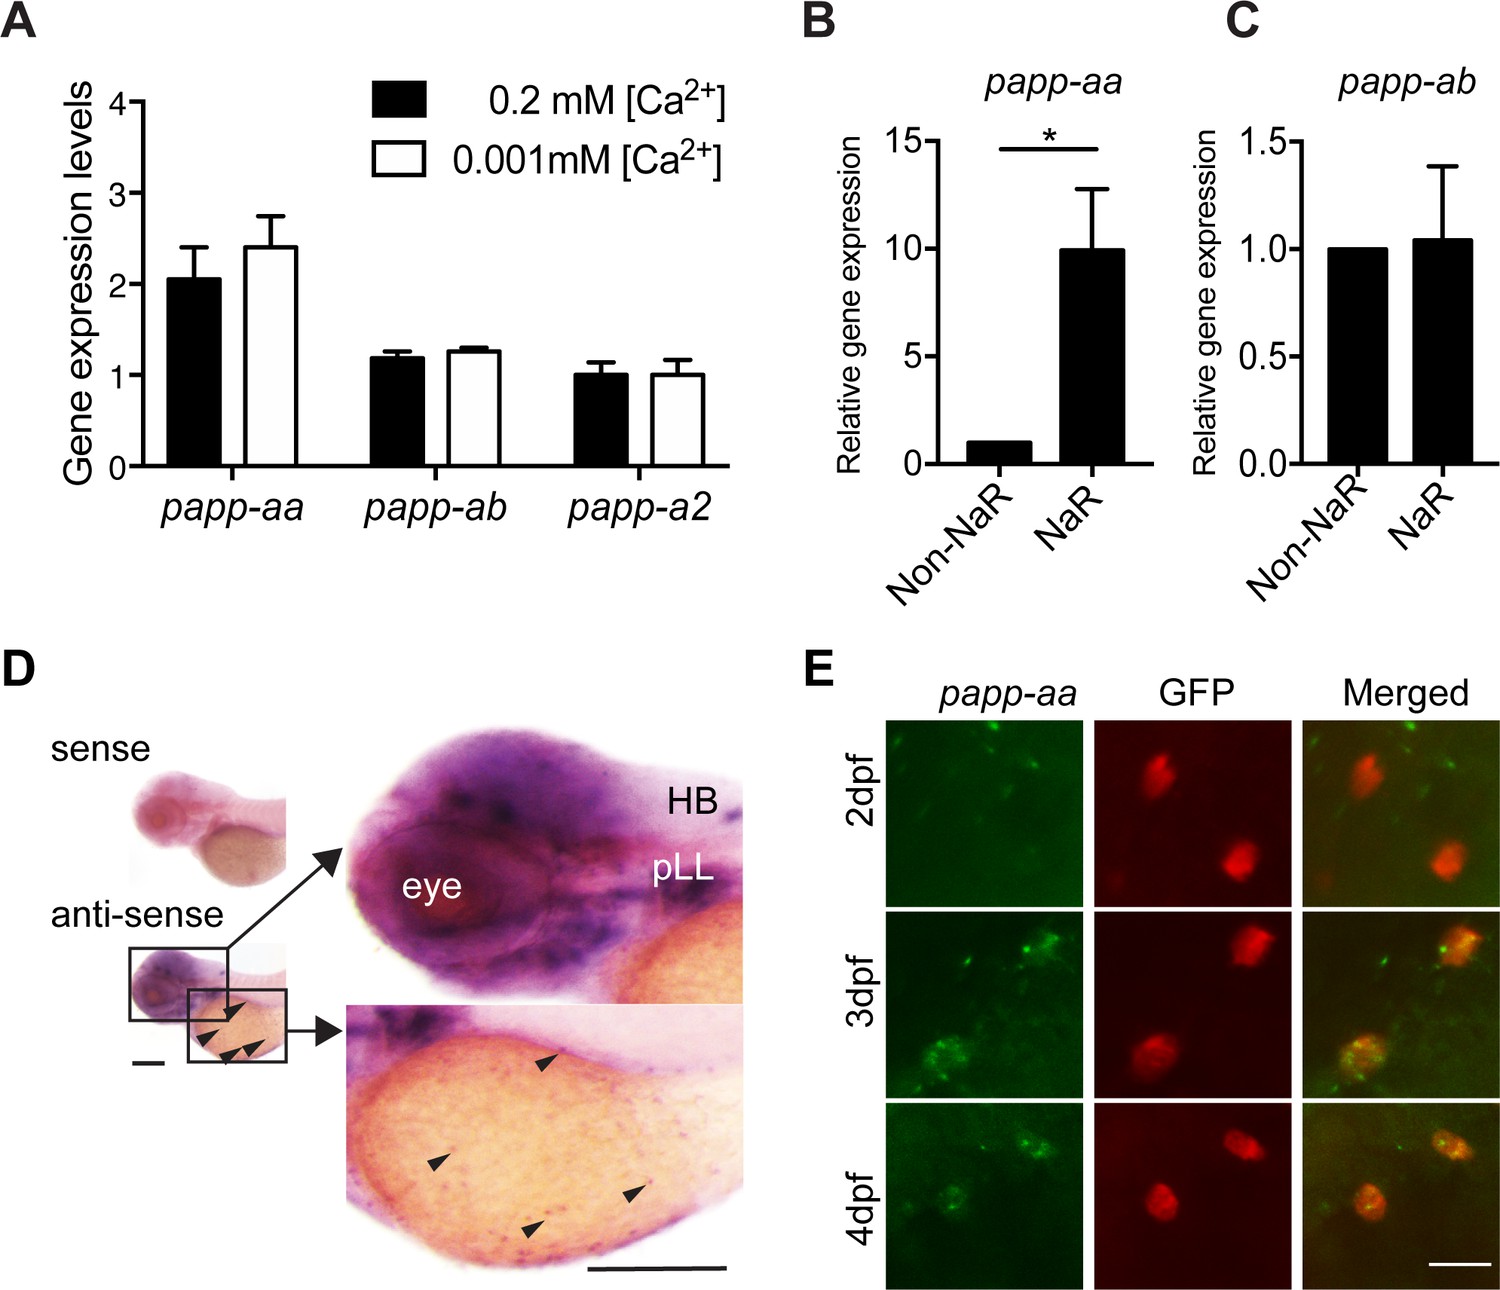
Papp-aa is highly expressed in NaR cells.
(A) Tg(igfbp5a:GFP) fish were raised in E3 embryo medium to 3 days post fertilization (dpf) and transferred to embryo media containing the indicated [Ca2+]. Eighteen hours later, NaR cells were isolated by FACS. The levels of papp-aa, papp-ab, and papp-a2 mRNA were measured and shown. Data shown are Mean ± SEM, n = 4. (B–C) NaR cells and other cells in four dpf Tg(igfbp5a:GFP) larvae were separated by FACS. The levels of papp-aa (B) and papp-ab (C) mRNA were measured and shown. *, p<0.05 by unpaired two-tailed t test. n = 3. (D) Whole mount in situ hybridization analysis of papp-aa mRNA in three dpf larvae. HB, hindbrain. pLL, posterior lateral line ganglion. Arrowheads indicate papp-aa mRNA signal in the yolk sac region. A sense cRNA probe was used as a negative control. Scale bar = 0.2 mm. (E) Tg(igfbp5a:GFP) fish of the indicated stages were analyzed by double label staining. Scale bar = 20 µm.
-
Figure 1—source data 1
Excel spreadsheet containing quantitative data for Figure 1.
- https://cdn.elifesciences.org/articles/52322/elife-52322-fig1-data1-v4.xlsx
Figure 2 with 4 supplements
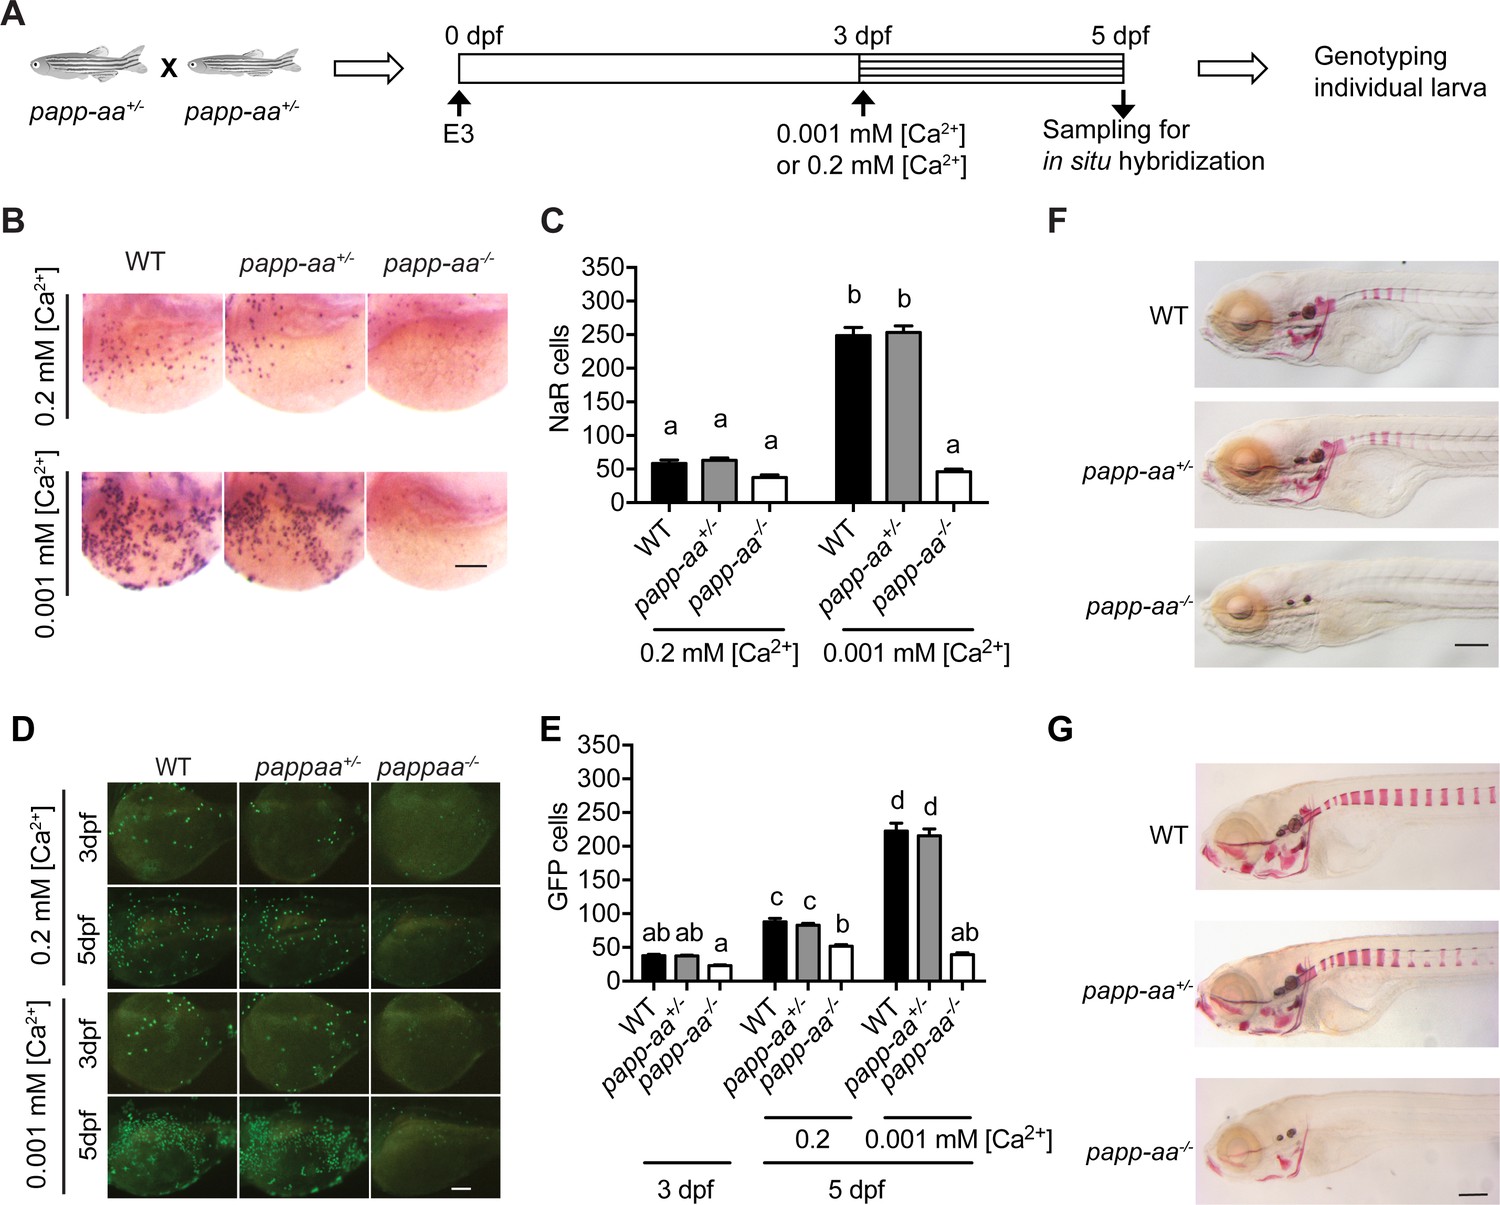
Genetic deletion of papp-aa impairs NaR cell reactivation and bone calcification.
(A) Diagram of the experimental design. Progeny of papp-aa+/- fish intercrosses were raised in standard E3 embryo medium to three dpf. The progeny is a mixture of homo, hetero, and wild type embryos. They were transferred to the low [Ca2+] (0.001 mM) or normal [Ca2+] (0.2 mM) embryo medium at three dpf. Two days later, NaR cells in each fish were detected by igfbp5a mRNA expression and quantified. These fish were genotyped individually afterwards. (B–C) Progeny of papp-aa+/- intercrosses were treated as described in (A). Representative images are shown in (B) and quantified data in (C). Scale bar = 0.1 mm. n = 10 ~ 30 fish/group. In this and all subsequent figures, data shown are Mean ± SEM. Different letters indicate significant differences among groups by one-way ANOVA followed by Tukey’s multiple comparison test (p<0.05). (D–E) Progeny of papp-aa+/-;Tg(igfbp5a:GFP) fish intercrosses were raised in E3 medium to three dpf and transferred to the low [Ca2+] (0.001 mM) or normal [Ca2+] (0.2 mM) embryo medium. Two days later, the number of GFP-expressing NaR cells in each larva was quantified. The larvae were genotyped individually subsequently. Representative images are shown in (D) and quantified data in (E). Scale bar = 0.1 mm. n = 16 ~ 82 fish/group. (F–G) Fish of the indicated genotypes were raised in E3 embryo medium to 7 dpf and 12 dpf and stained with Alizarin Red. Scale bar = 0.2 mm.
-
Figure 2—source data 1
Excel spreadsheet containing quantitative data for Figure 2.
- https://cdn.elifesciences.org/articles/52322/elife-52322-fig2-data1-v4.xlsx
Figure 2—figure supplement 1
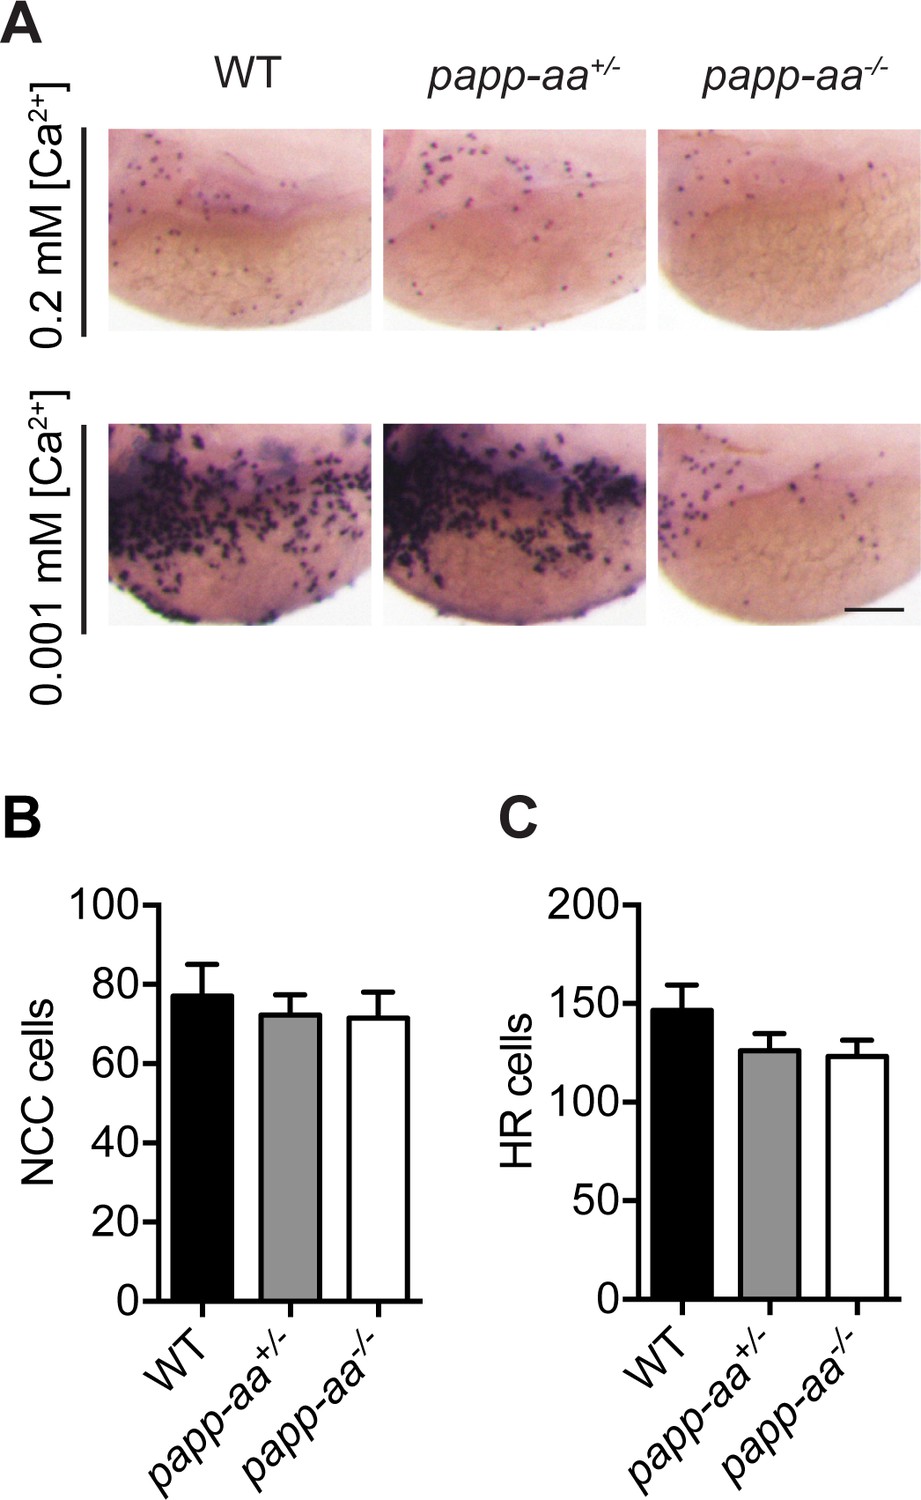
Genetic deletion of papp-aa impairs NaR cell proliferation, but has no effect on HR and NCC cells.
(A) Progeny of papp-aa+/- intercrosses were treated as described in Figure 2A. NaR cells were visualized by trpv6 mRNA mRNA in situ hybridization. Scale bar = 0.1 mm. (B–C) Progeny of papp-aa+/- intercrosses were treated as described in (A). NCC cells (B) and HR cells (C) were labeled by slc12a10.2 mRNA and atp6v1al mRNA in situ hybridization and quantified. Each larva was genotyped afterwards. n = 7 ~ 31 fish/group.
-
Figure 2—figure supplement 1—source data 1
Excel spreadsheet containing quantitative data for Figure 2—figure supplement 1.
- https://cdn.elifesciences.org/articles/52322/elife-52322-fig2-figsupp1-data1-v4.xlsx
Figure 2—figure supplement 2
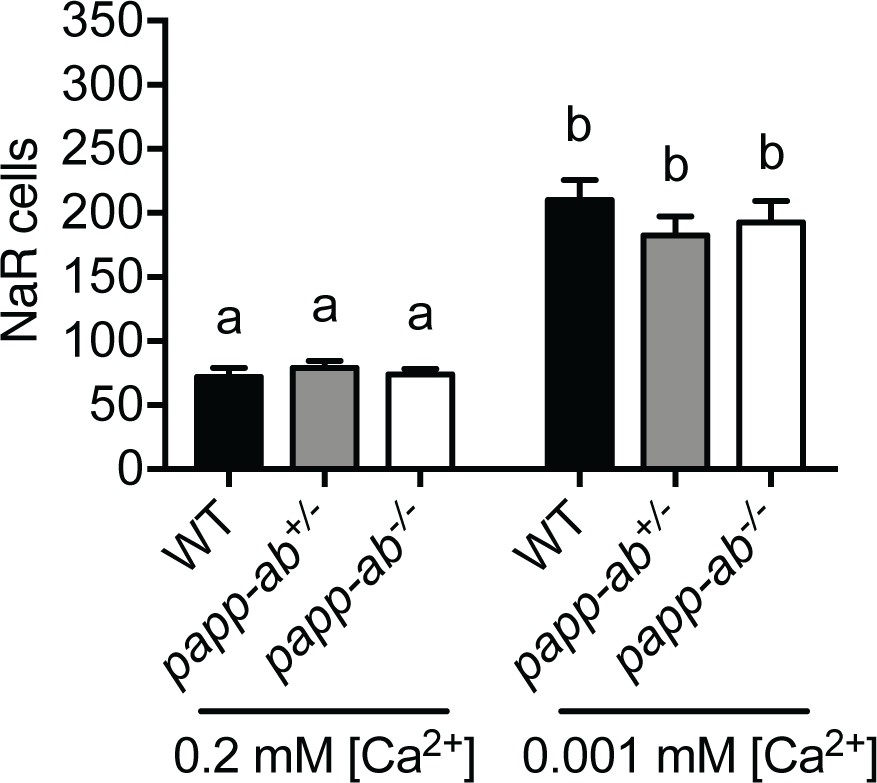
Genetic deletion of papp-ab has no effect on NaR cell proliferation.
The experimental design is the same as described in Figure 2A. NaR cells were labeled by igfbp5a mRNA expression and quantified followed by individual genotyping afterwards. n = 10 ~ 26 fish/group.
-
Figure 2—figure supplement 2—source data 1
Excel spreadsheet containing quantitative data for Figure 2—figure supplement 2.
- https://cdn.elifesciences.org/articles/52322/elife-52322-fig2-figsupp2-data1-v4.xlsx
Figure 2—figure supplement 3
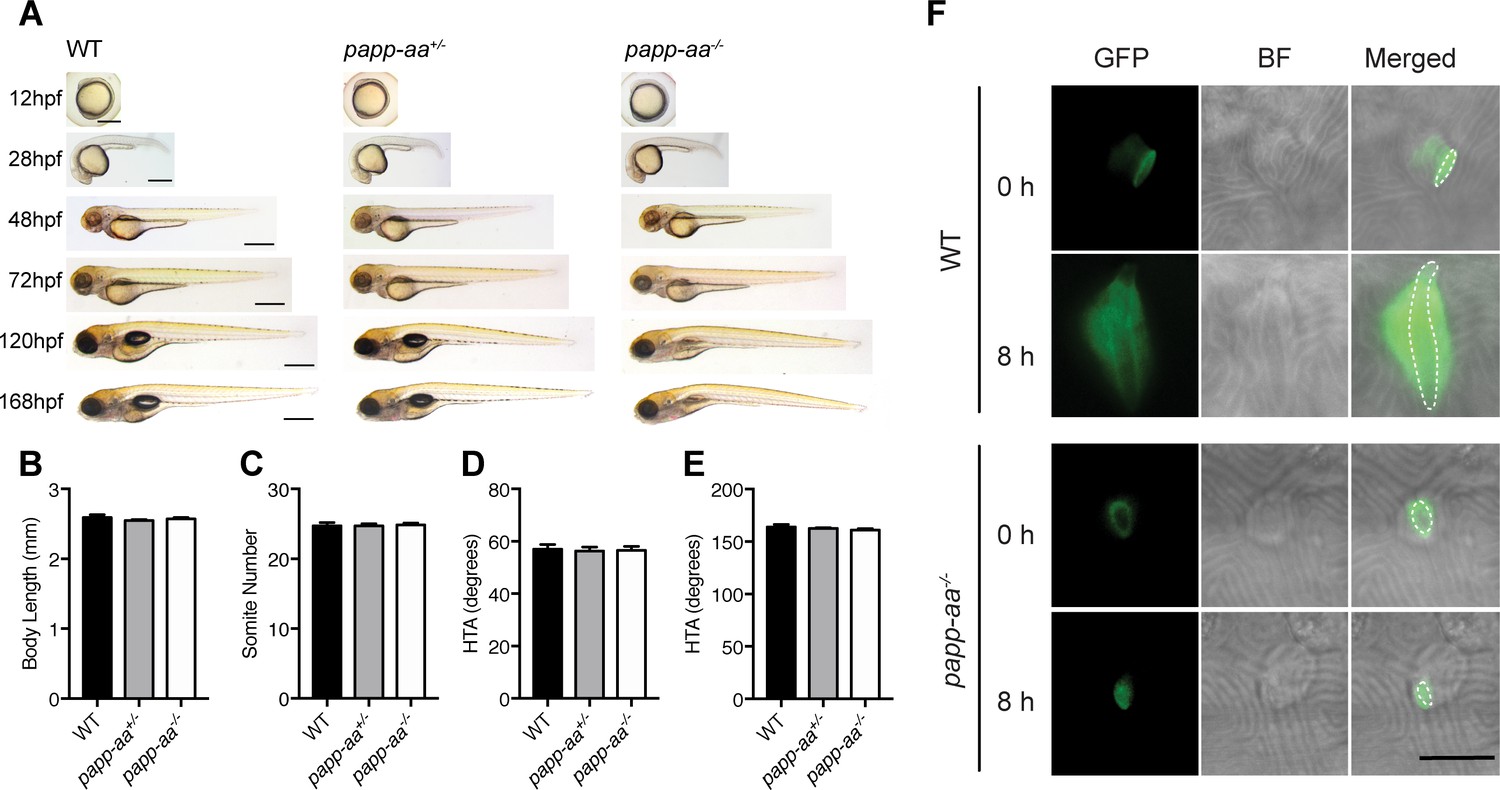
Global and local effects of genetic deletion of papp-aa.
(A) Gross morphology of wild-type (WT), papp-aa+/-, and papp-aa-/- fish at the indicated stages. Lateral views with anterior to the left. Scale bar = 0.5 mm. (B–E) Body length (B), somite number (C), and head-trunk angle (D) were measured at 24 hpf and head-trunk angle (E) at three dpf. Data shown are means ± SEM. n = 6 ~ 24 fish/group. No statistical significance was found using one-way ANOVA followed by Tukey’s multiple comparison test. (F) Fish of the indicated genotypes were raised in E3 medium to three dpf. NaR cells were imaged before and 8 hr after the low [Ca2+] treatment. The apical opening was marked by dotted lines. Scale bar = 10 µm.
-
Figure 2—figure supplement 3—source data 1
Excel spreadsheet containing quantitative data for Figure 2—figure supplement 3.
- https://cdn.elifesciences.org/articles/52322/elife-52322-fig2-figsupp3-data1-v4.xlsx
Figure 2—figure supplement 4

Genetic deletion of papp-aa impairs bone calcification.
(A–C) Fish of the indicated genotypes were raised in E3 embryo medium to 10 dpf (B) and 12 dpf (C) and stained with Alizarin Red. Representative images of 10 dpf are shown in (A). Scale bar = 0.5 mm. The number of calcified vertebral columns among the first ten columns were quantified and shown. n = 6 ~ 26 fish/group.
-
Figure 2—figure supplement 4—source data 1
Excel spreadsheet containing quantitative data for Figure 2—figure supplement 4.
- https://cdn.elifesciences.org/articles/52322/elife-52322-fig2-figsupp4-data1-v4.xlsx
Figure 3
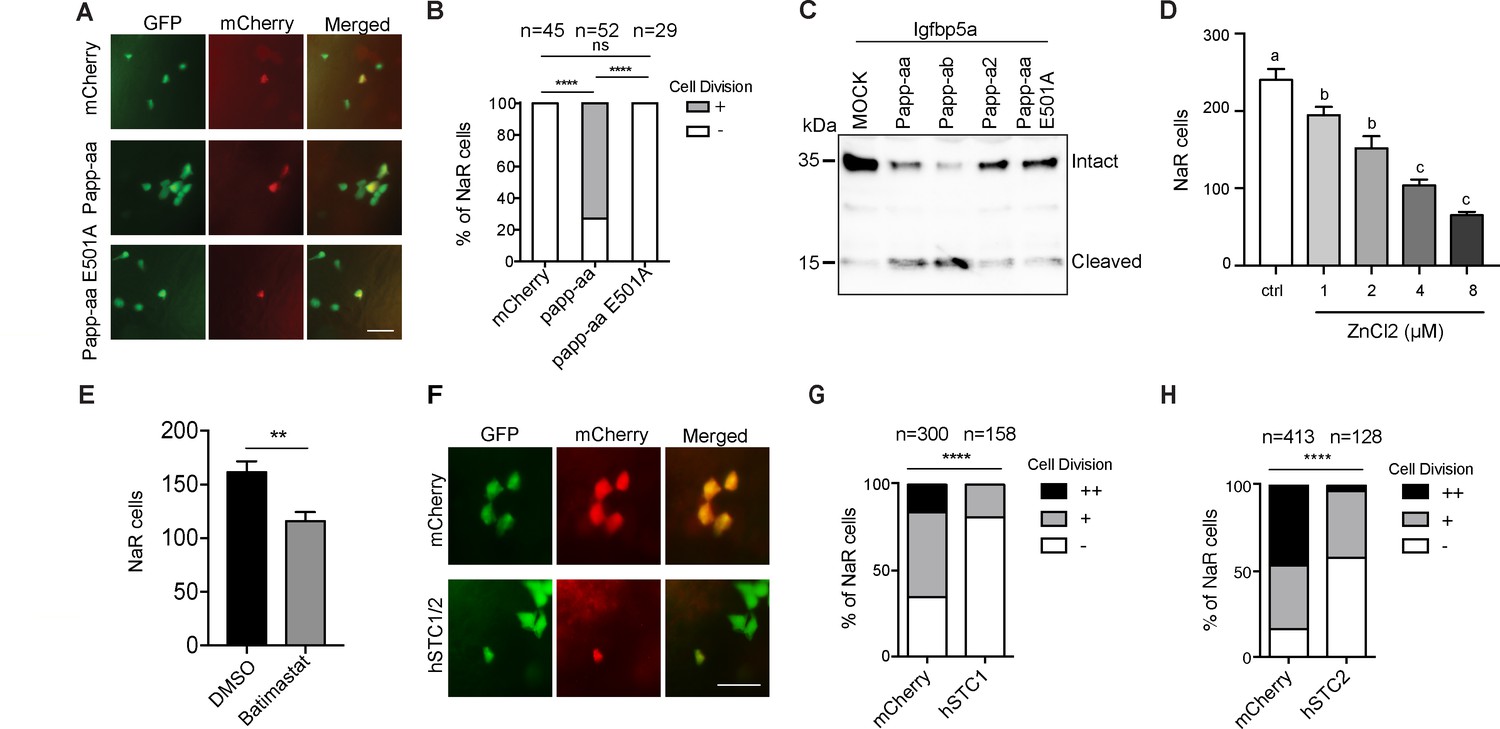
Papp-aa proteinase activity is in NaR cells critical.
(A–B) Progeny of papp-aa+/-;Tg(igfbp5a:GFP) intercrosses were injected with BAC(igfbp5a:mCherry) containing the indicated gene. They were subjected to the low [Ca2+] stress test described in Figure 2A. Papp-aa-IRES-mCherry, Papp-aa E501A-IRES-mCherry, or mCherry expressing NaR cells were detected by GFP and mCherry expression. NaR cells expressing mCherry or Papp-aa-mCherry (yellow, double labeled by GFP and mCherry) were scored following a published scoring system (Liu et al., 2018). Representative images are shown in (A) and quantified data in (B). Scale bar = 50 µm. +, one cell division, -, no division. ****, p<0.0001 by Chi-square test. The total cell number is shown above the bar. (C) Conditioned media collected from HEK293 cells co-transfected with Igfbp5a and the indicated plasmid were analyzed by western blotting. Intact and cleaved Igfbp5a bands were indicated. (D–E) Tg(igfbp5a:GFP) fish were transferred to the low [Ca2+] medium containing 0–8 µM ZnCl2 (D) or 200 µM Batimastat at three dpf (E). After two days of treatment, NaR cells were quantified and shown. n = 18 ~ 25 fish/group. **, p<0.001 by unpaired two-tailed t test. (F–H) Tg(igfbp5a:GFP) embryos were injected with BAC(igfbp5a:mCherry, BAC(igfbp5a:hSTC1-IRES-mCherry) (G) or BAC(igfbp5a:hSTC2-IRES-mCherry) (H). They were raised and subjected to the low [Ca2+] stress test described in Figure 2A. NaR cells expressing mCherry or human STC (yellow, double labeled by GFP and mCherry) were scored following a published scoring system (Liu et al., 2018). Representative images are shown in (F) and quantified results in (G and H). ++, two cell division, +, one cell division, -, no division during the experiment. ****, p<0.0001, Chi-square test. Total cell number is shown above the bar.
-
Figure 3—source data 1
Excel spreadsheet containing quantitative data for Figure 3.
- https://cdn.elifesciences.org/articles/52322/elife-52322-fig3-data1-v4.xlsx
Figure 4 with 1 supplement
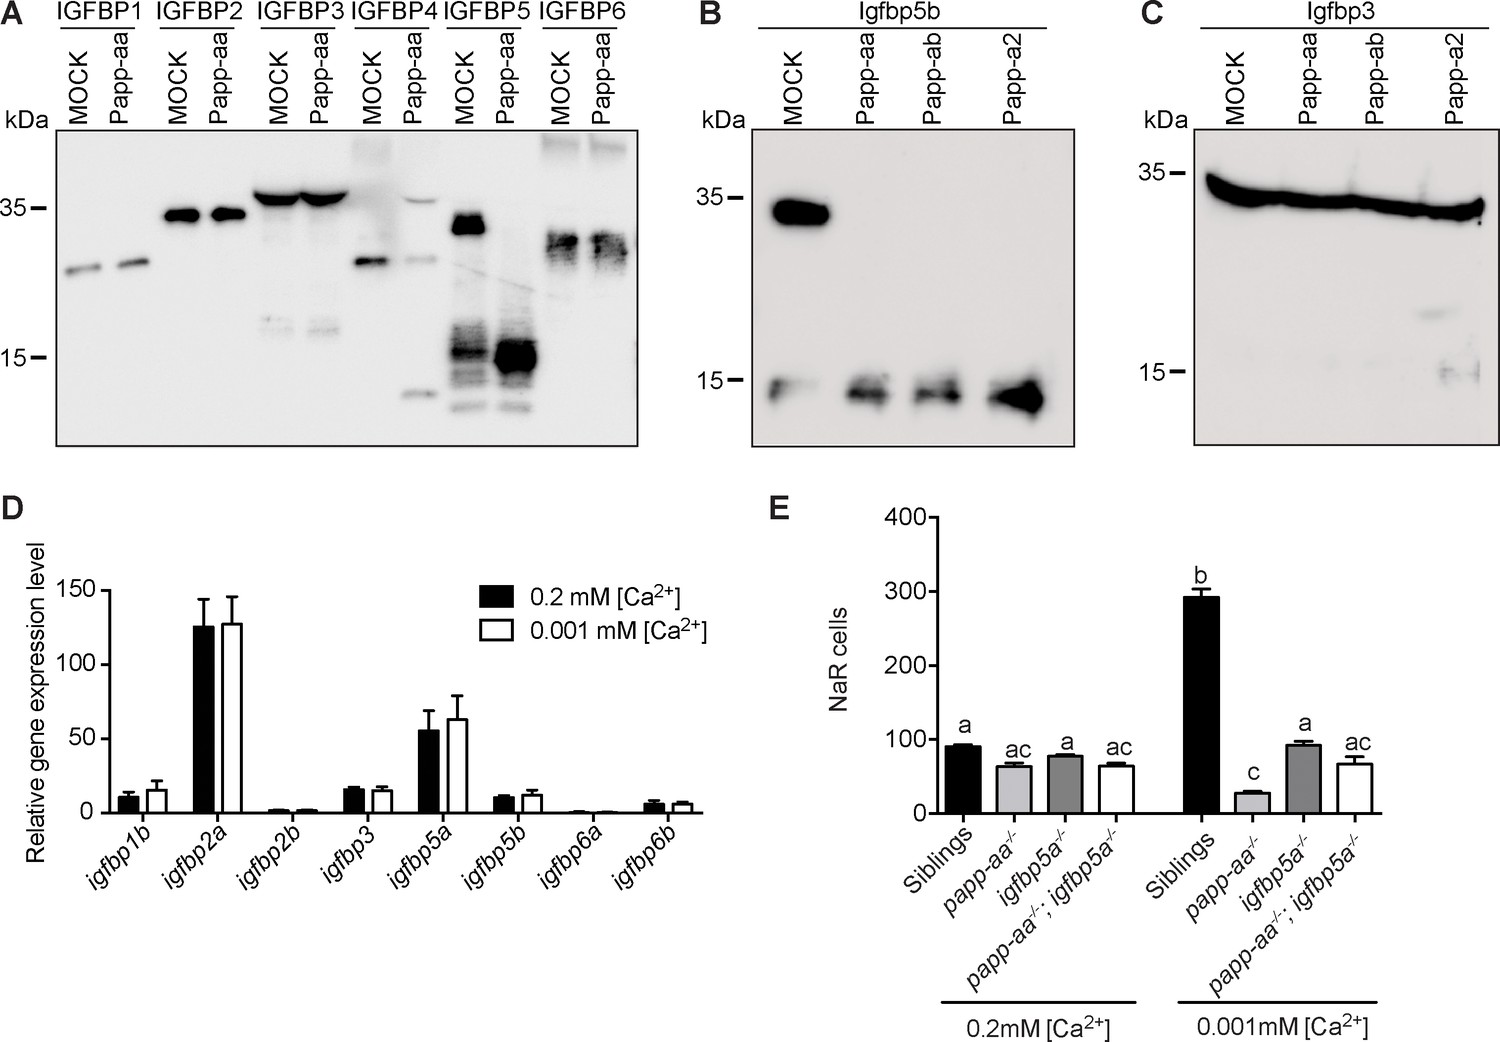
Papp-aa is an Igfbp5 proteinase and Papp-aa-mediated Igfbp5 proteolysis in NaR cells is critical.
(A) Purified human IGFBP1, 2, 3, 4, 5, and six was incubated for 2 hr at 28°C with conditioned media collected from HEK293 cells transfected with zebrafish Papp-aa and from Mock transfected cells. For the IGFBP4 group, 100 nM IGF1 was added prior to the initiation of the proteinase assay. The protease reaction was stopped and analyzed by western blotting. (B) Conditioned media collected from HEK293 cells co-transfected with Igfbp5b and the indicated plasmid were analyzed by western blotting. Intact and cleaved Igfbp5b bands were indicated. (C) Conditioned media collected from HEK293 cells co-transfected with Igfbp3 and the indicated plasmid were analyzed by western blotting. Intact and cleaved Igfbp3 bands were indicated. (D) Tg(igfbp5a:GFP) fish were raised in E3 embryo medium to 3 days post fertilization (dpf) and transferred to embryo media containing the indicated [Ca2+]. Eighteen hours later, NaR cells were isolated by FACS. The mRNA levels of the indicated igfbp genes were measured and shown. Data shown are Mean ± SEM, n = 4. (E) Progenies resulted from papp-aa+/-; igfbp5a+/- and papp-aa+/-; igfbp5a-/- intercrosses were raised in E3 embryo medium to three dpf and transferred to the normal [Ca2+] (0.2 mM) or low [Ca2+] (0.001 mM) embryo medium. At five dpf, NaR cells in each fish were labeled by igfbp5a mRNA expression and quantified. Each fish was genotyped individually afterward. Quantified data are shown. n = 18 ~ 63 fish/group.
-
Figure 4—source data 1
Excel spreadsheet containing quantitative data for Figure 4.
- https://cdn.elifesciences.org/articles/52322/elife-52322-fig4-data1-v4.xlsx
Figure 4—figure supplement 1

Conservation of Papp-aa cleavage site in Igfbp5a and 5b.
(A) L-domain sequence of human IGFBP5, zebrafish Igfbp5a, and Igfbp5b. K128 in human IGFBP5, K147 or K148 in zebrafish Igfbp5a and K144 or K145 in Igfbp5b are indicated in red. (B) Igfbp5a and the indicated Igfbp5a mutant protein were incubated with conditioned media collected from HEK293 cells transfected with Papp-aa, Papp-ab, or Mock for 2 hr. The proteinase reaction was stopped and analyzed by western blotting. (C) Igfbp5b and the indicated Igfbp5b mutant protein were incubated with conditioned media collected from HEK293 cells transfected with Papp-aa, Papp-ab, or Mock for 2 hr. The protease reaction was stopped and analyzed by western blotting.
Figure 5 with 1 supplement
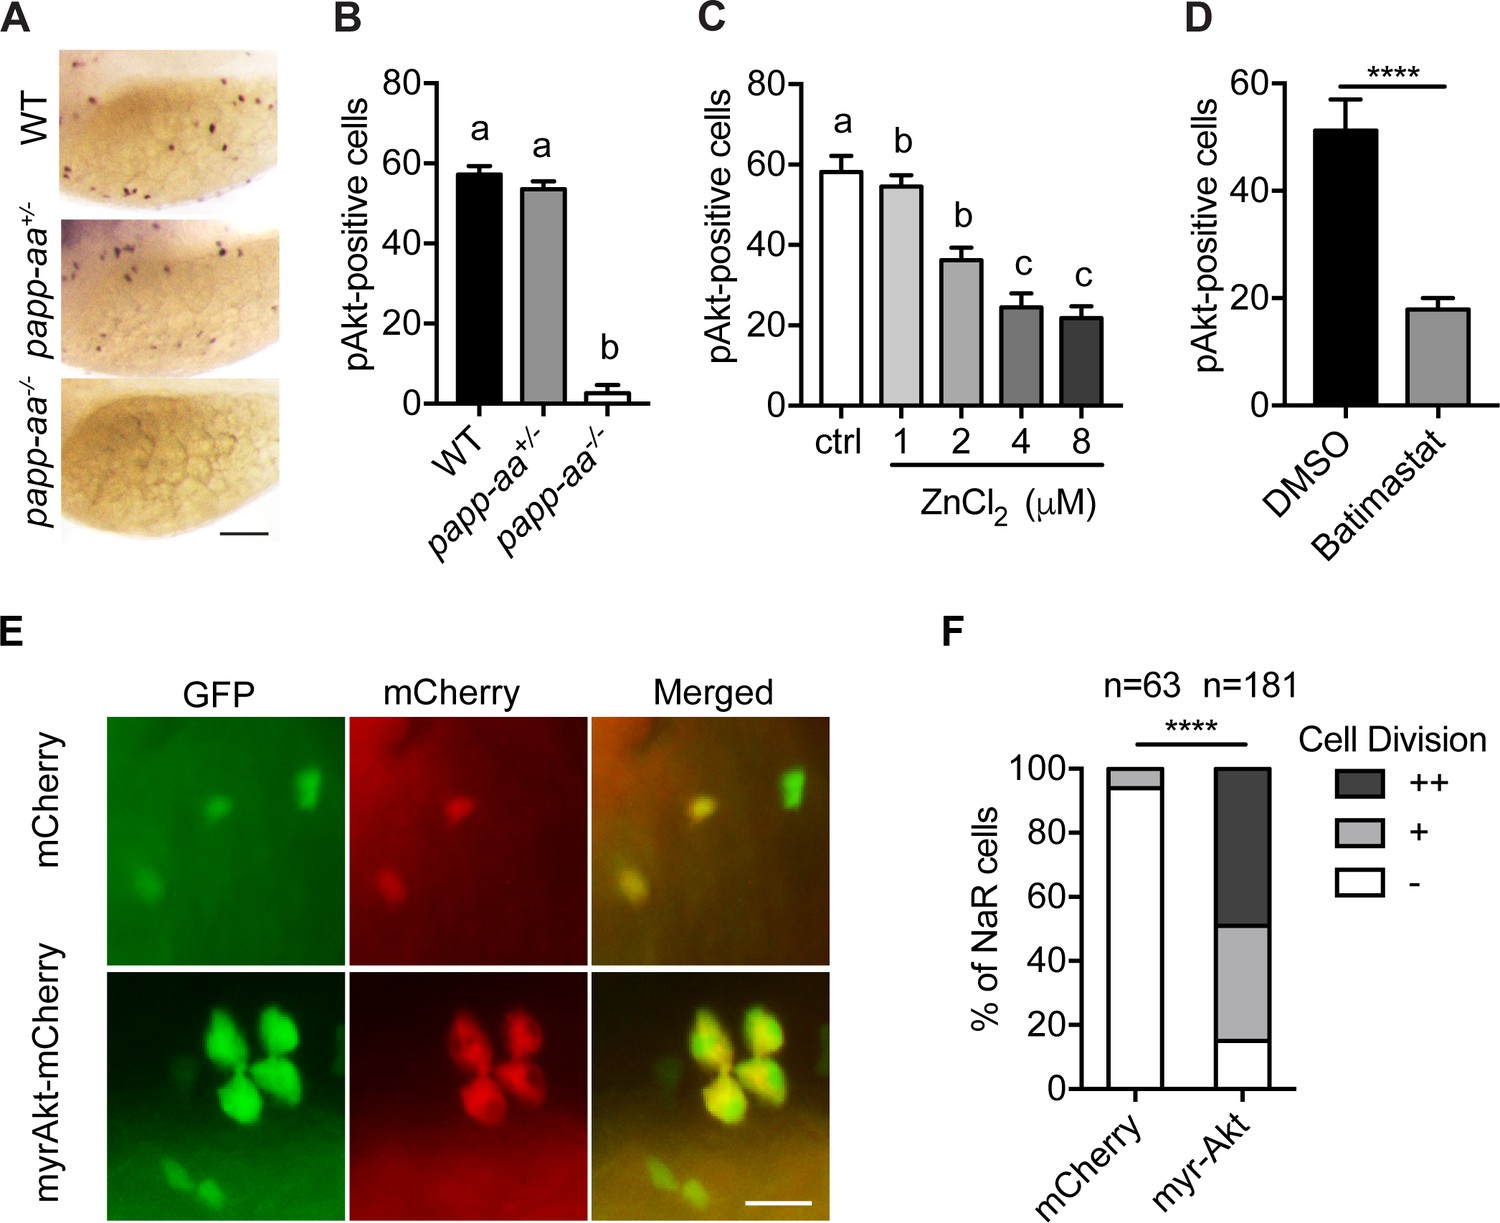
Papp-aa acts by regulating IGF-Akt-Tor signaling in NaR cells.
(A–B) Zebrafish embryos of the indicated genotypes were transferred to the low [Ca2+] medium at three dpf. One day later, they were fixed and stained for phospho-Akt. Representative images are shown in (A) and quantitative results in (B). Scale bar = 0.1 mm. n = 25 ~ 58 fish/group. (C–D) Tg(igfbp5a:GFP) fish were transferred to the low [Ca2+] medium 0–8 µM ZnCl2 (C) or 200 µM batimastat (D) at three dpf. After one day treatment, they were analyzed by immunostaining for phospho-Akt. n = 18 ~ 24 fish/group. ****, p<0.0001, unpaired two-tailed t test. (E and F) Progeny of papp-aa+/-;Tg(igfbp5a:GFP) intercrosses were injected with BAC(igfbp5a:mCherry) or BAC(igfbp5a:myr-Akt-mCherry). They were raised and subjected to the low [Ca2+] stress test described in Figure 2A. NaR cells expressing mCherry or myr-Akt were scored as described in Figure 3. Representative images are shown in (E) and quantified data in (F). ++, two cell division, +, one cell division, -, no division during the experiment. Scale bar = 20 µm. ****, p<0.0001 by Chi-square test. Total number of cells is shown above the bar.
-
Figure 5—source data 1
Excel spreadsheet containing quantitative data for Figure 5.
- https://cdn.elifesciences.org/articles/52322/elife-52322-fig5-data1-v4.xlsx
Figure 5—figure supplement 1
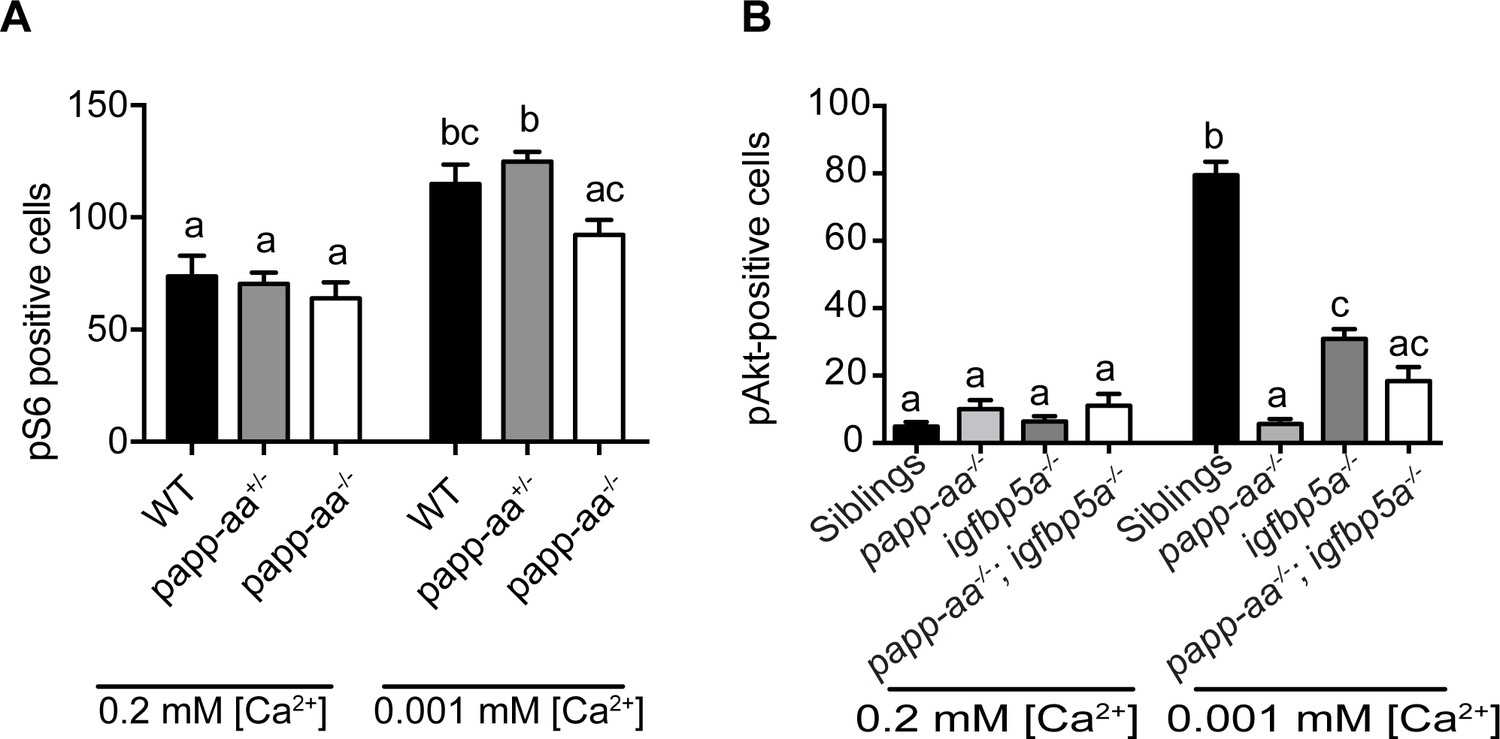
Papp-aa acts via Igfbp5a and IGF signaling in NaR cells.
(A) Loss of Papp-aa abolishes Ca2+ deficiency-induced Tor activity. Zebrafish of the indicated genotypes were transferred to normal or low [Ca2+] medium at three dpf. One day later, they were fixed and stained for phospho-S6. The number of phospho-pS6 positive cells were quantified. n = 19 ~ 37 fish/group. (B) Progenies resulted from papp-aa+/-; igfbp5a+/- and papp-aa+/-; igfbp5a-/- intercrosses were raised in E3 embryo medium to three dpf and transferred to the normal [Ca2+] (0.2 mM) or low [Ca2+] (0.001 mM) embryo medium. After 24 hpf, fish were fixed and stained for phospho-Akt. Each fish was genotyped individually afterward. n = 6 ~ 50 fish/group.
-
Figure 5—figure supplement 1—source data 1
Excel spreadsheet containing quantitative data for Figure 5—figure supplement 1.
- https://cdn.elifesciences.org/articles/52322/elife-52322-fig5-figsupp1-data1-v4.xlsx
Figure 6 with 2 supplements
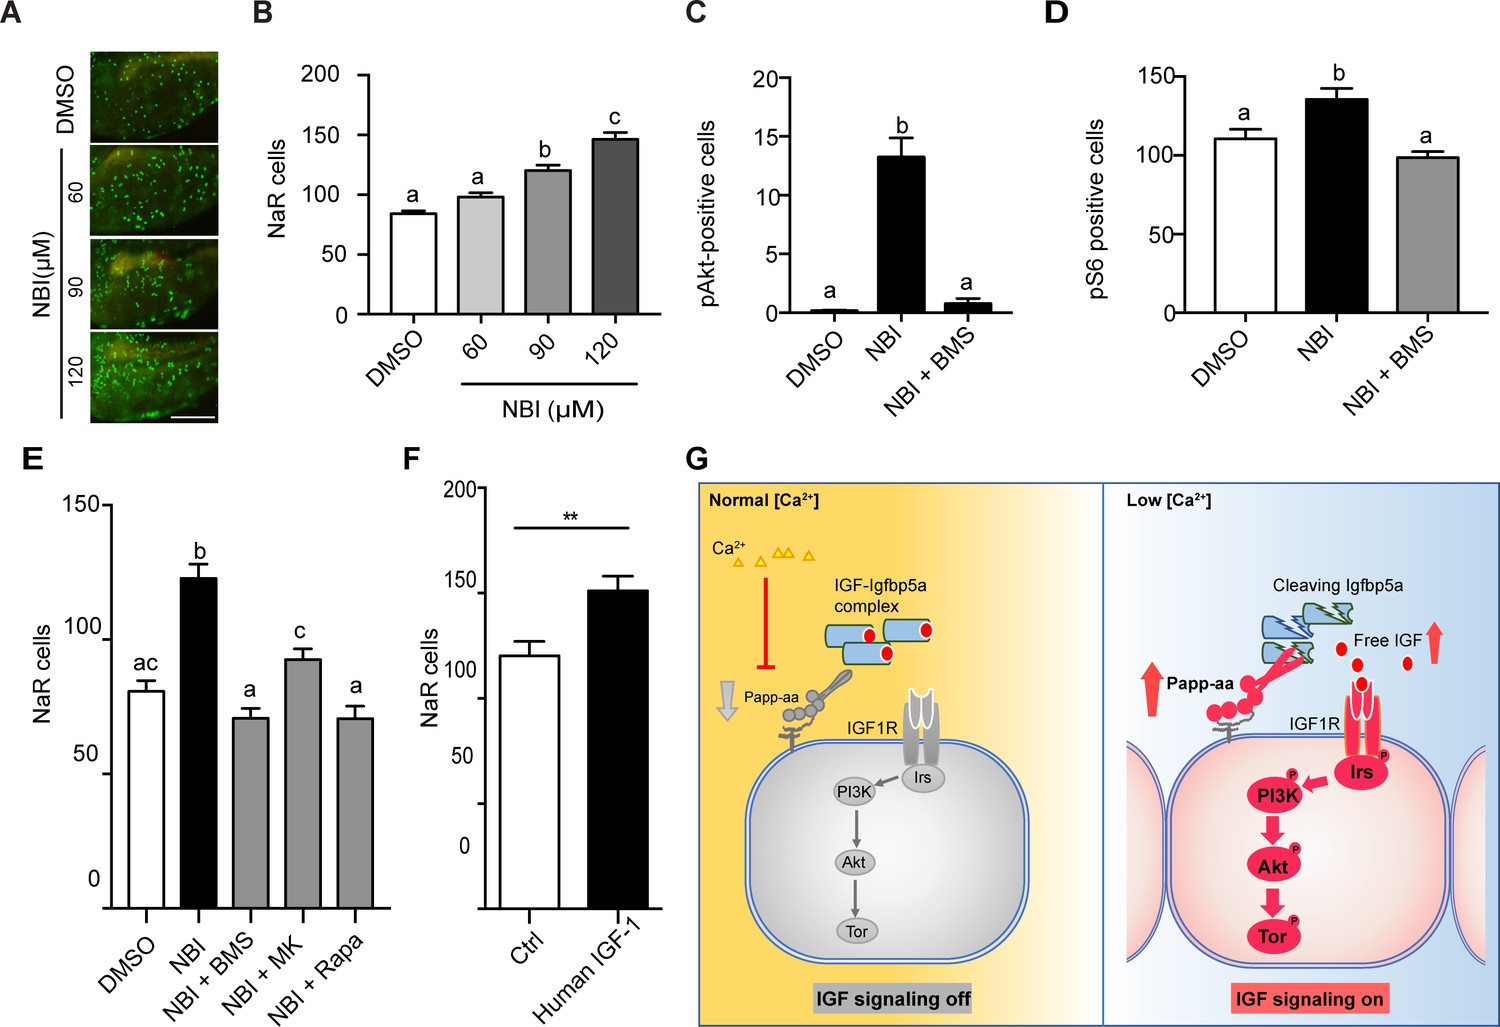
Disruption the IGF/Igfbp complex activates IGF-Akt-Tor signaling and promotes NaR cell reactivation.
(A–B) Tg(igfbp5a:GFP) fish were transferred to normal [Ca2+] medium containing the indicated doses of NBI-31772 at three dpf. Two days later, NaR cells were quantified. Representative images are shown in (A) and quantified data in (B). Scale bar = 0.2 mm. n = 25 ~ 27 fish/group. (C) Wild-type fish were treated with 90 µM NBI-31772 with or without 0.3 µM BMS-754807 from 3 to 4 dpf. The number of cells positive for phosphorylated Akt staining were quantified and shown. n = 19 ~ 23 fish/group. (D) Larvae treated as described in (C) were stained for phosph-S6 and quantified. n = 14 ~ 15 fish/group. (E) Tg(igfbp5a:GFP) fish were treated with NBI-31772 (90 µM) together with BMS-754807 (0.3 µM), MK2206 (8 µM), or Rapamycin (5 µM) from 3 to 5 dpf. NaR cell number was quantified and shown. n = 10 ~ 24 fish/group. (F) Tg(igfbp5a:GFP) fish were treated with human IGF1 (150 ng/ml) in E3 embryo medium from 3 to 5 dpf. NaR cells were quantified and shown. n = 35 ~ 36 fish/group. **p<0.01, unpaired t-test. (G) Proposed model of Papp-aa function as a [Ca2+]-regulated molecular switch of IGF signaling in epithelial cells. Left panel: under normal [Ca2+] conditions, Papp-aa proteolysis activity is suppressed. Igfbp5a is intact and it inhibits IGF signaling by binding to IGFs and prevents their binding to the IGF1 receptor. The IGF- PI3 kinase-Akt-Tor signaling is inhibited in NaR cells. Right panel: under low [Ca2+] conditions, Papp-aa activity is increased. This increases Igfbp5a proteolytic cleavage and releases IGFs from the Igfbp5a/IGF complex. Bioavailable IGFs binds to IGF1 receptor and activates PI3 kinase-Akt-Tor signaling in NaR cells and promotes their reactivation and proliferate.
-
Figure 6—source data 1
Excel spreadsheet containing quantitative data for Figure 6.
- https://cdn.elifesciences.org/articles/52322/elife-52322-fig6-data1-v4.xlsx
Figure 6—figure supplement 1
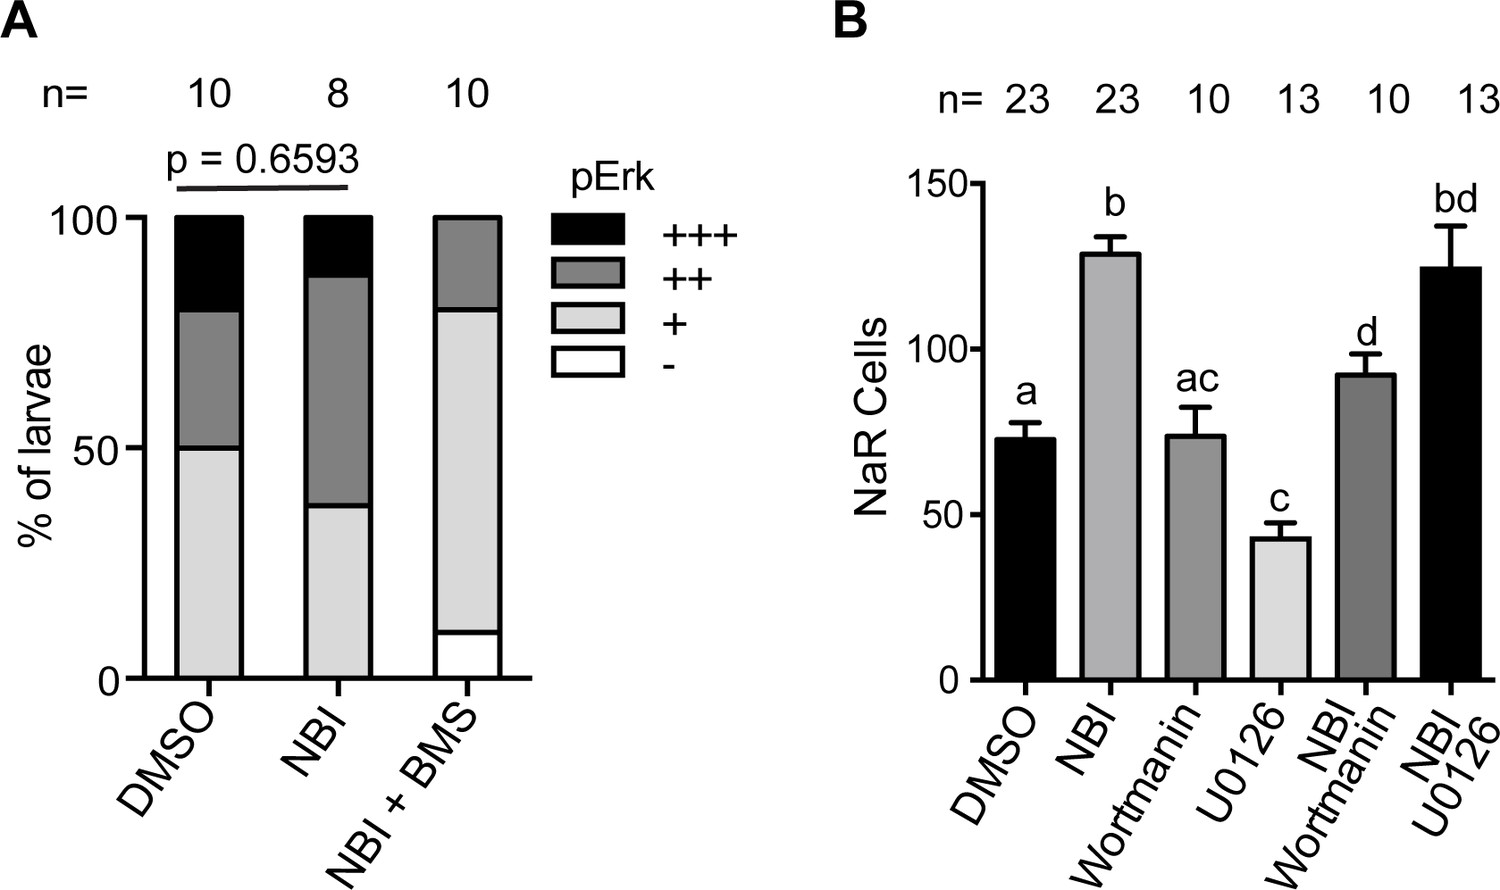
Disruption the IGF/Igfbp complex has no effect on pErk activity and Mek/Erk signaling is not critical.
(A). Wild-type embryos were transferred to normal [Ca2+] medium containing 90 µM NBI-31772 with or without 0.3 µM BMS-754807. The fish were sampled at four dpf and subjected to immunostaining using a phosphorylated Erk antibody. The number of phospho-Erk-positive cells were scored following a published scoring system (Dai et al., 2014). Data shown are mean ± SEM, p values analyzed by Chi-square test for trend are shown. Total number of larvae is shown above the bar. (B) Tg(igfbp5a:GFP) larvae were treated with DMSO, NBI-31772 (NBI, 90 µM), Wortmannin (Wort, 0.06 µM), U0126 (2 µM), NBI-31772 (90 µM) plus Wortmannin (0.06 µM), or NBI-31772 (90 µM) plus U0126 (2 µM) from 3 to 5 dpf. NaR cell number was quantified and shown. n = 10 ~ 23 fish/group.
-
Figure 6—figure supplement 1—source data 1
Excel spreadsheet containing quantitative data for Figure 6—figure supplement 1.
- https://cdn.elifesciences.org/articles/52322/elife-52322-fig6-figsupp1-data1-v4.xlsx
Figure 6—figure supplement 2

Treatment with fish IGF1 increases NaR cell reactivation and proliferation.
Tg(igfbp5a:GFP) fish were treated with salmon IGF1 (150 ng/ml) in E3 embryo medium from 3 to 5 dpf. NaR cells were quantified and shown. n = 17 ~ 24 fish/group. **p<0.01, unpaired t-test.
-
Figure 6—figure supplement 2—source data 1
Excel spreadsheet containing quantitative data for Figure 6—figure supplement 2.
- https://cdn.elifesciences.org/articles/52322/elife-52322-fig6-figsupp2-data1-v4.xlsx
Additional files
-
Supplementary file 1
PCR primers used in this study.
- https://cdn.elifesciences.org/articles/52322/elife-52322-supp1-v4.xlsx
-
Transparent reporting form
- https://cdn.elifesciences.org/articles/52322/elife-52322-transrepform-v4.docx
Download links
A two-part list of links to download the article, or parts of the article, in various formats.
Downloads (link to download the article as PDF)
Open citations (links to open the citations from this article in various online reference manager services)
Cite this article (links to download the citations from this article in formats compatible with various reference manager tools)
The metalloproteinase Papp-aa controls epithelial cell quiescence-proliferation transition
eLife 9:e52322.
https://doi.org/10.7554/eLife.52322


