Broadly neutralizing human antibodies against dengue virus identified by single B cell transcriptomics
- Chan Zuckerberg Biohub, United States
- Stanford University, United States
- Integral Molecular, Inc, United States
- Stanford University School of Medicine, United States
- Fundación Valle del Lili, Colombia
- Fred Hutchinson Cancer Research Center, United States
Figures
Figure 1 with 1 supplement
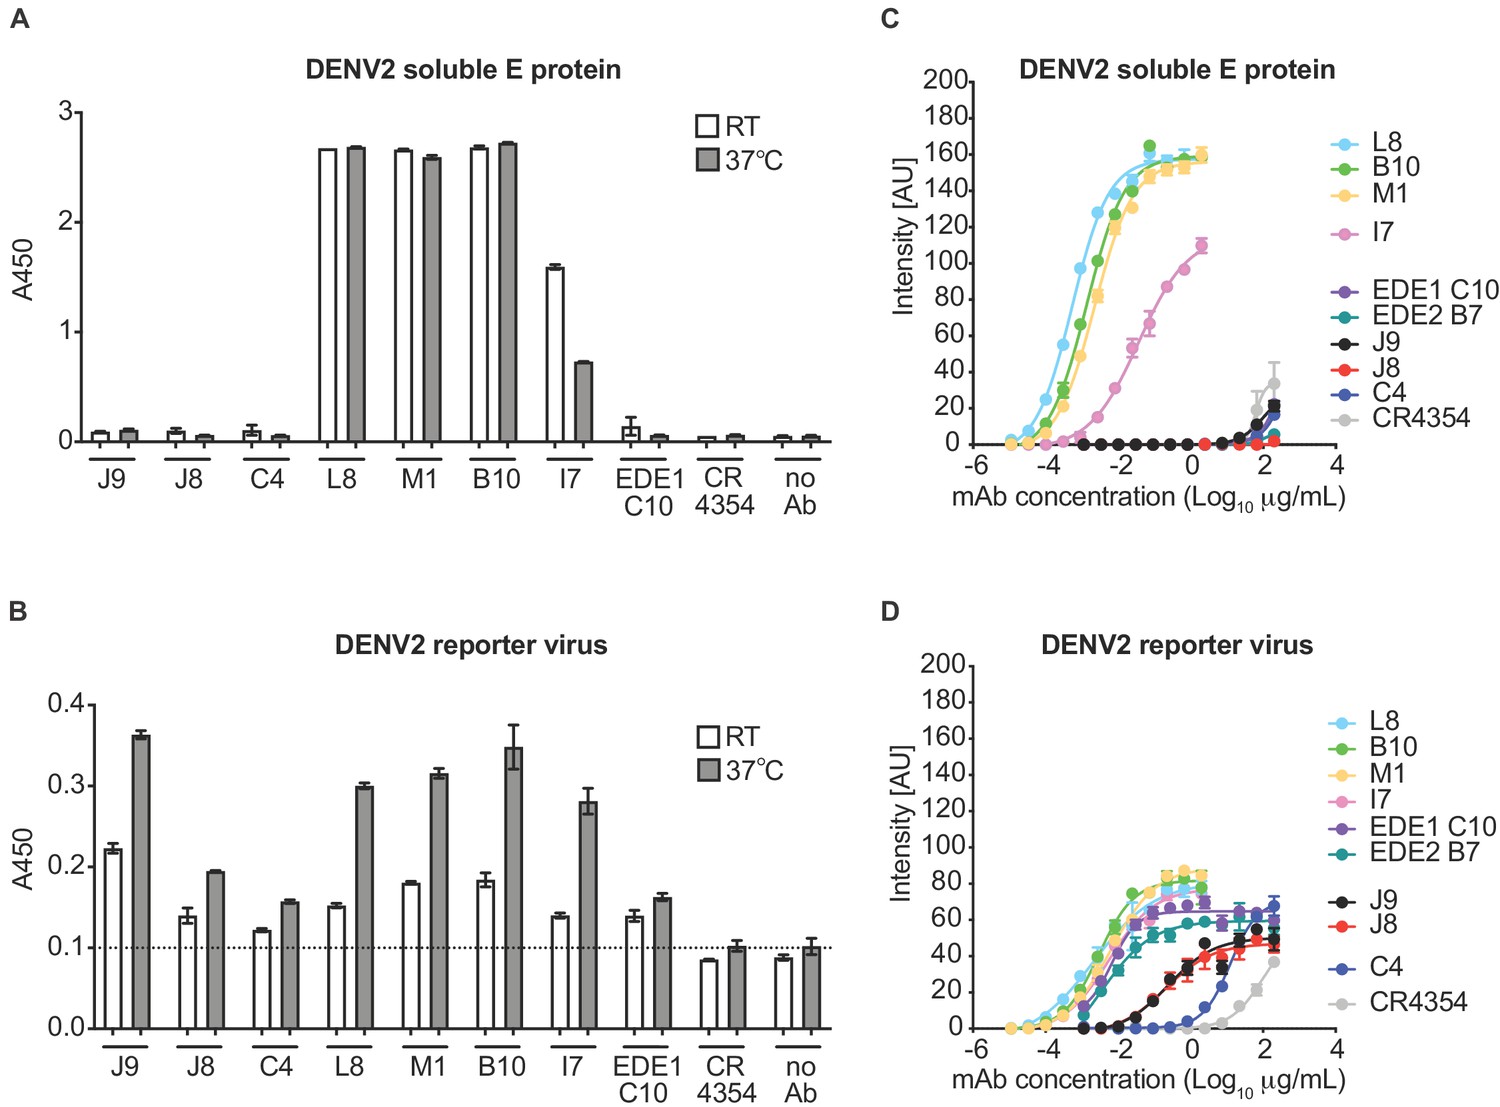
Binding profile of antibodies.
A single dilution of the antibodies indicated on the x-axis was tested for binding to DENV2 (A) soluble E protein and (B) reporter virus particles at room temperature (RT) and 37°C by ELISA. The y-axis shows absorbance values at 450 nm (A450). Error bars indicate the range of values obtained in duplicate wells. Data are representative of 3 independent experiments. The dotted horizontal line in (B) indicates the average A450 values obtained for negative control WNV-specific antibody CR4354 at 37°C. Representative dose-response binding curves of the indicated antibodies to DENV2 (C) soluble E protein and (D) reporter virus at room temperature. The y-axis shows binding signal intensity in arbitrary units (AU). Data points and error bars indicate the mean signal intensity and standard deviation (SD) of triplicate spots within one well of the microarray, respectively. Binding curves are representative of two independent experiments.
Figure 1—figure supplement 1
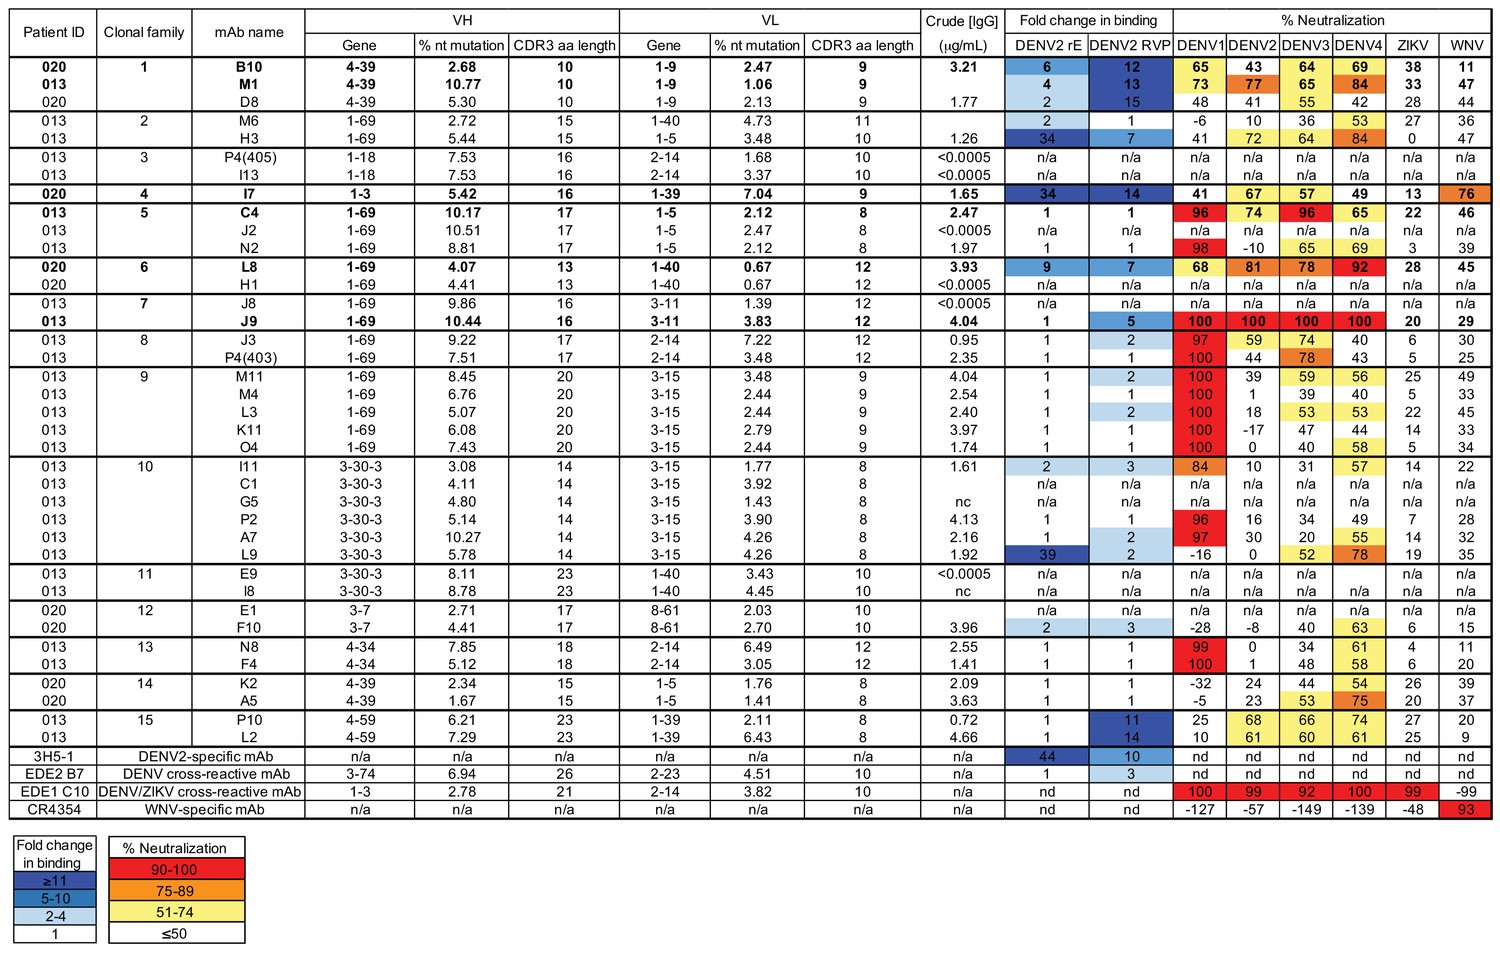
Characteristics of plasmablast-derived antibodies from DENV-infected patients.
Monoclonal antibody (mAb) sequences were identified from single plasmablasts of DENV-infected patient 013 and patient 020, as previously described (Zanini et al., 2018). The patient from which corresponding mAb sequences were identified is listed in the first column, followed by mAb clonal family ID, mAb name, and gene usage, % nucleotide (nt) somatic hypermutation, and CDR3 amino acid (aa) length for the variable heavy (VH) and light (VL) chain genes. VH and VL sequences were cloned into IgG1 expression vectors and transfected into mammalian cells. Neat crude IgG1-containing culture supernatant was tested for binding to recombinant DENV2 recombinant soluble E protein (rE) and DENV2 reporter virus particles (RVP) by ELISA, and for neutralizing activity against the indicated related flavivirus RVPs. Antibodies 3H5-1 (2 µg/mL), EDE2 B7(2 µg/mL) and EDE1 C10 (10 µg/mL), and CR4354 (2 µg/mL) were used as controls. Antibody binding activity is expressed as fold-change in absorbance values over negative control wells containing media only. The heatmap (light to dark blue) indicates strength of binding, as defined in the key below the table. A value of 1 indicates no increase in binding relative to negative control wells. Percent neutralization was calculated using the formula: (% infection in the absence of IgG1 - % infection in the presence of IgG1) / (% infection in the absence of IgG1) x 100. The heatmap (yellow to red) indicates the range of neutralization potencies as indicated in the key below the table. Results are representative of 2 independent experiments. Under the crude IgG column, a value of <0.0005 indicates undetectable levels of IgG1 in crude culture supernatant. Antibodies selected for further characterization are shown in bold. ‘n/a,’ not applicable; ‘nc,’ not successfully cloned; ‘nd,’ not determined.
Figure 2 with 4 supplements
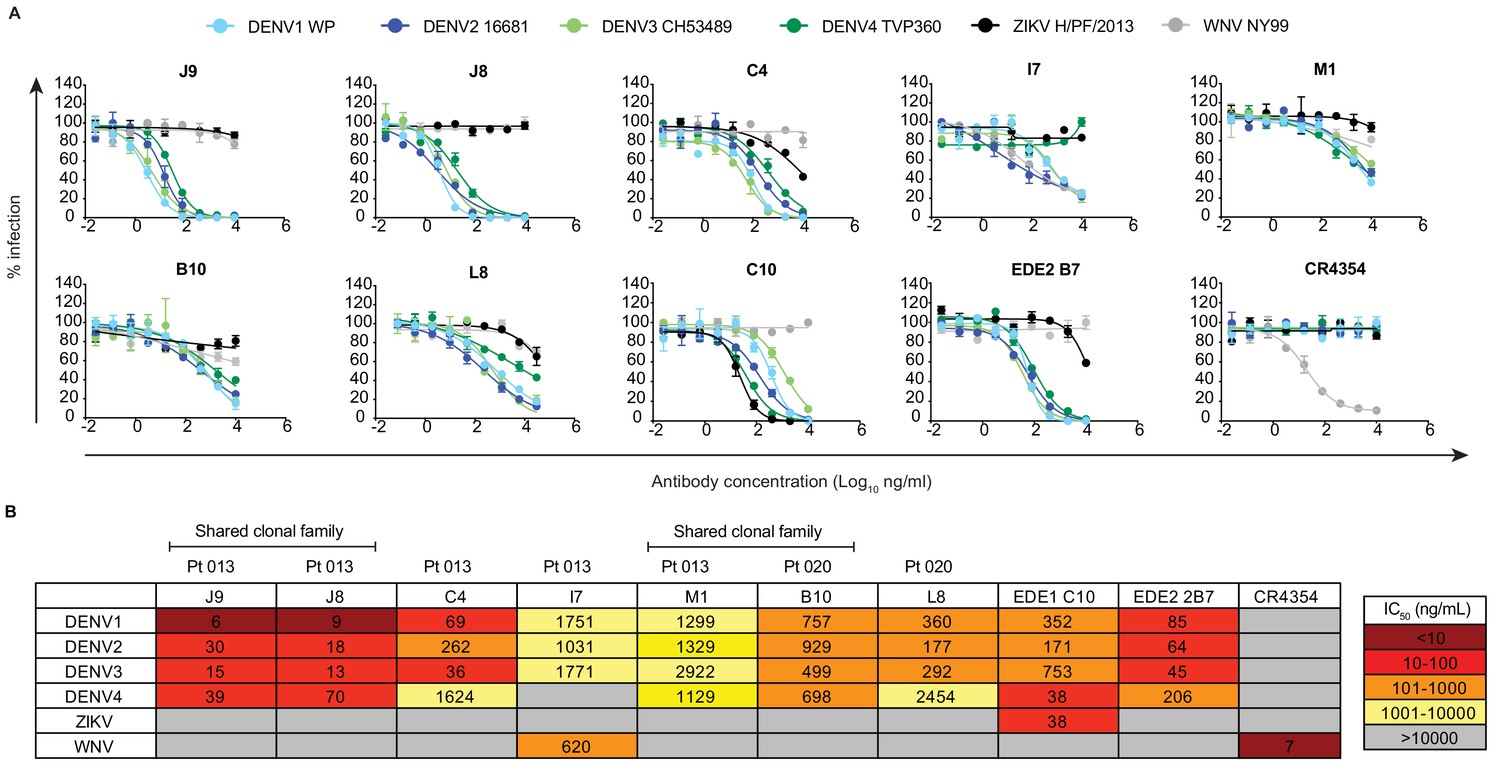
Neutralization profile of antibodies.
(A) Representative antibody dose-response neutralization curves against DENV1-4, ZIKV, and WNV reporter viruses. Infectivity levels were normalized to those observed in the absence of antibody. Data points and error bars indicate the mean and range of duplicate wells, respectively. Results are representative of at least three independent experiments. (B) Antibody concentrations resulting in 50% inhibition of infectivity (IC50) from dose-response neutralization experiments described in (A). Values represent the mean of at least three independent experiments, each performed in duplicate and summarized in Figure 2—source data 1. The heatmap indicates neutralization potency, as defined in the key. Gray boxes indicate that 50% neutralization was not achieved at the highest antibody concentration tested (10 μg/ml). The patient (Pt) from which antibodies were isolated are indicated above each antibody name. Antibodies from shared clonal families are indicated above patient ID.
-
Figure 2—source data 1
Antibody IC50 values against a panel of reporter flaviviruses from replicate experiments.
- https://cdn.elifesciences.org/articles/52384/elife-52384-fig2-data1-v2.xlsx
Figure 2—figure supplement 1
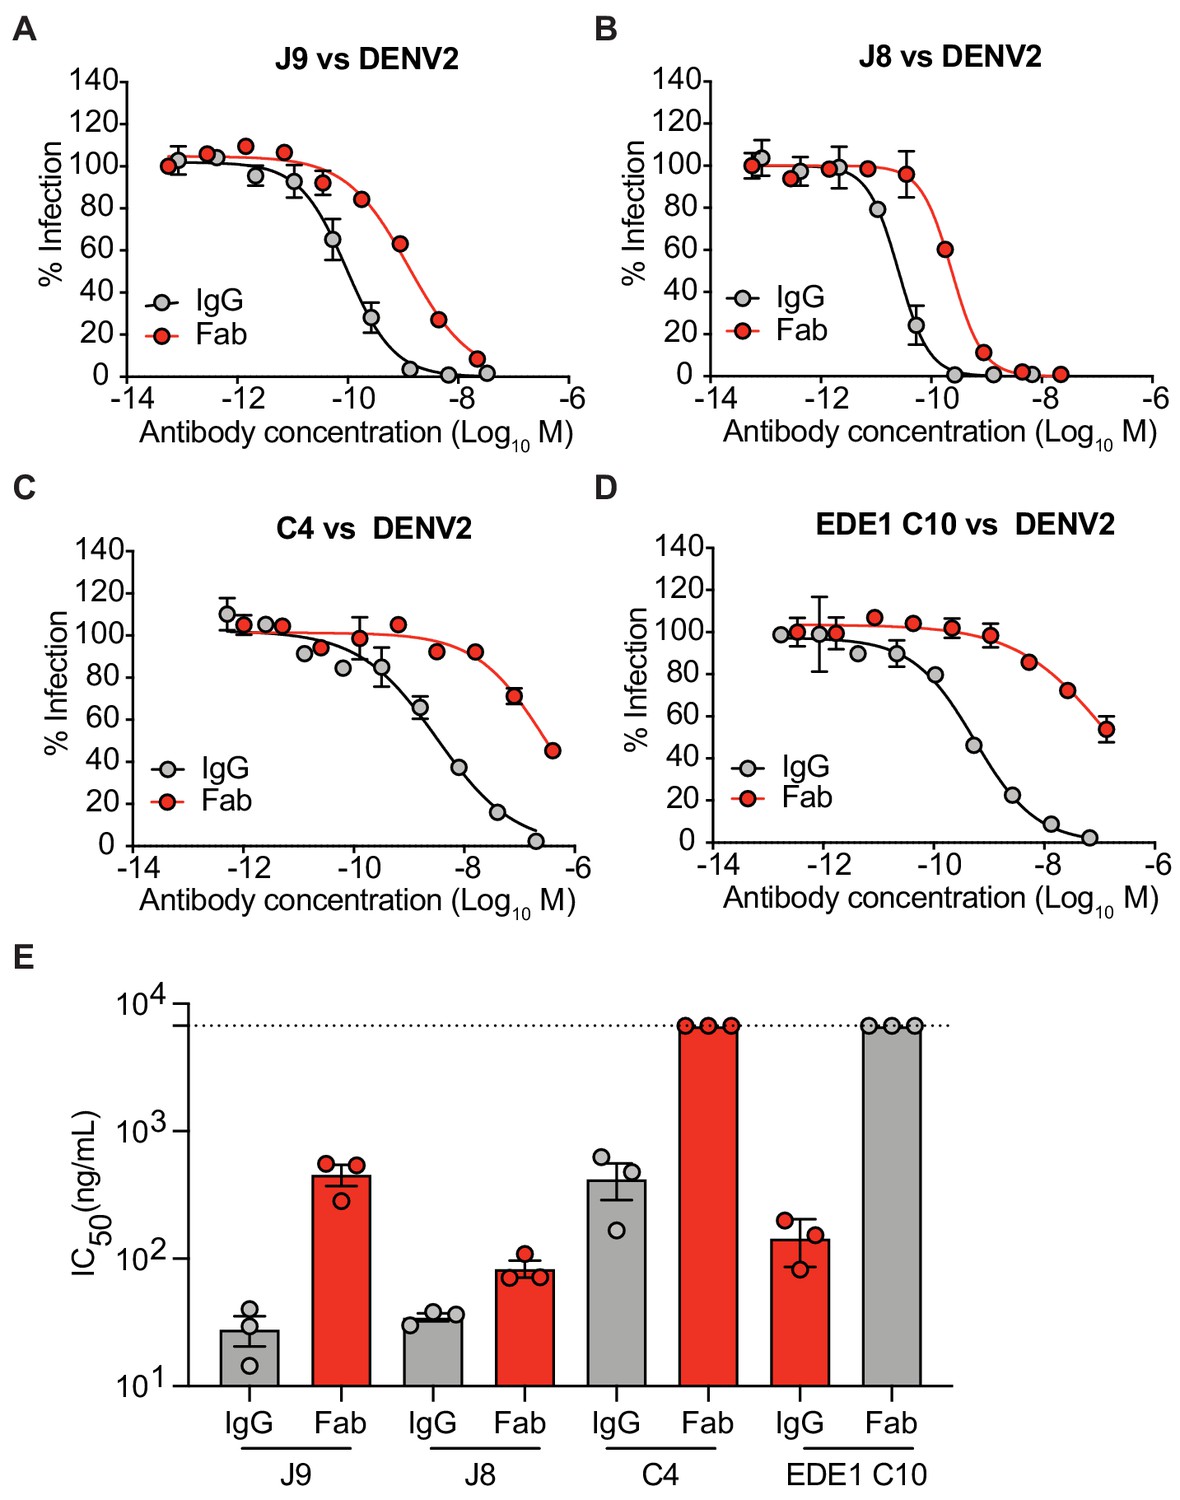
Neutralization potency of IgG and Fab fragments.
(A) J9, (B) J8, (C) C4, and (D) EDE1 C10 were tested as Fab fragments or full-length IgG for neutralization of DENV2 reporter virus. Dose-response neutralization curves represent three independent experiments, each performed in duplicate. Data points and error bars indicate the mean and range of duplicate wells, respectively. (E) Mean IC50 values of the indicated IgG or Fab fragment from three independent experiments represented by data points. Error bars represent the SD. Values at the dotted horizontal line indicates that 50% neutralization was not achieved at the highest concentration of Fab tested. Fabs were tested at 2x excess molar concentration relative to IgG.
Figure 2—figure supplement 2

Neutralization potency of antibodies against fully infectious DENV1-4 strains.
Neutralization of fully infectious DENV1-4 strains by (A) J9, C4, EDE1 C10, EDE2 B7, and (B) J8 was determined by intracellular staining with AF488-conjugated anti-E protein 4G2 antibody at 48 hr post-infection. Error bars indicate the range of duplicate infections. Infectivity levels were normalized to those in the absence of antibody. Dose-response neutralization curves represent one experiment. (C) Comparison of fully infectious DENV strains used in (A) and (B) to DENV reporter viruses used in our study. For each virus, the year of isolation is listed, as well as the GenBank Accession number and PMID reference, if available. The nucleotide sequence of the structural genes (C, prM, E) used to make DENV4 TVP-360 (GenBank # KU513442.1) reporter virus is identical to that of DENV4 TVP-376 (GenBank # KC963424.1) with the exception of a silent mutation in the stem region of the E protein.
Figure 2—figure supplement 3
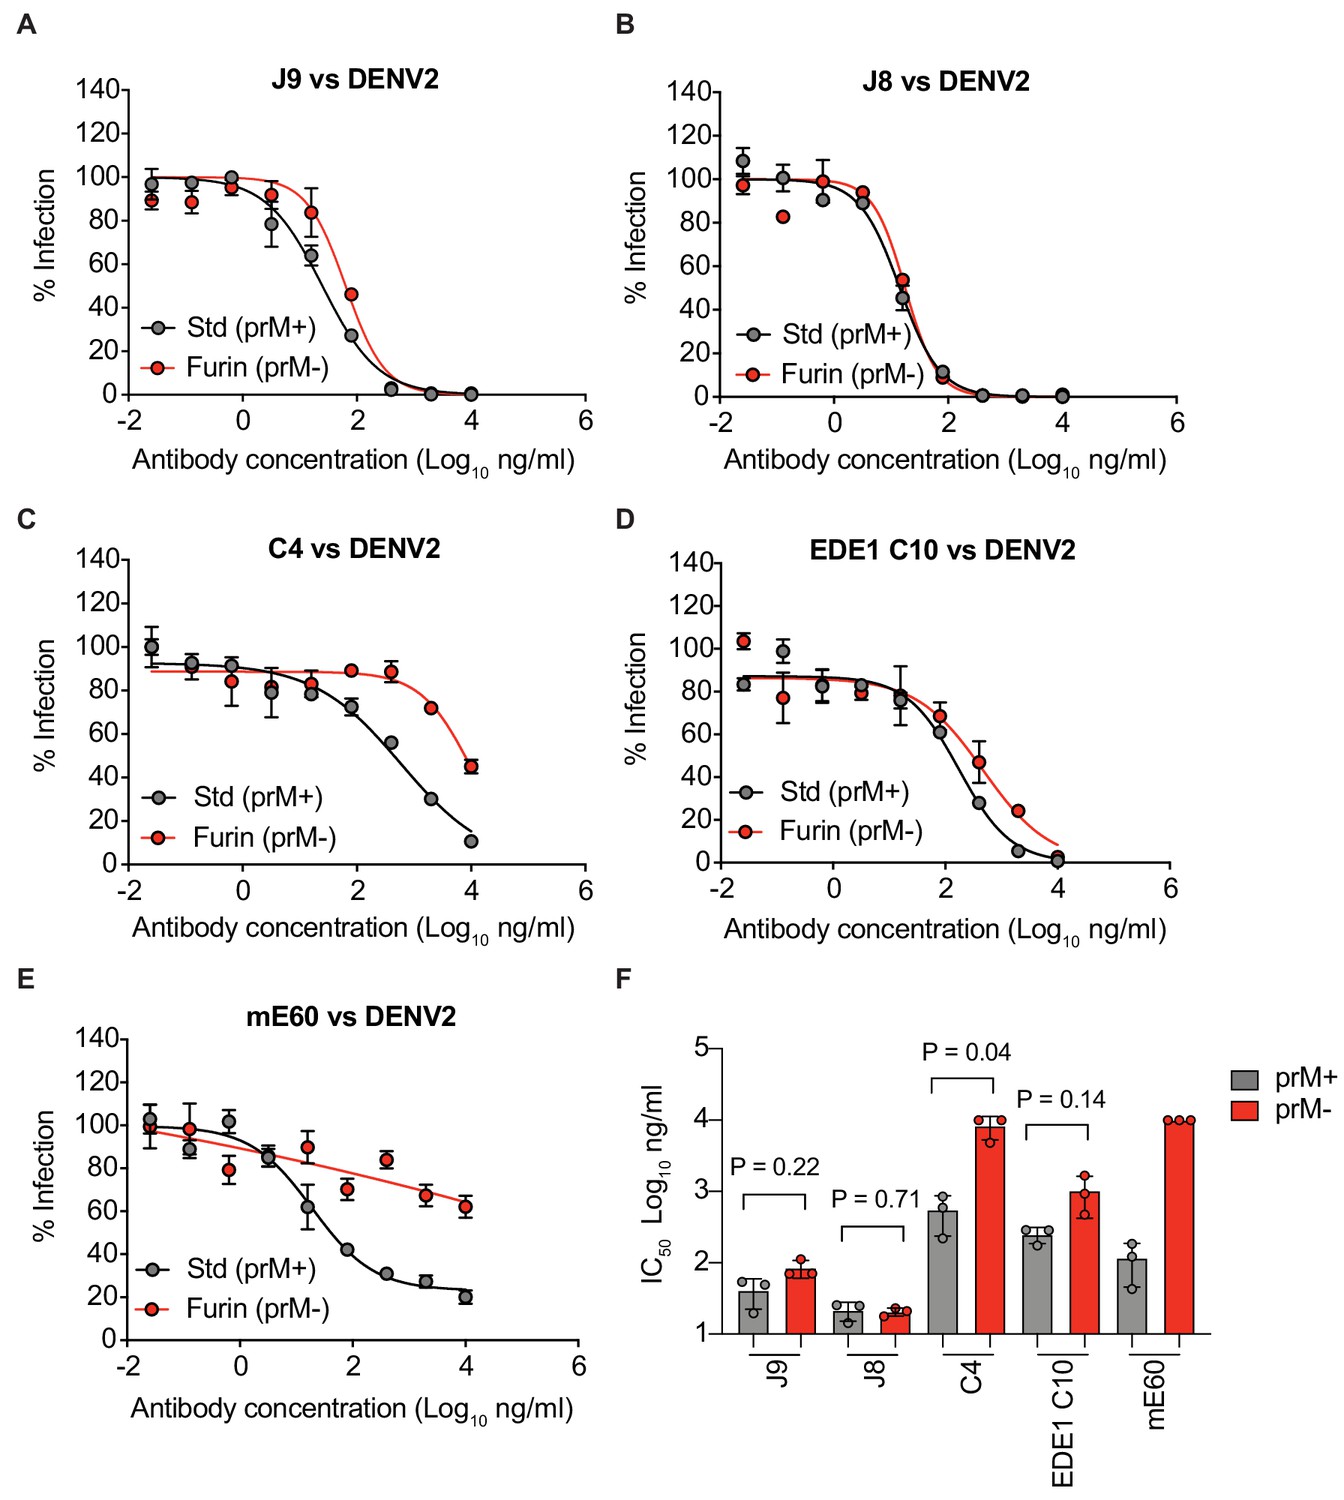
Antibody neutralization of standard and mature reporter virus preparations.
(A) Dose-response neutralization curves for the indicated antibodies against DENV2 reporter virus prepared under standard conditions (Std) or in the presence of overexpressed furin to generate mature (Furin) virus particles. Data points and error bars indicate the mean and range of infectivity in duplicate wells, respectively. (B) Mean IC50 values of antibodies against standard or mature reporter viruses from three independent experiments depicted by data points. Error bars indicate the SD. P-values were obtained from two-tailed paired t-tests.
Figure 2—figure supplement 4
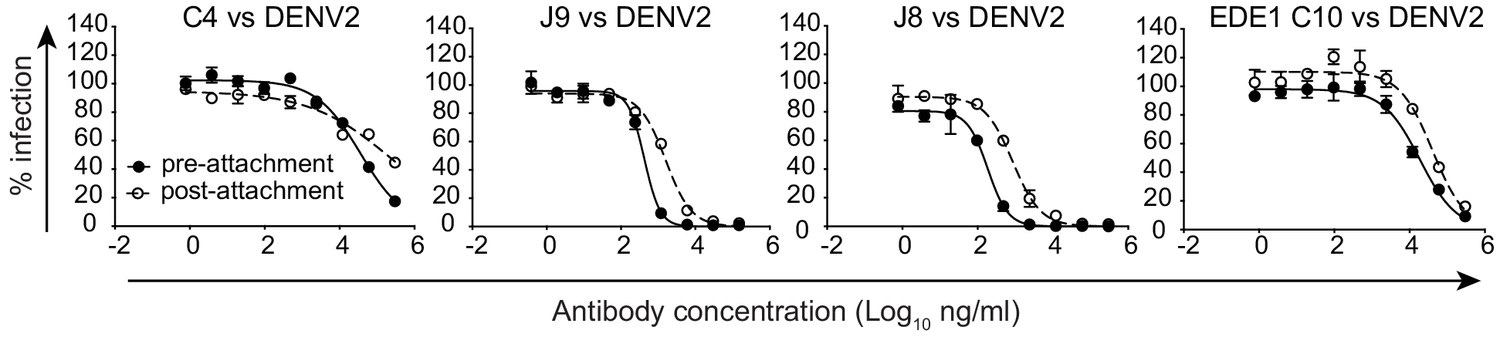
Mechanism of neutralization.
Representative dose-response curves for neutralization of DENV2 16681 reporter virus pre- (filled symbols, solid lines) or post-attachment (open symbols, dotted lines) to Raji-DCSIGNR cells by the antibodies indicated above each graph. Results are representative of at least two independent experiments each performed in duplicate. Data points and error bars indicate the mean and range of duplicate wells, respectively.
Figure 3 with 1 supplement
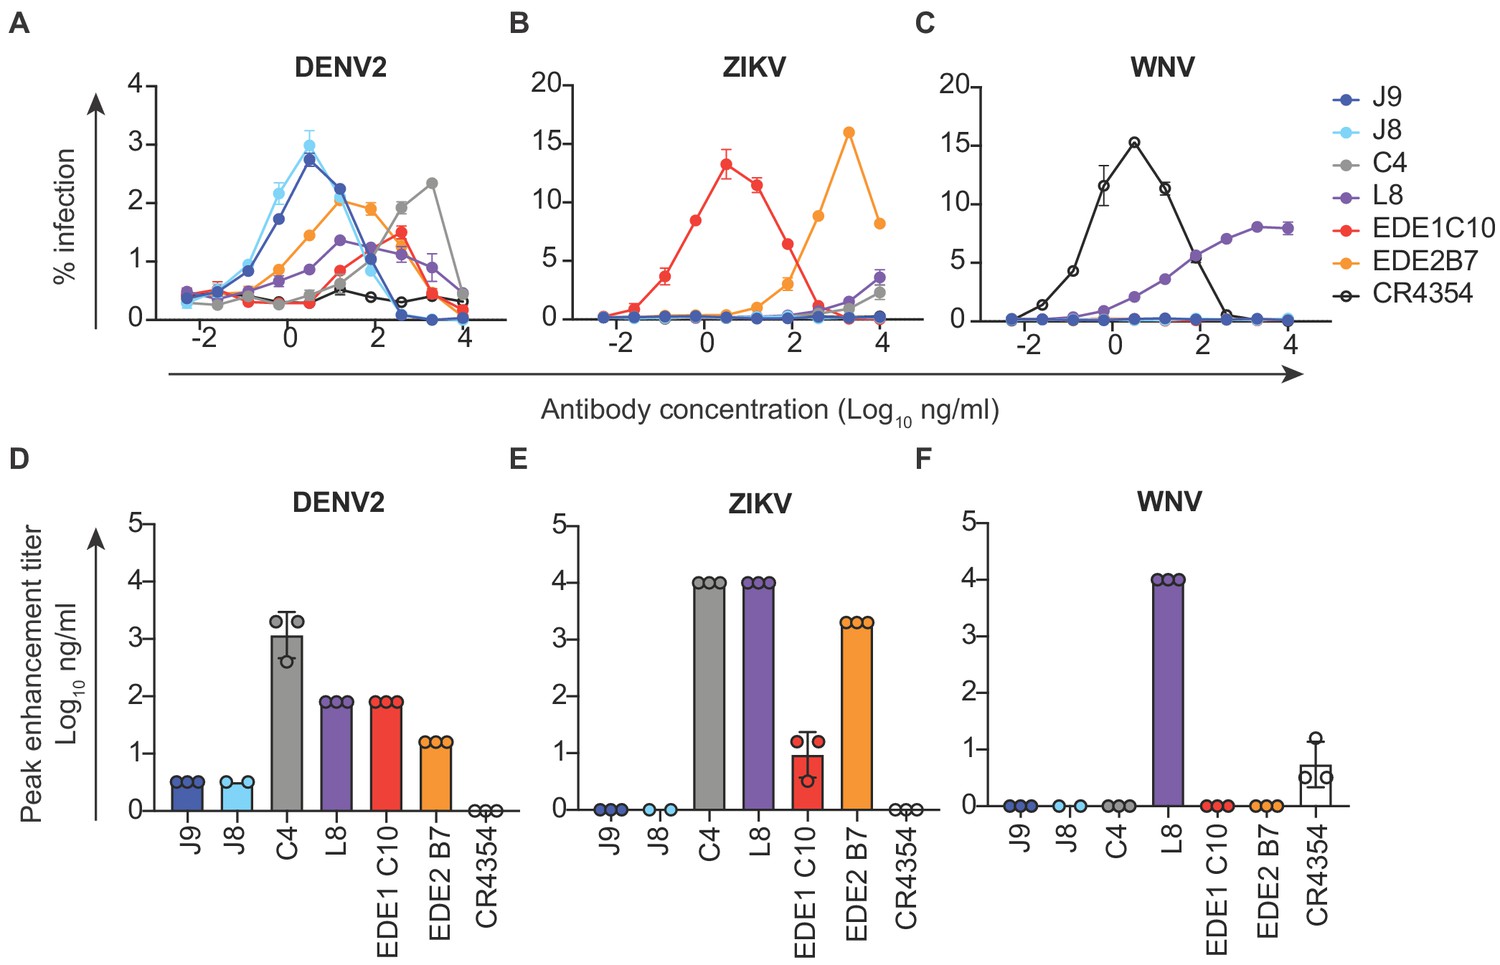
Antibody-dependent enhancement (ADE) of DENV2, ZIKV and WNV infection.
Serial dilutions of the antibodies indicated above each graph were pre-incubated with (A) DENV2, (B) ZIKV or (C) WNV reporter virus for 1 hr at room temperature prior to infection of K562 cells, which express FcγR and are poorly permissive for direct infection in the absence of antibodies. The y-axis shows the percentage of infected GFP-positive cells quantified by flow cytometry. Data points and error bars indicate the mean and range of infection in duplicate wells, respectively. Bar graphs represent average antibody concentrations at peak enhancement of (D) DENV2, (E) ZIKV or (F) WNV infection obtained from 2 to 3 independent experiments, each represented by a data point. Where indicated, error bars represent the SD in panels D-F.
Figure 3—figure supplement 1

ADE of DENV1, DENV3, and DENV4 infection.
Serial dilutions of the indicated antibodies were pre-incubated with (A) DENV1, (B) DENV3 or (C) DENV4 reporter virus prior to infection of K562 cells. Data points and error bars indicate the mean and range of infection in duplicate wells, respectively. Bar graphs represent average antibody concentrations at peak enhancement of (D) DENV1, (E) DENV3 or (F) DENV4 infection obtained from two independent experiments, each represented by a data point. Where indicated, error bars represent the range in panels D-F.
Figure 4
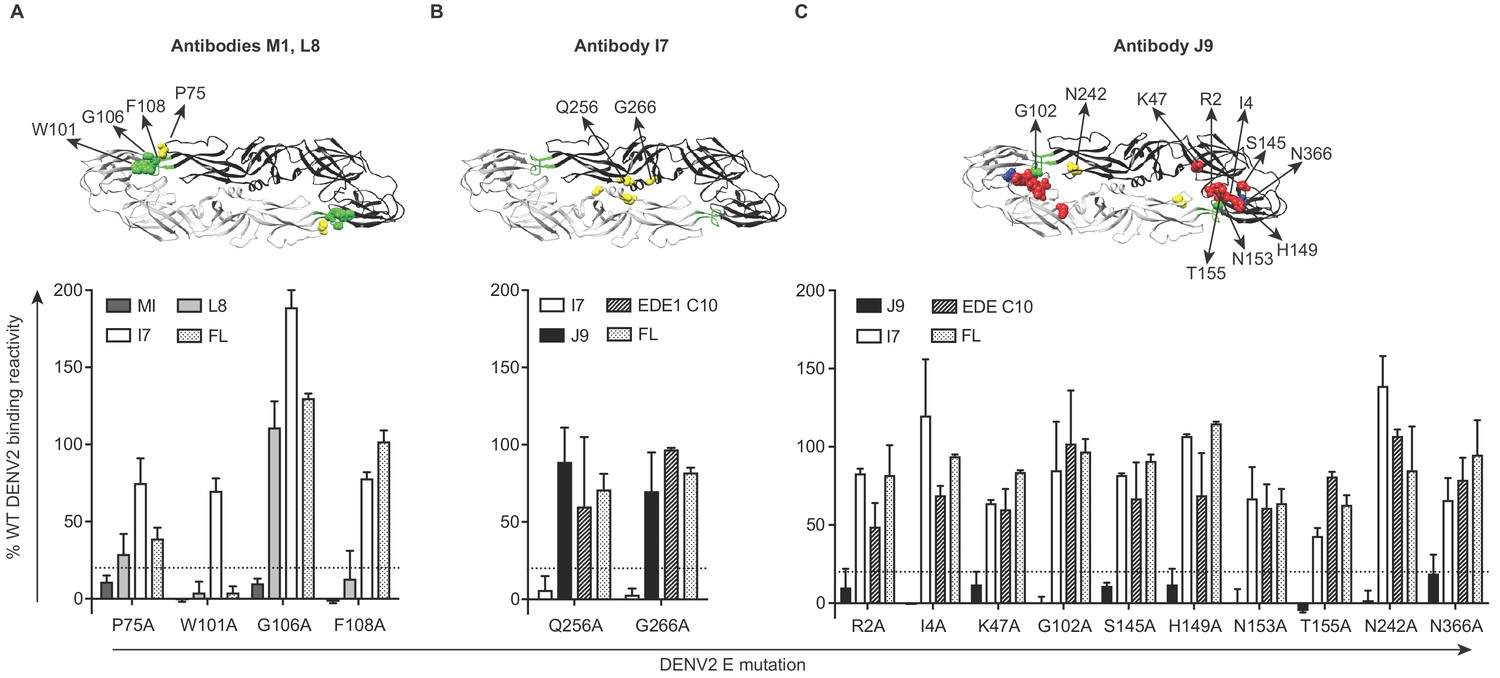
Critical E protein residues for antibody binding.
Individual alanine mutations of a subset of DENV2 E residues decreased binding by antibodies (A) M1 and L8, (B) I7 or (C) J9 as shown, but did not affect binding by other antibodies, including EDE1 C10 and a previously screened control antibody (FL) targeting the fusion loop (unpublished). Above each graph, residues involved in binding of the indicated antibodies are highlighted on the ribbon structure of one of the monomers (black) within the DENV2 E dimer (PDB: 1OAN). Residues in DI, DII, DIII, and DII fusion loop are indicated in red, yellow, blue, and green, respectively. For each graph, the x-axis indicates the DENV2 E protein mutation and the y-axis displays antibody binding reactivity to the mutant as a percentage of WT DENV2 reactivity. Binding reactivity to the complete mutagenesis library can be found in Figure 4—source data 1. Error bars represent the mean and range of at least two independent experiments. The dotted horizontal line indicates 80% reduction in antibody binding reactivity to mutant compared to WT DENV2.
-
Figure 4—source data 1
Mean antibody binding reactivity to DENV2 E protein alanine scanning mutagenesis library expressed as a percentage of binding reactivity to wildtype DENV2 from at least two independent experiments.
- https://cdn.elifesciences.org/articles/52384/elife-52384-fig4-data1-v2.xlsx
Figure 5 with 4 supplements

Critical E protein residues for antibody neutralization.
(A) Ribbon structure of the DENV2 E dimer (PDB: 1OAN) with one monomer in black and the other in gray. The conserved DII fusion loop is shown in green. Colored spheres indicate the location of individual mutations at residues that contribute to J9 recognition based on our screen in Figure 5—figure supplement 3 and summarized in (B). Bar graphs depict the mean fold change in IC50 values against DENV2 reporter virus encoding E protein mutations indicated on the x-axis relative to wildtype DENV2 for antibodies (B) J9, (C) J8, (D) C4, (E) EDE1 C10, and (F) EDE2 B7. For each antibody, wildtype ZIKV was included as a control. Mean values were obtained from 2 to 7 independent experiments represented by data points. Error bars indicate the standard deviation (n > 2 experiments) or range (n = 2 experiments). Bar colors correspond to those of spheres in (A) to indicate location of individual mutations within the E dimer. The locations of paired mutations are shown in Figure 5—figure supplement 1C. The dotted horizontal line indicates a 4-fold increase in IC50 value relative to wildtype DENV2.
Figure 5—figure supplement 1
DENV2 E protein mutagenesis.
(A) The E protein ectodomain residues of representative DENV1-4, ZIKV, and WNV, Japanese encephalitis virus (JEV), and Yellow Fever virus (YFV) strains were aligned using ClustalW2. Red, yellow, green, and blue bars above the alignment indicate residues within E protein DI, DII, DII fusion loop, and DIII, respectively. Squares above colored bars indicate residues selected for mutagenesis and generation of DENV2 reporter virus variants tested for sensitivity to J9 neutralization: gray squares = no effect on neutralization sensitivity; black squares = reduced sensitivity to J9 neutralization. Yellow squares indicate residues that are conserved across flaviviruses and are important for binding by antibody I7 in Figure 4B. The sequence used for ZIKV H/PF/2013 differs at two amino acids (residue 246 K > R and 345 M > I from GenBank accession number AHZ13508.1, as previously described; Dowd et al., 2016). (B) Ribbon structure of the DENV2 E dimer (PDB 1OAN) with 34 individually mutated residues shown as gray spheres. E protein domains are color-coded as in (A). (C) Ribbon structure of the DENV2 E dimer (PDB 1OAN) with one monomer shown in black, and the other in gray. Colored spheres indicate the locations of paired mutations: K47T+V151T (red); L56V+Q211E (orange); E85Q+Q86S (green); H149S+V151T (blue); Y178F+M287V (cyan); N194S+E195D (purple); Q316L+K394S (yellow). The effect of the indicated mutations in (B) and (C) on antibody neutralization potency is shown in Figure 5—figure supplement 3.
Figure 5—figure supplement 2
Effect of DENV2 E protein mutations on infectious titer.
Infectious titers of DENV2 reporter virus encoding (A) single or (B) double E protein mutations. For each graph, white bars show the infectious titer of WT DENV2, and red, yellow, and blue bars represent mutations in DI, DII, and DIII, respectively. In (B), the purple bar represents a paired mutation at one residue in DI (Y178F) and another in DIII (M297V). Titers are based on one or two independent virus preparations, as indicated by data points. Where indicated, error bars represent the range of infectivity from 2 to 3 independent virus preparations.
Figure 5—figure supplement 3
Effect of E protein mutations on antibody neutralization potency.
We screened a panel of DENV2 reporter virus variants encoding single (left) or double (right) E protein mutations for sensitivity to neutralization by (A) J9, (B) J8, (C) C4, (D) EDE1 C10, and (E) EDE2 B7. Bar graphs represent the average fold-change in IC50 relative to WT DENV2 obtained from at least two independent experiments, as indicated by data points. Error bars indicate the range (n = 2) or SD (n > 2). The dotted line represents a 4-fold increase in IC50 relative to DENV2 WT. On the left panel, red, yellow, and blue bars indicate mutations at residues in DI, DII, and DIII, respectively. For each antibody, neutralization of WT ZIKV reporter virus is included as a control. The location of single and paired mutations is shown in Figure 5—figure supplement 1B and 1C, respectively.
Figure 5—figure supplement 4

Effect of E protein mutations on patient 013 serum neutralization potency.
Neutralizing activity of antibody J9 and longitudinal serum samples from patient 013 collected 4, 8, and 22 days after fever onset were tested against DENV2 reporter virus variants encoding E protein mutations that reduced J9 neutralization potency. WT ZIKV reporter virus was included as a control. Error bars indicate the range of infectivity in duplicate wells normalized to infection levels in the absence of antibody. Dose-response neutralization curves are representative of 3 independent experiments, each performed in duplicate.
Figure 6 with 1 supplement
Lineage analysis of the J9/J8 clonal family.
(A) Maximum likelihood phylogeny of antibodies related to J9 and J8 found in the repertoire of patient 013 was created using the HLP19 model in IgPhyML. VH germline (IGHV1-69*05 + IGHD2-2 + IGHJ5) is shown at the top. Red, black, and blue letters indicate sequences found in unstimulated, stimulated, or both unstimulated and stimulated PBMCs, respectively. Triangles next to tips indicate IgA instead of IgG sequences. (B) Heavy chain CDR alignment of selected antibodies within the J9/J8 lineage found in the repertoire of patient 013. Letters and colors correspond to sequences shown in (A). The germline sequence is shown first, followed by a constructed sequence with five amino acid changes (5mut) highlighted in yellow. A portion FR H2 region is shown to highlight a glycine insertion in clones J9, E, F, and G in green. All other amino acid changes relative to germline are highlighted in gray. Complete VH nucleotide sequences are shown in Figure 6—source data 1. (C) Alignment of J8 and J9 light chain CDR to germline sequence (IGKV3-11 + IGKJ2). Amino acid changes relative to germline are highlighted in gray. In both (B) and (C), Kabat numbering is indicated above the alignment.
-
Figure 6—source data 1
Characteristics of variable heavy chain nucleotide sequences of selected antibodies in the J9/J8 clonal family.
- https://cdn.elifesciences.org/articles/52384/elife-52384-fig6-data1-v2.csv
Figure 6—figure supplement 1
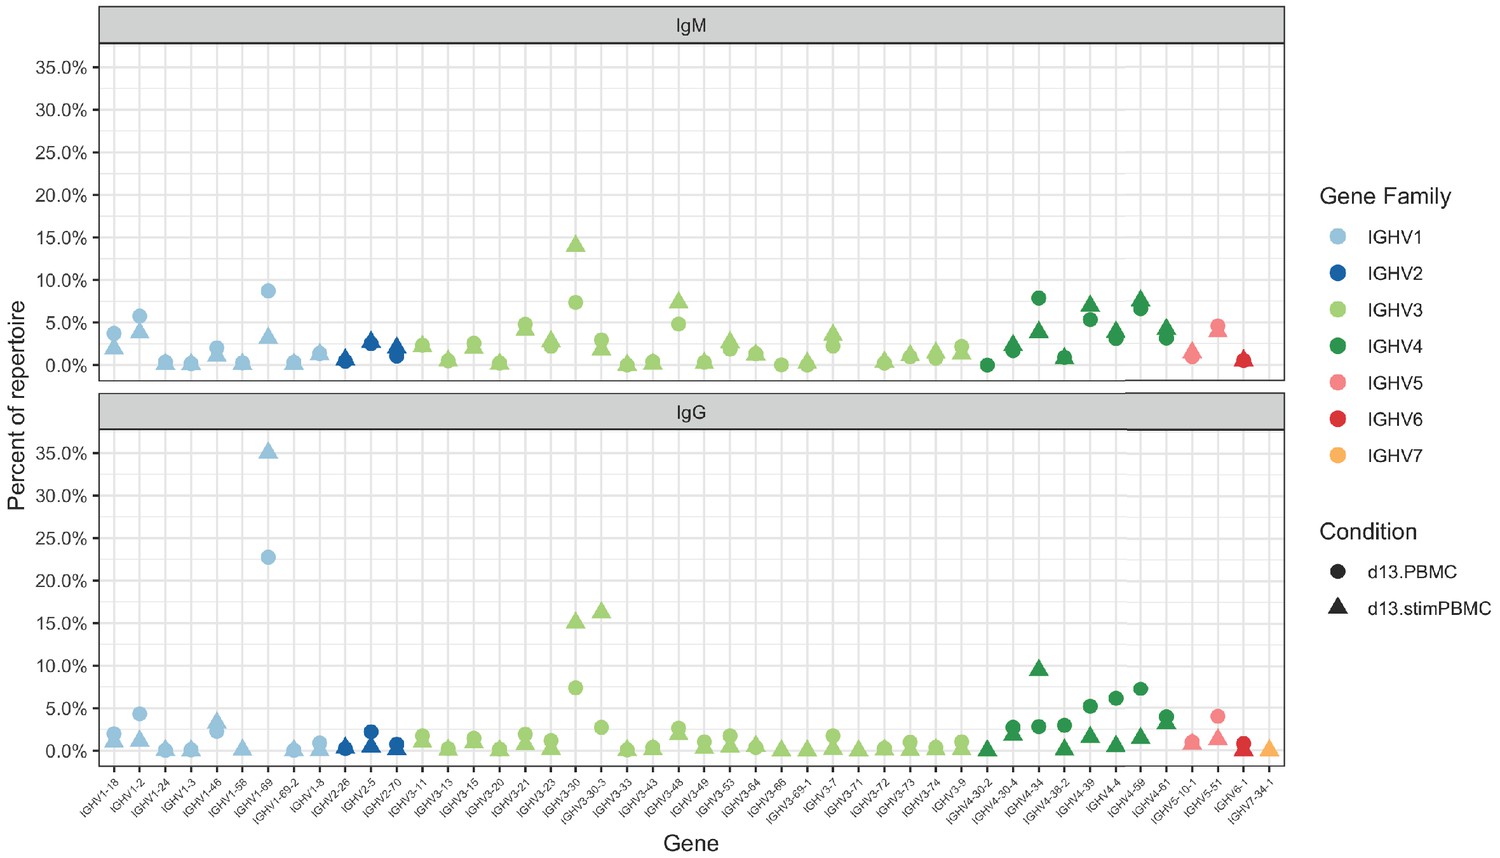
Germline VH gene usage among the unstimulated (circles) and stimulated (triangles) PBMC repertoires of patient 013, with IgM (top) and IgG (bottom) sequences shown.
Genes are grouped by color into gene families, as indicated in the key.
Figure 7 with 1 supplement
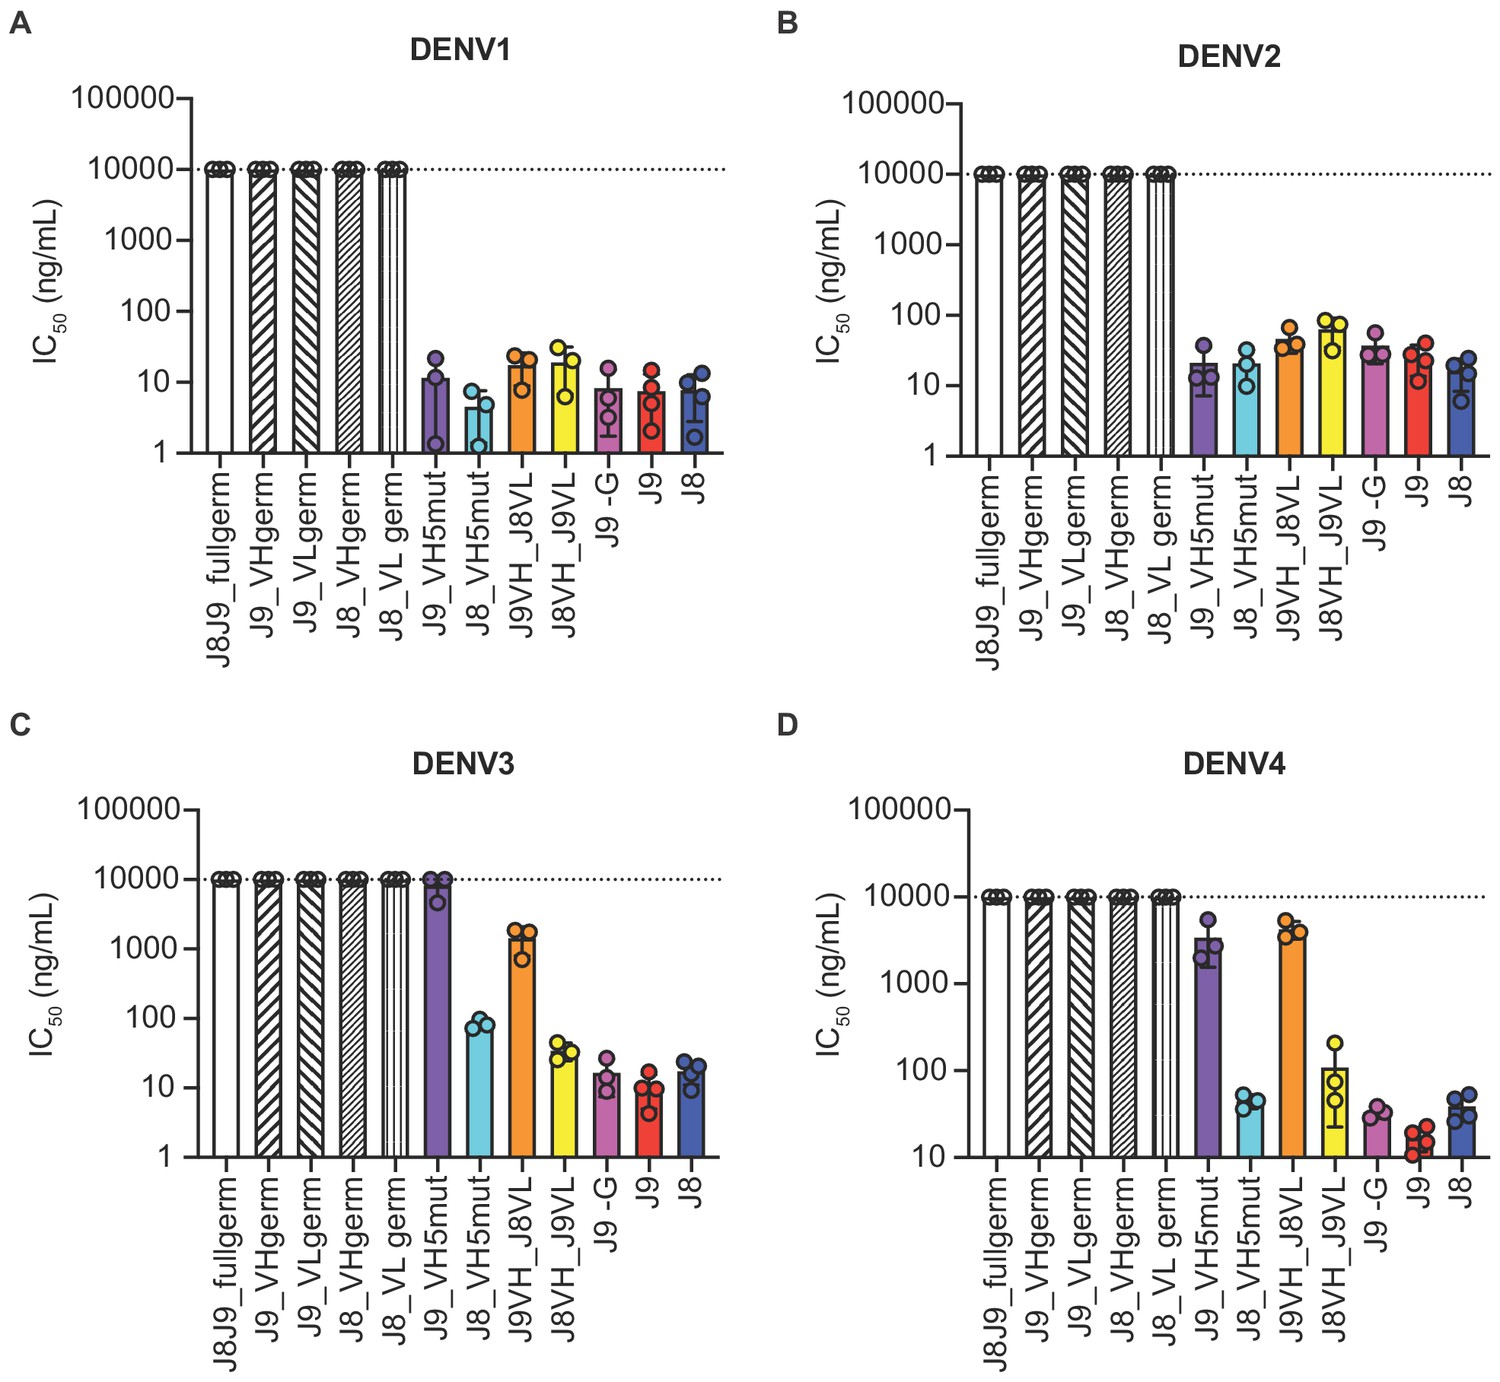
Contribution of VH and VL somatic hypermutation to J9 and J8 neutralizing activity.
For each antibody indicated on the x-axis, bars represent mean IC50 values obtained from 3 to 4 independent experiments indicated by data points against (A) DENV1, (B) DENV2, (C) DENV3, and (D) DENV4 reporter viruses. Error bars show the SD. Values at the dotted horizontal line in each graph indicates that 50% neutralization was not achieved at the highest IgG concentration tested (10 µg/ml). IC50 values for fully mature J9 and J8 are shown in red and blue bars, respectively. J8J9_full germ: germline J8/J9 VH paired with germline J8/J9 VL; J9_VHgerm: J9 germline VH paired with J9 mature VL; J9VL_germ: J9 mature VH paired with J9 germline VL; J8_VHgerm: J8 germline VH paired with J8 mature VL; J8_VLgerm: J8 mature VH paired with J9 germline VL; J9_VH5mut: J9 VH with five mutations indicated in yellow in Figure 6B paired with J9 mature VL; J8_VH5mut: J8 VH with five mutations indicated in yellow in Figure 6B paired with J8 mature VL; J9VH_J8VL: J9 mature VH paired with J8 mature VL; J8VH_J9VL: J8 mature VH paired with J9 mature VL; J9 -G: J9 VH with a single glycine deletion in FR2 paired with mature J9 VL.
Figure 7—figure supplement 1
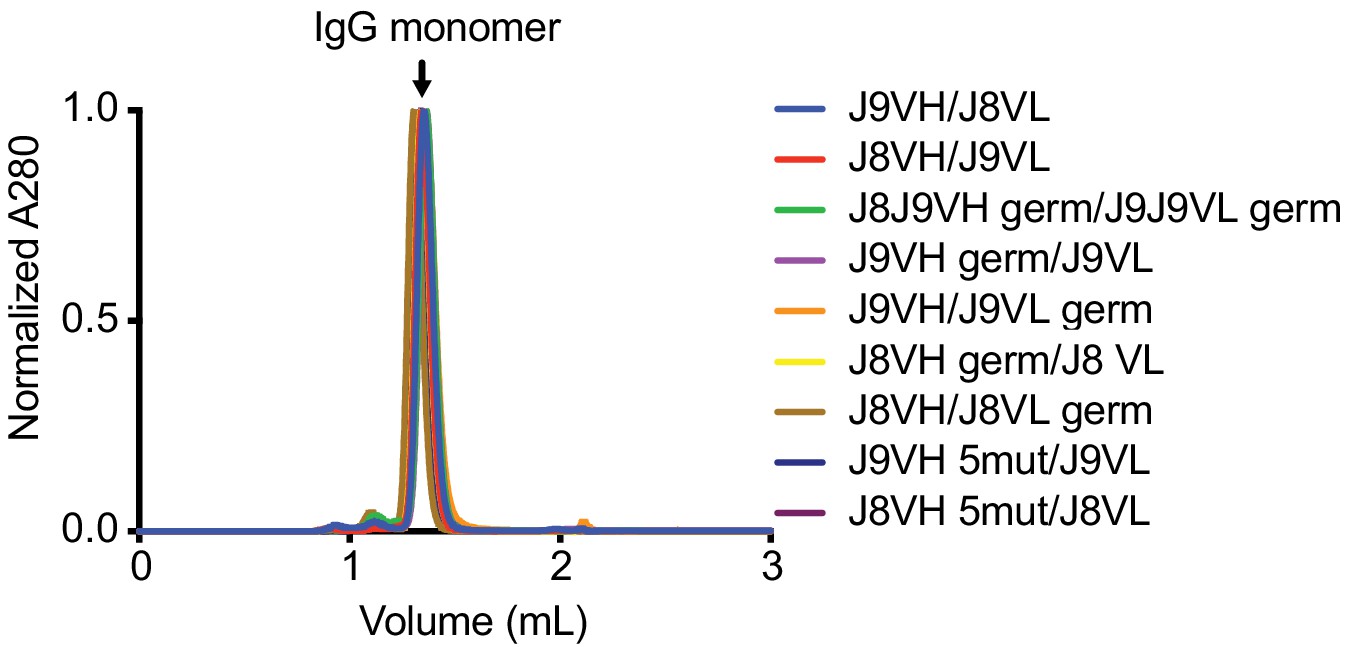
Analytical size exclusion chromatography of recombinant IgGs.
Biophysical characterization of J9 and J8 IgG variants by analytical size exclusion chromatography (Superdex S200 Increase 3.2/300). A single major peak at 280 nm corresponding to monomeric IgG is observed. Figure key is as described in Figure 7.
Tables
Table 1
Patient characteristics.
| Patient 013 | Patient 020 | |
|---|---|---|
| Age (years) | 31 | 24 |
| Sex | F | F |
| DENV exposure | Secondary | Primary |
| DENV serotype | 4 | 1 |
| Admission diagnosis* | Dengue + warning signs | Dengue |
| Discharge diagnosis* | Severe dengue | Dengue |
| Plasmablast sampling time (days post-fever onset) | 4 | 4 |
| Severe disease onset (days post-fever onset) | 5 | n/a |
| Co-morbidities/co-infections/pregnancy | Postpartum day 4 | n/a |
-
* According to 2009 WHO criteria (WHO, 2009).
Table 2
Summary of Ig sequences, clonal families and their corresponding mean somatic hypermutation (SHM) in unstimulated PBMCs vs. stimulated PBMCs from patient 013.
| Unstimulated PBMCs | Stimulated PBMCs | |
|---|---|---|
| VH all unique reads | 162928 | 1245789 |
| VH sequences with UMI ≥ 2 | 18588 | 146287 |
| VH clonal families | 11596 | 11407 |
| IgM sequences | 15318 | 4684 |
| SHM, IgM sequences | 0.6% | 2.7% |
| IgG sequences | 2156 | 129636 |
| SHM, IgG sequences | 6.7% | 7.0% |
| IgA sequences | 1114 | 11967 |
| SHM, IgA sequences | 7.0% | 6.2% |
| Clonal family threshold* | 17.8% | 21.4% |
| IgM clonal families | 9794 | 2260 |
| SHM, IgM clonal families | 0.6% | 1.9% |
| IgG clonal families | 1243 | 5657 |
| SHM, IgG clonal families | 6.0% | 5.6% |
| IgA clonal families | 559 | 3490 |
| SHM, IgA clonal families | 6.9% | 6.3% |
-
VH = variable heavy chain, VL = variable light chain, UMI = unique molecular identifier. * Nucleotide distance used to group related sequences into clonal families.
Table 3
Antibody sequence characteristics from patient 013 unstimulated and stimulated PBMCs related to clonal families of single plasmablasts with reactivity to DENV.
| Clonal family (antibodies) | Germline | Isotype | Reads for all clonotypes | |
|---|---|---|---|---|
| Unstimulated | Stimulated | |||
| 10 | IGHV3-30-3 | Total | 143 | 216292 |
| (C1, A7, I11, L9, P2, G5) | IgM | 8 | 427 | |
| IgG | 112 | 199151 | ||
| IgA | 23 | 16714 | ||
| 5 | IGHV1-69 | total | 422 | 141308 |
| (C4, J2, N2) | IgM | 9 | 91 | |
| IgG | 413 | 140117 | ||
| IgA | 0 | 1100 | ||
| 13 | IGHV4-34 | total | 32 | 82814 |
| (N8, F4) | IgM | 0 | 195 | |
| IgG | 32 | 76605 | ||
| IgA | 0 | 6014 | ||
| 7 | IGHV1-69 | total | 579 | 43179 |
| (J8, J9) | IgM | 10 | 98 | |
| IgG | 568 | 42315 | ||
| IgA | 1 | 764 | ||
| 9 | IGHV1-69 | total | 673 | 35793 |
| (K11, L3, M4, M11, O4) | IgM | 12 | 103 | |
| IgG | 656 | 34444 | ||
| IgA | 5 | 1246 | ||
| 8 | IGHV1-69 | total | 10 | 7349 |
| (J3, 403_P4) | IgM | 0 | 16 | |
| IgG | 10 | 7001 | ||
| IgA | 0 | 332 | ||
| 3 | IGHV1-18 | total | 10 | 2993 |
| (405_P4, I13) | IgM | 1 | 6 | |
| IgG | 9 | 2899 | ||
| IgA | 0 | 88 | ||
| 1 | IGHV4-39 | total | 4 | 1087 |
| (B10, M1, D8) | IgM | 1 | 11 | |
| IgG | 3 | 1049 | ||
| IgA | 0 | 27 | ||
| 2 | IGHV1-69 | total | 0 | 1087 |
| (H3, M6) | IgM | 0 | 7 | |
| IgG | 0 | 1066 | ||
| IgA | 0 | 14 | ||
| 11 | IGHV3-30-3 | total | 0 | 19 |
| (E9, I8) | IgM | 0 | 0 | |
| IgG | 0 | 19 | ||
| IgA | 0 | 0 | ||
Additional files
Download links
A two-part list of links to download the article, or parts of the article, in various formats.
Downloads (link to download the article as PDF)
Open citations (links to open the citations from this article in various online reference manager services)
Cite this article (links to download the citations from this article in formats compatible with various reference manager tools)
Broadly neutralizing human antibodies against dengue virus identified by single B cell transcriptomics
eLife 8:e52384.
https://doi.org/10.7554/eLife.52384


