Homeostatic regulation of perisynaptic matrix metalloproteinase 9 (MMP9) activity in the amblyopic visual cortex
- University of Maryland, United States
Figures
Figure 1

Parallel increase in MMP2/9 activity following LRx at thalamo-cortical synapses in deprived and non-deprived V1b.
(A) Top: Experimental timeline. Subjects received cMD from eye opening (postnatal day 14, (P14) until adulthood (>P90). 10 days of DE was followed by 4 hr of LRx. MMP2/9 biomarker (4 μl of 2 mg/ml Dye-quenched gelatin) was delivered i.c. 24 hr prior to 4 hr of LRx. Middle left: Coronal section with DAPI nuclear staining. Layer 4 of binocular region of V1 indicated by red box. Middle right: representative images of MMP2/9 biomarker fluorescence in deprived (dep) and non-deprived (non) V1b in cMD (left) and cMD+LRx subjects (LRx, right). Bottom: Quantification of biomarker puncta reveals no change in puncta size (left), but a parallel and significant increase in puncta density (middle) and fluorescent intensity (right) in dep and non V1b following LRx. One-way ANOVAs, size F(3, 19)=0.52, p=0.67; density F(3, 19)=6.7, p=0.003; intensity F(3, 19)=8.4, p=0.0009; n = 6, 5, 6, 6 subjects for cMD dep, cMD non, LRx dep, LRx non, respectively; *p<0.05, Tukey-Kramer post hoc test. (B) Representative images of MMP2/9 biomarker fluorescence (MMP; green) and marker for thalamic axons (VG2; magenta) in deprived visual cortex in cMD and cMD+LRx subjects. A parallel and significant increase in colocalization of biomarker puncta with VGluT2 following LRx in dep and non V1b. One-way ANOVA, F(3, 19)=9.5, p=0.0005; n = 6, 5, 6, 6 subjects for cMD dep, cMD non, LRx dep, LRx non, respectively; *p<0.05, Tukey-Kramer post hoc test. Co-localization with VGluT2 is lost following 2 μm shift of biomarker image (shift). (C) Representative images of MMP2/9 biomarker (green), VGluT2 (magenta) and parvalbumin fluorescence (PV; blue) in deprived and non-deprived cMD and cMD+LRx subjects. Significant increase in co-localization of biomarker puncta with VGluT2 at PV+ and PV-locations of dep and non V1b following LRx. One-way ANOVAs, PV+ F(3, 12)=17.33, p=0.00012; PV- F(3, 12)=56.17, p<0.0001; n = 4, 4, 4, 4 subjects for cMD dep, cMD non, LRx dep, LRx non, respectively; *p<0.05, Tukey-Kramer post hoc test. (D) Left: Representative immunoblots for active MMP9 (95 kDa), and β-actin from dep and non V1b. MMP9 level is normalized to β-actin and reported as % of cMD non. Right: Quantification of immunoblots reveals a parallel and significant increase in active MMP9 in dep and non V1b following 2 hr of LRx. One-way ANOVA, F(3, 26)=5.6, p=0.004; n = 7, 7, 8, 8 subjects for cMD dep, cMD non, LRx dep, LRx non, respectively: *p<0.05, Tukey-Kramer post hoc test.
-
Figure 1—source data 1
Source data for Figure 1.
- https://cdn.elifesciences.org/articles/52503/elife-52503-fig1-data1-v2.xlsx
Figure 2 with 1 supplement
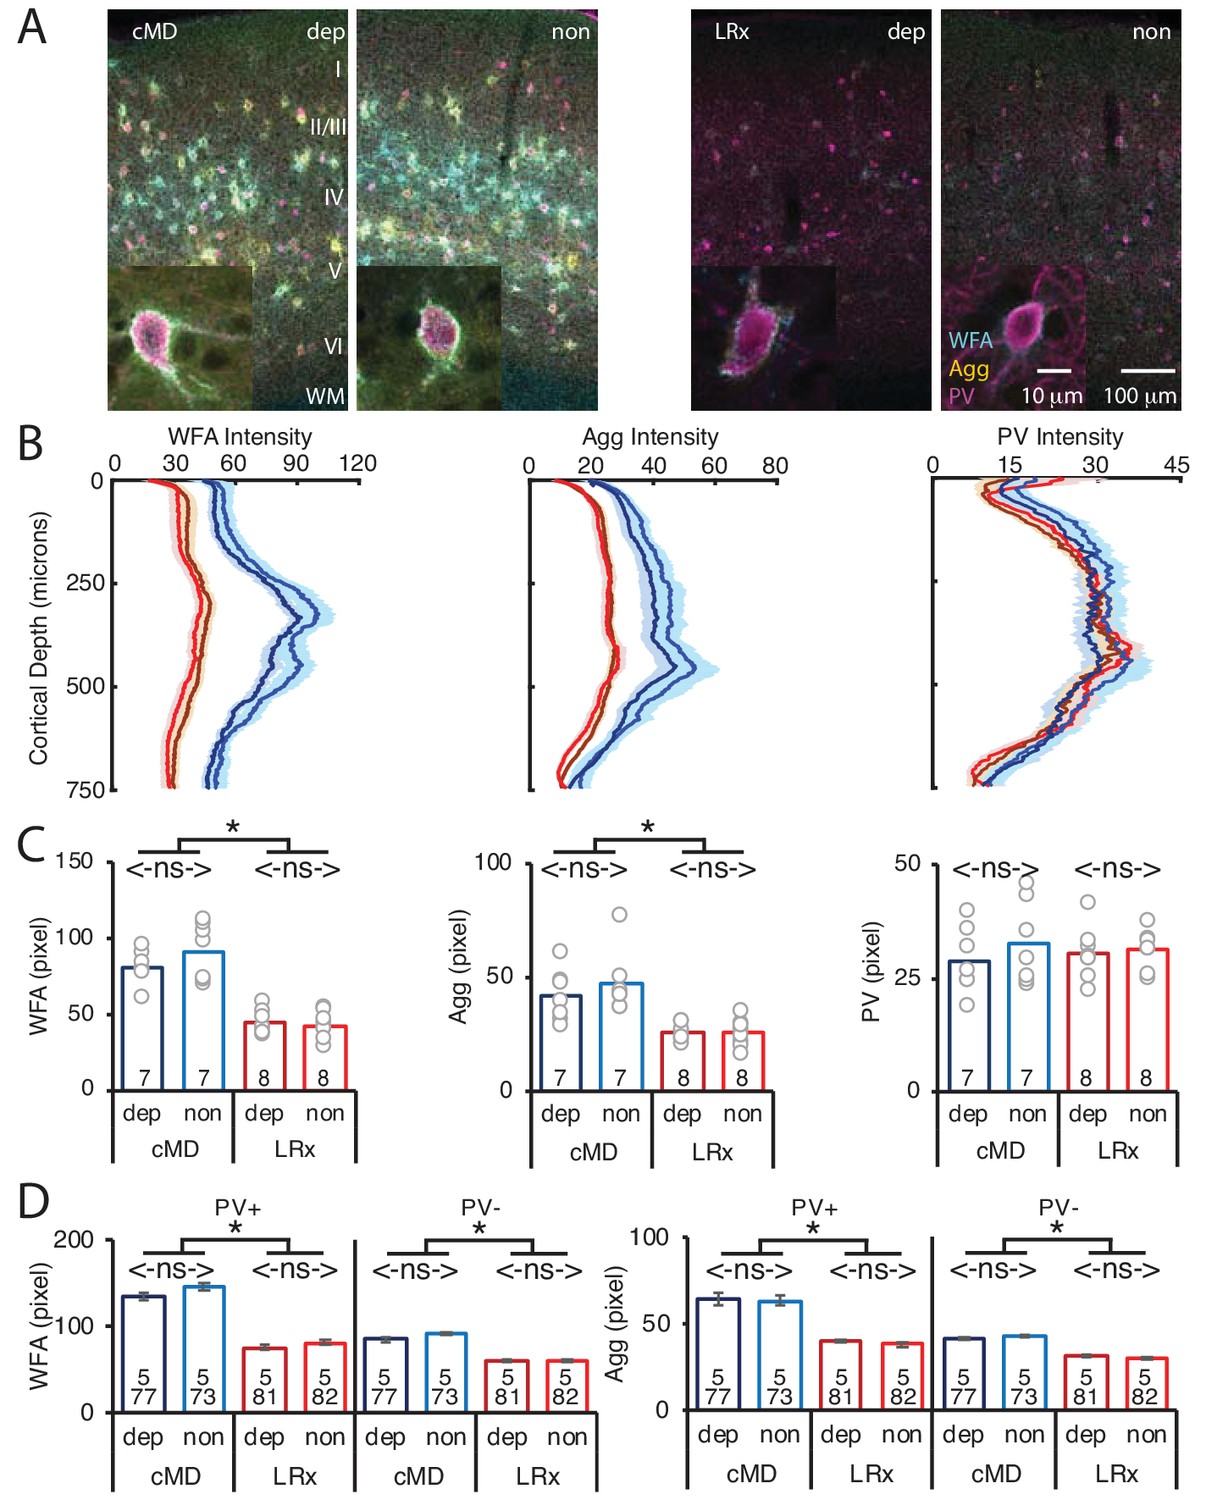
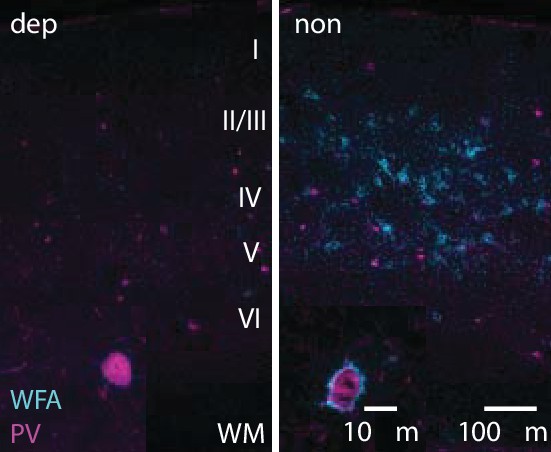
Parallel decrease in ECM integrity following LRx in deprived and non-deprived V1b.
(A) Representative triple labeled fluorescent micrographs of Wisteria floribunda agglutinin (WFA)-FITC staining (cyan), immunostaining for aggrecan (Agg; yellow) and parvalbumin (PV; magenta) in deprived (dep) and non-deprived (non) V1b in cMD (left) and cMD+LRx subjects (LRx, right). Roman numerals indicate cortical layer. WM = white matter. Inset: High magnification images of triple labeled PV+ interneurons (100X). (B) Fluorescence intensity profiles (mean ± SEM) along vertical depth of V1b. cMD dep (dark blue), cMD non (light blue), LRx dep (dark red), LRx non (red). (C) A parallel and significant decrease in WFA and Agg mean fluorescence intensity 250–400 μm from surface in dep and non V1b following LRx. One-way ANOVAs, WFA F(3, 26)=32, p=0.0001; Agg F(3, 26)=10, p=0.0001; PV F(3, 26)=0.4, p=0.75; n = 7, 7, 8, eight subjects for cMD dep, cMD non, LRx dep, LRx non, respectively; *p<0.05, Tukey-Kramer post hoc test. (D) LRx induces a significant decrease in WFA and Agg fluorescence intensity at PV+ and PV-locations in dep and non V1b. One-way ANOVAs, WFA PV+, F(3, 309)=40.3, p<0.0001; WFA PV-, F(3, 309)=30.1, p<0.0001; Agg PV+, F(3, 309)=29.4, p<0.0001; Agg PV-, F(3, 309)=18.7, p<0.0001; n (subjects, ROIs)=(5, 77 , 5, 73 , 5, 81 , 5, 82), for cMD dep, cMD non, LRx dep, LRx non, respectively; *p<0.05, Tukey-Kramer post hoc test.
-
Figure 2—source data 1
Source data for Figure 2.
- https://cdn.elifesciences.org/articles/52503/elife-52503-fig2-data1-v2.xlsx
Figure 2—figure supplement 1
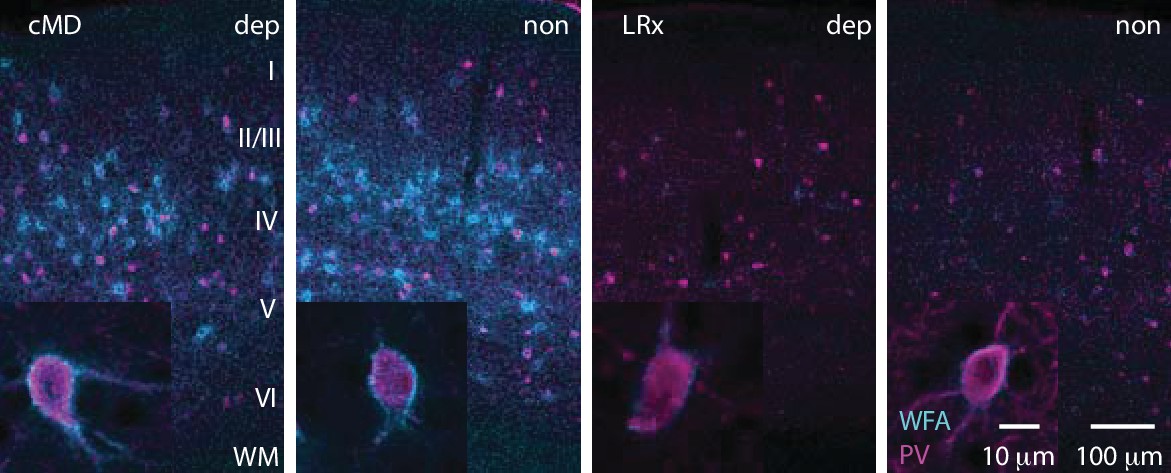
Parallel decrease in ECM integrity following LRx in deprived and non-deprived V1.
Representative double labeled fluorescent micrographs with Wisteria floribunda agglutinin (WFA)-FITC staining (cyan) and immunostaining for parvalbumin (PV; magenta) in deprived (dep) and non-deprived (non) V1b in cMD (cMD, left) and cMD+LRx subjects (LRx, right). Roman numerals indicate cortical layer. WM = white matter. Inset: High magnification images of double labeled PV+ interneurons (100X).
Figure 3
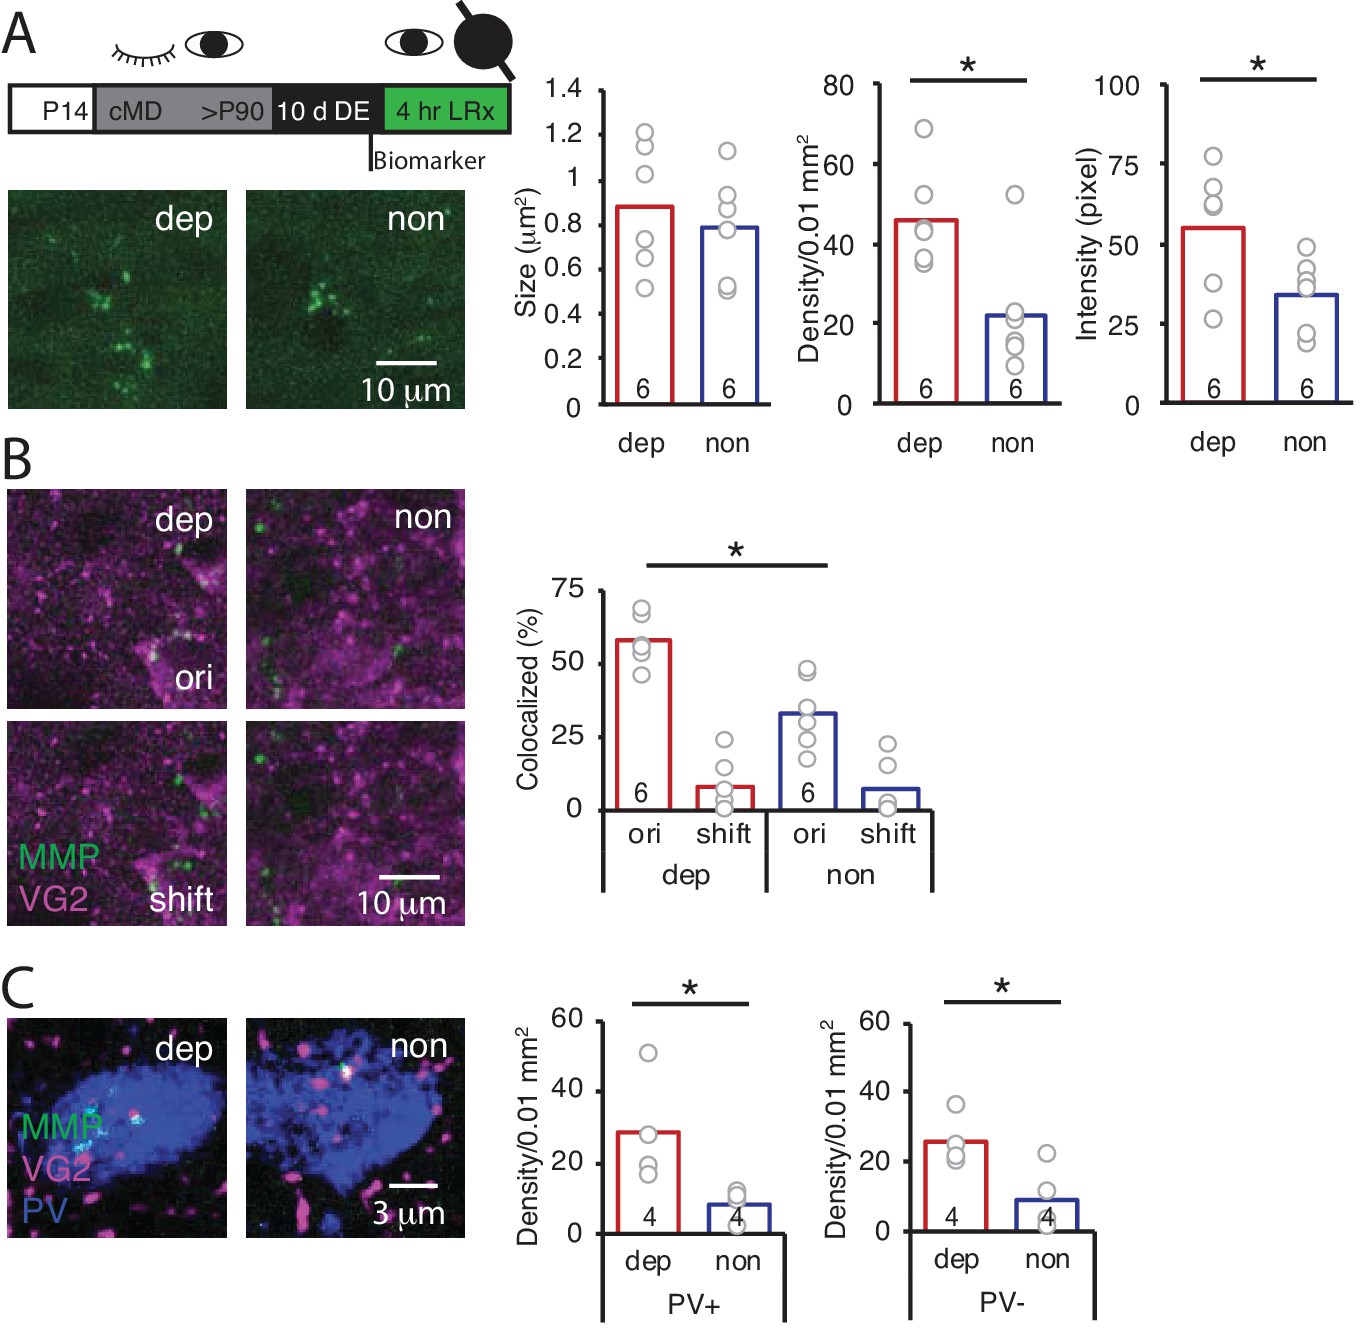
LRx limited to deprived eye is sufficient to induce perisynaptic MMP2/9 activity at thalamo-cortical synapses in deprived V1b.
(A) Top: Experimental timeline. A light-occluding eye patch was attached to the non-deprived eye before DE. Bottom left: Representative images of MMP2/9 biomarker fluorescence in layer 4 of chronically deprived (dep, contralateral to cMD, ipsilateral to eye patch) and non-deprived (non, ipsilateral to cMD, contralateral to eye patch) V1b of LRx subject. Quantification of biomarker puncta reveals a significant increase in density and intensity in dep vs non V1b following LRx to amblyopic eye; n = 6, six subjects for LRx dep, LRx non, respectively; *p<0.05, Student’s T-test. (B) Representative images of MMP2/9 biomarker fluorescence (MMP, green) and VGluT2 immunoreactivity (VG2, magenta) in dep and non V1b of LRx subject. A significant increase in biomarker colocalization with VGluT2 in dep vs non V1b following LRx to amblyopic eye; n = 6, six subjects for LRx dep, LRx non, respectively; *p<0.05, Student’s T-test. Co-localization with VGluT2 is reduced following 2 μm shift of biomarker image (shift). (C) Representative images of MMP2/9 biomarker (green), VGluT2 (magenta) and parvalbumin fluorescence (PV, blue) in dep and non V1b following LRx. A significant increase in co-localization of MMP2/9 biomarker puncta with VGluT2 at PV+ and PV- immunoreactive locations of dep vs non V1b; n = 4; *p<0.05, Student’s T-test.
-
Figure 3—source data 1
Source data for Figure 3.
- https://cdn.elifesciences.org/articles/52503/elife-52503-fig3-data1-v2.xlsx
Figure 4 with 1 supplement
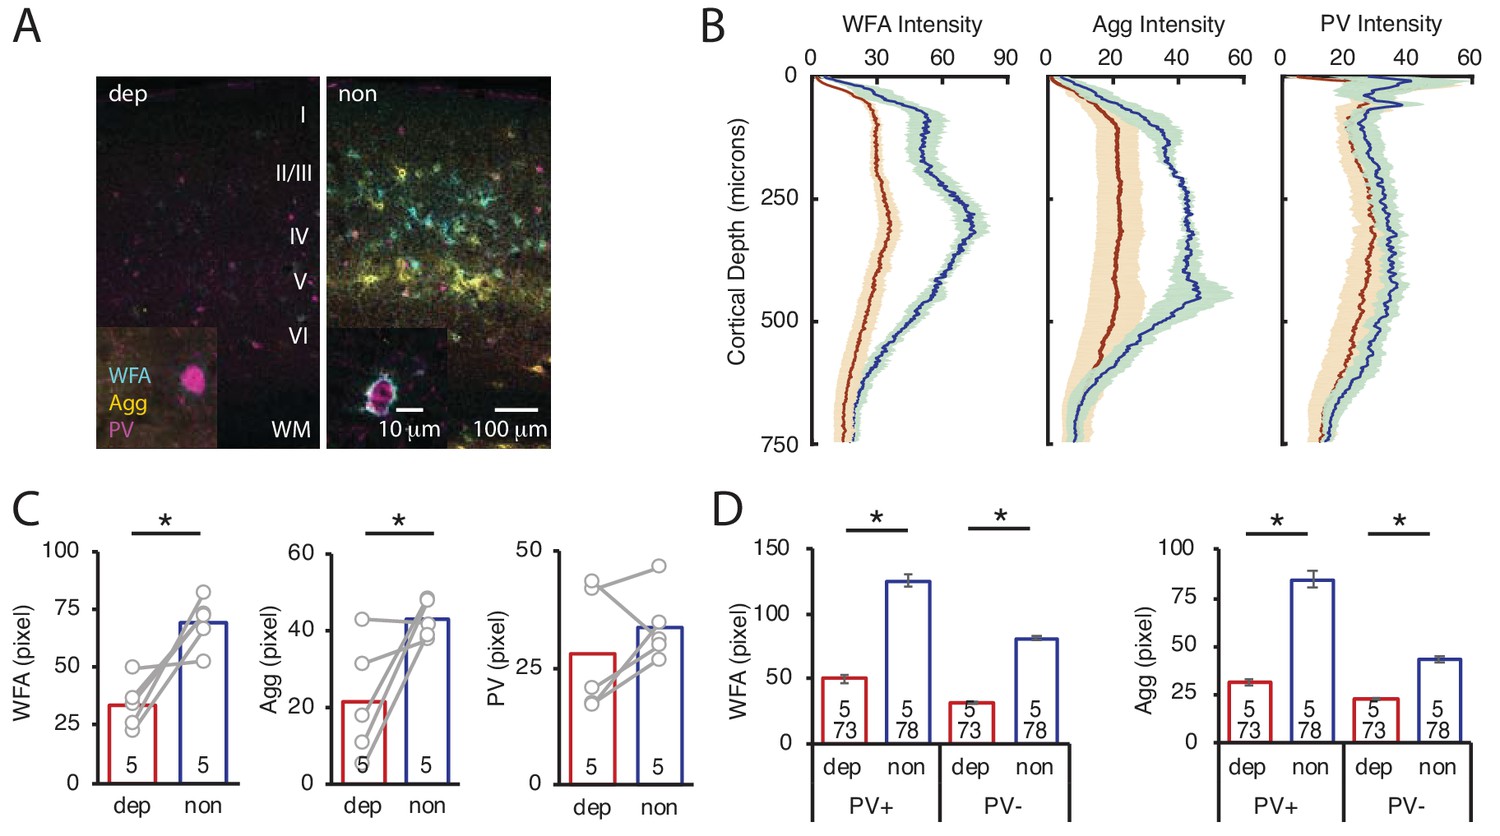
LRx limited to deprived eye is sufficient to decrease ECM integrity in deprived V1b.
(A) Representative triple labeled fluorescent micrographs of WFA-FITC staining (cyan), immunostaining for aggrecan (Agg; yellow) and parvalbumin (PV; magenta) of deprived (dep, contralateral to cMD, ipsilateral to eye patch) and non-deprived (non, ipsilateral to cMD, contralateral to eye patch) V1b after LRx to amblyopic eye. Roman numerals indicate cortical layer. WM = white matter. Inset: High magnification images of triple labeled PV+ interneurons (100X). (B) Fluorescence intensity profiles (mean ± SEM) along vertical depth of V1b. Dep LRx (dark red), non LRx (blue). (C) A significant decrease in WFA and Agg mean fluorescence intensity 250–400 μm from surface in dep V1b; n = 5; *p<0.05, Student’s T-test. (D) LRx-induced a significant decrease in WFA and Agg fluorescence intensity at PV+ and PV-locations in dep V1b; n (subjects, ROIs)=(5, 73 , 5 78), for LRx dep, LRx non, respectively; *p<0.05, Student’s T-test.
-
Figure 4—source data 1
Source data for Figure 4.
- https://cdn.elifesciences.org/articles/52503/elife-52503-fig4-data1-v2.xlsx
Figure 4—figure supplement 1
LRx limited to deprived eye is sufficient to decrease ECM integrity in deprived V1b.
Representative double labeled fluorescent micrographs with WFA-FITC staining (cyan) and parvalbumin (PV; magenta) of deprived (dep, contralateral to cMD, ipsilateral to eye patch) and non-deprived (non, ipsilateral to cMD, contralateral to eye patch) V1b, after LRx to amblyopic eye. Roman numerals indicate cortical layer. WM = white matter. Inset: High magnification images of triple labeled PV+ interneurons (100X).
Figure 5
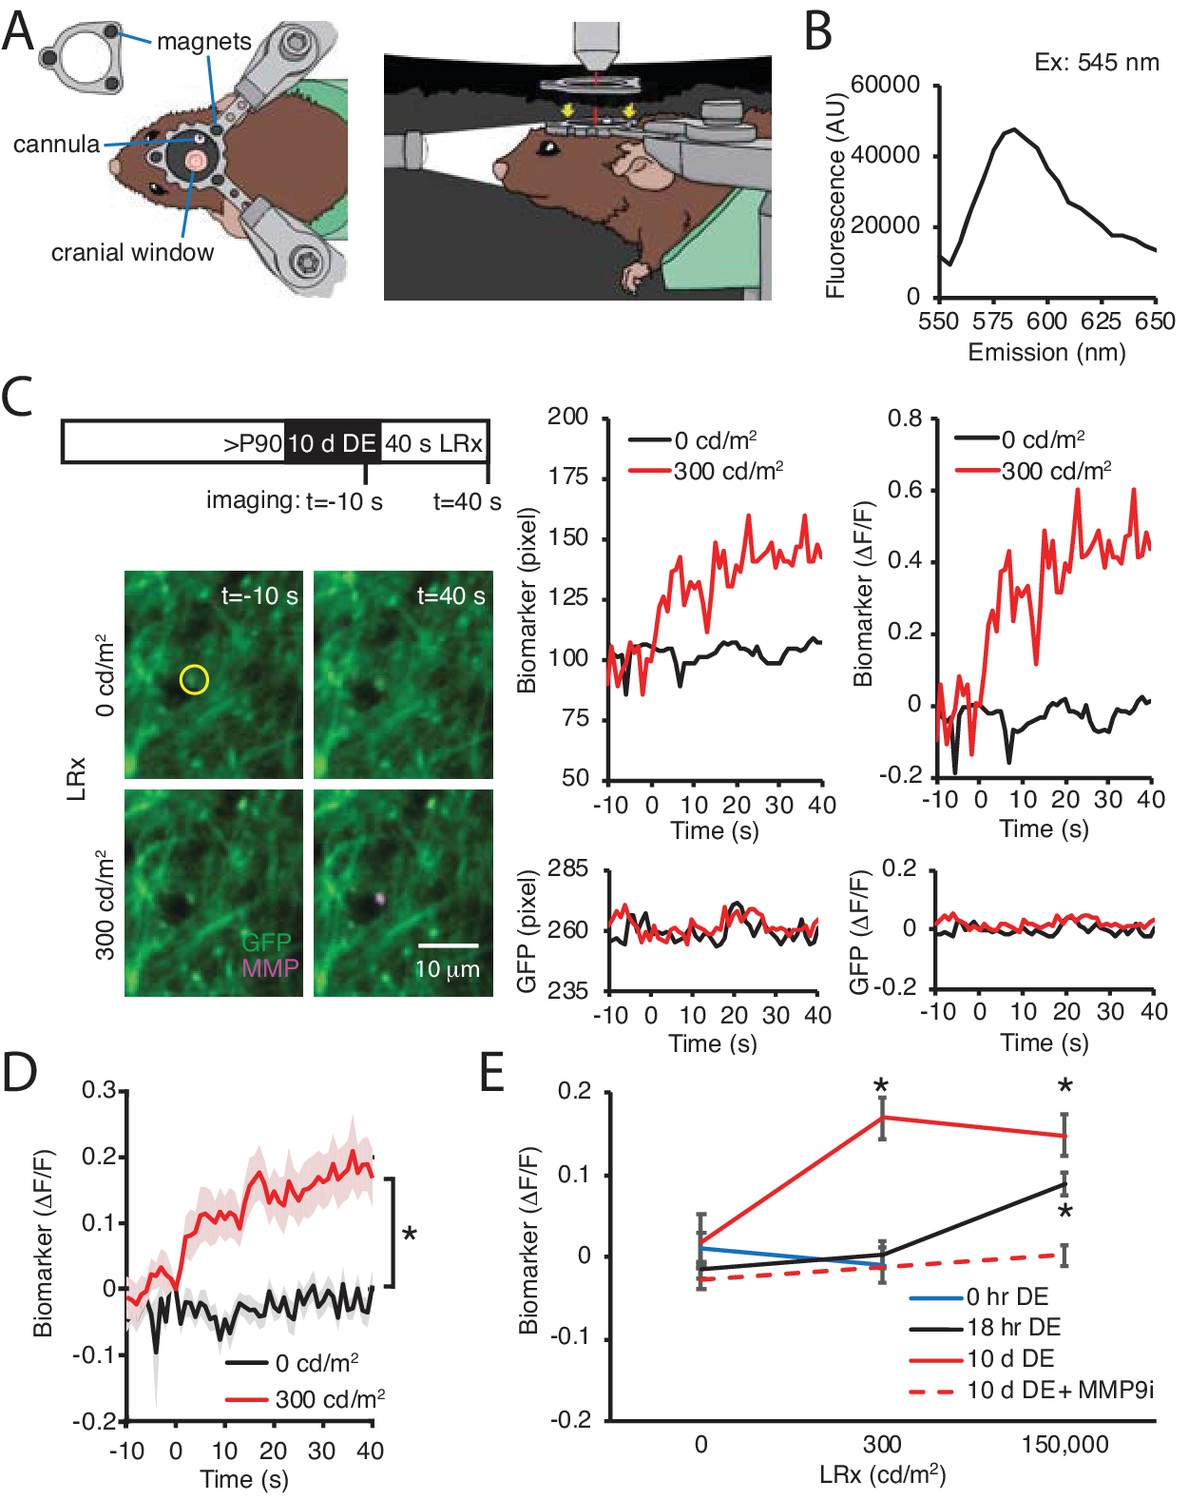
DE lowers the threshold for light-induced activation of MMP2/9.
(A) Dark chamber with an imaging window allows maintenance of visual deprivation during two photon live imaging of MMP2/9 biomarker. Left drawing: Top view of a subject wearing a custom aluminum headpost (1 cm diameter) magnetically held to an o-ring in the blackout ceiling of the dark camber (inset; 3 mm diameter magnets APEX magnets; magnetic field generation around V1,<20 gauss). The headpost is secured to a stereotax. The cannula for biomarker delivery is adjacent to theimaging window margin. Right drawing: Side view of a subject in the dark chamber. The headpost is magnetically attached to the o-ring opening of the blackout ceiling (magnet locations, yellow arrows). (B) In vitro emission spectrum of MMP2/9 biomarker A580 (2 ng/ml) incubated with activated rat recombinant MMP9 (rrMMP9, 100 ng). (C) Inset: Experimental timeline. Adult (>P90) WT mice received AAV-CaMKII-GFP~2 weeks before 10 d of DE. Biomarker was delivered 24 hr before imaging. Subjects received 40 s of light stimulation (1 Hz flash of 470 nm LED at 0 or 300 cd/m2). Left: Representative images of GFP (green) and biomarker (MMP, magenta) signals in V1b 10 s prior or 40 s after light stimulation at 0 or 300 cd/m2 in a DE subject. Right: Time course of raw fluorescent intensities (pixel) and ΔF/F of MMP biomarker (top) and co-localized GFP (bottom) within the single ROI denoted by yellow circle, from 10 s before (−10) to 40 s after (+40) light stimulation of 0 or 300 cd/m2 in a DE subject. (D) Summary data: Time course of ΔF/F of MMP biomarker from −10 s to +40 s of light stimulation of 0 or 300 cd/m2 in DE subjects. ΔF/F of MMP biomarker was stable in absence of visual stimulation (0 cd/m2) and increased over time in response to 300 cd/m2 light stimulation (mean ± SEM; Repeated measure ANOVA, F(1, 22), *p<0.001; n = 12 puncta from three subjects each). (E) Biomarker ΔF/F +40 s relative to 0 s as a function of DE (0, hr, 18 hr or 10 d) and light intensity (0, 300, or 150,000 cd/m2). Moderate intensity light did not induce a change in biomarker fluorescence in the absence of DE (blue line, p=0.49, Student’s T-test; n = 11, 10 puncta for 0 and 300 cd/m2, respectively). Following 18 hr of dark adaptation, a significant increase in biomarker fluorescence was observed in response to high, but not moderate intensity light (black line, One-way ANOVA, F(2, 45)=11.5, p<0.0001; n = 12, 12, 24 puncta for 0, 300, 150,000 cd/m2, respectively, *p<0.05, Tukey-Kramer post hoc test). Following 10 d DE, moderate and high intensity light significantly increased biomarker fluorescence (solid red line, One-way ANOVA, F(2, 40)=6.3, p=0.0042; n = 12, 12, 19 puncta for 0, 300, 150,000 cd/m2, respectively, *p<0.05, Tukey-Kramer post hoc test). The increase in biomarker fluorescence by 150,000 cd/m2 stimulation to 10 d DE subjects was inhibited by an MMP9 inhibitor delivered 24 hr before visual stimulation (MMP9i; 5 nM delivered i.c. 24 hr prior to LRx, dashed red line, p=0.13 Student’s T-test; n = 13 puncta for 0 and 150,000 cd/m2).
-
Figure 5—source data 1
Source data for Figure 5.
- https://cdn.elifesciences.org/articles/52503/elife-52503-fig5-data1-v2.xlsx
Additional files
Download links
A two-part list of links to download the article, or parts of the article, in various formats.
Downloads (link to download the article as PDF)
Open citations (links to open the citations from this article in various online reference manager services)
Cite this article (links to download the citations from this article in formats compatible with various reference manager tools)
Homeostatic regulation of perisynaptic matrix metalloproteinase 9 (MMP9) activity in the amblyopic visual cortex
eLife 8:e52503.
https://doi.org/10.7554/eLife.52503


