ERK3/MAPK6 controls IL-8 production and chemotaxis
- Cell Biology Unit, University Medical Center of the Johannes Gutenberg University Mainz, Germany
- Institute of Medical Biostatistics, Epidemiology and Informatics, University Medical Center of the Johannes Gutenberg University Mainz, Germany
- Center for Thrombosis and Hemostasis (CTH), University Medical Center of the Johannes Gutenberg University Mainz, Germany
- Institute of Medical Biometry and Statistics, Faculty of Medicine and Medical Center – University of Freiburg, Germany
- Departments of Biology and Physics, Wilkes University, United States
- Gene Editing Group, Institute of Biochemistry II, Goethe University, Germany
- Frankfurt Cancer Institute, Germany
- Institute of Immunology, University Medical Center of the Johannes Gutenberg University Mainz, Germany
- Department of Hematology, Medical Oncology, & Pneumology, University Medical Center of the Johannes Gutenberg University Mainz, Germany
- Department of General, Visceral- and Transplant Surgery, University Medical Center, Germany
- University Cancer Center Mainz, University Medical Center Mainz, Germany
Figures
Figure 1 with 1 supplement
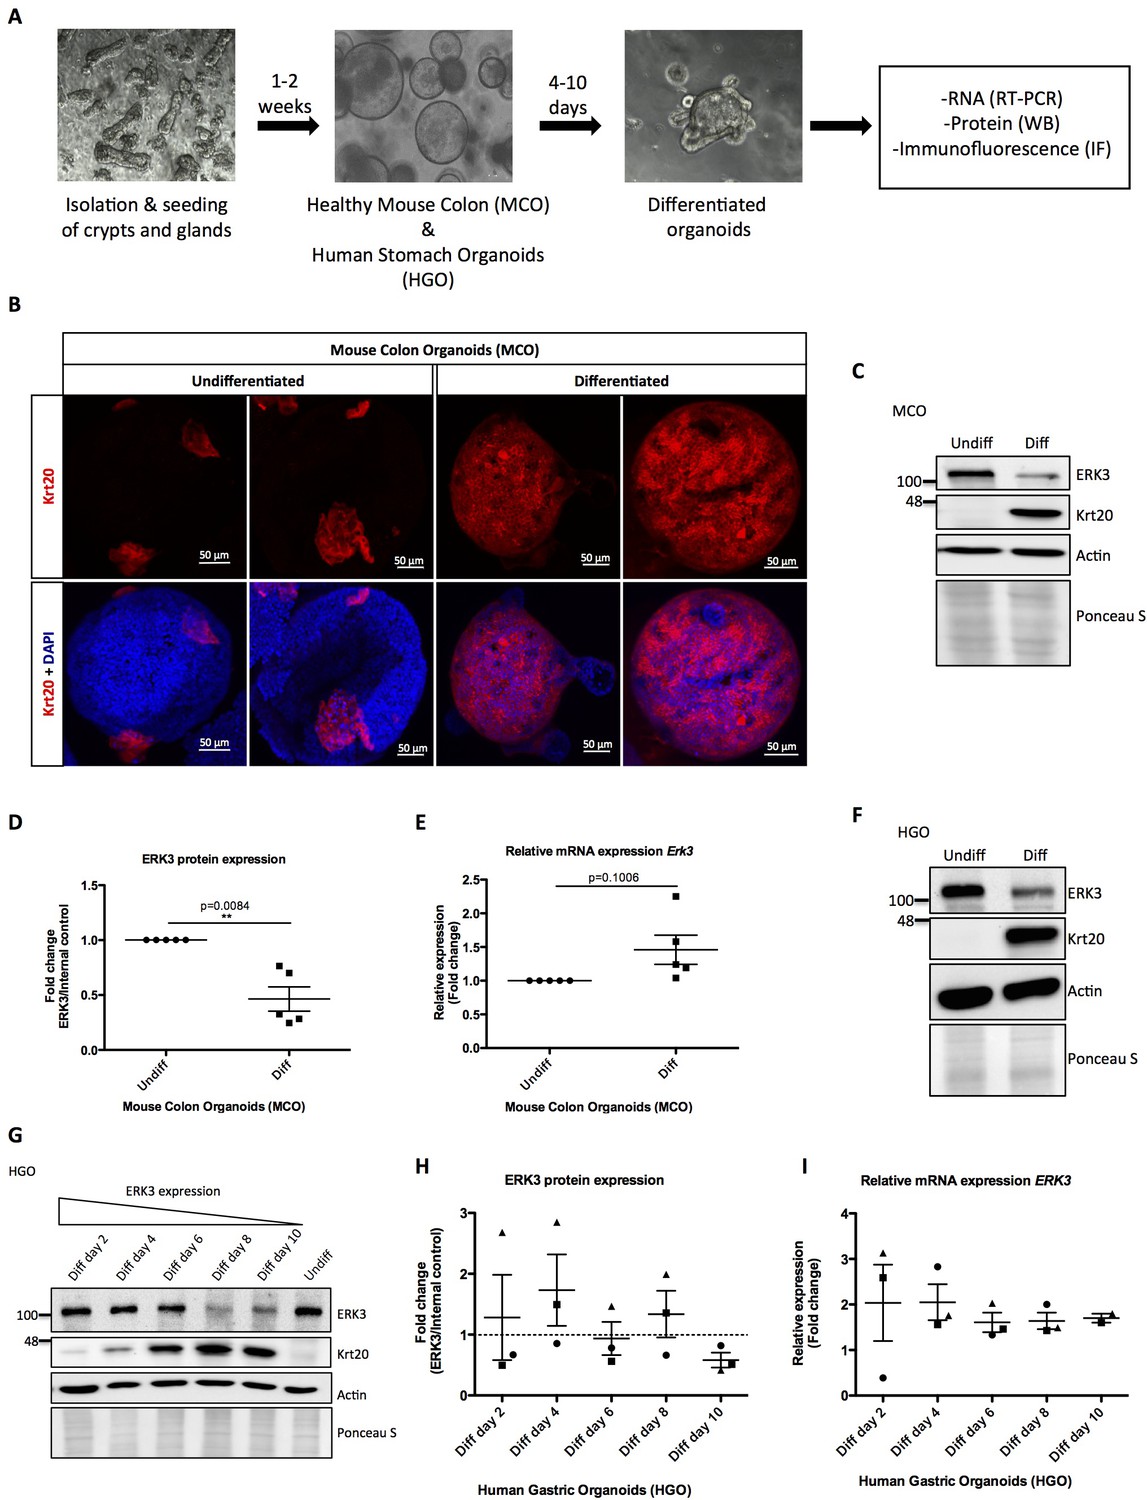
Role of ERK3 in gastrointestinal organoids morphogenesis and differentiation.
(A) Schematic outline of individual steps for organoid establishment and differentiation. Undifferentiated, healthy mouse colon organoids (MCO) or human gastric organoids (HGO) were differentiated by withdrawal of Wnt3A and RSP1 and subjected to western blot (WB), RT-PCR and/or immunofluorescence staining (IF) analyses. (B) Representative micrographs of undifferentiated and differentiated MCO. Shown are stainings with differentiation marker Keratin (20) (Krt20) (red) and DAPI (blue). Scale bar 50 µm. (C) Representative immunoblot analysis of undifferentiated (Undiff) and differentiated (Diff) MCO. MCO were seeded in matrigel, 3 days post-seeding differentiation process was induced. Organoids were lysed on day 7 for WB analyses using antibodies against total ERK3 and Krt20 differentiation marker. Actin and Ponceau S staining were used as loading controls. (D) Fold change in ERK3 protein expression presented as a ratio Diff/Undiff after normalization with the internal loading control (Actin/Ponceau S). Data derived from five independent experiments (n = 5) are represented as mean ± SEM fold change; *p<0.05, **p<0.01, ***p<0.001, paired t-test. (E) Quantitative RT-PCR analysis of Erk3 expression in differentiated organoids when compared to undifferentiated organoids. Each biological replicate was measured in triplicates. Log2 fold change in gene expression is presented as mean ± SEM of five independent experiments (n = 5); *p<0.05, **p<0.01, ***p<0.001, paired t-test. Expression of differentiation markers: Krt20 and intestinal alkaline phosphatase (Alpi) (enterocyte marker) was determined by RT-PCR and is presented in Figure 1—figure supplement 1A-B. (F) WB analysis of HGOs under undifferentiated and differentiated conditions. HGOs were seeded in matrigel and after 4 days differentiation was started by withdrawal of Wnt3A and RSP1. Organoids were lysed on day 10 and levels of ERK3 and Krt20 were assessed by WB analysis. Actin and Ponceau S staining were used as loading controls. (G) Representative western blot analysis of ERK3 kinetics in HGOs upon differentiation. HGOs were seeded in matrigel and differentiation was induced 4 days post-seeding. Organoids were lysed on days 2, 4, 6, 8 and 10, levels of ERK3 were monitored. Krt20 expression was used as a differentiation marker and actin/Ponceau S staining as loading controls. (H) ERK3 expression in differentiating HGO was calculated in respect to the undifferentiated organoids after normalization with loading control and is presented as mean fold change ± SEM from three biological replicates of HGOs (n = 3) from two different patients. (I) Relative expression of ERK3 was assessed by RT-PCR in differentiated HGOs (from two different patients) on days 2, 4, 6, 8 and 10 in respect to the undifferentiated organoids and is presented as mean log2 fold change ± SEM from three independent experiments (n = 3) except of day 10 (Diff day 10) where two biological replicates are depicted (n = 2). Expression of the Gastrokine 1 (GKN1) differentiation marker was monitored and is presented in Figure 1—figure supplement 1C.
-
Figure 1—source data 1
Full membrane scans for western blot images for Figure 1C, F and G.
- https://cdn.elifesciences.org/articles/52511/elife-52511-fig1-data1-v2.pdf
Figure 1—figure supplement 1
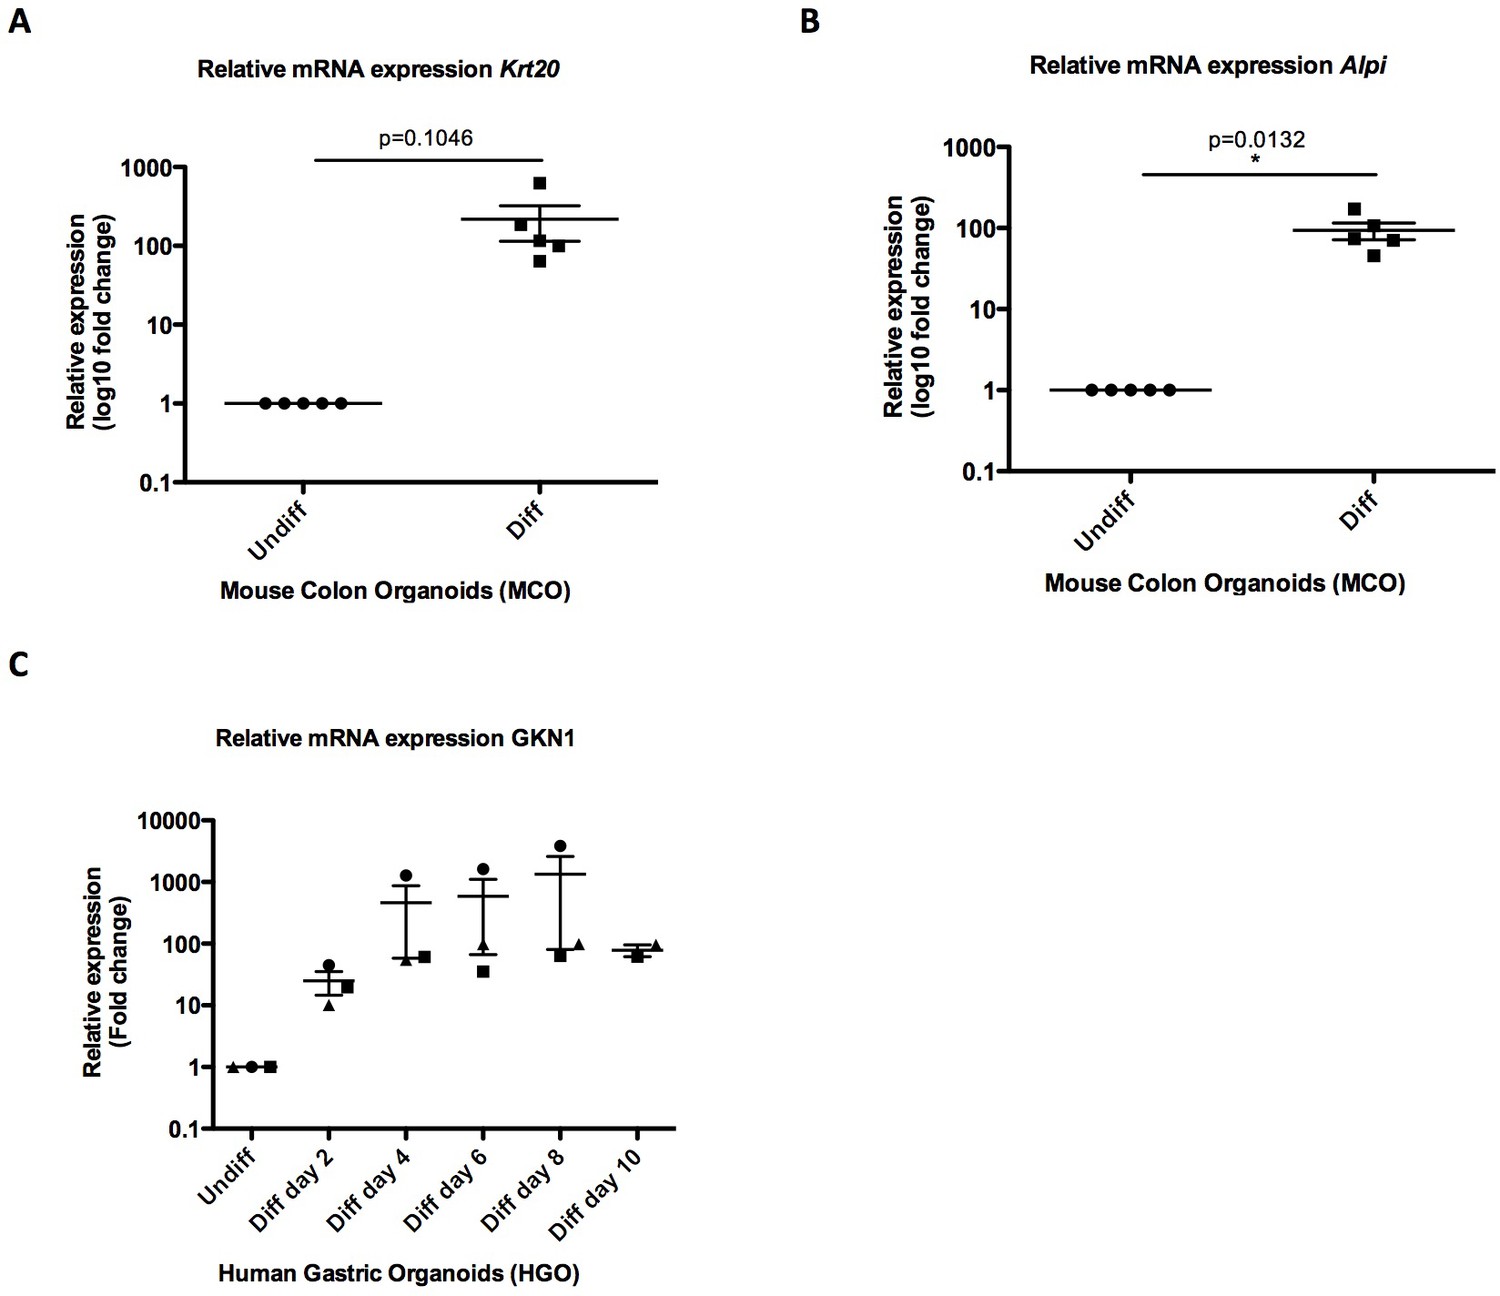
Differentiation of mouse and human gastrointestinal organoids.
(A–B) Quantitative RT-PCR analysis of Krt20/Alpi differentiation markers. Log2 fold change in gene expression is presented as mean ± SEM of five independent experiments (n = 5); *p<0.05, **p<0.01, ***p<0.001, paired t-test. (C) Quantitative RT-PCR analysis of GKN1 differentiation markers. Log2 fold change in gene expression is presented as mean ± SEM of three independent experiments (n = 3) except for day 10 (Diff day 10) for which two biological replicates are presented (n = 2).
Figure 2 with 3 supplements
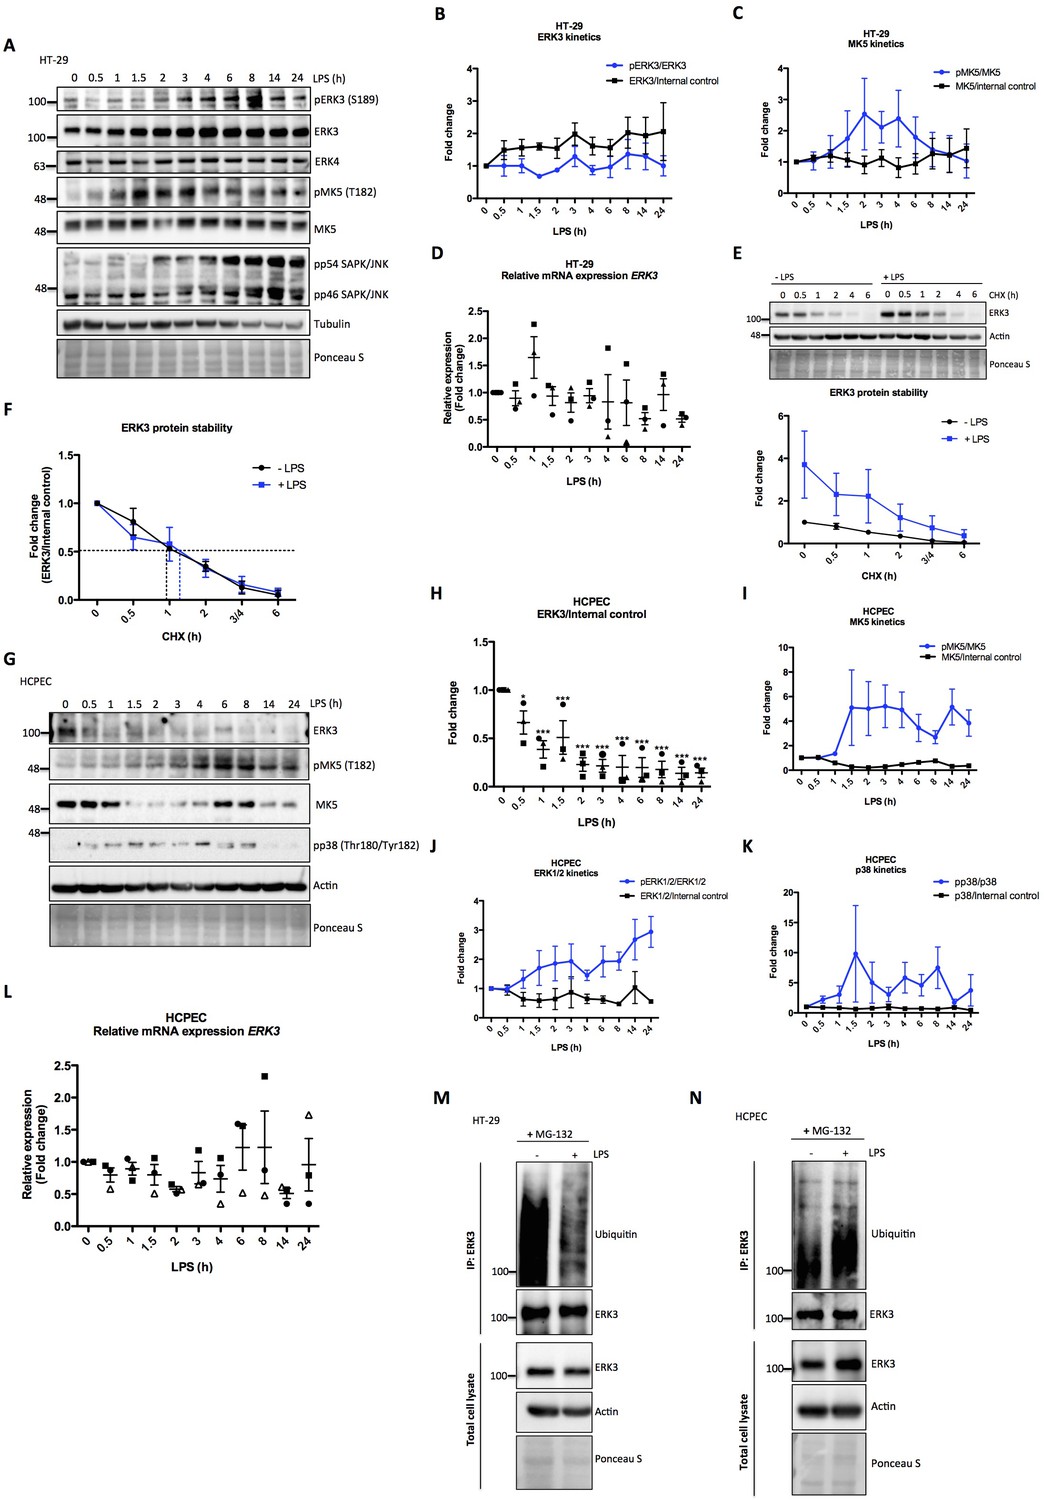
Effect of LPS on ERK3 expression and protein stability.
HT-29 cells and HCPECs were stimulated with LPS (200 ng/ml) at various time points as indicated. (A) Representative western blot analysis of HT-29 cells. Phosphorylation and/or total protein levels of ERK3, ERK4, MK5 and JNK were monitored. Tubulin immunoblots and Ponceau S staining were employed to monitor equal loading. (B) Changes in the expression and phosphorylation of ERK3 protein are shown as a fold change after normalization with internal loading control. Each time point was normalized to unstimulated cells (0). Fold change values from three independent experiments (n = 3) are represented as mean ± SEM. (C) Activation kinetics of MK5 in HT-29 cells stimulated with LPS. Fold change in MK5 phosphorylation levels upon LPS stimulation normalized to total protein levels and expression levels of MK5 normalized to internal loading control are shown. Fold change values from three independent experiments (n = 3) are represented as mean ± SEM. (D) Quantitative RT-PCR analysis of ERK3 expression. Each biological replicate was measured in triplicates. Log2 fold change in gene expression is presented as mean ± SEM of three independent experiments (n = 3); *p<0.05, **p<0.01, ***p<0.001, one-way ANOVA, Turkey’s post-test. (E) ERK3 protein stability was assessed by CHX chase at 0 hr, 0.5 hr, 1 hr, 2 hr, 3/4 hr and 6 hr in the presence and absence of LPS (30 min pre-treatment). Western blot analyses were performed and representative results are presented. ERK3 protein levels in respect to the untreated cells (-LPS, 0 hr) were calculated using ImageJ and data are presented as mean fold change ± SEM from three independent experiments (n = 3). (F) Graph presents ERK3 protein levels quantified in respect to the untreated cells (0) of unstimulated (-LPS) and LPS stimulated (+LPS) cells, respectively and data are presented as mean fold change ± SEM from three independent experiments (n = 3). (G) HCPECs were stimulated with LPS and immunoblot analyses of the phosphorylation and/or total protein levels of ERK3, MK5 and p38 were performed. Actin and Ponceau S staining were used as loading controls. (H) Plotted here are fold changes in expression of ERK3 protein. Results are shown as mean ± SEM fold change after normalization with the levels of internal loading control. Each time point was normalized in respect to unstimulated HCPECs (0). Data are a representative of three independent experiments (n = 3); *p<0.05, **p<0.01, ***p<0.001, one-way ANOVA, Turkey’s post-test. (I-K) Plotted here are fold changes in the phosphorylation of (I) MK5 at T182, (J) ERK1/2 and (K) p38 in response to LPS stimulation normalized to the respective total protein levels as well as the expression levels of total proteins normalized in respect to the internal loading control. Each time point was normalized in respect to the unstimulated cells (0). Fold change values are presented as mean ± SEM from three independent experiments (n = 3). (L) Quantitative RT-PCR analysis of ERK3 mRNA expression levels. Log2 fold change in gene expression is presented as mean ± SEM of three independent experiments (n = 3); *p<0.05, **p<0.01, ***p<0.001, one-way ANOVA, Turkey’s post-test. (M-N) LPS-mediated ubiquitination of endogenous ERK3 in (M) HT-29 cells and (N) HCPECs. HT-29 cells and HCPECs were seeded and treated as mentioned in the Materials and methods. Total cell lysates (TCL) and endogenous ERK3 immunoprecipitates (IP) were analyzed by immunoblotting. Levels of ERK3 and polyubiqutination were monitored. Actin and Ponceau S staining were used as loading controls for TCL western blot analysis. Results are representatives of at least two experiments showing the same tendency. ERK3 kinetics in response to other immune stimuli are presented in Figure 2—figure supplement 3).
-
Figure 2—source data 1
Full membrane scans for western blot images for Figure 2A, E, G, M and N.
- https://cdn.elifesciences.org/articles/52511/elife-52511-fig2-data1-v2.pdf
Figure 2—figure supplement 1
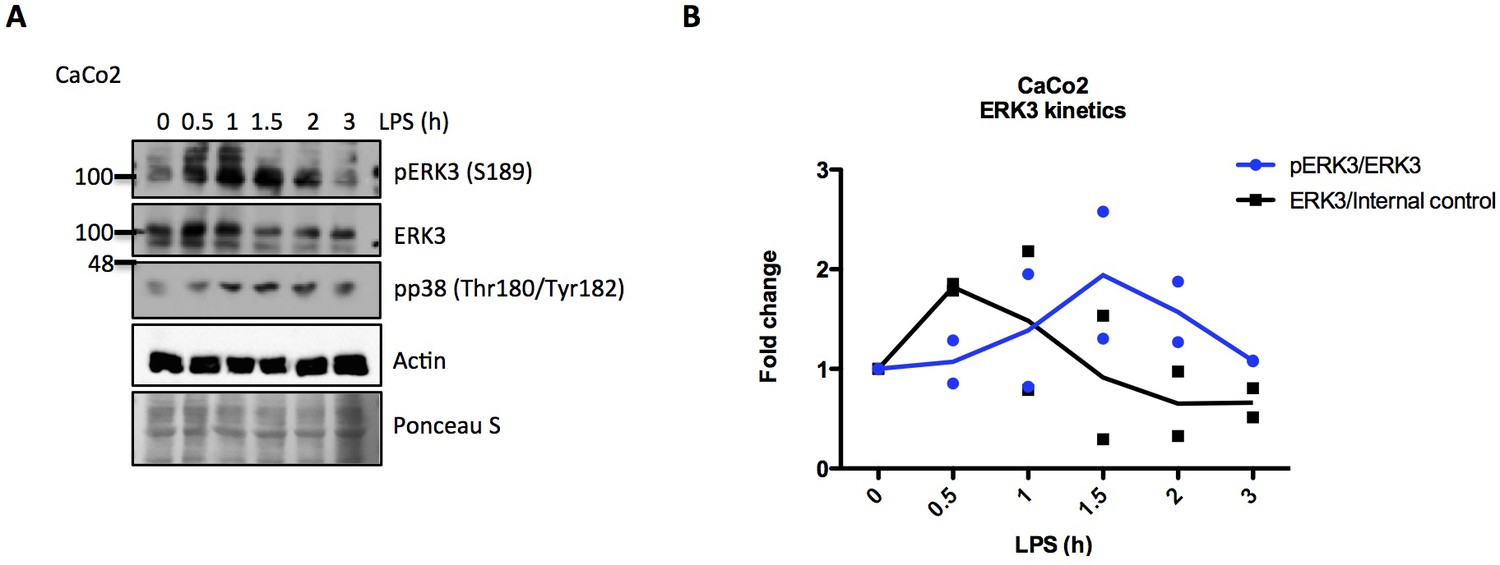
ERK3 kinetics in CaCo2 cells.
(A–B) Western blot analysis of CaCo2 cells stimulated with LPS. CaCo2 cells were stimulated at indicated time points with LPS and activation status of ERK3 as well as the phosphorylation of p38 were analyzed by immunoblotting. Actin and Ponceau S staining were used as loading controls. (A) Representative western blot. (B) Changes in the expression and phosphorylation of ERK3 protein are shown as a fold change after normalization with internal loading control. Each time point was normalized to unstimulated cells. Fold change values from two (n = 2) independent experiments are represented and means were connected for better visualization.
-
Figure 2—figure supplement 1—source data 1
Full membrane scans for western blot images for Figure 2—figure supplement 1A.
- https://cdn.elifesciences.org/articles/52511/elife-52511-fig2-figsupp1-data1-v2.pdf
Figure 2—figure supplement 2
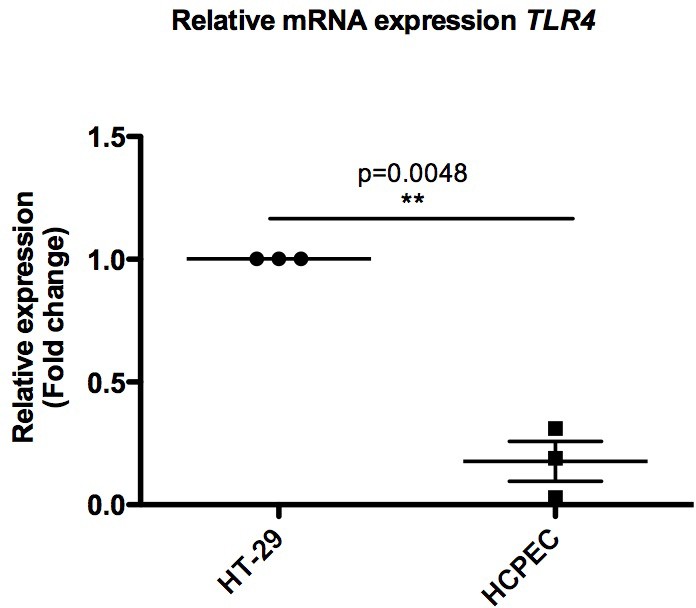
Graph representing relative mRNA expression levels of TLR4 in HCPECs when compared with HT-29 cells.
Log2 fold change in gene expression is presented as mean ± SEM from three biological replicates (n = 3); *p<0.05, **p<0.01, ***p<0.001, paired t-test.
-
Figure 2—figure supplement 2—source data 1
Full membrane scans for western blot images for Figure 2—figure supplement 2A–F.
- https://cdn.elifesciences.org/articles/52511/elife-52511-fig2-figsupp2-data1-v2.pdf
Figure 2—figure supplement 3
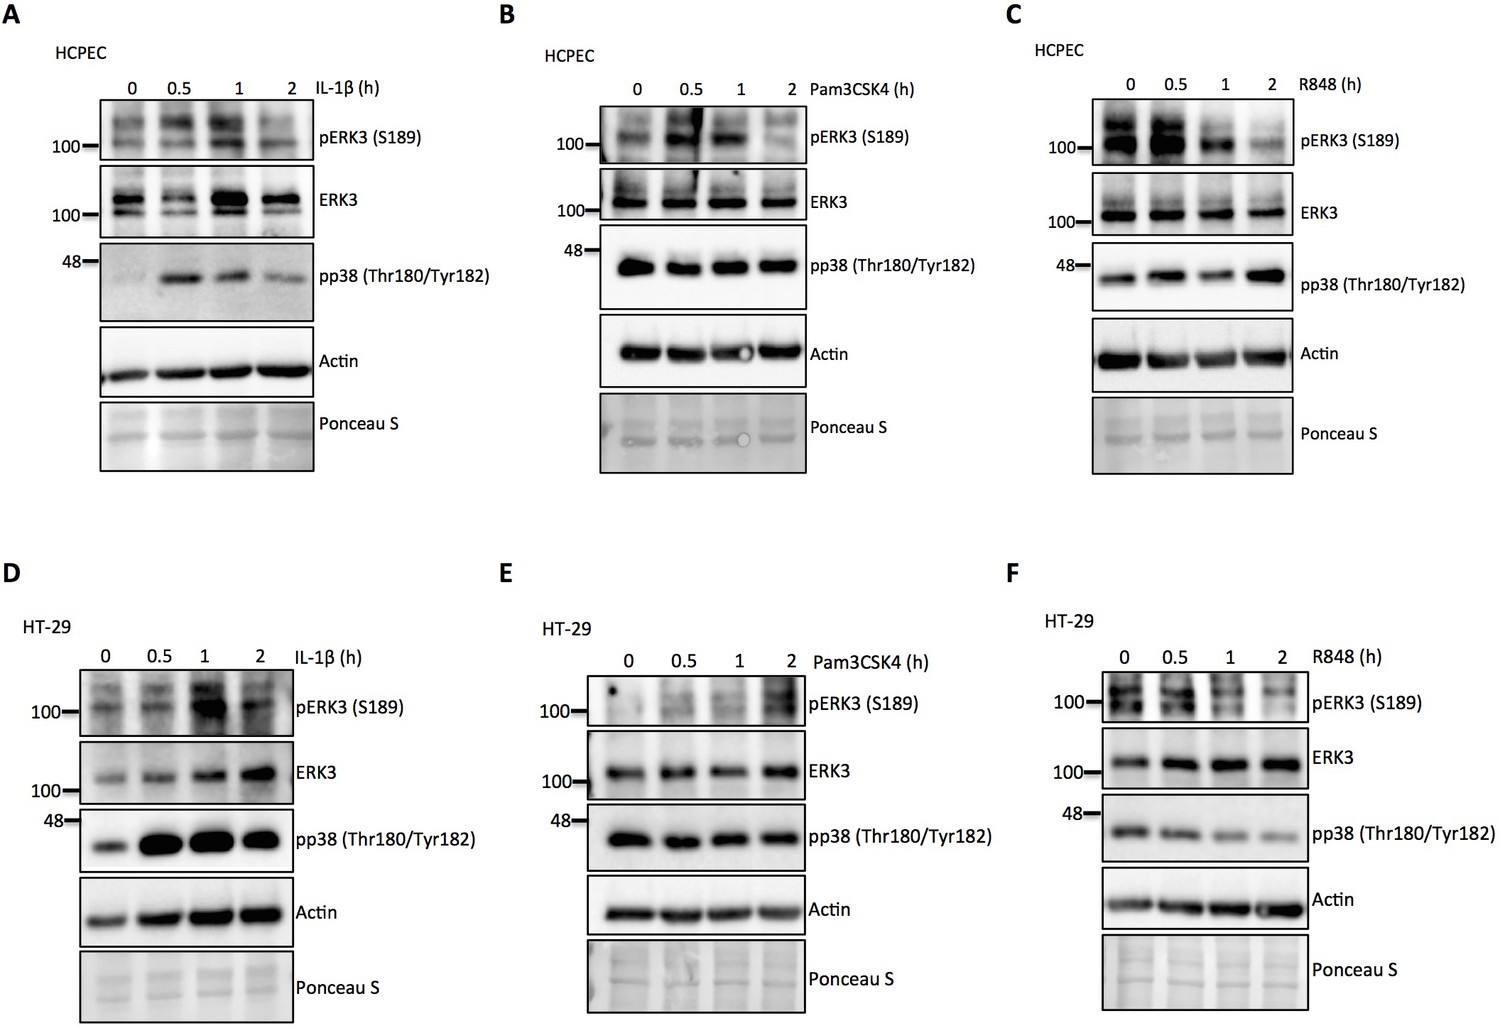
ERK3 kinetics in HCPECs and HT-29 in response to IL-1β, TLR1/2 ligand Pam3CSK4 and TLR7/8 ligand R848.
(A-F) HCPECs and HT-29 cells were stimulated for 0, 0.5, 1 and 2 hr with IL-1β, Pam3CSK4 and R848, cells were lysed for western blot analysis. Representative immunoblots depicting phosphorylation and total protein levels of ERK3 (S189)/ERK3 as well as the phosphorylation of p38 MAPK. Ponceau S staining and actin were used as loading controls.
Figure 3 with 1 supplement

RNA sequencing analysis of control and ERK3 knockdown HCPECs.
HCPECs were transiently transfected with either control siRNA (siCo) or siRNA targeting ERK3 (siERK3). 24 hr post-transfection medium was exchanged and cells were stimulated with LPS. 24 hr later supernatants were harvested for each variant for further secretome analysis and the isolated RNA was directed for RNAseq analysis. (A) Representative western blot analysis of control (siCo) and ERK3-depleted (siERK3) HCPECs under -/+ LPS conditions subjected for RNAseq and secretome analyses. Levels of ERK3 were determined to estimate knockdown efficiency, actin and Ponceau S are provided as loading controls. (B) Heatmap representing differentially expressed (DE) genes. (C) DE genes in resting and LPS stimulated siERK3 cells as compared to siCo cells. (D) Visual representation of DE genes in siERK3 cells when compared with siCo cells. Table represents DE genes downregulated upon ERK3 depletion in unstimulated (-LPS) HCPECs.
-
Figure 3—source data 1
RNA sequencing analysis of control and ERK3 knockdown HCPECs.
Table presents DE genes in resting (t0) and LPS stimulated (t24) siERK3 cells in comparison with the siControl cells, which are represented as a Venn diagram in Figure 3D.
- https://cdn.elifesciences.org/articles/52511/elife-52511-fig3-data1-v2.xlsx
-
Figure 3—source data 2
Secretome analysis of control and ERK3-depleted HCPECs.
Two slides were employed for the analysis as described in the Materials and methods section (L507 and L493). The ratio between siControl and siERK3 was calculated for all the factors and presented in the table.
- https://cdn.elifesciences.org/articles/52511/elife-52511-fig3-data2-v2.xlsx
-
Figure 3—source data 3
Combined transcriptome and secretome analysis of control and ERK3-depleted HCPECs.
Table presents RNAseq derived genes (txm) and secretome derived factors (secretome) and the merged (txm:secretome) factors. Shown in the excel table is a Venn diagram combining the factors identified by transcriptome and secretome.
- https://cdn.elifesciences.org/articles/52511/elife-52511-fig3-data3-v2.xlsx
-
Figure 3—source data 4
Full membrane scans for western blot images for Figure 3A.
- https://cdn.elifesciences.org/articles/52511/elife-52511-fig3-data4-v2.pdf
Figure 3—figure supplement 1
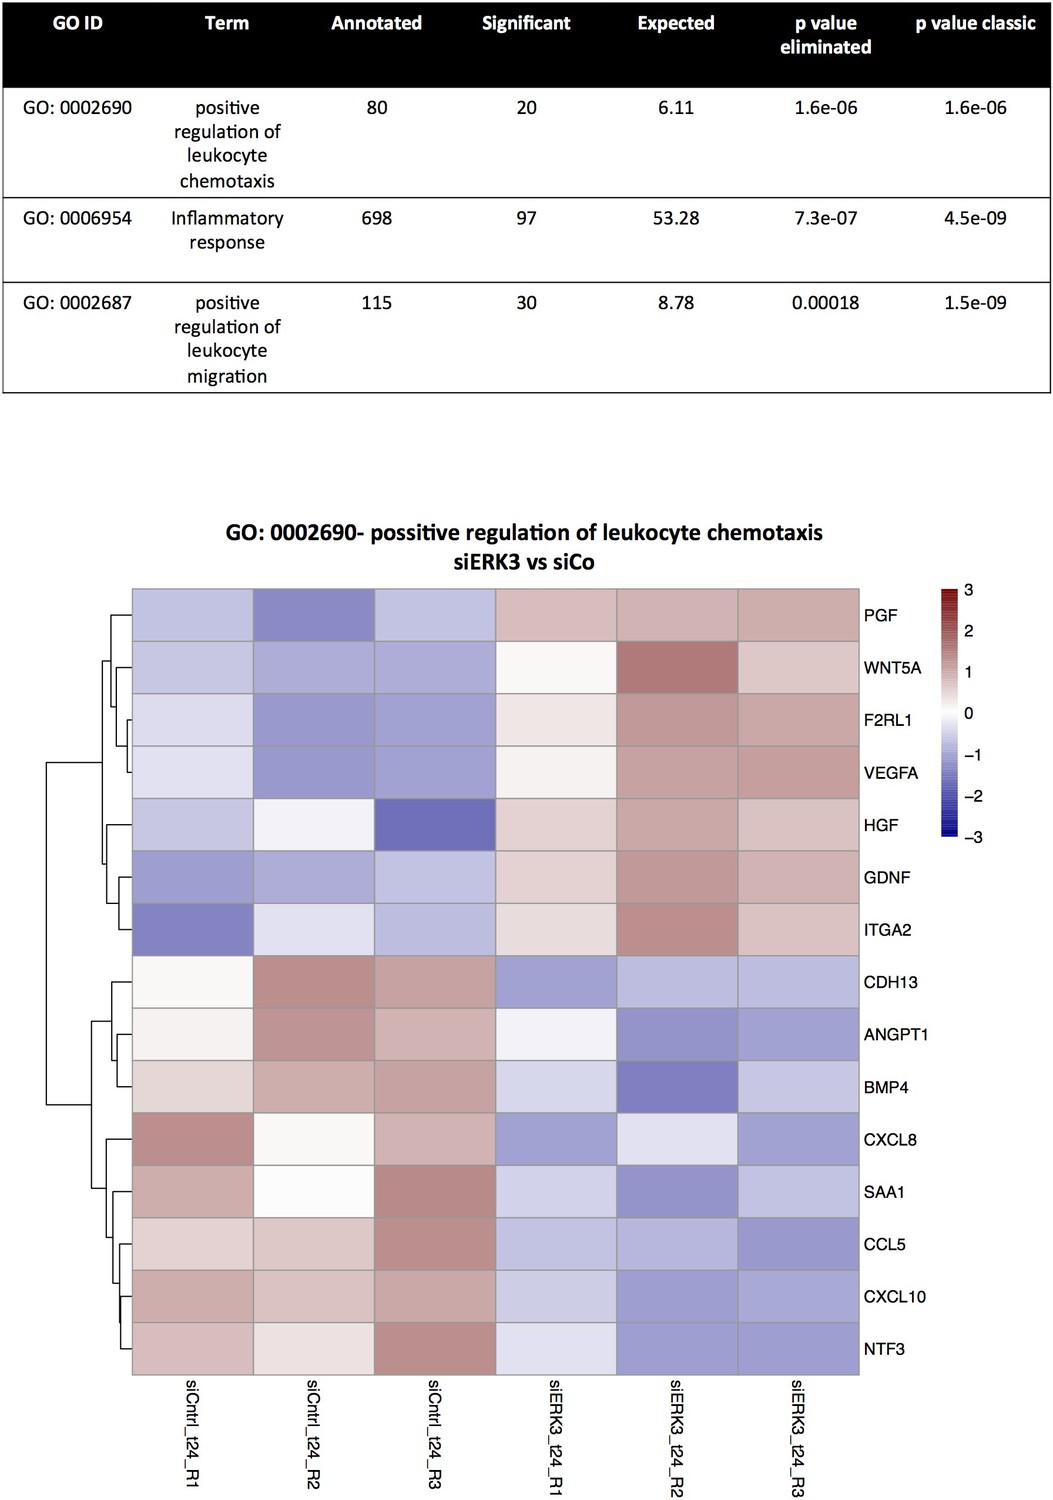
RNAseq analysis: TopGO functional interpretation of the DE genes in siERK3 HCPECs.
Presented here 10 pathways were ranked based on the p value eliminated. Expression heatmap for the genes associated with GO term display the standardized values of the regularized-log transformed counts, after normalizing for library size.
Figure 4 with 5 supplements

ERK3 regulates levels of IL-8 and other chemokines.
(A) Graphs represent RNAseq-derived normalized counts between siControl and siERK3 samples from three biological replicates of unstimulated HCPECs. (B-C) ELISA was performed to determine CXCL8/IL-8 levels in (B) HT-29 and (C) HCPECs in response to LPS. IL-8 concentrations presented as mean ± SEM were obtained from three independent experiments (n = 3); *p<0.05, **p<0.01, ***p<0.001, one way ANOVA, Turkey’s post-test. (D-F) Secretion of CXCL8/IL-8 was measured in supernatants obtained from different cell lines. Each cancer cell line was stably transduced with lentiviral particles carrying either shRNA empty vector control or with shRNA targeting ERK3. HCPECs were transiently transfected with either control siRNA or siRNA targeting ERK3. After 24 hr, medium was exchanged for each cell line for serum and supplements free medium and cells were cultured for 48 hr prior supernatant collection. (D) All cell lines were subjected to western blot analysis and ERK3 knockdown efficiency was estimated. Ponceau S staining and actin/GAPDH loading controls are provided. Depicted western blots are representative for at least three independent experiments (n = 3). (E) IL-8 levels were measured by ELISA. Shown are data representing mean ± SEM concentration in pg/ml from three biological replicates (n = 3); *p<0.05, **p<0.01, ***p<0.001, t-test. (F) Control (shCo) or ERK3 knockdown HT-29 cells (shERK3) presented in D were stimulated with LPS at indicated time points. Supernatants were harvested for each time point and IL-8 levels were measured by ELISA. Data are representing mean concentration in pg/ml ± SEM from three biological replicates per condition (n = 3); *p<0.05, **p<0.01, ***p<0.001, two-way ANOVA, Bonferroni post-tests. (G-H) Control (CRISPR Co) and ERK3 knockout (CRISPR ERK3) HT-29 cells were stimulated with LPS for 0 hr, 3 hr, 6 hr or 24 hr, supernatants were harvested and IL-8 levels were monitored. (G) Cells were analyzed by immunoblotting, levels of ERK3 expression were monitored. Ponceau S staining and actin are included as loading controls. Data are a representative of three biological experiments (n = 3). (H) IL-8 concentrations in pg/ml are presented as mean ± SEM obtained from three independent experiments (n = 3); *p<0.05, **p<0.01, ***p<0.001, two-way ANOVA, Bonferroni post-tests. Additionally, IL-1β- and Pam3CSK4-dependent regulation of IL-8 was tested in control and ERK3-depleted HCPECs and HT-29 cells and data are presented in Figure 4—figure supplement 3. Cross-talk between ERK1/2 and ERK3 is presented in Figure 4—figure supplement 4. (I) Phase-contrast microscopy control (CRISPR Co) and CRISPR ERK3 HGOs from two patients. Organoids were dissociated into single cells and transduced with either CRISPR control (CRISPR Co) or CRISPR ERK3 lentiviral particle-containing supernatants. 4 hr post-infection, cells were seeded in matrigel and 48 hr later 3D cultures were selected with 5 µg/ml of puromycin. Organoids were split and cells were collected for immunoblot analyses. Bright field images of both cultures were taken on day seven after splitting. Scale bar represents 200 µm. (J) Western blot analysis of control (CRISPR Co) and ERK3 knockout (CRISPR ERK3) HGOs. ERK3 expression was monitored to verify knockdown efficiency, actin and Ponceau S staining are provided as loading controls. (K) IL-8 protein secretion was measured in supernatants obtained from control (CRISPR Co) and ERK3 knockout (CRISPR ERK3) HGOs from two patients. Supernatants were harvested from two different 3D organoid cultures after two rounds of puromycin-based selection and after splitting of the organoids. Mean fold change in IL-8 concentrations (pg/ml)± SEM is presented for CRISPR ERK3 supernatants in respect to the control samples (CRISPR Co) obtained from four biological replicates (n = 4); *p<0.05, **p<0.01, ***p<0.001, paired t-test. (L) Relative expression of CXCL8 mRNA was measured at different days of HGOs differentiation. Presented are mean fold changes ± SEM in CXCL8 expression in differentiated organoids normalized in respect to the undifferentiated HGOs from three different cultures of gastric organoids for two patients. Data represent three biological replicates (n = 3), except of day 10 (Diff day 10) where two biological replicates are depicted (n = 2). *p<0.05, **p<0.01, ***p<0.001, one way ANOVA, Turkey’s post-test.
-
Figure 4—source data 1
Full membrane scans for western blot images for Figure 4D, G and J.
- https://cdn.elifesciences.org/articles/52511/elife-52511-fig4-data1-v2.pdf
Figure 4—figure supplement 1
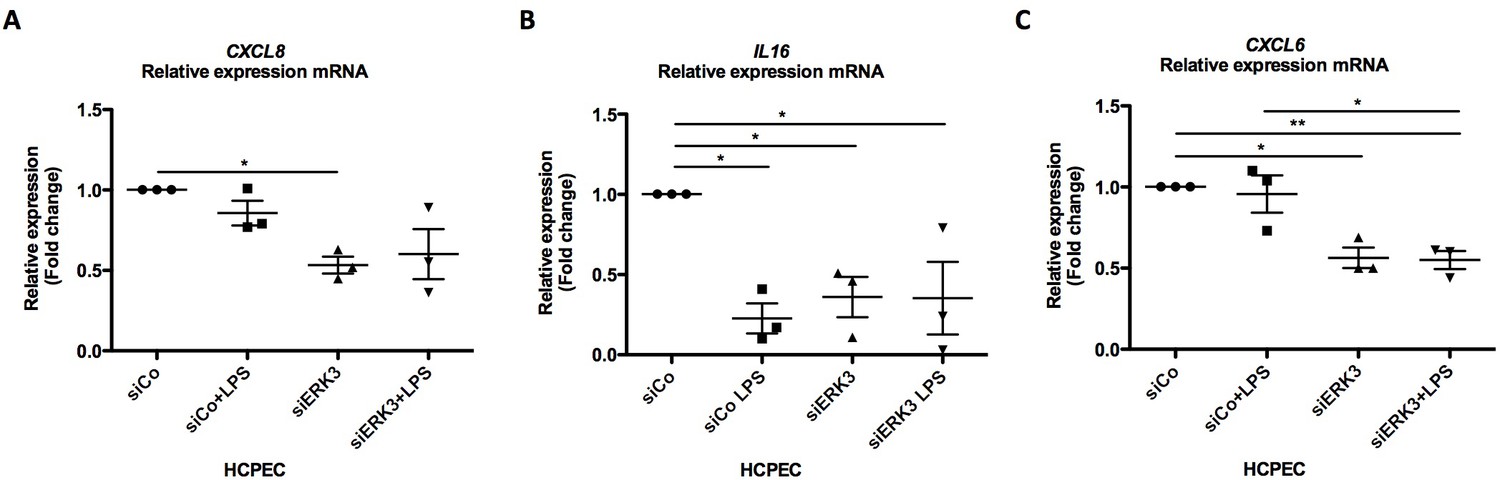
Validation of select chemokines and cytokines by RT-PCR.
(A–C) RT-PCR validation of (A) CXCL8, (B) IL16 and (C) CXCL6 mRNA expression levels in control (siCo) and ERK3-depleted (siERK3) HCPECs.Shown here are mean ± SEM log2 fold changes in untreated and LPS stimulated cells (n = 3); *p<0.05, **p<0.01, ***p<0.001, one way ANOVA, Turkey’s post-test.
Figure 4—figure supplement 2
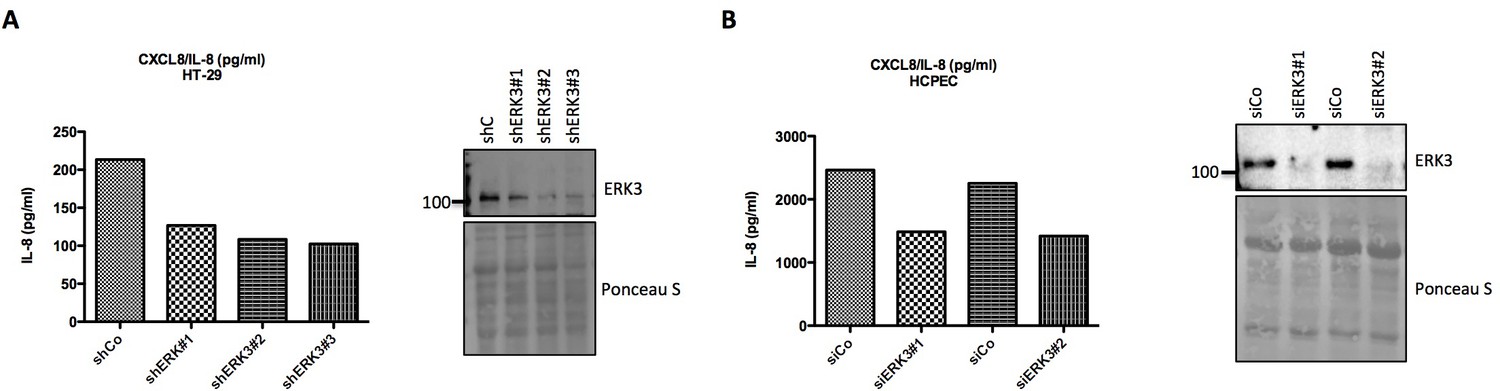
Validation of ERK3-IL-8 connection by different shRNAs and siRNAs.
(A) Targeting ERK3 with different shERK3 constructs leads to the decrease in IL-8 levels. HT-29 cells were stably transduced with three different shRNAs targeting ERK3 (shERK3 #1, shERK3 #2, shERK3 #3) and IL-8 levels were determined by ELISA. SDS-PAGE analysis was performed to determine ERK3 knockdown efficiency, Ponceau S staining was used as a loading control. (B) Targeting ERK3 with two different siRNAs leads to a similar IL-8 phenotype. HCPECs were transiently transfected with either control siRNA (siCo) or with two different siRNAs targeting ERK3 and IL-8 levels were determined by ELISA. Cells were analyzed by western blot and levels of ERK3 were monitored in each sample to verify the knockdown efficiency. Ponceau S staining of the membrane was used as a loading control.
-
Figure 4—figure supplement 2—source data 1
Full membrane scans for western blot images for Figure 4—figure supplement 2A and B.
- https://cdn.elifesciences.org/articles/52511/elife-52511-fig4-figsupp2-data1-v2.pdf
Figure 4—figure supplement 3
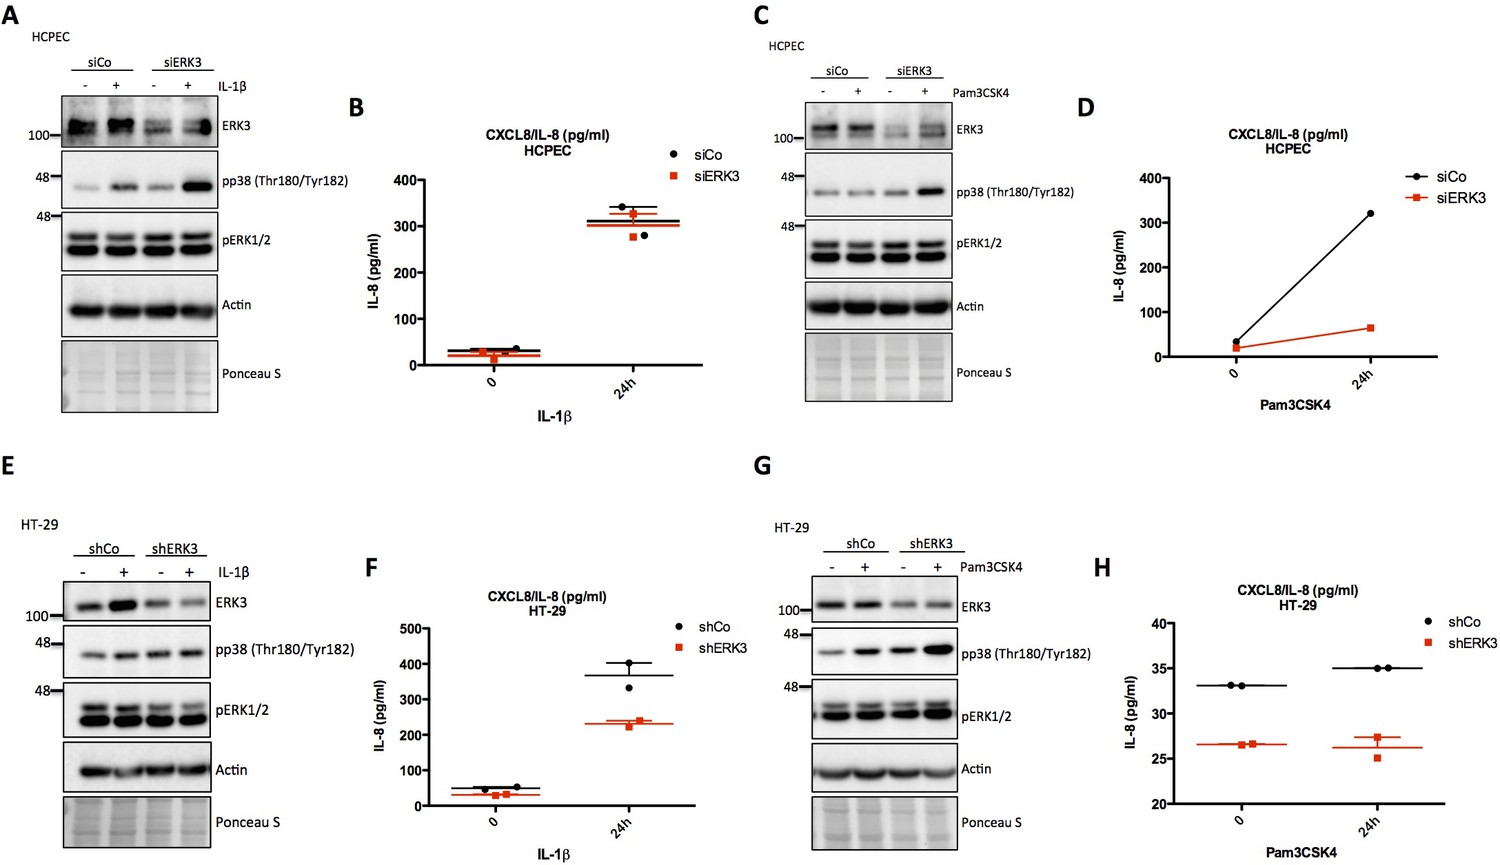
Role of ERK3 in the production of IL-8 stimulated by IL-1β and Pam3CSK4.
(A–D) HCPECs were transfected with siRNA targeting ERK3 (siERK3) or control (siCo), 24 hr post-transfection, medium was exchanged for MEM without supplements and cells were stimulated with IL-1β or Pam3CSK4 for 24 hr. Supernatants were collected for IL-8 ELISA analysis and cells were subjected to immunoblotting. Levels of IL-8 are presented as mean concentration in pg/ml ± SEM from two biological replicates (n = 2). Knockdown efficiency was determined using ERK3 antibody and phosphorylation status of p38 and ERK1/2 was monitored. Actin and Ponceau S staining were used as loading controls. (E-H) Control (shCo) and ERK3-depleted (shERK3) HT-29 cells were seeded in 12-well plate. After cells reached 70–80% confluency, medium was exchanged for McCoy’s without serum and cells were stimulated with IL-1β or Pam3CSK4 for 24 hr. Supernatants were collected for IL-8 ELISA analysis and cells were subjected to western blot analysis. IL-8 concentration in pg/ml is presented as mean ± SEM of two biological replicates (n = 2). Expression levels of ERK3 were verified to determine knockdown efficiency and phosphorylation of p38 and ERK1/2 was monitored. Actin and Ponceau S staining are provided as loading controls.
-
Figure 4—figure supplement 3—source data 1
Full membrane scans for western blot images for Figure 4—figure supplement 3A, C, E and G.
- https://cdn.elifesciences.org/articles/52511/elife-52511-fig4-figsupp3-data1-v2.pdf
Figure 4—figure supplement 4
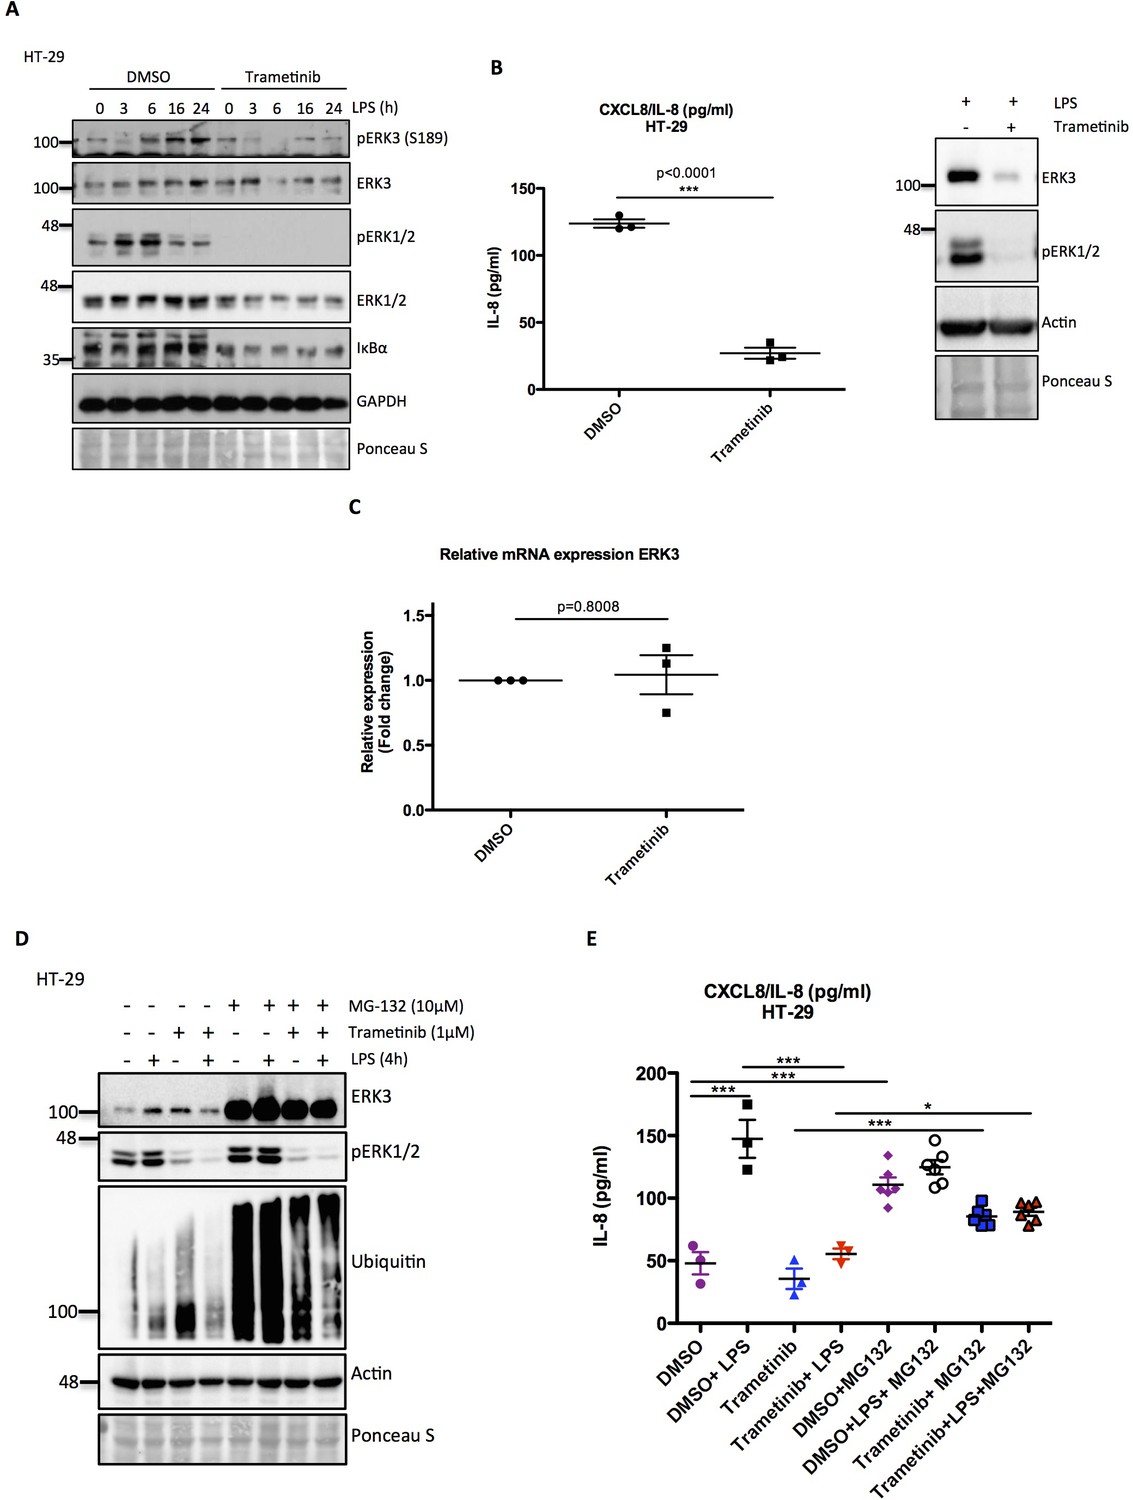
Trametinib treatment leads to a decrease in IL-8 secretion and ERK3 protein expression.
(A) Western blot analysis of ERK3, ERK1/2 and IκBα proteins. GAPDH and Ponceau S staining were used as loading controls. (B) IL-8 levels measured in control (DMSO) and trametinib treated HT-29 cells. After 1 hr pre-treatment with DMSO/inhibitor cells were stimulated with LPS overnight to induce IL-8 production. Results are depicted as mean concentrations (pg/ml)± SEM from three biological replicates (n = 3) per condition; *p<0.05, **p<0.01, ***p<0.001, t-test. Additionally, western blot analysis of one of the replicates used for ELISA is presented, depicting levels of ERK3 protein and phosphorylation of ERK1/2 as a readout for the inhibitor treatment. Ponceau S was used as a loading control. (C) Log2 fold change in gene expression of ERK3 upon trametinib treatment is presented in HT-29 cells as mean ± SEM from three biological replicates (n = 3); *p<0.05, **p<0,01, ***p<0.001, paired t-test. (D-E) MG-132 treatment rescues ERK3 and IL-8 levels decreased by trametinib treatment. HT-29 cells were pre-treated with MG-132 for 6 hr prior to 1 hr incubation with DMSO/trametinib. Further, cells were stimulated with LPS for 4 hr. (D) Western blot analysis presenting levels of ERK3 and phosphorylation of ERK1/2 to determine trametinib efficiency; membrane was probed for ubiquitin to determine MG-132 treatment efficiency. Actin and Ponceau S staining are shown as loading controls. (E) IL-8 protein levels quantified by ELISA. Results represent mean ± SEM concentration in pg/ml obtained from at least three biological replicates per condition; *p<0.05, **p<0.01, ***<0.001, one-way ANOVA, Turkey’s post-test.
-
Figure 4—figure supplement 4—source data 1
Full membrane scans for western blot images for Figure 4—figure supplement 4A, B and D.
- https://cdn.elifesciences.org/articles/52511/elife-52511-fig4-figsupp4-data1-v2.pdf
Figure 4—figure supplement 5
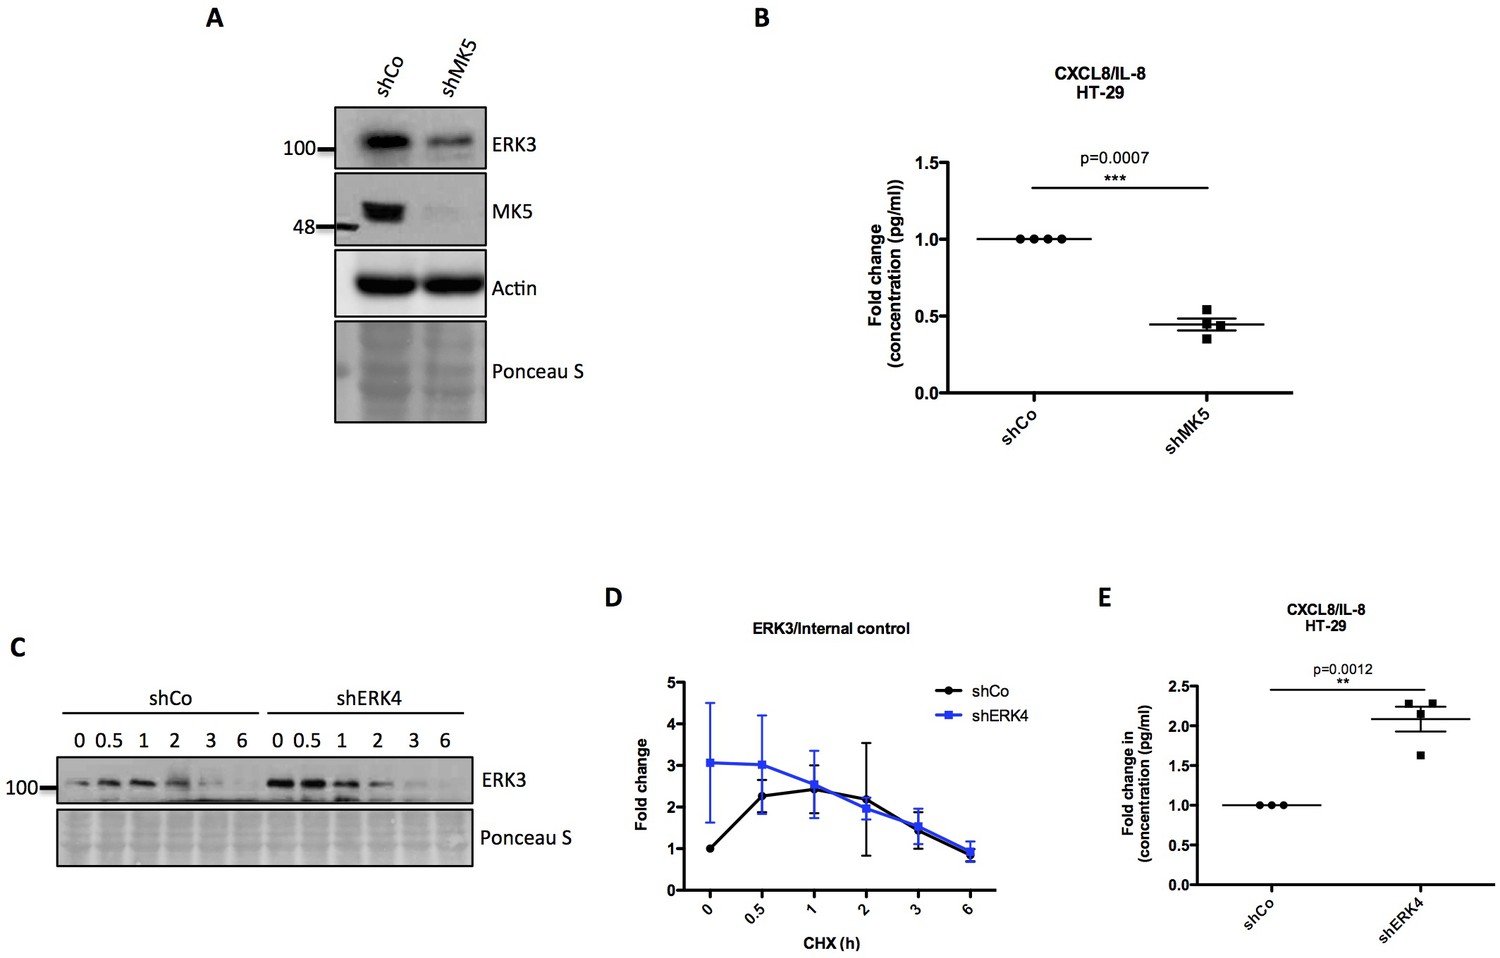
Role of MK5 and ERK4 in the regulation of ERK3 and IL-8.
(A) MK5 depletion leads to a downregulation of ERK3 expression, resulting in LPS independent decrease of IL-8 levels. Representative western blot analysis of control (shCo) and MK5 knockdown (shMK5) HT-29 cells. Levels of ERK3 are presented, actin and Ponceau S staining were used as an internal loading control. (B) ELISA measurement of IL-8 concentration in pg/ml is represented as mean ± SEM obtained from four independent experiments (n = 4); *p<0.05, **p<0.01, ***p<0.001, t-test. (C) ERK4 depletion leads to an upregulation of ERK3 protein expression, mediating higher IL-8 levels. Representative western blot analysis of HT-29 control (shCo) and ERK4 knockdown cells treated with CHX for 0, 0.5, 1, 2, 3 or 6 hr. ERK3 and ERK4 protein levels were monitored and Ponceau S staining was used as a loading control. (D) Fold change in ERK3 protein levels in respect to the loading control is presented as mean ± SEM from four independent experiments (n = 4); *p<0.05, **p<0.01, ***p<0.001, paired t-test. (E) IL-8 ELISA of shCo and shERK4 stably transduced HT-29 cells. Results are presented as mean ± SEM fold change for four biological replicates of shERK4 (n = 4) normalized to the concentration (pg/ml) measured for shCo samples (n = 3); *p<0.05, **p<0.01, ***p<0.001, paired t-test.
-
Figure 4—figure supplement 5—source data 1
Full membrane scans for western blot images for Figure 4—figure supplement 5A and C.
- https://cdn.elifesciences.org/articles/52511/elife-52511-fig4-figsupp5-data1-v2.pdf
Figure 5 with 1 supplement
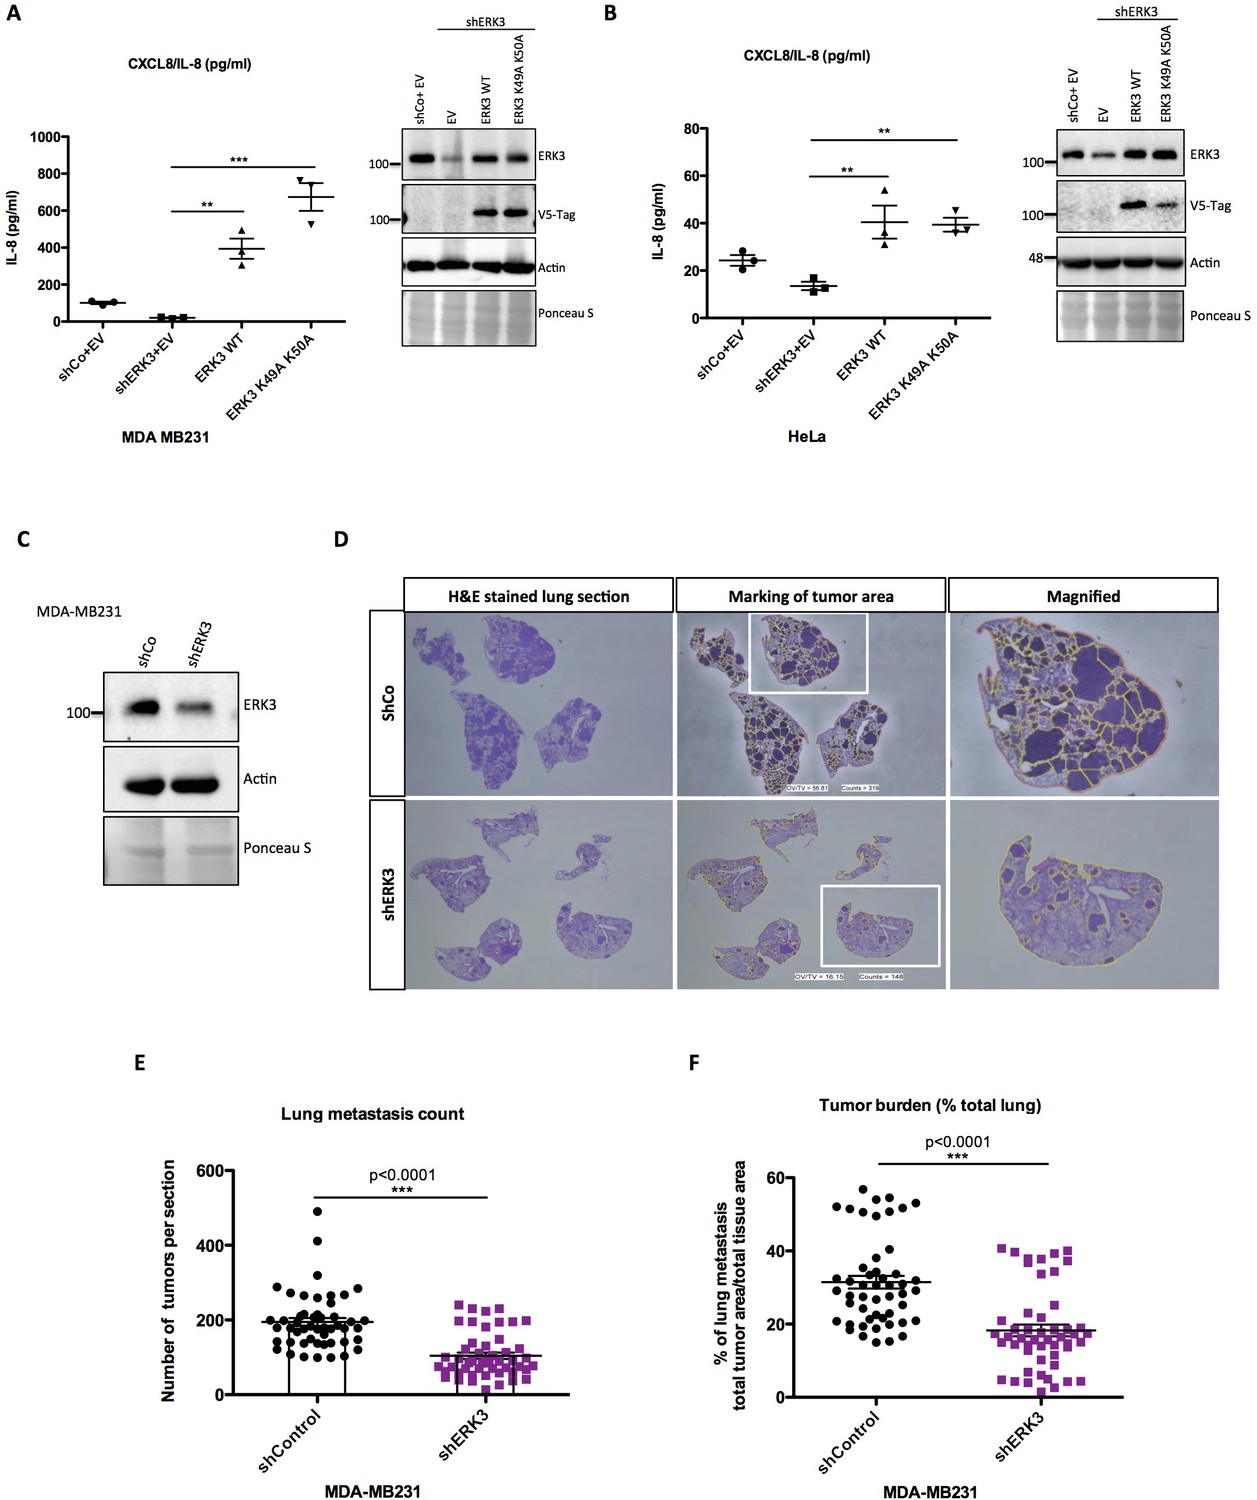
ERK3 regulates levels of IL-8 in a kinase-independent manner and promotes lung metastasis of MDA-MB231 breast cancer cells.
(A–B) ERK3 regulates IL-8 production in a kinase-independent manner. (A) MDA-MB231 ERK3 knockdown (shERK3) cells were reconstituted with wild type (ERK3 WT), ERK3 kinase dead mutant (ERK3 K49A K50A) or with an empty vector control (EV). IL-8 levels were determined in obtained supernatants by ELISA. IL-8 concentrations are presented as mean ± SEM in pg/ml from three biological replicates (n = 3); *p<0.05, **p<0.01, ***p<0.001, one-way ANOVA, Turkey’s post-test. Immunoblot analysis was performed and levels of ERK3 protein were monitored to determine ERK3 knockdown efficiency and the expression of exogenously expressed constructs (V5-Tag expression). Actin and Ponceau S staining were used as loading controls. (B) HeLa control and ERK3-depleted cells were transiently transfected with wild type ERK3, kinase dead mutant K49A K50A and empty vector control. IL-8 levels were measured as described previously and are represented as mean ± SEM concentrations from three biological replicates (n = 3); *p<0.05, **p<0.01, ***p<0.001, one-way ANOVA, Turkey’s post-test. Knockdown and overexpression efficiency were verified by immunoblot analysis. Actin and Ponceau S staining were used as loading controls. (C-D) ERK3 knockdown leads to a decrease in lung metastasis of MDA-MB231 breast cancer cells. Tail-vein injection of control (shCo) or ERK3-depleted (shERK3) MDA-MB231 cells was performed (n = 5). (C) Western blot analysis of MDA-MB231 cells stably transfected with either shRNA targeting ERK3 (shERK3) or control shRNA (shCo). Levels of ERK3 were determined to estimate knockdown efficiency, actin and Ponceau S are provided as loading controls. (D) Representative images of H and E stained lungs sections photographed with Nikon D90 digital camera (H and E stained lung section), marking of the tumor areas performed in ImageJ (marking of the tumor area), boxed areas were magnified and are shown on the right (magnified). (E-F) ImageJ quantification was performed using color deconvolution of five sections per lung, representing: (E) the exact numbers of lung tumors per each analyzed section. (F) Pulmonary metastatic burden expressed as percentage of the tumor in evaluated lung tissue (total tumor area/total tissue area); *p<0.05, **p<0.01, ***p<0.001, t-test. Please find Figure 5—figure supplement 1 for graphs representing mean ± SEM per each mouse (n = 5), for both, tumor lesions number and tumor burden.
-
Figure 5—source data 1
Full membrane scans for western blot images for Figure 5A–C.
- https://cdn.elifesciences.org/articles/52511/elife-52511-fig5-data1-v2.pdf
Figure 5—figure supplement 1
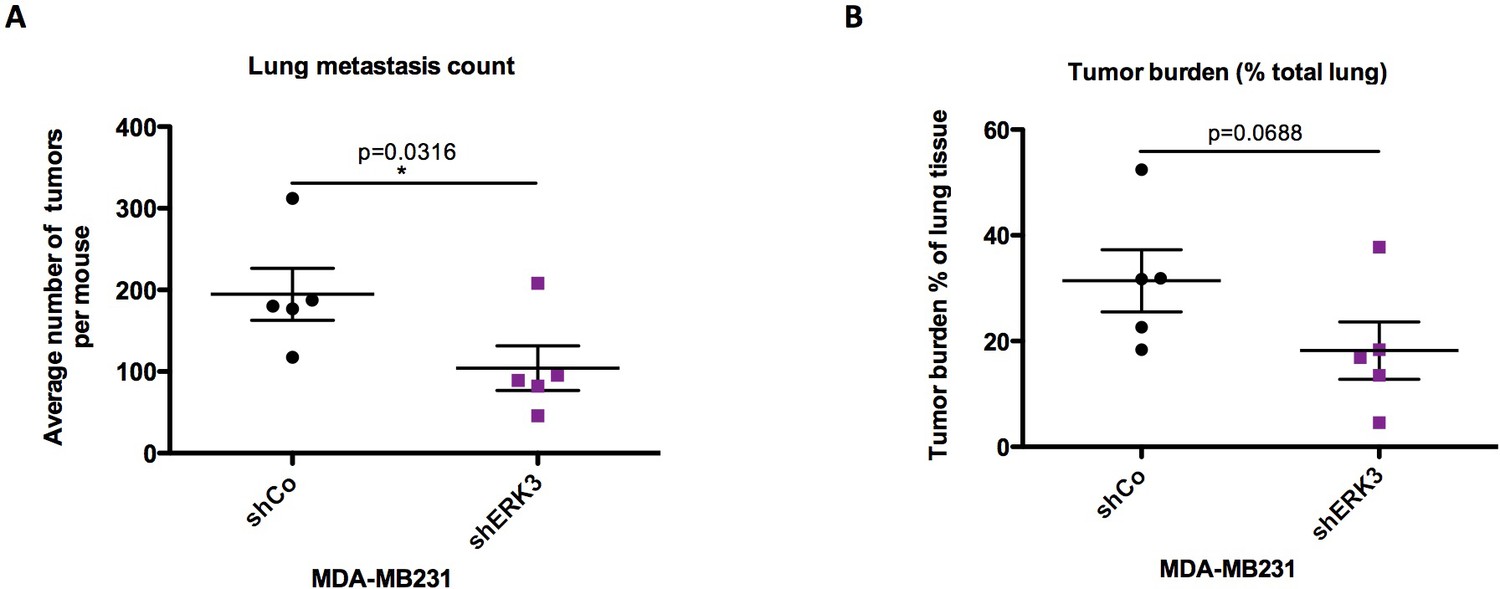
ImageJ quantification of tumor lesions using color deconvolution.
(A) Mean ± SEM number of lung tumors is presented per analyzed mouse. (B) Pulmonary metastatic burden expressed as percentage of the tumor (total tumor area/total tissue area). Mean ± SEM values are depicted for each mouse; *p<0.05, **p<0.01, ***p<0.001, t-test.
Figure 6 with 3 supplements
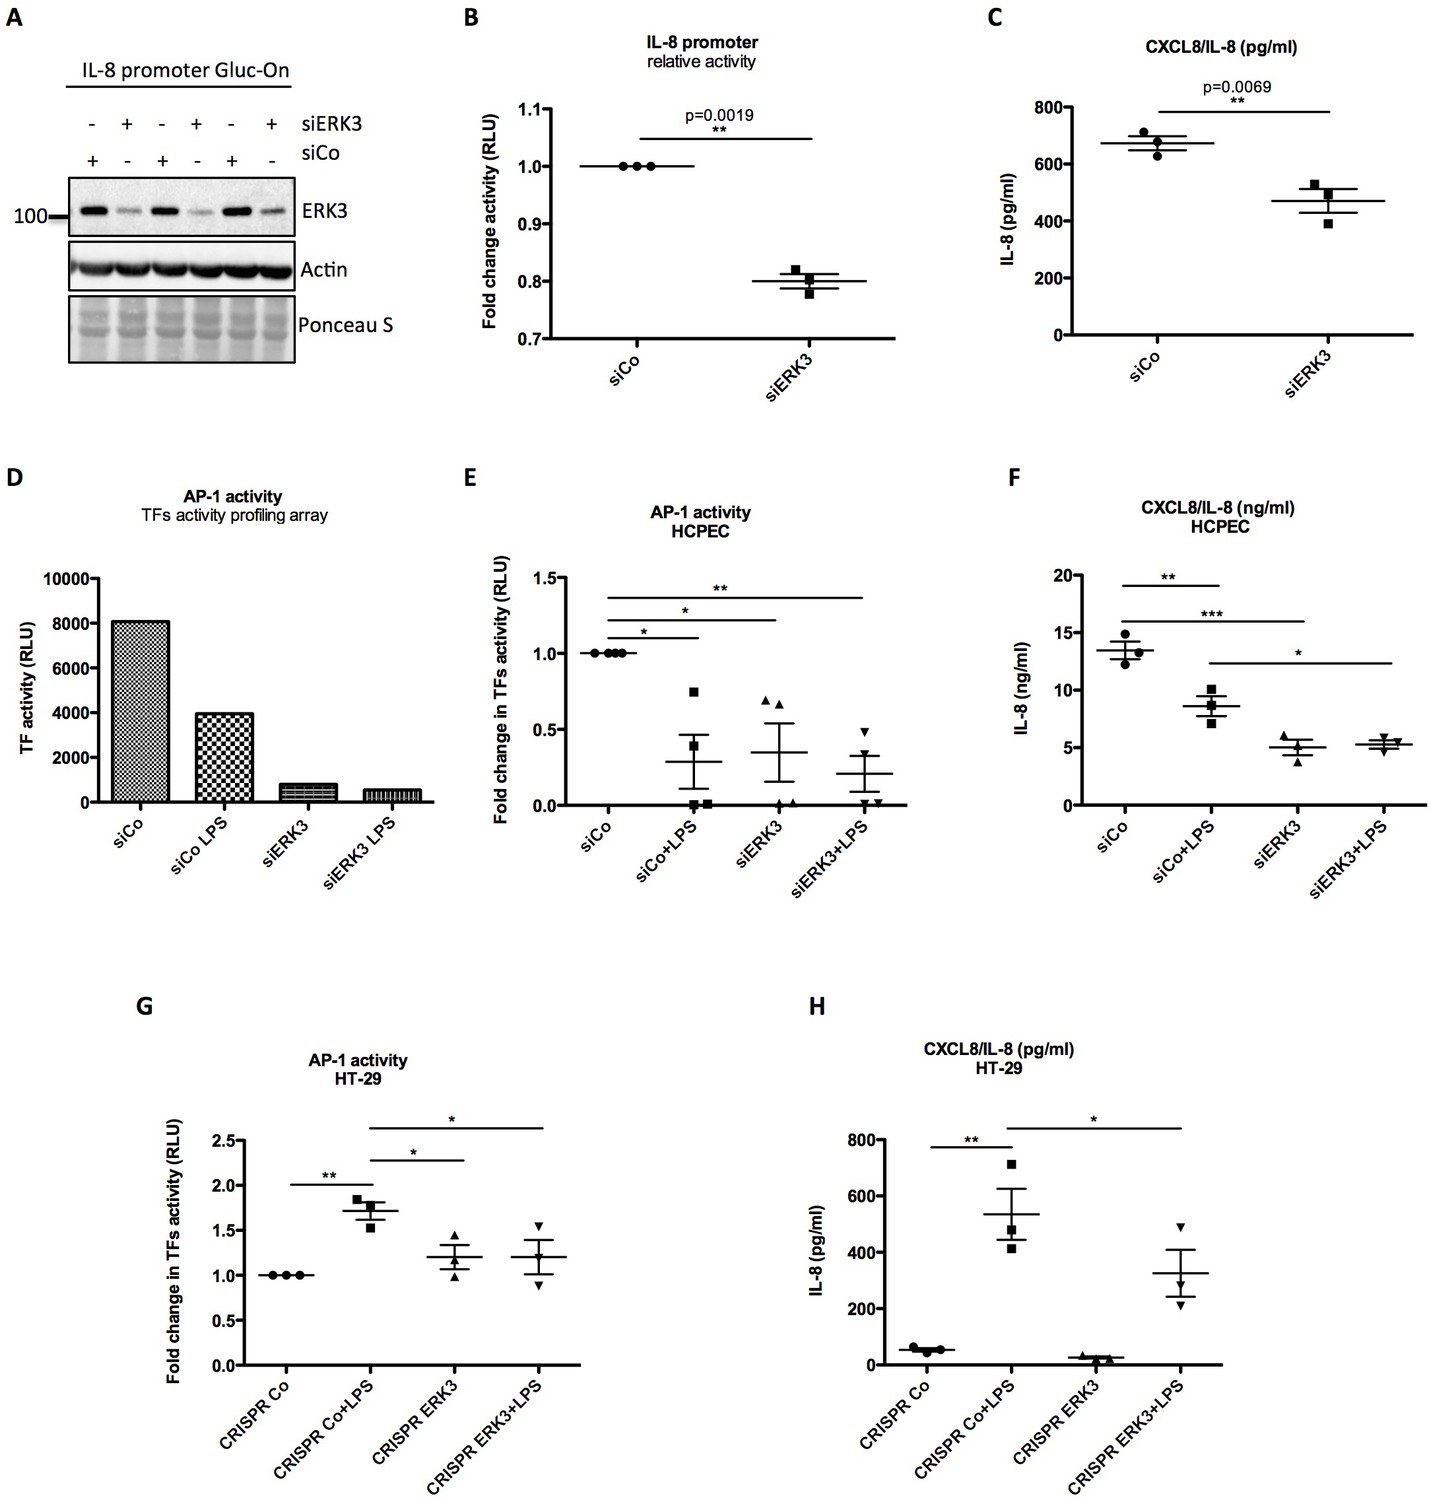
ERK3 positively regulates activity of IL-8 promoter and DNA binding activity of AP-1.
(A–C) IL-8 promoter activity is decreased in ERK3-depleted cells. MDA-MB231 cells were stably transfected with CXCL8 Gaussia Luciferase construct (Gluc-On Promoter Reporter Clones). Cells were further transfected with siRNA targeting ERK3 (siERK3) or control siRNA (siCo). 24 hr post-transfection, medium was exchanged for DMEM-FBS, cells were cultured for additional 24 hr and supernatants were harvested. (A) Cells were subjected to SDS-PAGE analysis. Knockdown efficiency of ERK3 was monitored. Actin and Ponceau S staining were performed as loading controls. (B) Luciferase activity was monitored and shown here is mean ± SEM fold change in RLU of siERK3 samples normalized to the siCo (n = 3); *p<0.05, **p<0.01, ***p<0.001, paired t-test. (C) IL-8 levels were measured by ELISA and mean ± SEM concentrations in pg/ml are presented from three biological replicates (n = 3); *p<0.05, **p<0.01, ***p<0.001, t-test. (D) TFs activity profiling assay. HCPECs were transfected with either a negative control siRNA (siCo) or siRNA targeting ERK3. 24 hr post-transfection medium was changed for MEM minus FBS and other supplements and cells were stimulated with LPS for 24 hr. After stimulation, cell culture supernatants were harvested from each dish and part of the cells was lysed in RIPA buffer for further western blot analysis and knockdown verification presented in Figure 6—figure supplement 3B. The remaining cells were subjected to nuclear extraction and further TFs activation plate profiling (Figure 6—figure supplement 1 and Figure 6—source data 1). Graph presented in (D) depicts transcriptional activity of AP-1 as fold change in RLU measured by TFs activity profiling array as mentioned in the Materials and methods section. (E) Graphical representation of AP-1 activity measured with filter plate assay according to the manufacturer’s instructions. 24 hr post-transfection, control (siCo) and ERK3 knockdown (siERK3) HCPECs were stimulated with LPS for 24 hr in medium without any supplements. Afterwards, cells were subjected to either western blot analysis or nuclear extraction and filter plate assay analysis. Results are represented as mean fold change in activity measured in RLU ± SEM from four independent experiments (n = 4); *p<0.05, **p<0.01, ***p<0.001, one-way ANOVA, Turkey’s post-test. (F) ELISA of IL-8 levels measured in control and LPS stimulated siCo/siERK3 HCPECs. Results are depicted as mean concentration (pg/ml)± SEM from three biological replicates (n = 3) per condition; *p<0.05, **p<0.01, ***p<0.001, one-way ANOVA, Turkey’s post-test. Activity of two other TFs involved in the regulation of IL-8 was assessed in control and ERK3-depleted HCPECs and graphs are presented in Figure 6—figure supplement 2. (G-H) LPS-induced AP-1 activity in HT-29 cells is impaired by ERK3 knockout (CRISPR ERK3) which leads to a decrease in IL-8 levels (G) Graph represents AP-1 binding activity analysis by filter plate assay in control (CRISPR Co) and ERK3 knockout (CRISPR ERK3) cells in the presence and absence of LPS. Data are presented as mean fold change in RLU ± SEM from three independent experiments (n = 3); *p<0.05, **p<0.01, ***p<0.001, one-way ANOVA, Turkey’s post-test. (H) IL-8 concentration in pg/ml is presented as mean ± SEM obtained from three independent experiments (n = 3); *p<0.05, **p<0.01, ***p<0.001, one-way ANOVA, Turkey’s post-test.
-
Figure 6—source data 1
Full membrane scans for western blot images for Figure 6A.
- https://cdn.elifesciences.org/articles/52511/elife-52511-fig6-data1-v2.xlsx
-
Figure 6—source data 2
Transcription factors (TFs) activity profiling array.
Table represents activity of TF analyzed in control and ERK3-depleted HCPECs.
- https://cdn.elifesciences.org/articles/52511/elife-52511-fig6-data2-v2.pdf
Figure 6—figure supplement 1
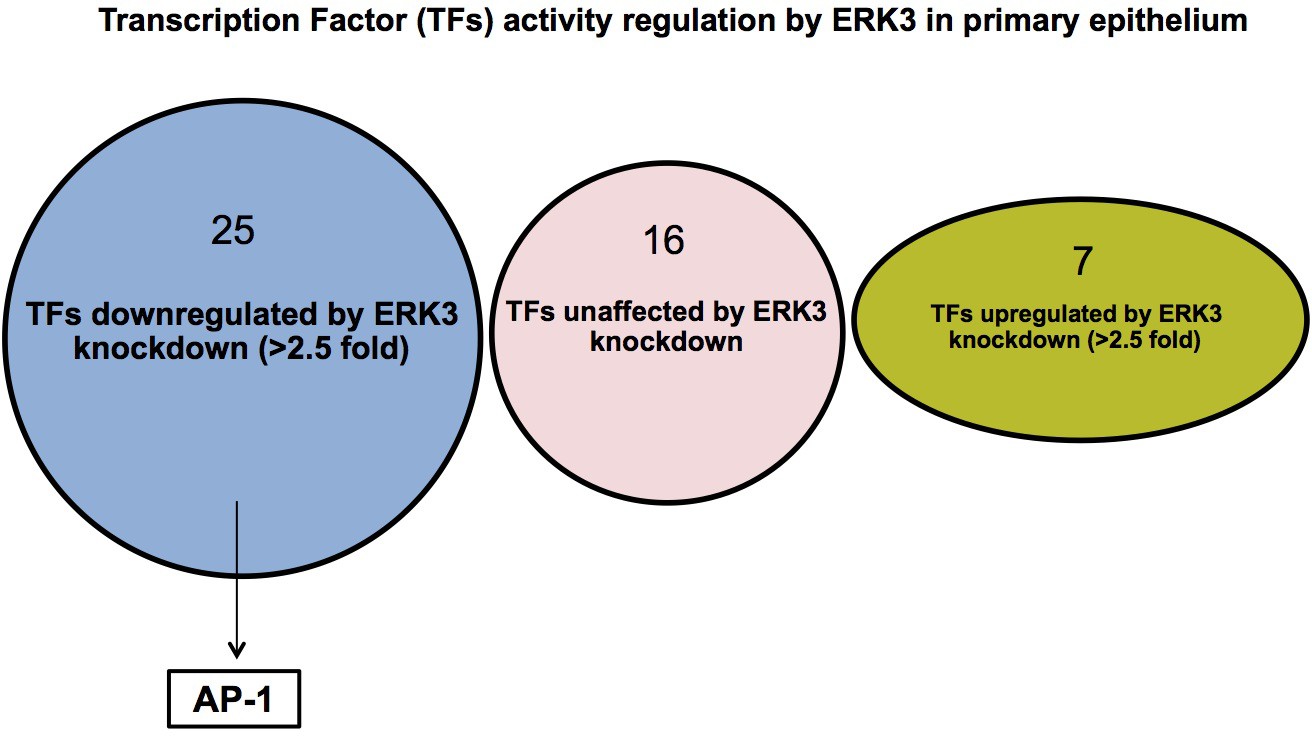
TFs activity profiling array.
(A) Activity of 48 TFs was measured in control (siCo) and ERK3-depleted (siERK3) HCPECs as mentioned in the Materials and methods section and in the legend for Figure 6D, assessing Relative Luminescence Units (RLU). Ratios of TFs activity in siERK3 in respect to siCo cells were calculated and TFs were grouped into up- (>2.5) or downregulated (<2.5) upon ERK3 knockdown based on the fold change.
Figure 6—figure supplement 2
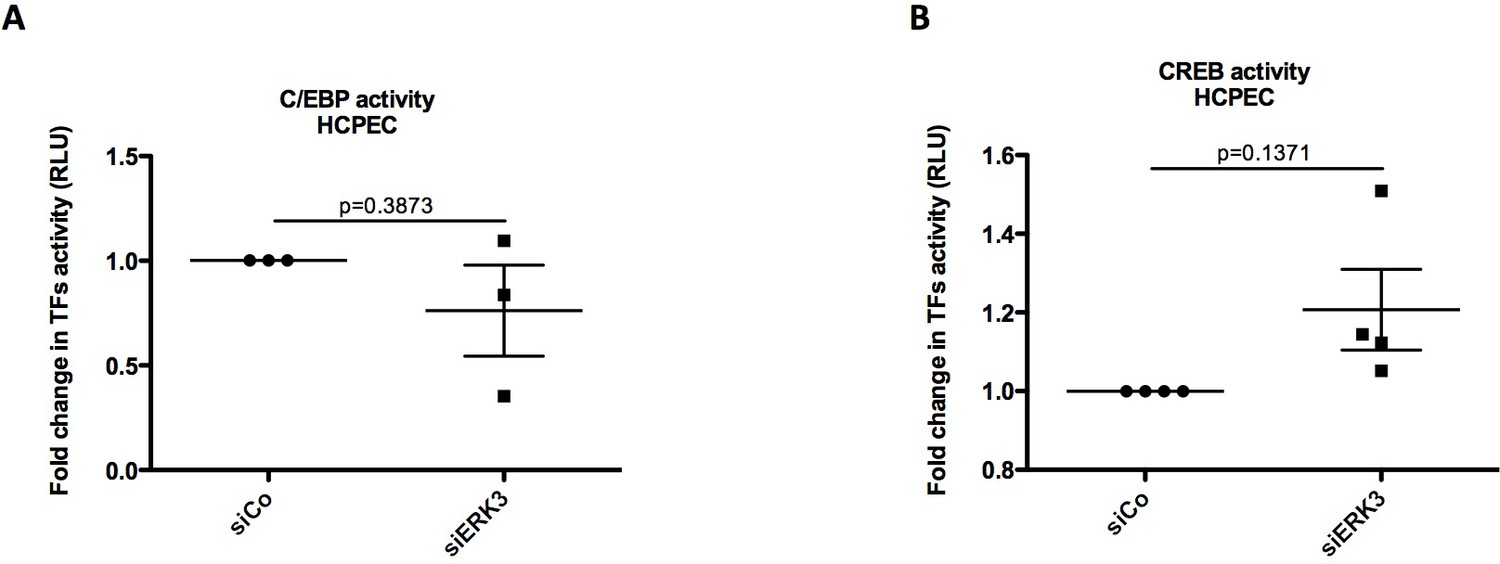
Graphical representation of (A) C/EBP and (B) CREB activity measured in control (siCo) and ERK3-depleted (siERK3) HCPECs with filter plate assay according to the manufacturer’s instructions.
Results are represented as mean fold change in activity measured in RLU ± SEM from three/four independent experiments (n = 3/n = 4); *p<0.05, **p<0.01, ***p<0.001, paired t-test.
Figure 6—figure supplement 3
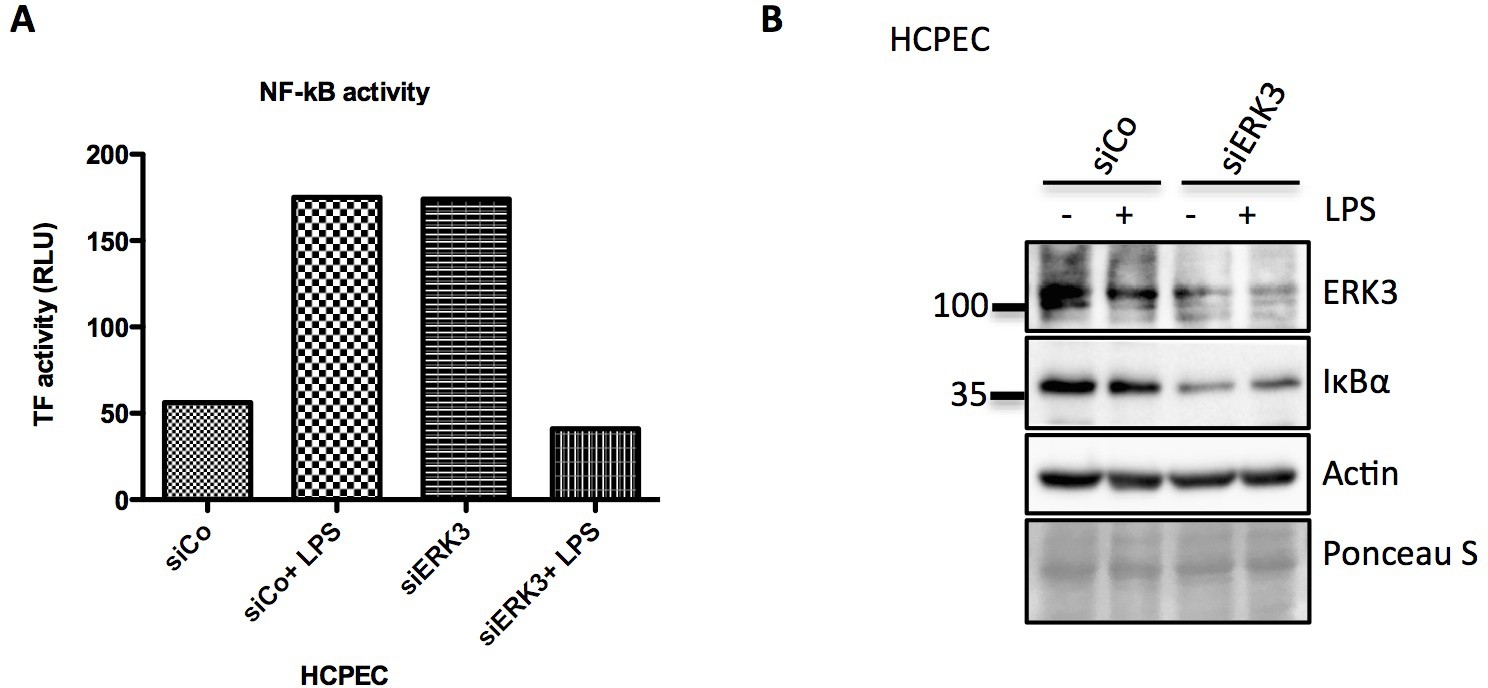
Activation of NFkB in control and ERK3 knock down cells upon LPS stimulation.
(A) Graph representing transcriptional activity of NF-κB measured by TFs activity profiling array, depicted are RLU from one replicate. (B) Immunoblot analysis of control (siCo) and ERK3-depleted HCPECs (siERK3) subjected to TFs profiling. ERK3 knockdown validation and IκBα degradation rate are presented. Actin and Ponceau S staining were used as loading controls.
-
Figure 6—figure supplement 3—source data 1
Full membrane scans for western blot images for Figure 6—figure supplement 3B.
- https://cdn.elifesciences.org/articles/52511/elife-52511-fig6-figsupp3-data1-v2.pdf
Figure 7 with 1 supplement
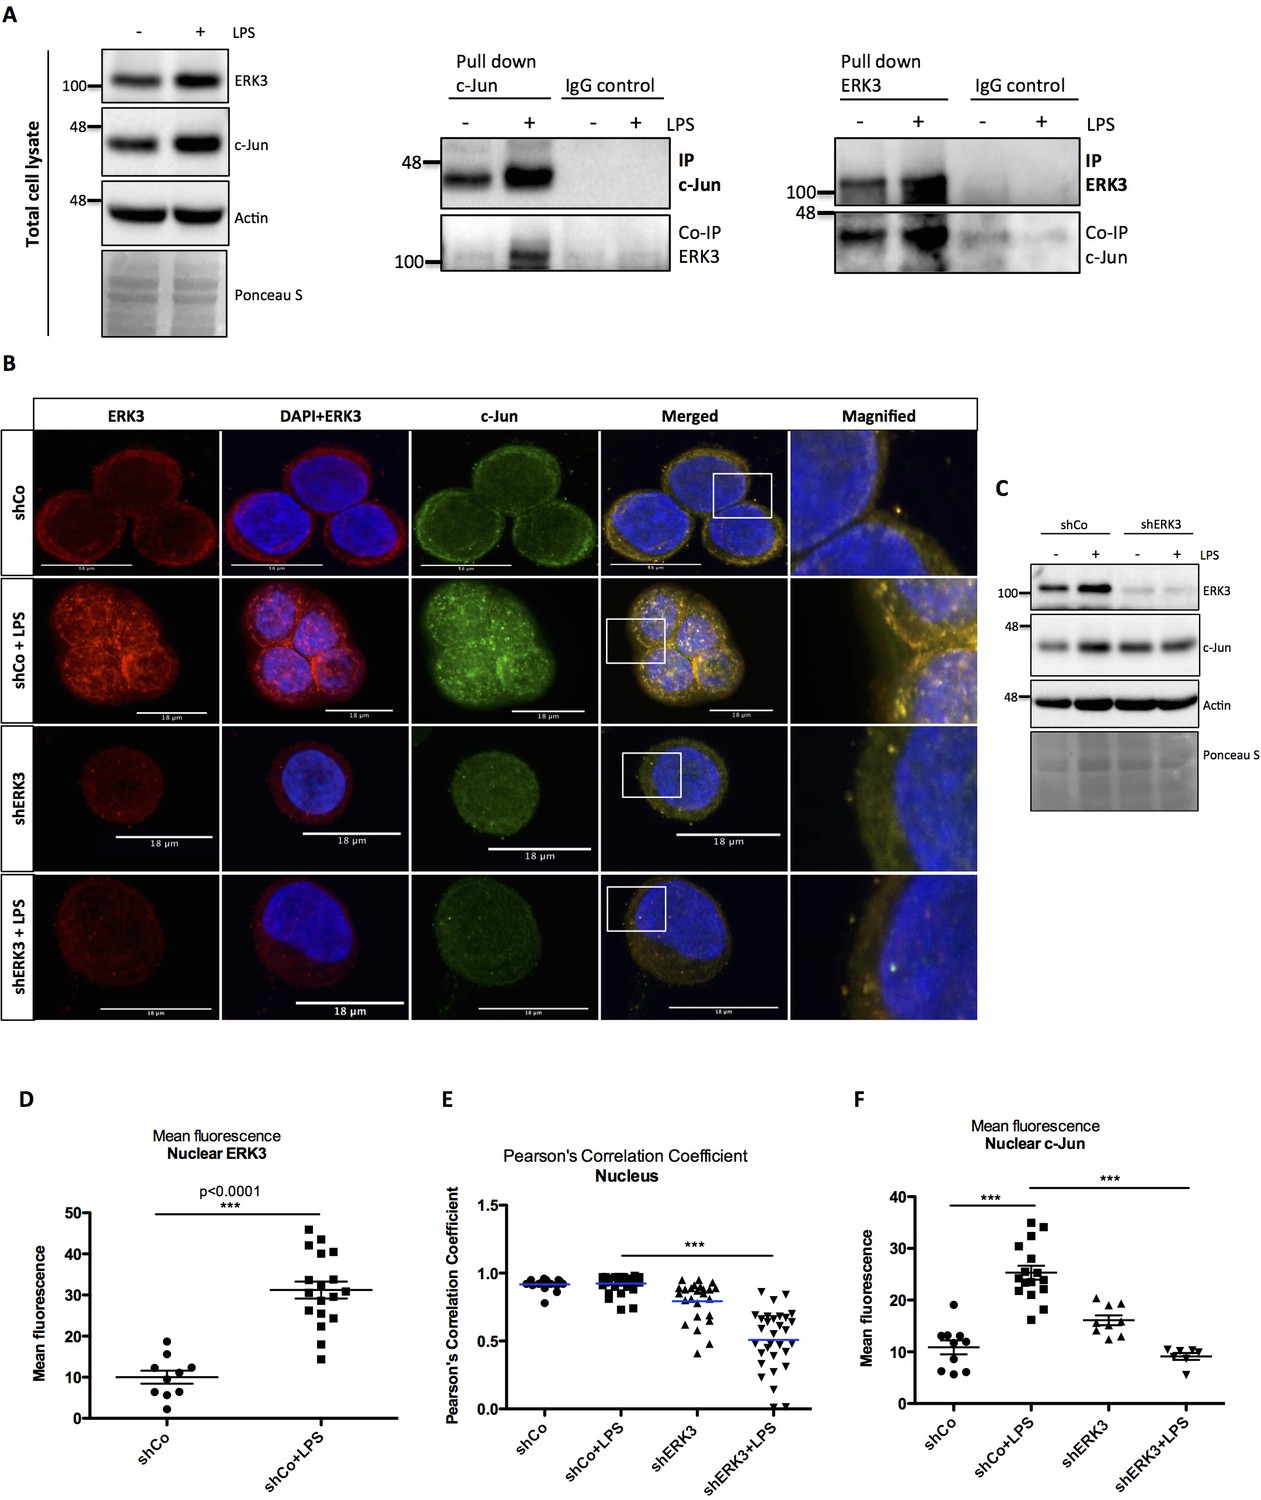
ERK3 interacts with c-Jun and regulates its nuclear abundance.
(A) Co-immunoprecipitation (IP) of ERK3 and c-Jun in unstimulated and LPS stimulated HT-29 cells using a c-Jun or ERK3 antibody. Levels of c-Jun and ERK3 were monitored. IgG isotype control for IP and co-IP was included. Actin and Ponceau S staining were used as loading controls for total cell lysate western blot analysis. (B) Confocal analysis of IF staining of control (shCo) and ERK3 knockdown (shERK3) HT-29 cells cultured in the presence and absence of LPS. Cells were stained with c-Jun primary antibody followed by rabbit Alexa488 (green), with ERK3 antibody followed by Cy3 mouse secondary (red) and Hoechst for the nuclei. Scale bars 18 µm. Boxed areas in merged images were magnified and are presented on the right. (C) Western blot analysis of control (shCo) and ERK3-depleted (shERK3) HT-29 cells subjected to IF staining presented in C. Levels of ERK3 and c-Jun are depicted in the control and LPS stimulated cells as well as actin loading control and Ponceau S staining. (D) ImageJ quantification of the fluorescence intensities was performed as described in the Materials and methods section. Graph represents mean red (ERK3) fluorescence intensities in control (shCo) and LPS stimulated (shCo+LPS) HT-29 cells; *p<0.05, **p<0.01, ***p<0.001, one-way ANOVA, Turkey’s post-test. (E) Pearson’s correlation coefficient values obtained from co-localization analyses as described in the Materials and methods section are presented in control (shCo) and ERK3 knockdown cells (shERK3) under -/+ LPS conditions. Scores above 0 indicate a tendency towards co-localization with a perfect co-localization with a score of 1; *p<0.05, **p<0.01, ***p<0.001, one-way ANOVA, Turkey’s post-test. (F) Mean green fluorescence intensity (c-Jun) was determined in control (shCo) and ERK3-depleted (shERK3) HT-29 cells in the presence and absence of LPS; *p<0.05, **p<0.01, ***p<0.001, one-way ANOVA, Turkey’s post-test.
-
Figure 7—source data 1
Full membrane scans for western blot images for Figure 7A and C.
- https://cdn.elifesciences.org/articles/52511/elife-52511-fig7-data1-v2.pdf
Figure 7—figure supplement 1
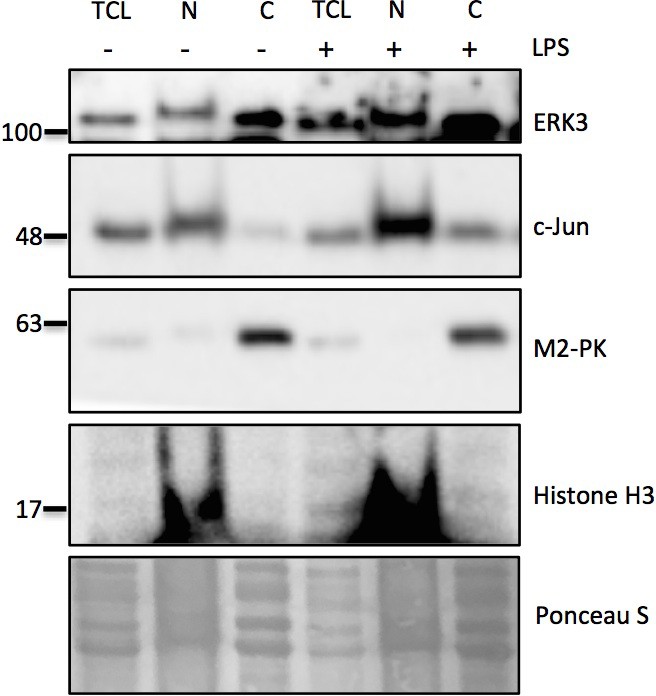
Cell fractionation experiment performed in HT-29 cells in the presence and absence of LPS (1.5 hr).
Fractionation was performed using Minute Plasma Membrane Protein Isolation and Cell Fractionation Kit (Cat# SM-005, Invent Biotechnologies) according to the manufacturer’s instructions. Expression levels of ERK3 and c-Jun were assessed in nuclear, and cytosolic fractions. Ponceau S is provided as a loading control. Total cell lysate control was included to determine endogenous expression levels of ERK3 and c-Jun proteins. Histone H3 was used as a control for the nuclear fraction and M2-PK as a control for the cytosolic fraction. Legend: TCL (total cell lysate control), N-nuclear fraction, C-cytosolic fraction.
-
Figure 7—figure supplement 1—source data 1
Full membrane scans for western blot images for Figure 7—figure supplement 1.
- https://cdn.elifesciences.org/articles/52511/elife-52511-fig7-figsupp1-data1-v2.pdf
Figure 8 with 1 supplement
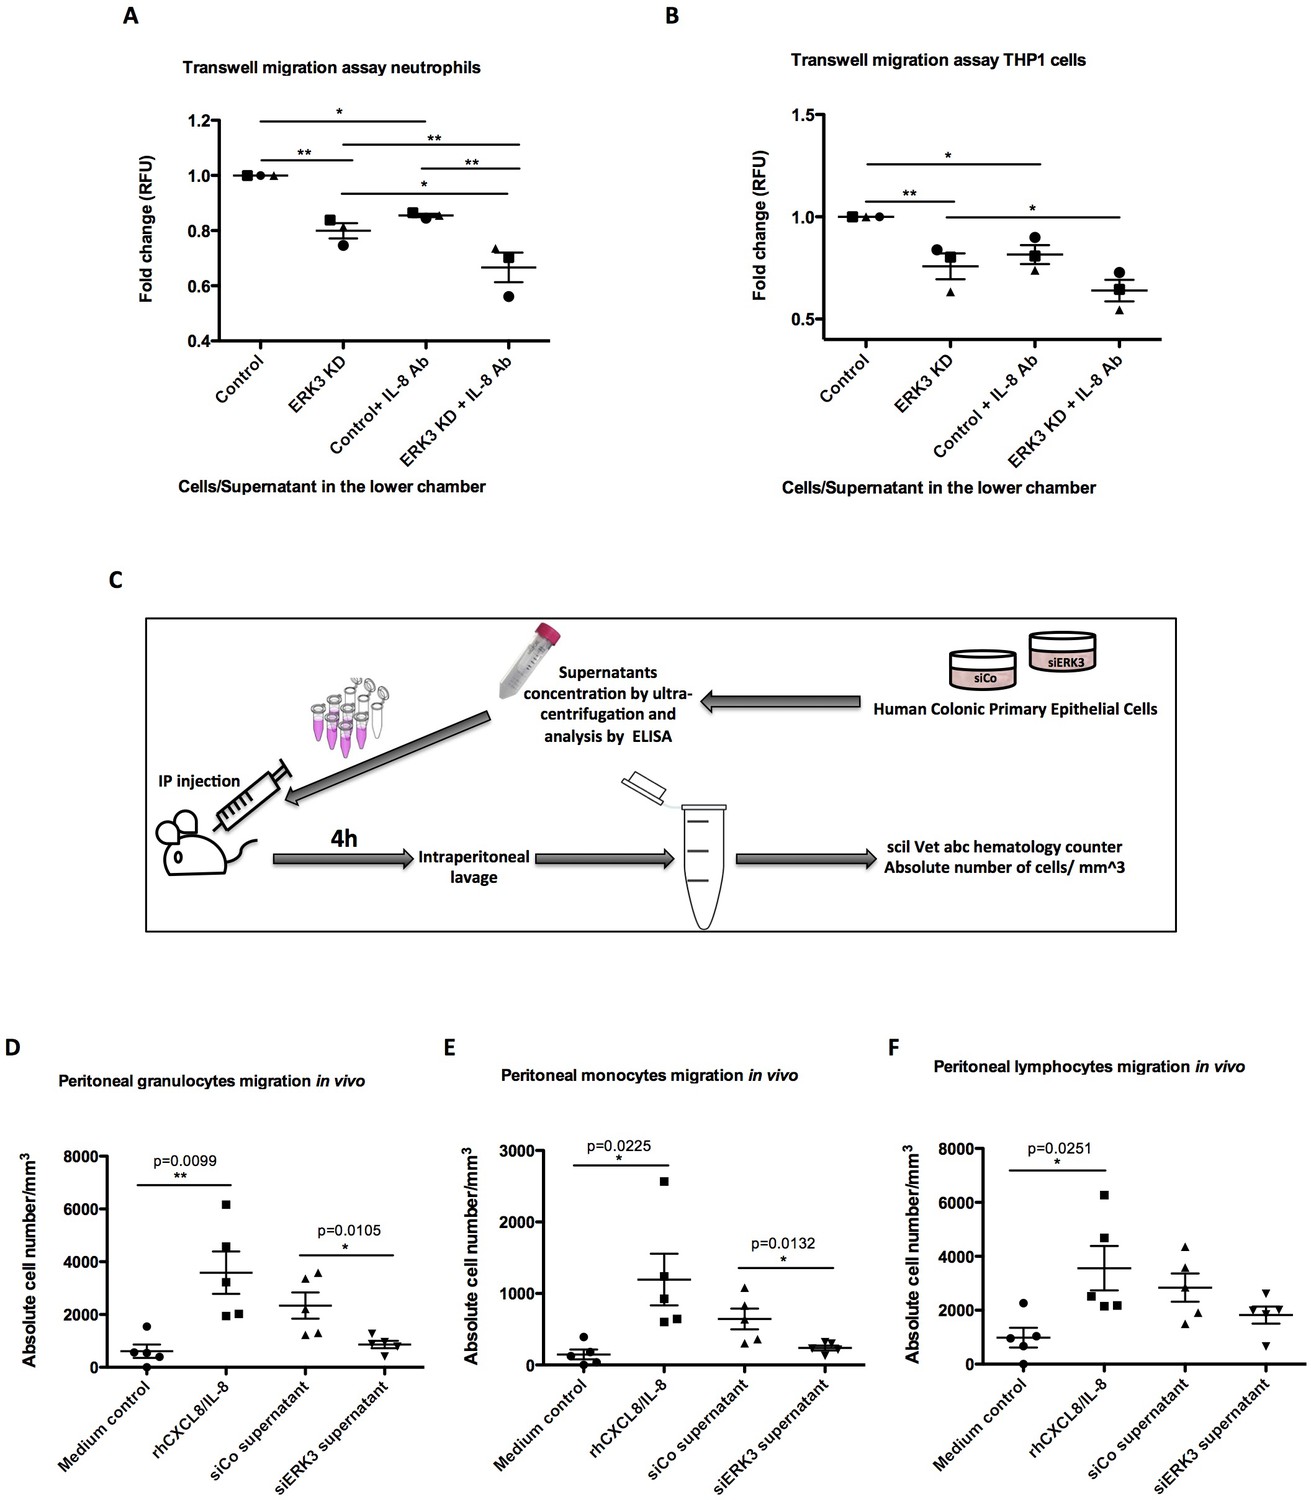
ERK3 regulates epithelial secretome and IL-8-mediated chemotaxis of human neutrophils and monocytes in vitro and in vivo.
(A–B) In vitro migration of (A) neutrophils and (B) THP1 cells toward epithelium. CellTracker Green-stained cells were placed in the upper chamber of the transwell plate and supernatants obtained from control and ERK3-depleted HCPECs or HT-29 cells were placed in the lower chamber. IL-8 neutralizing antibody was used in each condition as a control. Following 2 hr incubation at 37°C, migration of neutrophils or THP1 cells to the lower chamber was measured using fluorescence. Fold change of Relative Fluorescence Units (RFU) was then calculated. Data represent mean ± SEM of three biological replicates (n = 3); *p<0.05, **p<0.01, ***p<0.001, one-way ANOVA, Turkey’s post-test. (C–F) Effect of ERK3-depleted epithelial supernatants on intraperitoneal leukocytes migration in vivo. The experimental procedure is explained in detail in Materials and methods. Briefly, groups of five 8-week-old C57BL/6J female mice were injected intraperitoneally (i.p) with one of the following: MEM without supplements (MEM control), MEM containing 900 ng of human recombinant CXCL8/IL-8 (rhCXCL8/IL-8), HCPEC siCo/siERK3-derived concentrated supernatants. 4 hr post-injections mice were sacrificed and peritoneal white blood cells populations were harvested by peritoneal lavage. (D–F) Scatter plots representing absolute number of (D) granulocytes, (E) monocytes and (F) lymphocytes. Data are represented as mean ± SEM, n = 5; *p<0.05, **p<0.01, ***p<0.001, t-test.
Figure 8—figure supplement 1
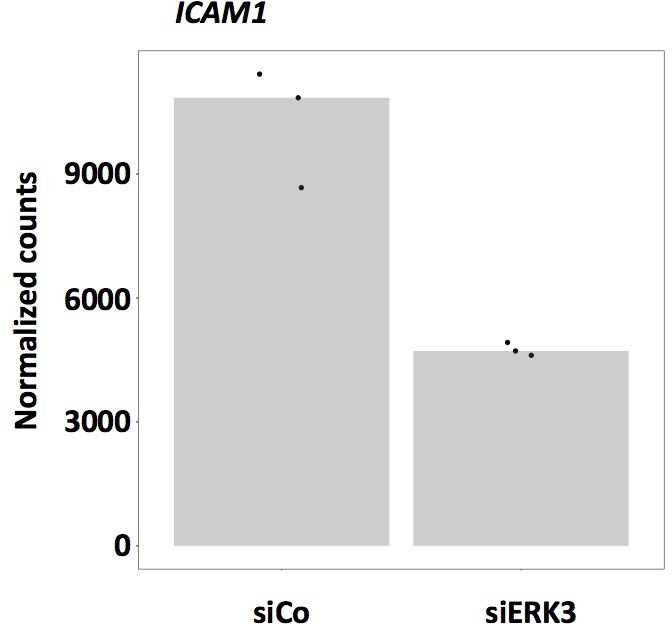
ERK3 regulates ICAM-1 expression.
RNA-seq analysis of three biological replicates (n = 3) representing differential expression in normalized counts of ICAM-1 levels in control and ERK3-depleted HCPECs.
Figure 9
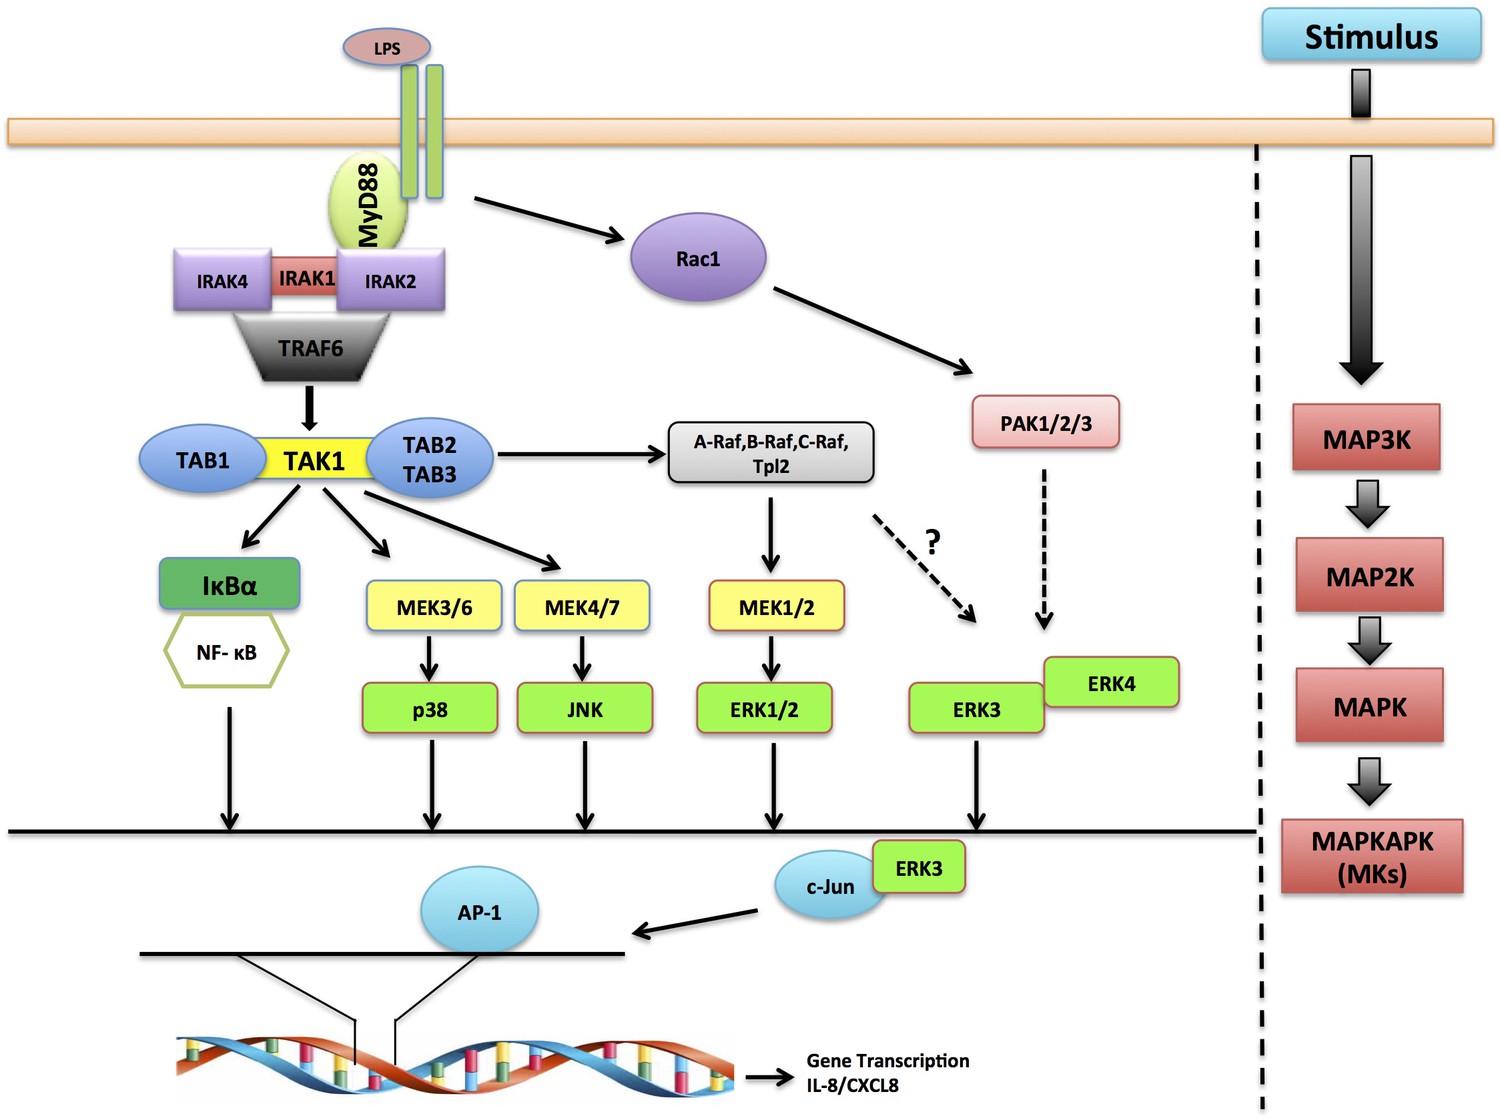
Schematic representation depicting the role of ERK3 in chemotaxis.
ERK3 interacts with c-Jun and by regulating its nuclear abundance controls DNA-binding activity of AP-1 TF, which is critically required for the activation of several cytokines, including IL-8 that contribute to the chemotaxis of leukocytes to the epithelium in response to LPS and other innate immune stimuli.
Author response image 1
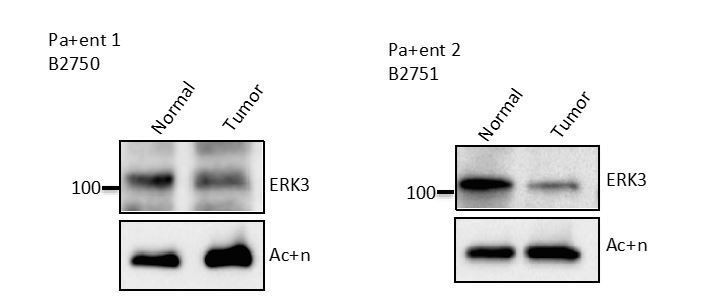
Western Blot analyses of colon epithelial-like cells isolated using EpCAM microbeads from tumor and adjacent normal tissue of two CRC patients.
Cells were analysed by Western blot according to the Materials and methods section, expression levels of ERK3 were monitored.
Tables
Key resources table
| Reagent type (species) or resource | Designation | Source or reference | Identifiers | Additional information |
|---|---|---|---|---|
| Cell line (Homo sapiens) | HT-29 | ATCC | ATCC HTB-38 | |
| Cell line (Homo sapiens) | Human Colonic Primary Epithelial Cells (HCPECs) | ATCC | CCD 841 CoN, ATCC–CRL-1790 | |
| Cell line (Homo sapiens) | CaCo2 | kind gift from Prof. Monilola Olayioye (University of Stuttgart) | ||
| Cell line (Homo sapiens) | MDA-MB231 | DSMZ | ACC 732 | |
| Cell line (Homo sapiens) | THP1 | DSMZ | ACC 16 | |
| Cell line (Homo sapiens) | 293 T cells | kind gift from Dr. Andreas Ernst (Goethe-University Frankfurt am Main, IBC2) | ||
| Chemical compound, drug | LPS | Sigma | Cat# L6143 | Working concentration: 200 ng/ml |
| Chemical compound, drug | Human recombinant IL-1β | ImmunoTools | Cat# 11340013 | Working concentration: 10 ng/ml |
| Chemical compound, drug | Pam3CSK4 TLR1/2 ligand | InvivoGen | Cat# tlrl-pms | Working concentration: 20 µg/ml |
| Chemical compound, drug | R848 TLR7/8 ligand | InvivoGen | Cat# tlrl-r848 | Working concentration: 2.5 µg/ml |
| Chemical compound, drug | Cycloheximide (CHX) | Sigma | Cat# C-7698 | Working concentration: 100 µg/ml |
| Chemical compound, drug | MG-132 inhibitor | Calbiochem, Merck Millipore | Cat# 474790 | Working concentration: 10 µM |
| Chemical compound, drug | Selective MEK1/2 inhibitor trametinib GSK1120212 | Selleckchem | Cat# S2673 | Working concentration: 1 µM |
| Sequence-based reagent-shRNA | shMAPK6#1 (shERK3#1) NM_002748.x-3734s1c1 | MISSION shRNA Human Library (Sigma) | TRCN0000001568 | Sequence: CCGGGCTGTCCACGTACTTAATTTACTCGAGTAAATTAAGTACGTGGACAGCTTTTT |
| Sequence-based reagent-shRNA | shMAPK6#2 (shERK3#2) NM_002748.x-1564s1c1 | MISSION shRNA Human Library (Sigma) | TRCN0000001569 | Sequence: CCGGGACATGACTGAGCCACACAAACTCGAGTTTGTGTGGCTCAGTCATGTCTTTTT |
| Sequence-based reagent-shRNA | shMAPK6#3 (shERK3#3) NM_002748.x-798s1c1 | MISSION shRNA Human Library (Sigma) | TRCN0000001570 | Sequence: CCGGTGATCTGGGTTCTAGGTATATCTCGAGATATACCTAGAACCCAGATCATTTTT |
| Sequence-based reagent-shRNA | shMAPKAPK5#1 (shMK5#1) NM_003668.2–475 s1c1 | MISSION shRNA Human Library (Sigma) | TRCN0000194823 | Sequence: CCGGCCCAAACATAGTTCAGATTATCTCGAGATAATCTGAACTATGTTTGGGTTTTTTG |
| Sequence-based reagent-shRNA | shMAPKAPK5#5 (shMK5#5) NM_003668.x-1622s1c1 | MISSION shRNA Human Library (Sigma) | TRCN0000000682 | Sequence: CCGGGAAATTGTGAAGCAGGTGATACTCGAGTATCACCTGCTTCACAATTTCTTTTT |
| Sequence-based reagent-shRNA | shMAPK4#1 (shERK4#1) NM_002747.x-3808s1c1 | MISSION shRNA Human Library (Sigma) | TRCN0000001374 | Sequence: CCGGCTCACACCACACGCCTTAAATCTCGAGATTTAAGGCGTGTGGTGTGAGTTTTT |
| Sequence-based reagent-shRNA | shMAPK4#2 (shERK4#1) NM_002747.x-1105s1c1 | MISSION shRNA Human Library (Sigma) | TRCN0000001375 | Sequence: CCGGACTACACCAAAGCCATCGACACTCGAGTGTCGATGGCTTTGGTGTAGTTTTTT |
| Sequence-based reagent-shRNA | shMAPK4#5 (shERK4#5) NM_002747.x-1017s1c1 | MISSION shRNA Human Library (Sigma) | TRCN0000001378 | Sequence: CCGGGATCAGCATTACTCCCACAAGCTCGAGCTTGTGGGAGTAATGCTGATCTTTTT |
| Sequence-based reagent-siRNA | siMAPK6#1 (siERK3#1) | FlexiTube siRNA, Hs_MAPK6_5 Qiagen | Cat# SI00606025 | Sequence: AGUUCAAUUUGAAAGGAAATT |
| Sequence-based reagent-CRISPR/Cas9 | CRISPR ERK3 | designed by Rule Set 2 of Azimuth 2.0 as described previously (Doench et al., 2016) | Selected gRNAs sequence: #1 5’-CACCGAGCCAATTAACAGACGATGT-3’ #2 5’-CACCGATACTTGTAACTACAAAACG-3’ #3 5’-CACCGCTGCTGTTAACCGATCCATG-3’ | |
| Recombinant DNA reagent-cDNA | ERK3 K49A K50A kinase dead mutant | Site-directed mutagenesis | Primers sequence: frw_5’ GCAATTGTCCTTACTGATCCCCAGAGTGTC, rev_5’ CGCGATGGCTACTCTTTTGTCACAGTC | |
| Commercial assay, kit | Human IL-8 ELISA Ready-SET-Go! Kit | eBioscience | Cat# 88–8086 | |
| Commercial assay, kit | Cell Fractionation Kit | Invent Biotechnologies | Cat# SM-005 | |
| Commercial assay, kit | RayBiotech L-Series Human Antibody Array 1000 | Tebu-Bio | Cat# AAH-BLG-1000 | |
| Commercial assay, kit | Nuclear Extraction Kit | Signosis | Cat# SK-0001 | |
| Commercial assay, kit | TF Activation Profiling Plate Array I | Signosis | Cat# FA-1001 | |
| Commercial assay, kit | Transcription factor Filter Plate Assay AP-1 probe | Signosis | Cat# FA-0004 | |
| Commercial assay, kit | Transcription factor Filter Plate Assay C/EBP probe | Signosis | Cat# PP-0011 | |
| Commercial assay, kit | Transcription factor Filter Plate Assay CREB probe | Signosis | Cat# PP-0015 | |
| Commercial assay, kit | CXCL8-Gaussia Luciferase GLuc-ON promoter reporter clone | Genecopoeia | Cat# HPRM15772 | |
| Antibody | Human CXCL8/IL-8 neutralizing antibody | R and D | Cat# MAB208 | In vitro/in vivo chemotaxis experiments 2.8 ng/µl used for neutralization |
| Antibody | Rabbit anti-phospho-ERK3 (pSer189) | Sigma | Cat# SAB4504175 | WB 1:500 |
| Antibody | Rabbit anti-ERK3 | Cell Signaling Technology | Cat# 4067 | WB 1:500 |
| Antibody | Rabbit anti- MK5/MAPKAPK5 (D70A10) | Cell Signaling Technology | Cat# 7419 | WB 1:500 |
| Antibody | Rabbit anti-V5-tag | Cell Signaling Technology | Cat# 13202 | WB 1:500 |
| Antibody | Rabbit anti-p44/42 MAPK (ERK1/2) | Cell Signaling Technology | Cat# 9102 | WB 1:1000 |
| Antibody | Rabbit anti-phospho-p44/42 MAPK (ERK1/2) (Thr202/Tyr204) | Cell Signaling Technology | Cat# 9101L | WB 1:1000 |
| Antibody | Rabbit anti-phospho-p38 MAPK (Thr180/Tyr182) | Cell Signaling Technology | Cat# 9215 | WB 1:500 |
| Antibody | Rabbit anti-p38 MAPK antibody | Cell Signaling Technology | Cat# 9212 | WB 1:500 |
| Antibody | Rabbit anti-IκBα (44D4) | Cell Signaling Technology | Cat# 4812 | WB 1:500 |
| Antibody | Rabbit anti-phospho-SAPK/JNK (183/Y185) | Cell Signaling Technology | Cat# 9251 | WB 1:500 |
| Antibody | Normal Rabbit IgG | Cell Signaling Technology | Cat# 2729 | Used as a control for IP |
| Antibody | Rabbit anti-c-Jun (60A8) | Cell Signaling Technology | Cat# 9165 | WB 1:500 IF 1:400 |
| Antibody | Rabbit anti-Histone H3 (D1H2) | Cell Signaling Technology | Cat# 4499 | WB 1:500 |
| Antibody | Mouse anti-M2-PK antibody | Schebo Biotech AG | Cat# S-1 | WB 1:500 |
| Antibody | Rabbit anti-MAPK4 (ERK4) | Abcam | Cat# ab211501 | WB 1:500 |
| Antibody | Rabbit anti-PRAK/MK5 (phospho T182) antibody | Abcam | Cat# ab138668 | WB 1:500 |
| Antibody | Anti-β-actin HRP conjugated | Abcam | Cat# ab49900 | WB 1:40 000 |
| Antibody | Mouse, anti-Keratin 20 (Krt20) | Agilent Dako | Cat# M701929 | WB 1:1000 |
| Antibody | Mouse anti-GAPDH antibody | GeneTex | Cat# GTX627408 | WB 1:1000 |
| Antibody | Mouse anti-α-tubulin antibody | GeneTex | Cat# GTX628802 | WB 1:1000 |
| Antibody | Mono- and polyubiquitin conjugates monoclonal HRP-coupled antibody (FK2) | Enzo | Cat# BML-PW8810 | WB 1:250 |
| Antibody | HRP-conjugated secondary antibody for rabbit IgG | Invitrogen | Cat# A16096 | WB 1:40 000 |
| Antibody | HRP-conjugated secondary antibody for rabbit IgG | Invitrogen | Cat# 32460 | WB 1:2000 |
| Antibody | HRP-conjugated secondary antibody for mouse IgG | GE Healthcare Life Sciences | Cat# NA9310 | WB 1:20 000 |
| Antibody | Anti-ERK3 | R and D | Cat# MAB3196 | IF 1:400 |
| Antibody | Goat anti-rabbit IgG-Alexa 488 | Thermo Fisher Scientific | Cat# A11008 | IF, working concentration: 5 µg/ml |
| Antibody | Goat anti-mouse IgG-Cyanine3 | Thermo Fisher Scientific | Cat# A10521 | IF, working concentration: 2D cultures: 5 µg/ml 3D cultures: 8 µg/ml |
| Chemical compound, drug | DNA dye Hoechst 33342 | Thermo Fisher Scientific | Cat# H3570 | IF, working concentration: 10 µg/ml |
| Sequence-based reagent | qRT-PCR primers human ERK3 | Sigma | Frw_5’ ATGGATGAGCCAATTTCAAG Rv_5’ CTGACAATCATGATACCTTTCC | |
| Sequence-based reagent | qRT-PCR primers human CXCL8#1 | Sigma | Frw_5’ GAGCACTCCATAAGGCACAAA Rv_5’ ATGGTTCCTTCCGGTGGT | |
| Sequence-based reagent | qRT-PCR primers human CXCL8#3 | Sigma | Frw_5’ TGTAAACATGACTTCCAAGC Rv_5’ AAAACTGCACCTTCACAC | |
| Sequence-based reagent | qRT-PCR primers human IL16 | Sigma | Frw_5’ CAGTGTTAATCCCTATTGCAC Rv_5’ ATTGTTGAGAGAGGGACTTC | |
| Sequence-based reagent | qRT-PCR primers human CXCL6 | Sigma | Frw_5’ CCTCTCTTGACCACTATGAG Rv_5’ GTTTTGGGGTTTACTCTCAG | |
| Sequence-based reagent | qRT-PCR primers human TLR4 | Sigma | Frw_5’ TGGAGGTGTGAAATCCAG Rv_5’ CTTGATAGTCCAGAAAAGGC | |
| Sequence-based reagent | qRT-PCR primers housekeeping human 18 s | Sigma | Frw_5’ AGAAACGGCTACCACATCCA Rv_5’ CACCAGACTTGCCCTCCA | |
| Sequence-based reagent | qRT-PCR primers housekeeping human GAPDH | Sigma | Frw_5’ CGACAGTCAGCCGCATCTT Rv_5’ CCCCATGGTGTCTGAGCG | |
| Sequence-based reagent | qRT-PCR primers human GKN1 | Sigma | Frw_ 5’ agctcctgccctagctaactataa Rv_ 5’ ttgtgttcattgttgacactcact | Used for HGOs qRT-PCR experiments |
| Sequence-based reagent | qRT-PCR primers human ERK3 | Sigma | Frw_ 5’ tcgatgagtcggagaagtcc Rv_ 5’ gaagatgtcttttgttagtgatcaggt | Used for HGOs qRT-PCR experiments |
| Sequence-based reagent | qRT-PCR primers mouse Alpi | Sigma | Frw_ 5’ AGGATCCATCTGTCCTTTGGT Rv_ 5’ TTCAGCTGCCTTCTTGTTCC | Used for MCOs qRT-PCR experiments |
| Sequence-based reagent | qRT-PCR primers mouse Krt20 | Sigma | Frw_ 5’ agtcccacctcagcatgaa Rv_ 5’ gagctcagcatctcctggat | Used for MCOs qRT-PCR experiments |
| Sequence-based reagent | qRT-PCR primers mouse Erk3 | Sigma | Frw_ 5’ acgacatgactgagccacac Rv_ 5’ TCTGCTCCAGGAAATCCAGT | Used for MCOs qRT-PCR experiments |
| Sequence-based reagent | qRT-PCR primers housekeeping mouse Gapdh | Sigma | Frw_ 5’ GTGCCAGCCTCGTCC Rv_ 5’ ACCCCATTTGATGTTAGTGG | Used for MCOs qRT-PCR experiments |
| Software, algorithm | ImageJ | RRID:SCR_003070 | RRID:SCR_003070 https://imagej.net/ | Used for WB quantification and IF staining analyses |
| Software, algorithm | ImageJ Coloc2 Plugin | Self-modified version as described by French et al. (2008). | Self-modified version of ImageJ RRID:SCR_003070 | Used to quantify Fluorescence co-localizations c-Jun and ERK3 |
| Software, algorithm | Fiji | RRID:SCR_003070 | Fiji (RRID:SCR_002285)http://fiji.sc | Used for IF images visualization |
Additional files
Download links
A two-part list of links to download the article, or parts of the article, in various formats.
Downloads (link to download the article as PDF)
Open citations (links to open the citations from this article in various online reference manager services)
Cite this article (links to download the citations from this article in formats compatible with various reference manager tools)
ERK3/MAPK6 controls IL-8 production and chemotaxis
eLife 9:e52511.
https://doi.org/10.7554/eLife.52511


