SLAMF6 deficiency augments tumor killing and skews toward an effector phenotype revealing it as a novel T cell checkpoint
- Sharett Institute of Oncology, Hadassah Hebrew University Hospital, Israel
- Wohl Institute for Translational Medicine, Hadassah Medical Organization, Israel
- Lautenberg Center for Immunology and Cancer Research, Faculty of Medicine, Hebrew University, Israel
- Broad Institute of MIT and Harvard, United States
- Boston Children's Hospital, Department of Pediatrics, United States
- Center for Cancer Research, Massachusetts General Hospital, United States
- Department of Medicine, Harvard Medical School, United States
- Center for Immunology and Inflammatory Diseases, Massachusetts General Hospital, United States
- Goldyne Savad Institute of Gene Therapy, Hadassah Hebrew University Hospital, Israel
- IRCM, Montreal Clinical Research Institute, Canada
Figures
Figure 1
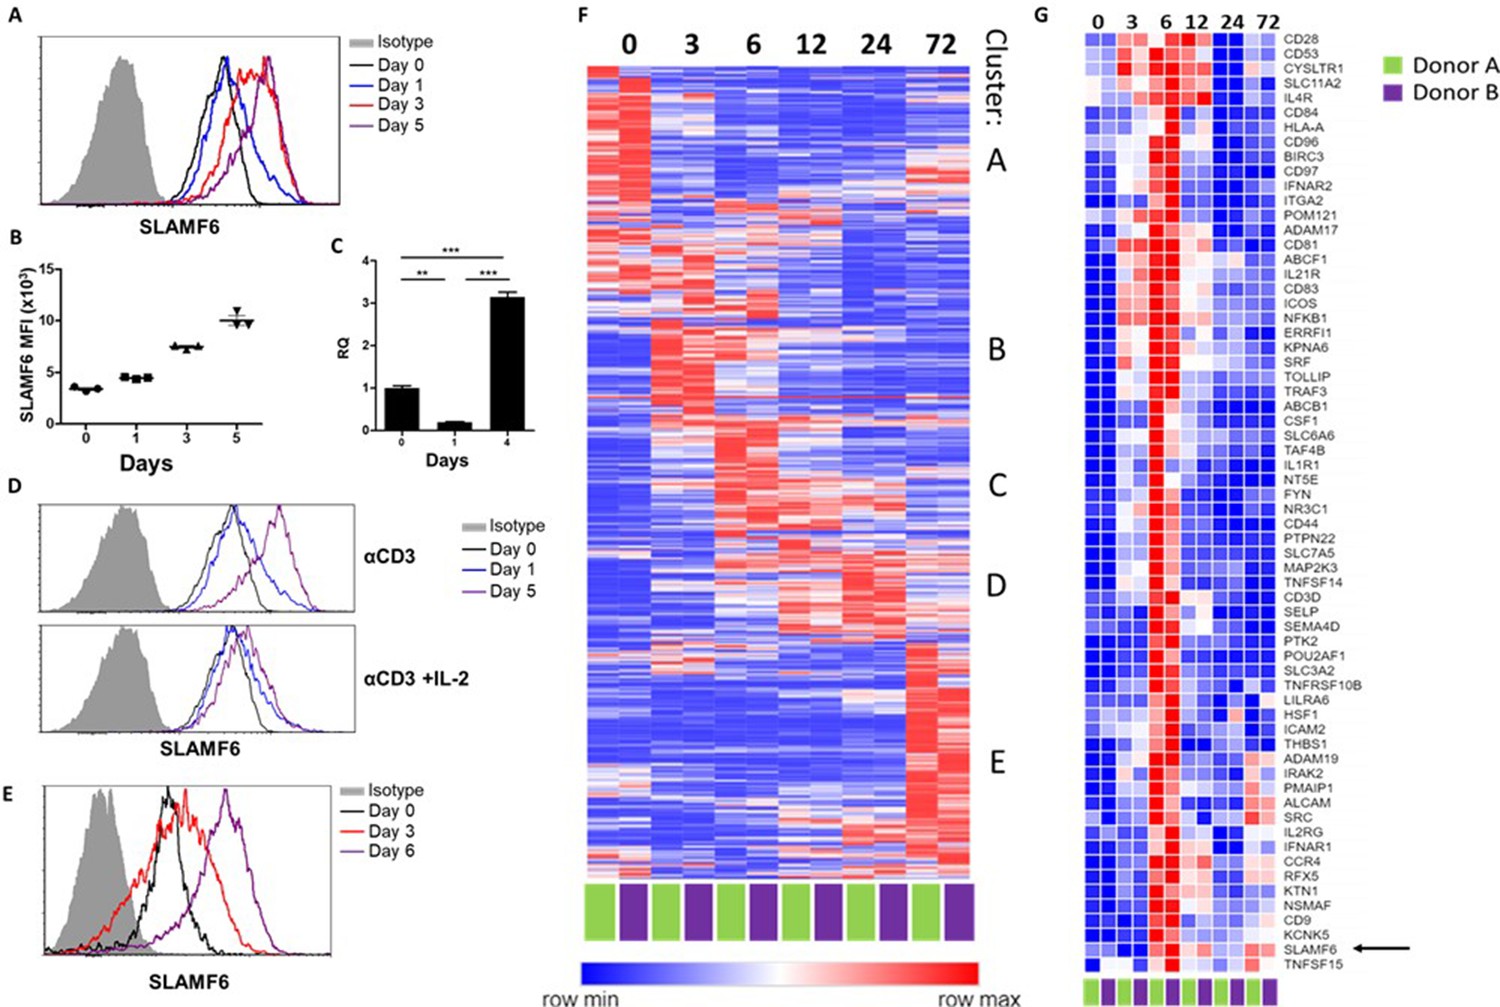
SLAMF6 is constitutively expressed on T cells and increases upon activation.
(A–C) SLAMF6 expression in human TIL412 cells, activated for five days. (A) Flow cytometry at the indicated time points. (B) Median fluorescence intensity (MFI) of SLAMF6, days 1–5. (C) Quantitative RT-PCR for SLAMF6. RNA was extracted at the indicated time points. Data normalized to HPRT expression at each time point and to the basal expression level on day 0. One-way ANOVA. **, p<0.01, ***, p<0.001. (D) SLAMF6 expression by flow cytometry in human TIL412 cells activated for 5 days with anti-CD3 or with anti-CD3 plus IL-2, at the indicated time points. (E) SLAMF6 expression by flow cytometry in Pmel-1 mouse splenocytes activated for 6 days, at the indicated time points. (F) Row normalized expression of immune-related genes from RNAseq, clustered according to similar expression patterns. CD4+ T cells from two donors were stimulated with anti-CD3 plus anti-CD28 for 72 hr, RNA was extracted and sequenced. Numbers in the top panel indicate hours. (G) Magnification of cluster C. SLAMF6 is marked.
-
Figure 1—source data 1
RNA sequencing of healthy donors CD4 T cells along activation.
- https://cdn.elifesciences.org/articles/52539/elife-52539-fig1-data1-v2.csv
Figure 2 with 1 supplement
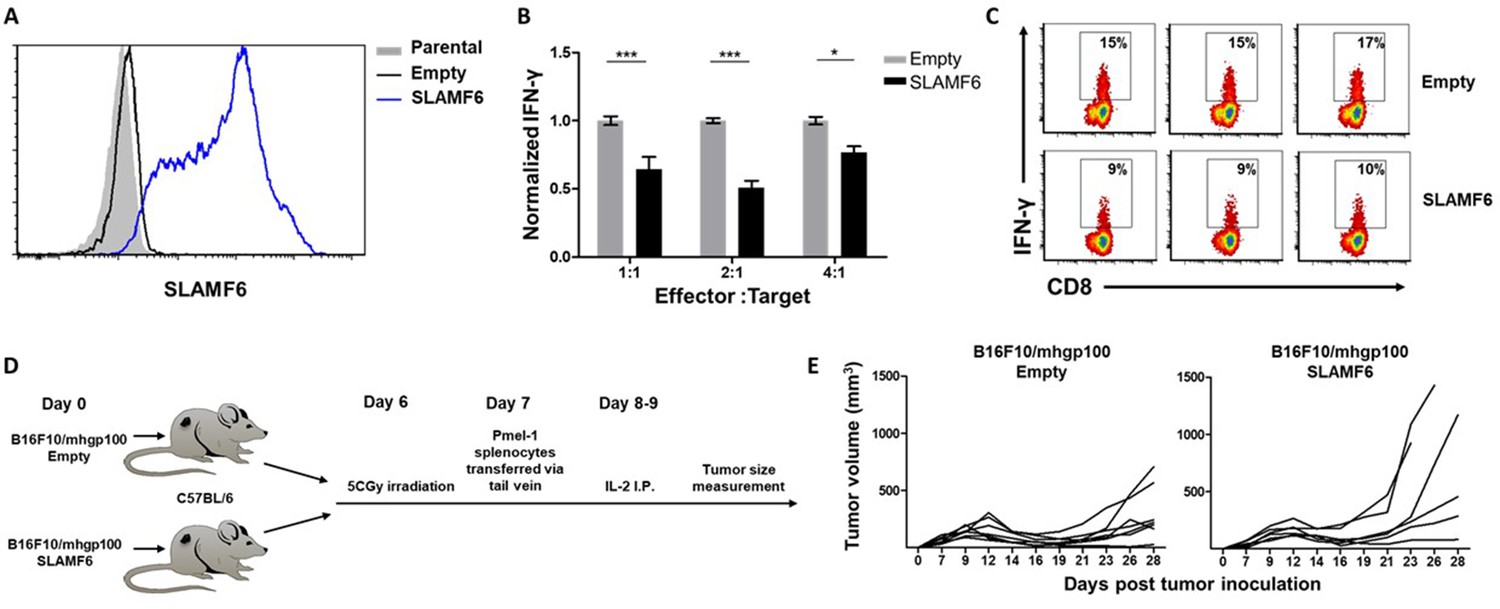
SLAMF6 expressed in trans by a melanoma target inhibits anti-tumor T cell reactivity.
(A) SLAMF6 expression on B16-F10/mhgp100 parental or transfected (SLAMF6 or empty) melanoma cells. (B) Pmel-1 splenocytes were activated for 7 days with gp10025-33 peptide and IL-2 (30 IU/ml), and then incubated overnight with B16-F10/mhgp100/empty or B16-F10/mhgp100/SLAMF6 melanoma cells at the indicated effector-to-target ratios. IFN-γ secretion was measured by ELISA. (C) Pmel-1 splenocytes were activated for 7 days with gp10025-33 peptide and IL-2 (30 IU/ml), and then incubated overnight with B16-F10/mhgp100/empty or B16-F10/mhgp100/SLAMF6 melanoma cells. IFN-γ production was detected by intracellular staining and flow cytometry (gated on CD8+). Three replicates. The gating strategy is illustrated in Figure 2—figure supplement 1. (D, E) Pmel-1 splenocytes were expanded with gp10025-33 peptide (1 µg/ml) and IL-2 (30 IU/ml) for 7 days. On day 7, cells were transferred i.v. into irradiated C57Bl/6 mice bearing palpable (1 week) B16-F10/mhgp100/empty or B16-F10/mhgp100/SLAMF6 tumors. IL-2 (0.25 × 10⁶ IU) was administered i.p. twice a day for 2 days. Tumor growth was measured twice a week. Mice were sacrificed when the tumor reached 15 mm in diameter. (D) Scheme showing experimental layout. (E) Spider plot showing tumor volume [calculated as L (length) x W (width)2 x 0.5]. One-way ANOVA. *, p<0.05, **, p<0.01, ***, p<0.001.
Figure 2—figure supplement 1

Gating strategy.
Initially, non-single cells were excluded using FSC-A and FSC-H axes. Then, based on the morphology of the cells in the FSC-A SSC-A axes, the live cell population was gated. In this population, only cells that stained positively for CD8+ expression were subjected to further analysis.
Figure 3 with 1 supplement
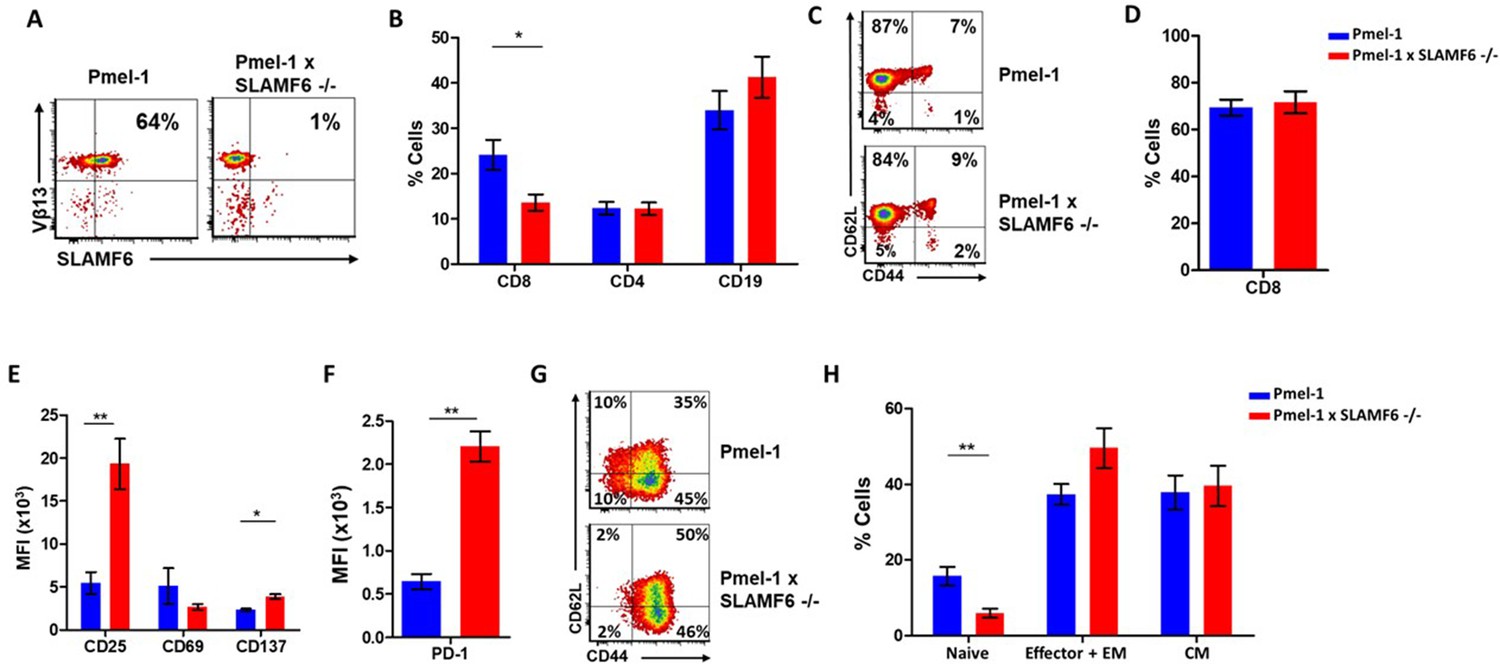
Establishment of Pmel-1 x SLAMF6 -/- mice as a source of SLAMF6-KO antigen-specific lymphocytes.
(A) SLAMF6 and Vβ13 expression in Pmel-1 or Pmel-1 x SLAMF6 -/- splenocytes measured by flow cytometry. (B) Percent CD8+, CD4, and CD19 cells in spleens from Pmel-1 or Pmel-1 x SLAMF6 -/- untreated mice. (C) Pmel-1, and Pmel-1 x SLAMF6 -/- CD8+ untreated splenocytes were stained with anti-CD44 and anti-CD62L. One representative experiment is shown. (D) Percent CD8+ cells in Pmel-1 or Pmel-1 x SLAMF6 -/- splenocytes after 7 days of in vitro activation with gp10025-33 peptide and IL-2 (30 IU/ml). (E) Flow cytometry for activation markers (CD25, CD69, CD137) in Pmel-1 or Pmel-1 x SLAMF6 -/- splenocytes after 3 days of in vitro activation, as in (D). Median fluorescence intensity (MFI) is shown. (F) Expression of PD-1 in Pmel-1 or Pmel-1 x SLAMF6 -/- CD8+ T cells after 7 days of in vitro activation, as in (D). Median fluorescence intensity (MFI) is shown. (G, H) After 7 days of activation, Pmel-1 and Pmel-1 x SLAMF6 -/- CD8+ T cells were stained with anti-CD44 and anti-CD62L. CD8+ subpopulations were defined for each mouse strain. (G) One representative experiment and (H) summary of subpopulations identified by flow cytometry in five experiments is shown. EM, effector memory, CM, central memory. Student t-test. *, p<0.05, **, p<0.01, ***, p<0.001.
Figure 3—figure supplement 1
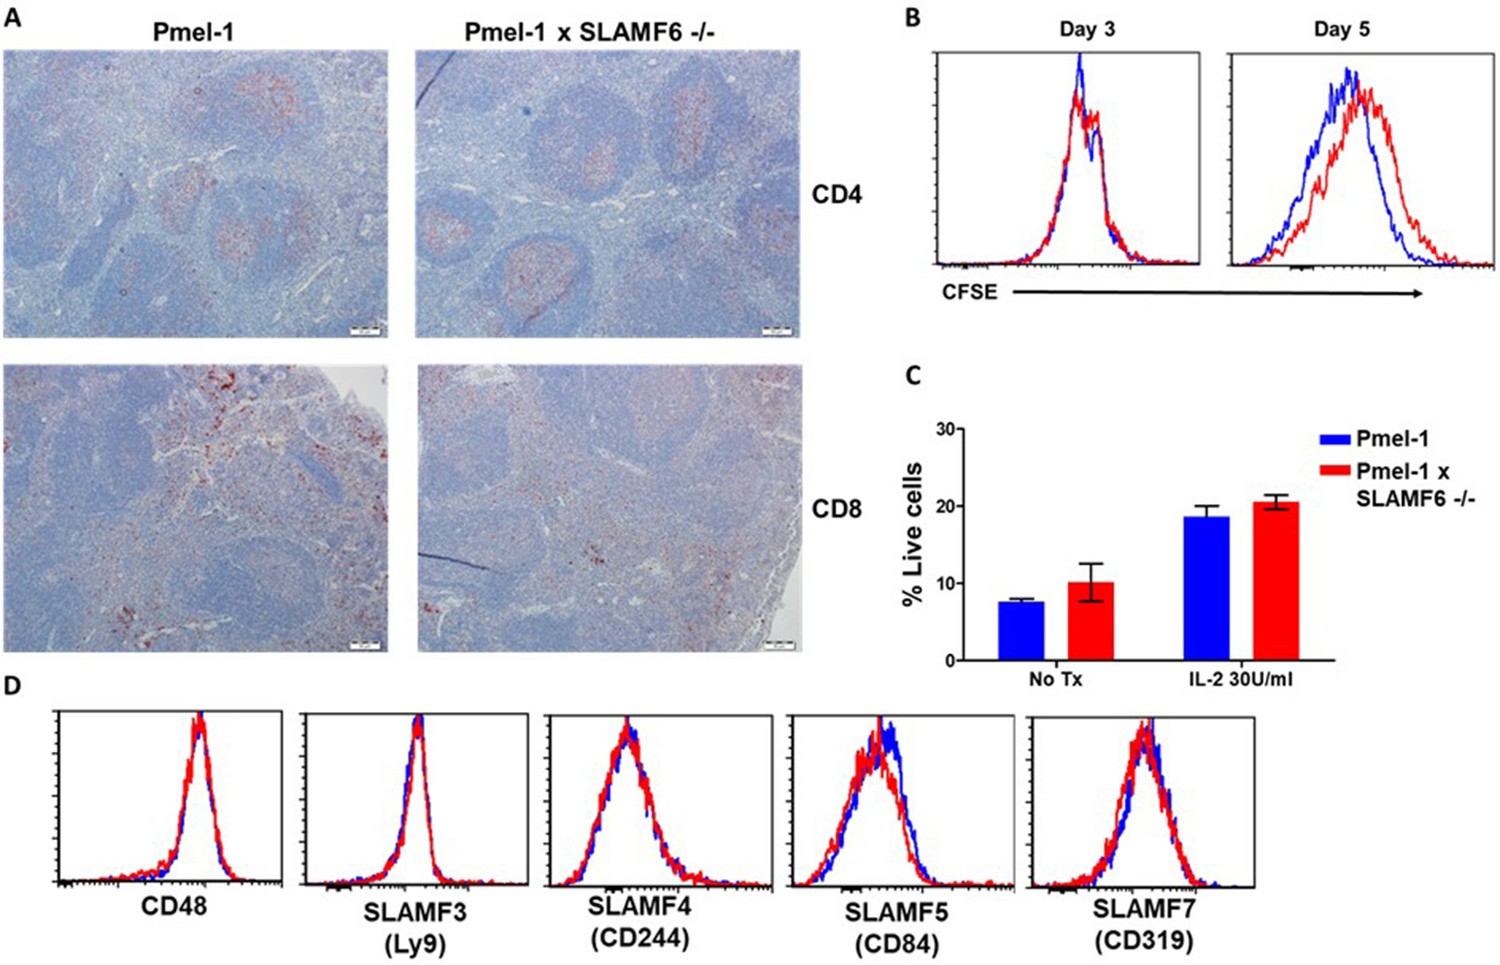
Characterization of Pmel-1 x SLAMF6 -/- mice.
(A) Immunohistochemistry staining of Pmel-1 and Pmel-1 x SLAMF6 -/- spleen sections using anti CD4 and anti-CD8+ antibodies (X10 magnification). (B) Pmel-1 and Pmel-1 x SLAMF6 -/- splenocytes were labeled with CFSE and activated; at the indicated time points the cells were stained for CD8+ expression, and CFSE level gated on the CD8+ population was measured using flow cytometry. (C) Pmel-1 and Pmel-1 x SLAMF6 -/- splenocytes activated for 7 days followed by 7 days maintenance with IL-2 (30 IU/ml) or without its addition. Percentage apoptotic and dead cells was measured by PI-Annexin V. Summary of two experiments shown. No Tx, no treatment. (D) After 7 days of activation, Pmel-1 and Pmel-1 x SLAMF6 -/- CD8+ T cells were stained with antibodies against SLAM family receptors. The expression level of each receptor in CD8+ cells is presented.
Figure 4 with 1 supplement

Pmel-1 x SLAMF6 -/- T cells have a better functional capacity.
(A–D) Pmel-1 or Pmel-1 x SLAMF6 -/- splenocytes were activated for 7 days with gp10025-33 peptide and IL-2 (30 IU/ml) and then incubated overnight with B16-F10/mhgp100 melanoma cells. (A) The cells were incubated at a 1:1 effector-to-target ratio. IFN-γ secretion was measured by ELISA. Each point represents one mouse. (B) The cells were incubated at the indicated effector-to-target ratios. IFN-γ secretion was measured by ELISA. (C) The cells were incubated at a 1:1 effector-to-target ratio. GM-CSF secretion was measured by ELISA. Each point represents one mouse. (D) Conditioned medium was collected and analyzed with Quantibody mouse cytokine array. (E, F) Pmel-1 or Pmel-1 x SLAMF6 -/- splenocytes were activated for 7 days with gp10025-33 peptide and IL-2 (30 IU/ml) and then incubated for 16 hr with B16-F10/mhgp100 melanoma cells. Granzyme-B expression was detected by flow cytometry. One representative experiment (E) and a summary of triplicates (F) are shown. (G–J) B16-F10/mhgp100 mouse melanoma cells were injected s.c. into the back of C57BL/6 mice. Pmel-1 or Pmel-1 x SLAMF6 -/- mouse splenocytes were expanded with gp10025-33 peptide in the presence of IL-2 (30 IU/ml). On day 7, Pmel-1 cells or Pmel-1 x SLAMF6 -/- cells were adoptively transferred i.v. into the irradiated tumor-bearing mice. N = 8 mice per group. Tumor size was measured three times a week. (G) Scheme of the experimental layout. (H) Spider plots showing tumor volume [calculated as L (length) x W (width)2 x 0.5]. CR, complete response. (I) Normalized tumor volume (Mean ± SEM) until day 45, on which the first mouse had to be sacrificed. Tumor dimensions were normalized to the 1st measurement. (J) Kaplan Meier survival curve. (K) Percent T cells specific for gp10025-33 peptide in the spleen or tumor draining lymph nodes (DLN) of mice sacrificed 7 days post-ACT. Tet, tetramer. Student t test. *, p<0.05, **, p<0.01, ***, p<0.001.
Figure 4—figure supplement 1
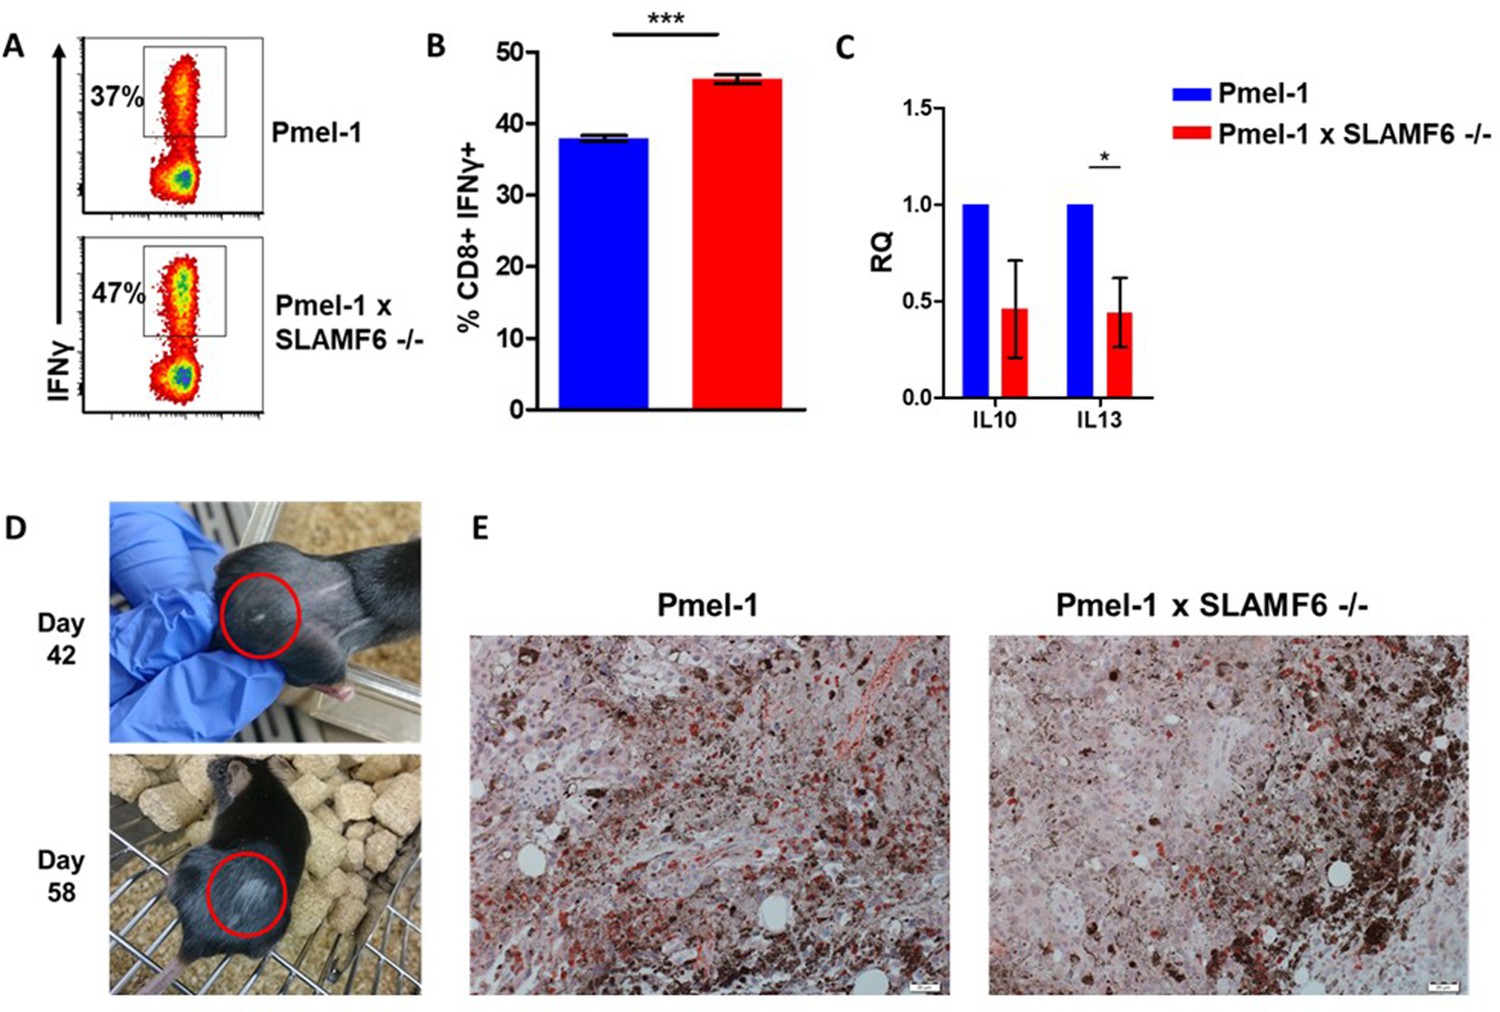
Additional results regarding Pmel-1 x SLAMF6 -/- T cell superiority.
(A, B) Pmel-1 or Pmel-1 x SLAMF6 -/- splenocytes were activated for 7 days with gp10025-33 peptide and IL-2 (30 IU/ml). Cells were then incubated for 6 hr with B16-F10/mhgp100 melanoma cells. IFN-γ production was detected by flow cytometry. One representative experiment (A) and a summary of triplicates (B) are shown. (C) Pmel-1 and Pmel-1 x SLAMF6 -/- splenocytes were activated for 7 days and lysed. RNA was extracted and quantitative RT-PCR for cytokine expression was performed. Data were normalized to Hprt expression for each mouse strain. Pmel-1 x SLAMF6 -/- values for each gene were normalized to Pmel-1 values. (D) Photographs from days 42 and 58 post-tumor inoculation of a mouse that developed vitiligo following ACT with Pmel-1 x SLAMF6 -/- cells. Vitiligo spots are marked. (E) Immunohistochemistry staining of tumors from mice receiving ACT of Pmel-1 or Pmel-1 x SLAMF6 -/- splenocytes, harvested 7 days post-ACT. Tumor sections were stained with anti-CD8+ Ab (X20 magnification).
Figure 5
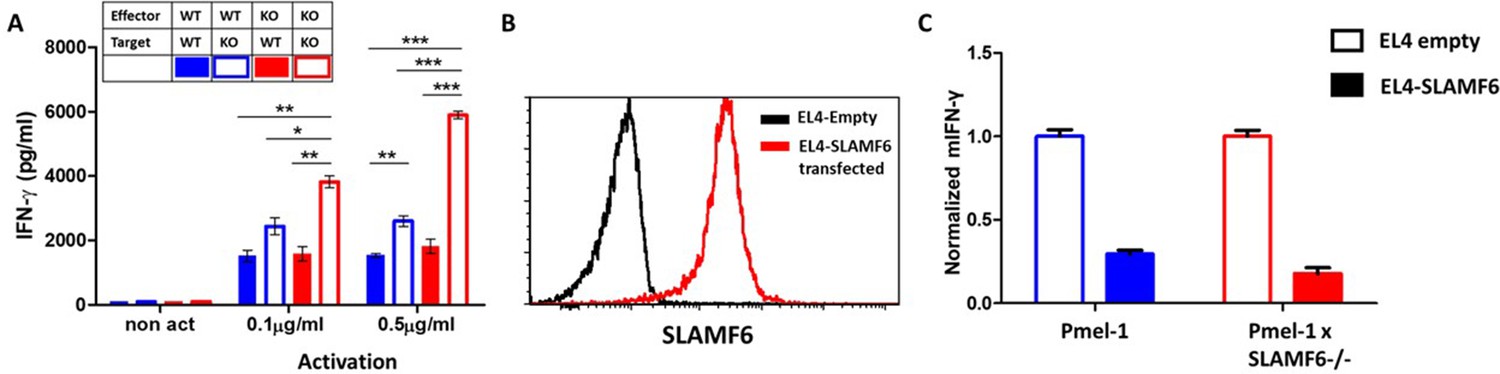
The contribution of cis and trans SLAMF6 interactions to CD8+ T cell function.
(A) Separated CD8+ splenocytes from Pmel-1 and Pmel-1 x SLAMF6 -/- were co-cultured (1 × 10⁵) overnight at the indicated ratios with non-T splenocytes from both mice splenocytes. IFN-γ secretion was measured by ELISA. (B) SLAMF6 expression on EL4 parental or transfected (SLAMF6 or empty) cells. (C) Pmel-1 or Pmel-1 x SLAMF6 -/- splenocytes were activated for 7 days with gp10025-33 peptide and IL-2 (30 IU/ml) and then incubated overnight with gp10025-33 pulsed EL4 cells (empty or SLAMF6 transfected), at a 1:1 effector-to-target ratio. IFN-γ secretion was measured by ELISA. IFN-γ values are normalized to the results of EL4-empty for each mouse splenocytes. One-way ANOVA test. *, p<0.05, **, p<0.01, ***, p<0.001.
Figure 6 with 1 supplement
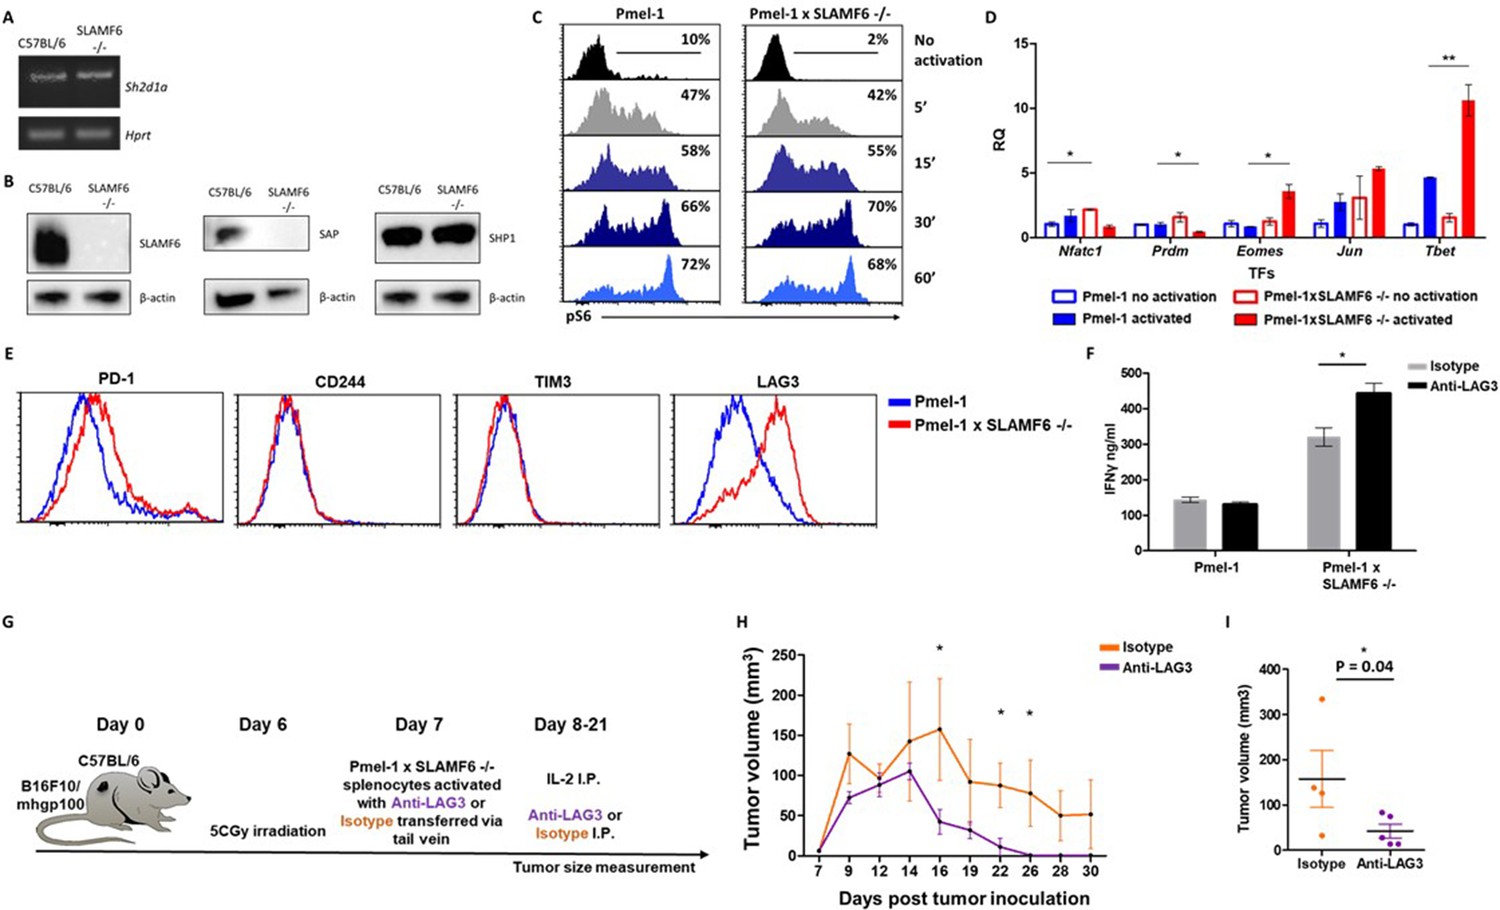
Mechanism associated with the inhibitory function of SLAMF6.
(A) RNA expression of Sh2d1a transcript (SAP) in WT and SLAMF6 -/- splenocytes. (B) Immunoblot analysis of expression of SLAMF6, SAP and SHP-1 in WT and SLAMF6 -/- splenocytes. (C) Pmel-1 and Pmel-1 x SLAMF6 -/- splenocytes were activated with gp10025-33 peptide for the indicated time points. At the end of the activation, cells were fixed and stained for phosphorylated S6. (D) Pmel-1 and Pmel-1 x SLAMF6 -/- splenocytes were either activated with gp10025-33 peptide in the presence of IL-2 (30 IU/ml) for 18 hr or kept only with IL-2 for 18 hr (non-activated). After 18 hr, the cells were lysed, RNA was extracted, and quantitative RT-PCR for transcription factors expression was performed. Data was normalized to Hprt expression for each mouse strain. Values for each condition were normalized to Pmel-1 non-activated values for each gene. (E) Pmel-1 and Pmel-1 x SLAMF6 -/- splenocytes were expanded with gp10025-33 peptide in the presence of IL-2 (30 IU/ml) for 7 days. After the expansion phase, the cells were kept for an additional 5 days without supplements. Expression of exhaustion markers was measured in Pmel-1 or Pmel-1 x SLAMF6 -/- splenocytes. (F) Pmel-1 and Pmel-1 x SLAMF6 -/- splenocytes were expanded with gp10025-33 peptide in the presence of IL-2 (30 IU/ml) and 10 μg/ml anti-LAG-3 or isotype control for 7 days, and then incubated overnight with B16-F10/mhgp100 melanoma cells at a 1:1 effector-to-target ratio. IFN-γ secretion was measured by ELISA. (G–I) B16-F10/mhgp100 mouse melanoma cells were injected s.c. into the back of C57BL/6 mice. Pmel-1 x SLAMF6 -/- mouse splenocytes were expanded with gp10025-33 peptide and IL-2 (30 IU/ml) in the presence of either Anti-Lag3 or Isotype control. On day 7, Isotype or Anti-Lag3 activated cells were adoptively transferred i.v. into the irradiated tumor-bearing mice. Anti-Lag3 or Isotype control were injected i.p. five times in the 2 weeks post-transfer. N = 5 mice per group. Tumor size was measured three times a week. (G) Scheme of the experimental layout. (H) Tumor volume (Mean ± SEM) until day 30 post-tumor inoculation. (I) Tumor volume on day 16 post-tumor inoculation. *, p<0.05, **, p<0.01.
Figure 6—figure supplement 1
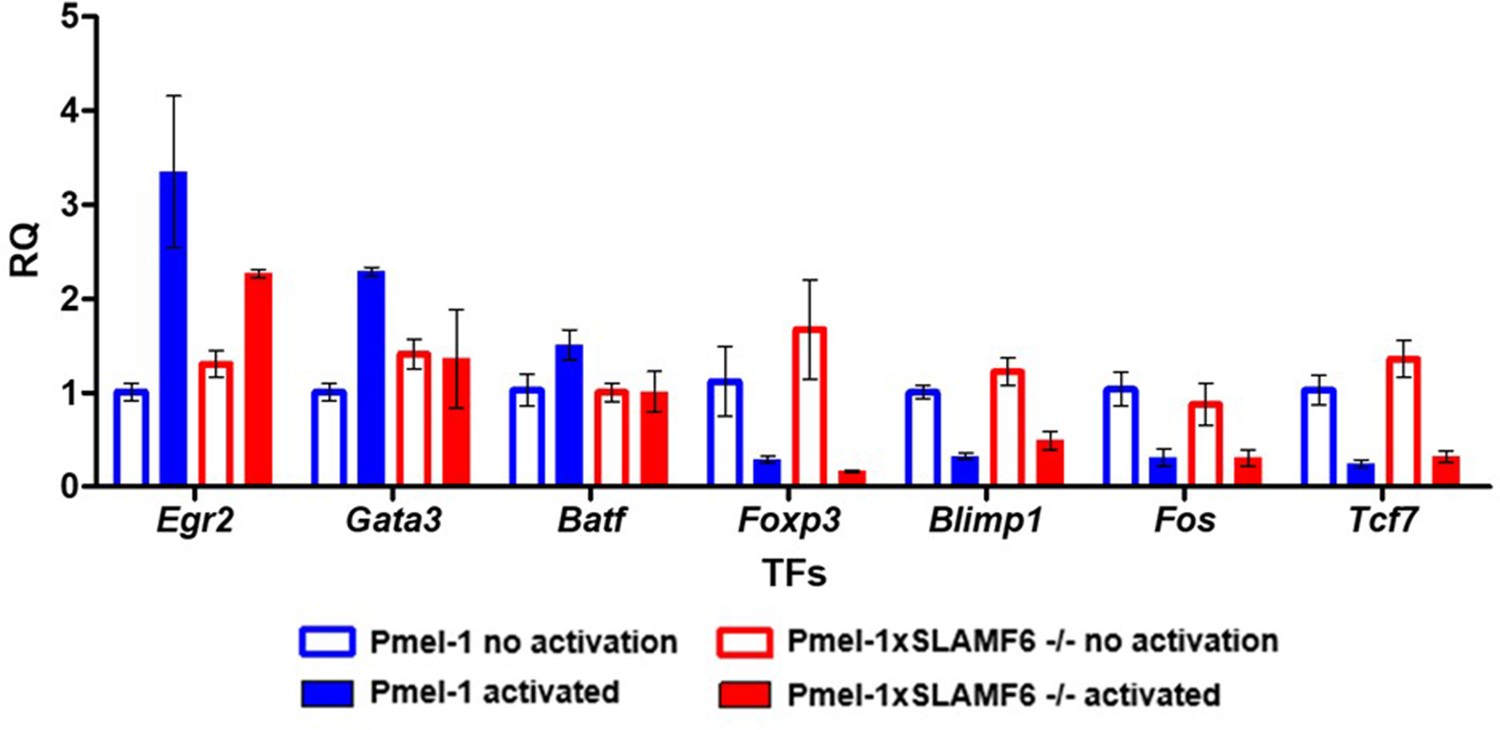
Pmel-1 and Pmel-1 x SLAMF6 -/- splenocytes were either activated with gp10025-33 peptide in the presence of IL-2 (30 IU/ml) for 18 hr or only kept with IL-2 (non-activated).
After 18 hr, the cells were lysed, RNA was extracted, and quantitative RT-PCR for transcription factors expression was performed. Data was normalized to Hprt expression for each mouse strain. Values for each condition were normalized to Pmel-1 non-activated values for each gene.
Tables
Key resources table
| Reagent type (species) or resource | Designation | Source or reference | Identifiers | Additional information |
|---|---|---|---|---|
| Strain, strain background Mus musculus Female) | C57BL/6 | Harlan laboratories | C57BL/6 | |
| Strain, strain background Mus musculus Female) | Pmel-1 | This paper | Pmel-1 | Kind gift from M. Baniyash |
| Strain, strain background Mus musculus Female) | SLAMF6 -/- | This paper | SLAMF6 -/- | Kind gift from I. Shachar |
| Strain, strain background Mus musculus Female) | Pmel-1 x SLAMF6 -/- | This paper | Pmel-1 and SLAMF6-/- mice were bred to generate Pmel-1 X SLAMF6-/- mice according to the ethics requirements (Authority for biological and biomedical models, Hebrew University, Jerusalem, Israel). | |
| Genetic reagent Mus musculus | SLAMF6 | SINO biological | HG11945-UT | pCMV3-mSLAMF6 |
| Cell line Mus musculus | B16-F10/mhgp100 | This paper | Kind gift from Ken-ichi Hanada, Surgery Branch, NCI, NIH | |
| Cell line Mus musculus | EL4 | This paper | Kind gift from Lea Eisenbach, Weizmann Institute, Israel | |
| Cell line (Homo sapiens) | TIL412 | This paper | The cells were maintained in Lotem’s laboratory | |
| Biological sample (Homo sapiens) | PBMCs | This paper | Blood drawn from donors recruited from the Boston community as part of the Phenogenetic Project and ImmVar Consortium | |
| Antibody | Monoclonal Rat anti mouse CD16/32 (93) | Biolegend, San Diego, CA | 101302 | 0.2 μg/100 μl |
| Antibody | Monoclonal mouse anti mouse SLAMF6 (330-AJ) | Biolegend, San Diego, CA | 134610 | 0.2 μg/100 μl |
| Antibody | Monoclonal rat anti mouse TNFα (MP6-XT22) | Biolegend, San Diego, CA | 506314 | 0.2 μg/100 μl |
| Antibody | Monoclonal rat anti mouse CD19 (6D5) | Biolegend, San Diego, CA | 115521 | 0.2 μg/100 μl |
| Antibody | Monoclonal rat anti mouse CD44 (IM7) | Biolegend, San Diego, CA | 103016 | 0.2 μg/100 μl |
| Antibody | Monoclonal mouse anti mouse TIM3 (RMT3-23) | Biolegend, San Diego, CA | 119706 | 0.2 μg/100 μl |
| Antibody | Monoclonal rat anti mouse LAG3 (C9B7W) | Biolegend, San Diego, CA | 125210 | 0.2 μg/100 μl |
| Antibody | Monoclonal rat anti mouse CD3 (145–2 C11) | Biolegend, San Diego, CA | 100302 | 1 μg/ml |
| Antibody | Monoclonal mouse anti human CD3 (UCHT1) | BD Biosciences, San Jose, CA | 550368 | |
| Antibody | Monoclonal mouse anti human CD28 (CD28.2) | BD Biosciences, San Jose, CA | 556620 | |
| Antibody | Monoclonal rat anti mouse IFNγ (XMG1.2) | Biogems, Westlake Village, CA | 80812 | 0.2 μg/100 μl |
| Antibody | Monoclonal rat anti mouse CD8 (53–6.7) | Biogems, Westlake Village, CA | 10122 | 0.2 μg/100 μl |
| Antibody | Monoclonal rat anti mouse GZMB (NGZN) | Biogems, Westlake Village, CA | 72212 | 0.2 μg/100 μl |
| Antibody | Monoclonal rat anti mouse CD4 (GK1.5) | Biogems, Westlake Village, CA | 06112 | 0.2 μg/100 μl |
| Antibody | Monoclonal rat anti mouse CD25 (PC61.5) | Biogems, Westlake Village, CA | 07312 | 0.2 μg/100 μl |
| Antibody | Monoclonal rat anti mouse CD62L (MEL-14) | eBioscience, CA | 25-0621-81 | 0.2 μg/100 μl |
| Antibody | Monoclonal mouse anti mouse Vb13 (MR12-3) | eBioscience, CA | 17-5797-82 | 0.2 μg/100 μl |
| Antibody | Monoclonal Armenian hamster anti mouse CD69 (H1.2F3) | eBioscience, CA | 14-0691-82 | 0.2 μg/100 μl |
| Antibody | Monoclonal Armenian hamster anti mouse CD279 (J43) | eBioscience, CA | 12-9985-82 | 0.2 μg/100 μl |
| Antibody | Monoclonal rat anti mouse CD244 (eBio244F4) | eBioscience, CA | 14-2441-82 | 0.2 μg/100 μl |
| Antibody | Monoclonal Syrian hamster anti mouse CD137 (17B5) | eBioscience, CA | 12-1371-82 | 0.2 μg/100 μl |
| Antibody | Monoclonal anti human SLAMF6 (REA339) | Miltenyi Biotec, Bergisch Gladbach, Germany | Cd352 | 0.2 μg/100 μl |
| Antibody | Monoclonal rabbit anti pS6 (D57.2.2E) | Cell Signaling Technology, Danvers, MA | 4858 | 0.2 μg/100 μl |
| Antibody | Monoclonal rat anti mouse LAG-3 (C9B7W) | InVivoMab, BioXcell, NH | BE0174 | 10 μg/1 ml |
| Antibody | Monoclonal rat anti-Ly108 (3E11) | Merck, Kenilworth, NJ | MABF919 | 1:1000 |
| Antibody | Monoclonal rat anti-SAP (1A9) | Biolegend, San Diego, CA | 690702 | 1:1000 |
| Antibody | Monoclonal mouse anti b-actin (sc-47778) | Santa Cruz Biotechnology, TX | C4 | 1:1000 |
| Antibody | Monoclonal rabbit anti-SHP1 | This paper | 1:1000 Generated in Andre’ Veillette laboratory | |
| Antibody | Monoclonal rabbit anti mouse CD4 (ab183685) | Abcam | EPR19514 | For immunohistochemistry |
| Antibody | Monoclonal rabbit anti mouse CD8+ (ab203035) | Abcam | ab203035 | For immunohistochemistry |
| Sequence-based reagent | Primers | All primers are listed in the primers table in the Materials and methods section | ||
| Peptide, recombinant protein | MART-126–35 | Biomer Technology, Cheshire, UK | ||
| Peptide, recombinant protein | gp10025-33 | Genscript biotech, NJ | ||
| Commercial assay or kit | IFN-γ ELISA | Biolegend | 430801 | |
| Commercial assay or kit | GM-CSF ELISA | Biolegend | 432201 | |
| Commercial assay or kit | GenElute Mammalian Total RNA kit | Sigma Aldrich, MA | RTN70 | RNA production |
| Commercial assay or kit | qScript cDNA Synthesis kit | Quantabio, Beverly, MA | 95047 | RNA transformed to cDNA |
| Commercial assay or kit | RNeasy 96 kit | Qiagen, Hilden, Germany | 74181 | RNA production |
| Commercial assay or kit | Annexin V apoptosis detection kit | eBioscience | 88-8007-74 | Survival assay |
| Commercial assay or kit | Mouse CD8 T cell isolation kit | Stemcell technologies, Vancouver, CA | EasySep 19853A | CD8 isolation from total splenocytes |
| Commercial assay or kit | Quantibody mouse cytokine array | RayBiotech, Peachtree Corners, GA | QAM-CYT-1 | |
| Chemical compound, drug | IL-2 | Chiron, CA | recombinant human IL-2 | |
| Software, algorithm | FCS express five flow research edition | De Novo software | ||
| Software, algorithm | CellSens Entry 1.8 | Olympus Life Science | Acquisition software for immunohistochemistry | |
| Other | lyse/fix buffer | BD Biosciences | Cat: 558049 | |
| Other | PermII buffer | BD Biosciences | Cat: 558052 |
Additional files
Download links
A two-part list of links to download the article, or parts of the article, in various formats.
Downloads (link to download the article as PDF)
Open citations (links to open the citations from this article in various online reference manager services)
Cite this article (links to download the citations from this article in formats compatible with various reference manager tools)
SLAMF6 deficiency augments tumor killing and skews toward an effector phenotype revealing it as a novel T cell checkpoint
eLife 9:e52539.
https://doi.org/10.7554/eLife.52539


