The DNA-binding protein HTa from Thermoplasma acidophilum is an archaeal histone analog
- MRC London Institute of Medical Sciences (LMS), United Kingdom
- Institute of Clinical Sciences (ICS), Faculty of Medicine, Imperial College, United Kingdom
Figures
Figure 1
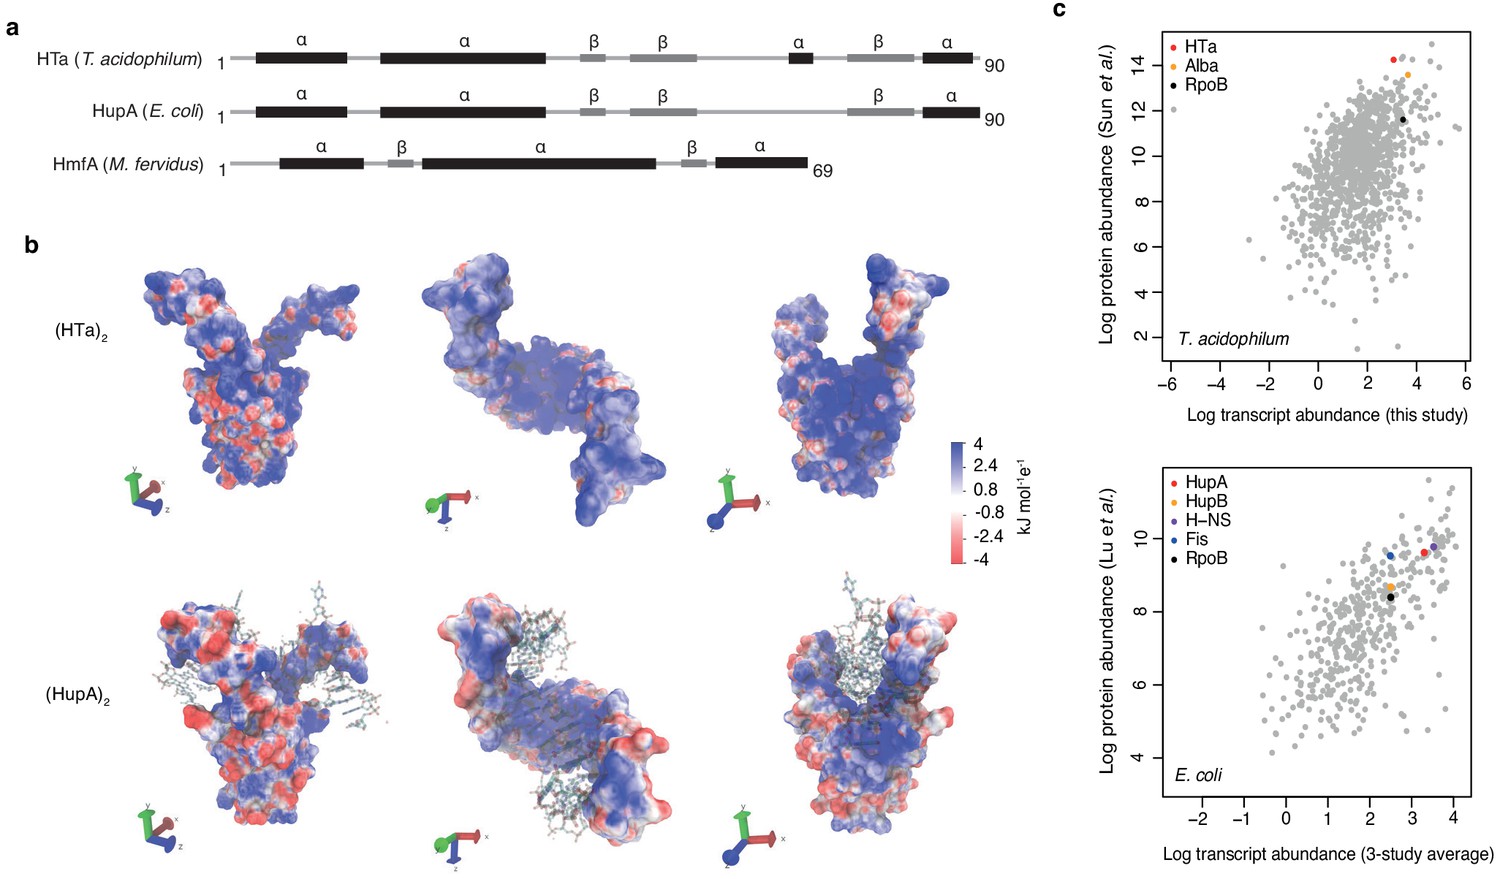
Predicted structure and measured abundance of HTa.
(a) Predicted secondary structures of HTa (T. acidophilum), the bacterial HU protein HupA (E. coli), and the archaeal histone protein HmfA (M. fervidus). (b) Predicted quaternary structure of the (HTa)2 homodimer compared to the crystal structure of (HupA)2 (PDB: 1p51) bound to DNA. Color gradients represent charge densities mapped onto the solvent accessible surface area of (HTa)2 and (HupA)2. Note the extended patches of stronger positive charge for (HTa)2 compared to (HupA)2, particularly in the stalk region. (c) Correlation of transcript and protein abundances for T. acidophilum and E. coli. HTa and HU are highlighted along with some additional chromatin-associated proteins. Data sources: T. acidophilum protein abundance: Sun et al. (2010); E. coli protein abundance: Lu et al. (2007). E. coli transcript abundance is an average across three previous studies as reported by Lu et al. (2007).
Figure 2 with 1 supplement

Phylogenetic relationships of HU family proteins from bacteria, eukaryotes, and archaea.
(a) Protein-level phylogenetic tree of HU proteins including HTa (see Materials and methods for details on phylogenetic reconstruction). The tree is midpoint-rooted. Reported domain-level membership (Bacteria, Archaea, etc.) of different proteins is color-coded in the outer circle and on the dotted lines that point to individual branches. See main text and Materials and methods for a critical evaluation of domain assignments and likely assembly contaminants. Bootstrap support values (%) for individual branches, visually encoded as node diameters, illustrate poorly resolved relationships at deeper nodes. (b) Excerpt of the phylogeny shown above, highlighting good support (84%) for a monophyletic origin of HU proteins in the Thermoplasmatales/DHVE2 clade and their uncertain affiliation to other HU family members.
Figure 2—figure supplement 1
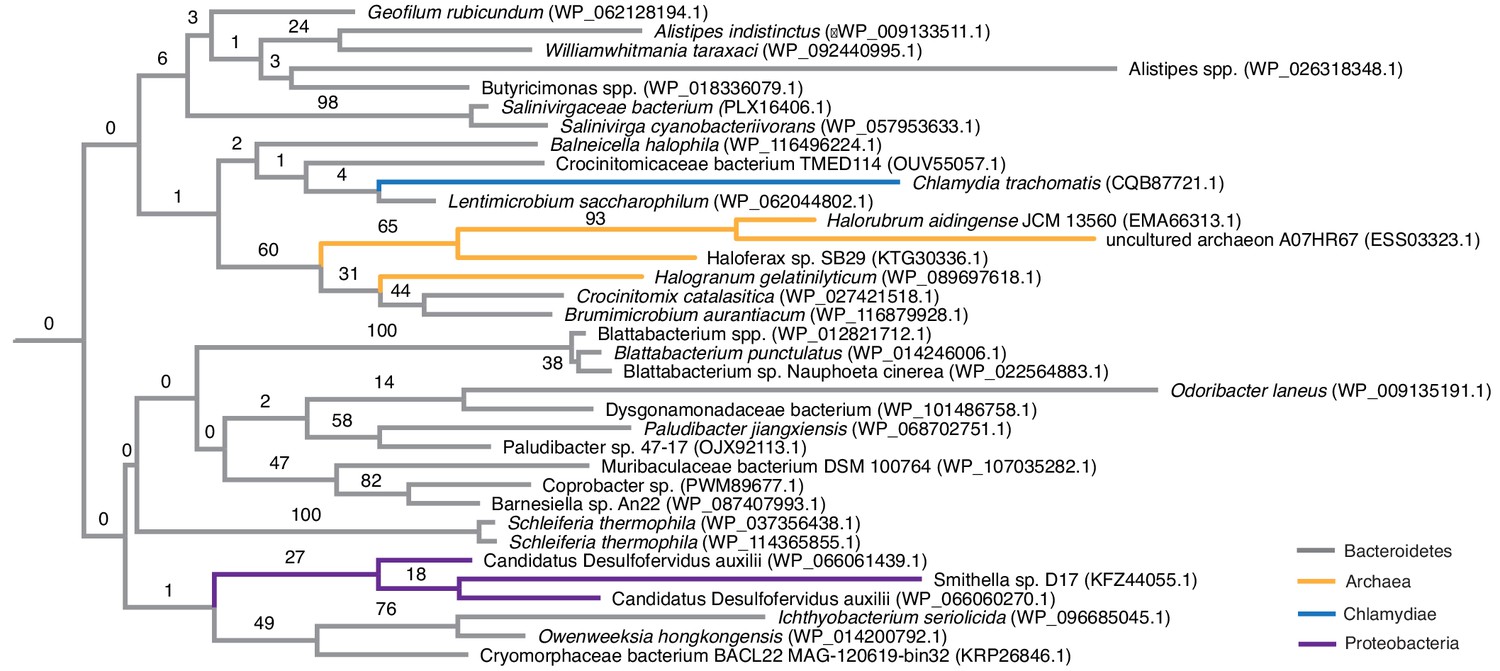
Phylogenetic placement of HU proteins attributed to halophilic archaea.
The phylogenetic tree shown is an excerpt of the protein-level HU family tree shown in Figure 2, focussing on sequences from halophilic archaea (orange), which cluster mainly with sequences of bacteria from the phylum Bacteroidetes (gray). As is true for the majority of the HU protein tree, deeper ancestral relationships are poorly resolved.
Figure 3 with 4 supplements
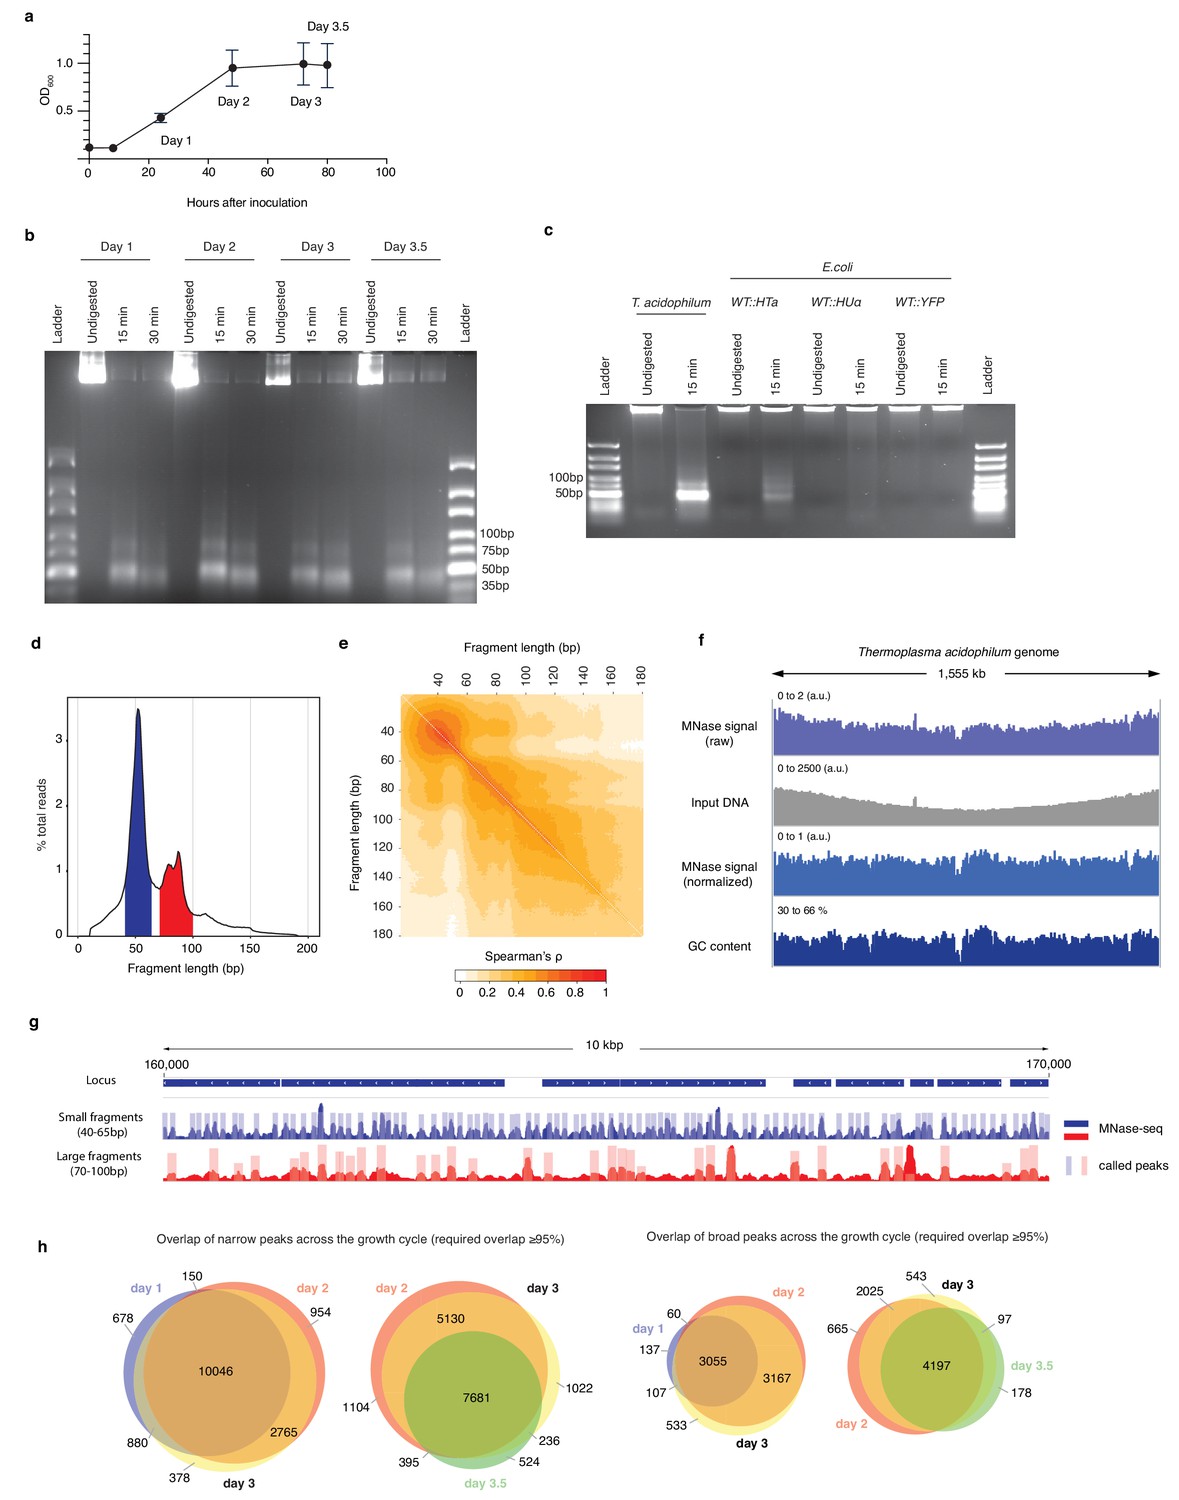
HTa-mediated primary chromatin architecture in T. acidophilum mapped by MNase-Seq.
(a) Growth curve of T. acidophilum as determined using optical density (OD600). Time points used for downstream experiments are indicated (means and ± SEM across four biological replicates). (b) Agarose gel of MNase digestion products from T. acidophilum sampled across the growth cycle. Growth phases are given as days after inoculation, digestion time in minutes. (c) Agarose gel of MNase digestion products from T. acidophilum (day 2) along with digestion products of E. coli ectopically expressing HTa, HupA or YFP (see Materials and methods). (d) Distribution of the lengths of fragments mapped to the T. acidophilum genome (pooled across all four replicates from day 2), highlighting fragment size ranges that correspond to small (blue) and large (red) fragments, as defined in the main text. (e) Correlation matrix comparing genome-wide MNase-Seq coverage signal, computed at base-pair resolution, between reads of defined sizes (pooled replicates, day 2). (f) Genome-wide MNase-Seq signal prior to and after normalization with sonicated DNA input (see Materials and methods), along with GC content profile along the T. acidophilum chromosome, computed using a 51 bp moving window. (g) Example of coverage and called peaks across a 10 kb region of the T. acidophilum chromosome. (h) Overlap of detected narrow and broad peaks across the growth cycle. Note that different sections/overlaps are only qualitatively but not quantitatively proportional to absolute peak numbers.
Figure 3—figure supplement 1
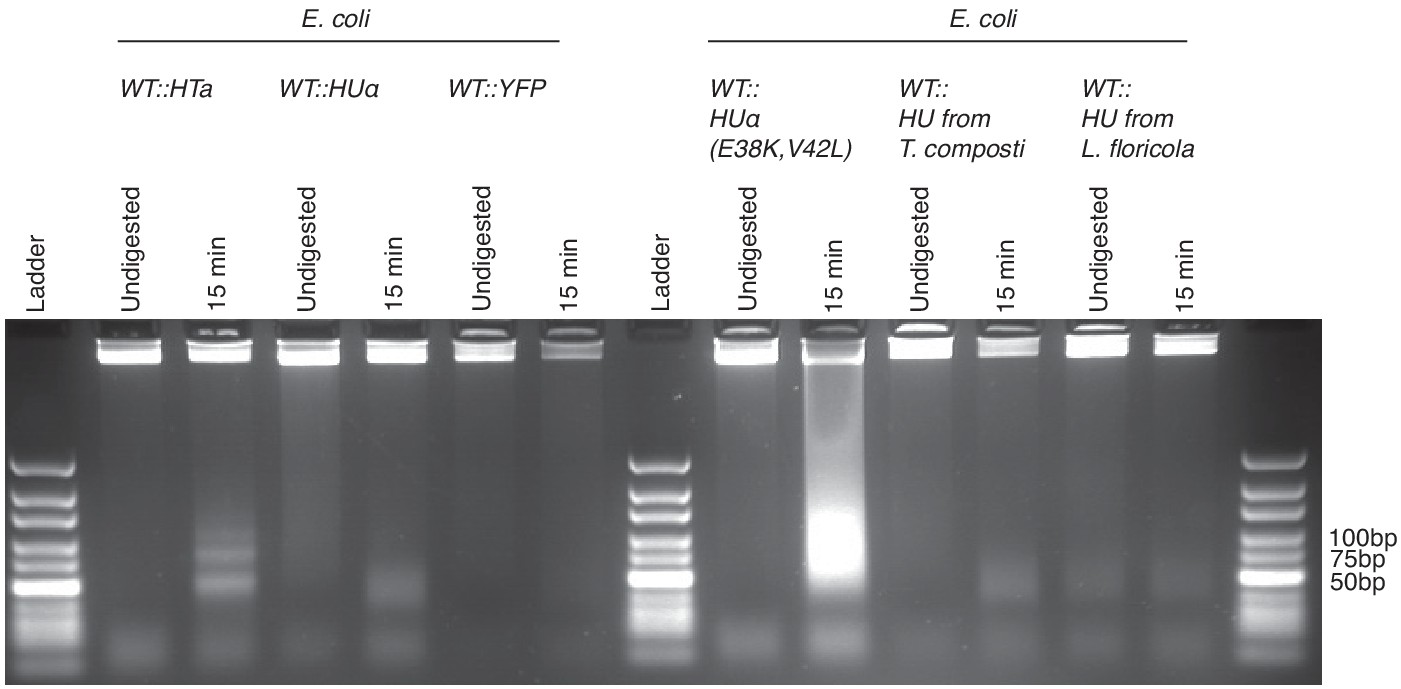
Agarose gel (3%) of MNase digestion products from T. acidophilum (day 2) along with digestion products of E. coli ectopically expressing either HTa, HupA, YFP, HupA (E38K,V42L), HU from T. composti or HU from L. floricola, from the same plasmid backbone.
HupA (E38K,V42L) is a mutant that had previously been shown to induce extreme compaction of the E. coli nucleoid (Kar et al., 2005).
Figure 3—figure supplement 2
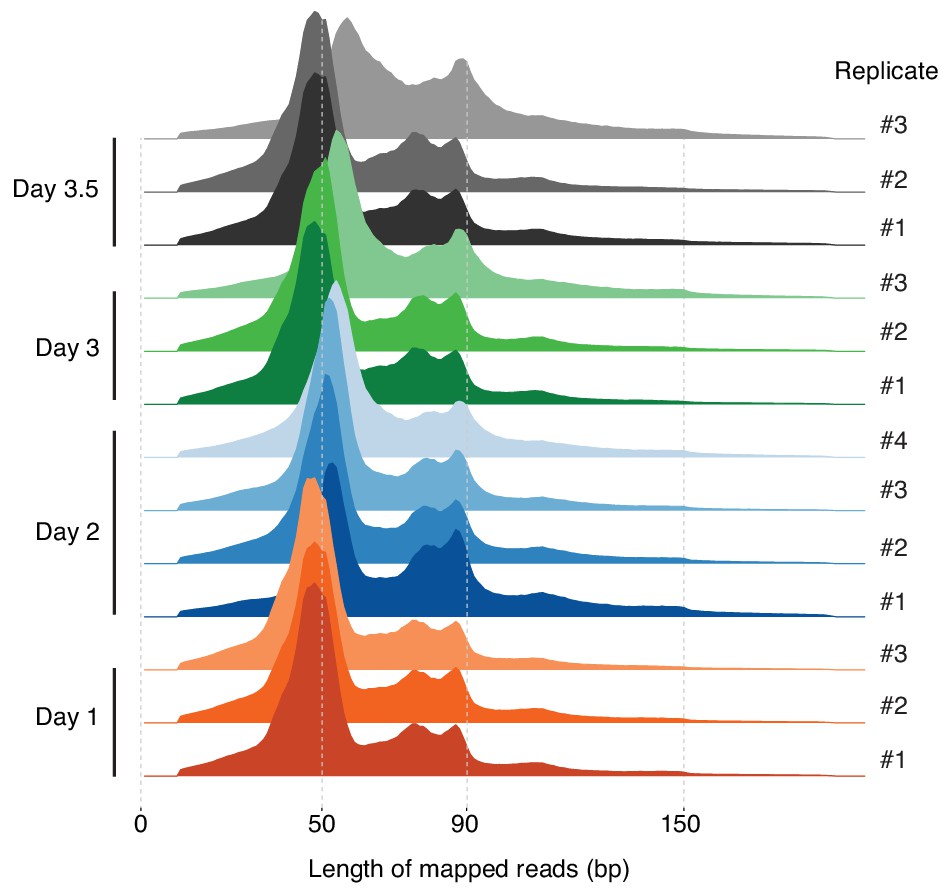
Distribution of the lengths of fragments mapped to the T. acidophilum genome for all replicates across the growth cycle.
Figure 3—figure supplement 3
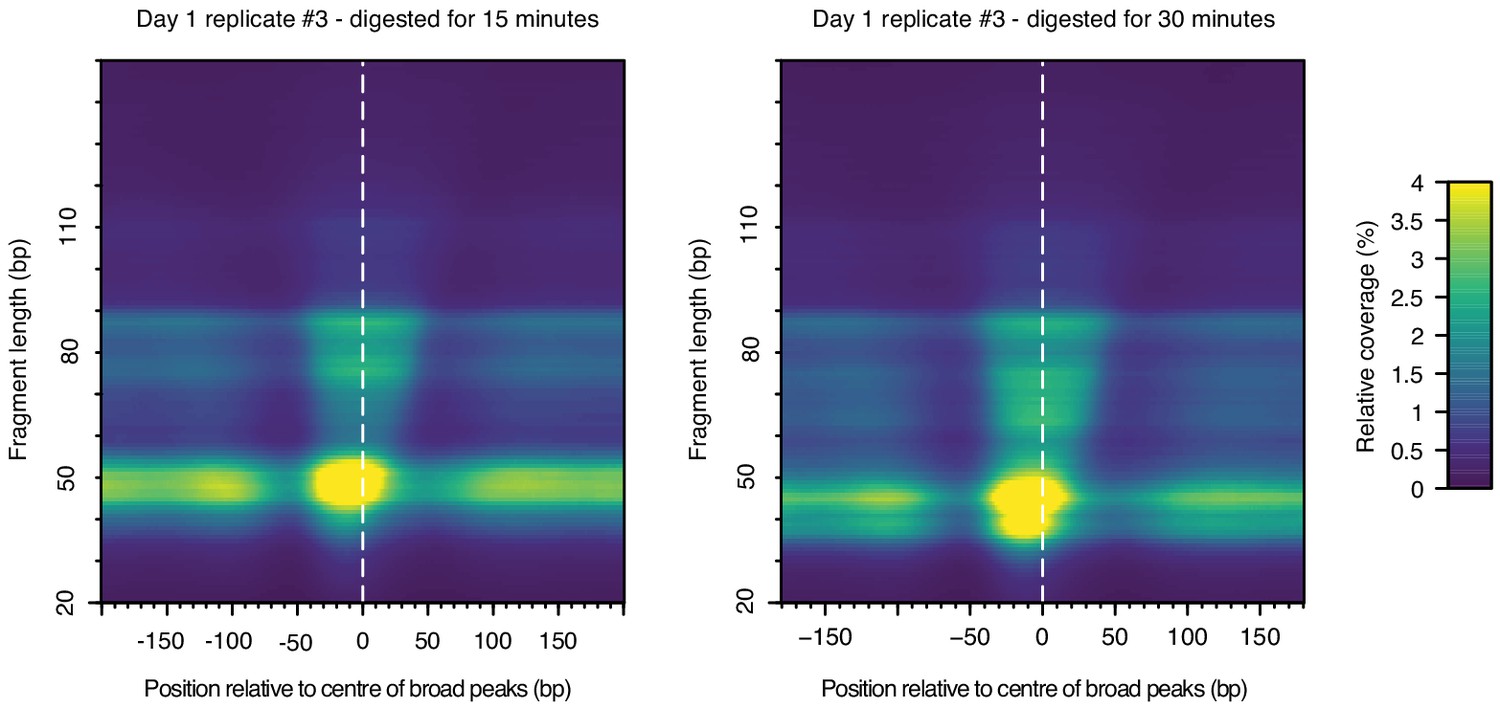
Heat maps indicating MNase-seq coverage by fragment length relative to the center of broad peaks in T. acidophilum, for the same sample (day1, replicate 3), digested for either 15 or 30 min.
Figure 3—figure supplement 4
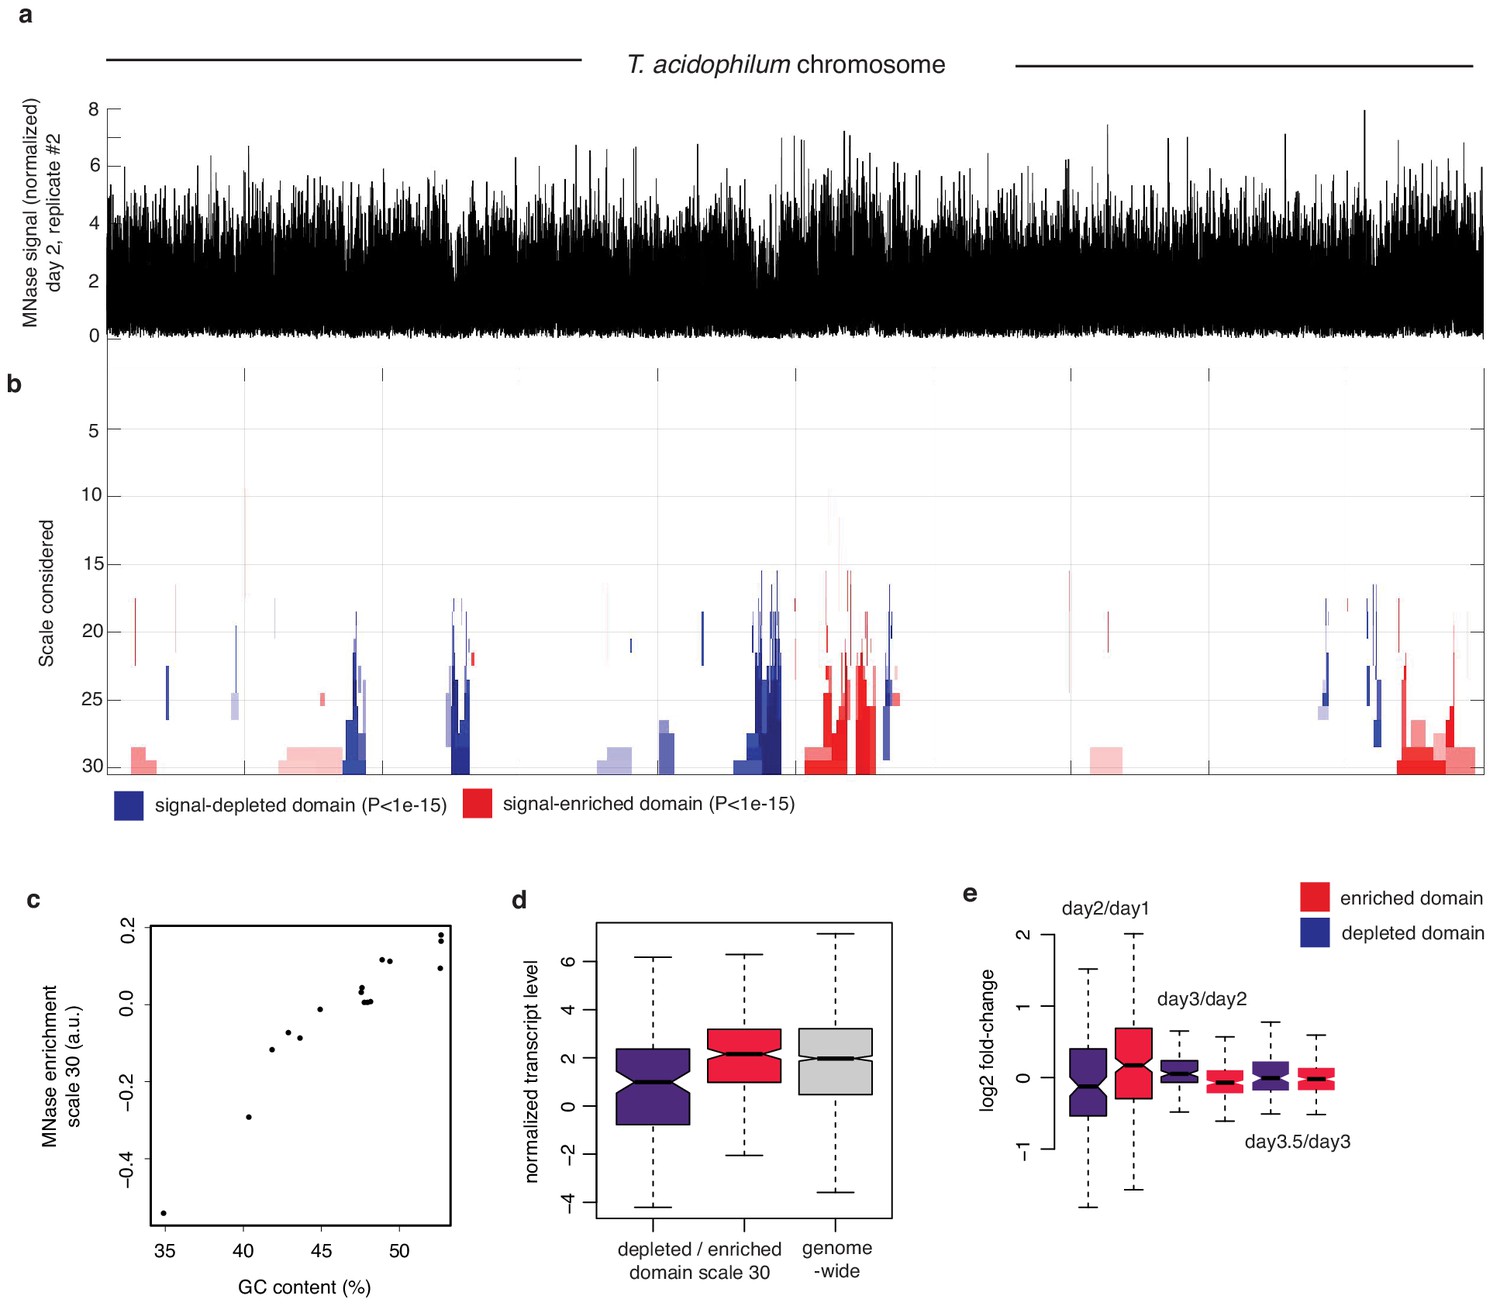
Multiscale analysis of MNase signal.
(a) Chromosome-wide MNase-Seq coverage along the T. acidophilum chromosome (day2, replicate 2), normalized using sonicated DNA to remove replication-associated coverage bias. (b) Multiscale analysis of MNase signal enrichment (see Materials and methods). Significantly enriched or depleted (p-value<1.e-15) segments are color-coded red and blue, respectively. Scales correspond to increasing window sizes over which enrichment is computed. (c) Enrichment signal of significantly MNase-signal-enriched or -depleted genomic domains at scale 30 as a function GC content. (d) Normalized transcript levels for pooled depleted or enriched domains at scale 30 and (e) corresponding log2-fold changes in transcript levels.
Figure 4 with 3 supplements

Asymmetric coverage signals around peaks in T. acidophilum and M. fervidus that track underlying nucleotide content.
(a) Empirical example and (b) schematic describing our approach to re-orienting coverage signals at broad peaks based on the coverage of small fragments around the dyad axis. (c, d) Heat maps illustrating MNase-seq coverage by fragment length relative to the center of narrow and broad peaks in T. acidophilum. Coverage around broad peaks is oriented as explained in (b). (e) Analogous heat map illustrating coverage by fragment length relative to the center of large peaks (corresponding to the binding footprints of octameric histone oligomers) in M. fervidus. (f, g, h) Normalized coverage for T. acidophilum small (40–65 bp) and large (70–100 bp) fragments and M. fervidus fragment ranges corresponding to the expected footprint sizes of histone tetramers, hexamers, and octamers. (i, j, k) Proportion of SS (=CC|CG|GC|GG) and WW (=AA|AT|TA|TT) dinucleotides at the same relative positions as (c, d, e). Dotted lines indicate the proportion of SS or WW dinucleotides expected by chance, estimated via random sampling of 25000 regions of equal size in each genome.
Figure 4—figure supplement 1
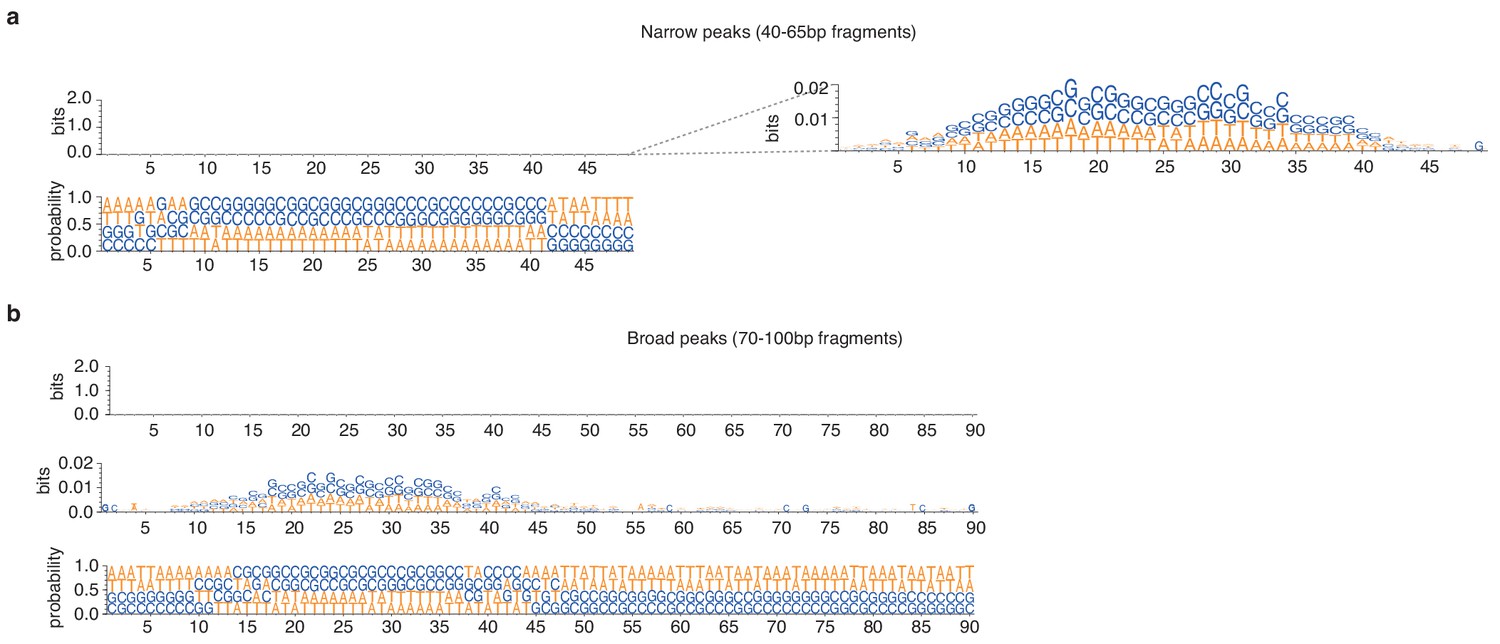
Weblogos of bitscores and nucleotide occurrence probabilities at (a) narrow and (b) broad peaks detected during exponential phase in T. acidophilum.
Information content is so low that the bitscore plots appear empty when using the common 0–2 bit visualization range. Logos are only visible when zooming in on the 0–0.02 range.
Figure 4—figure supplement 2
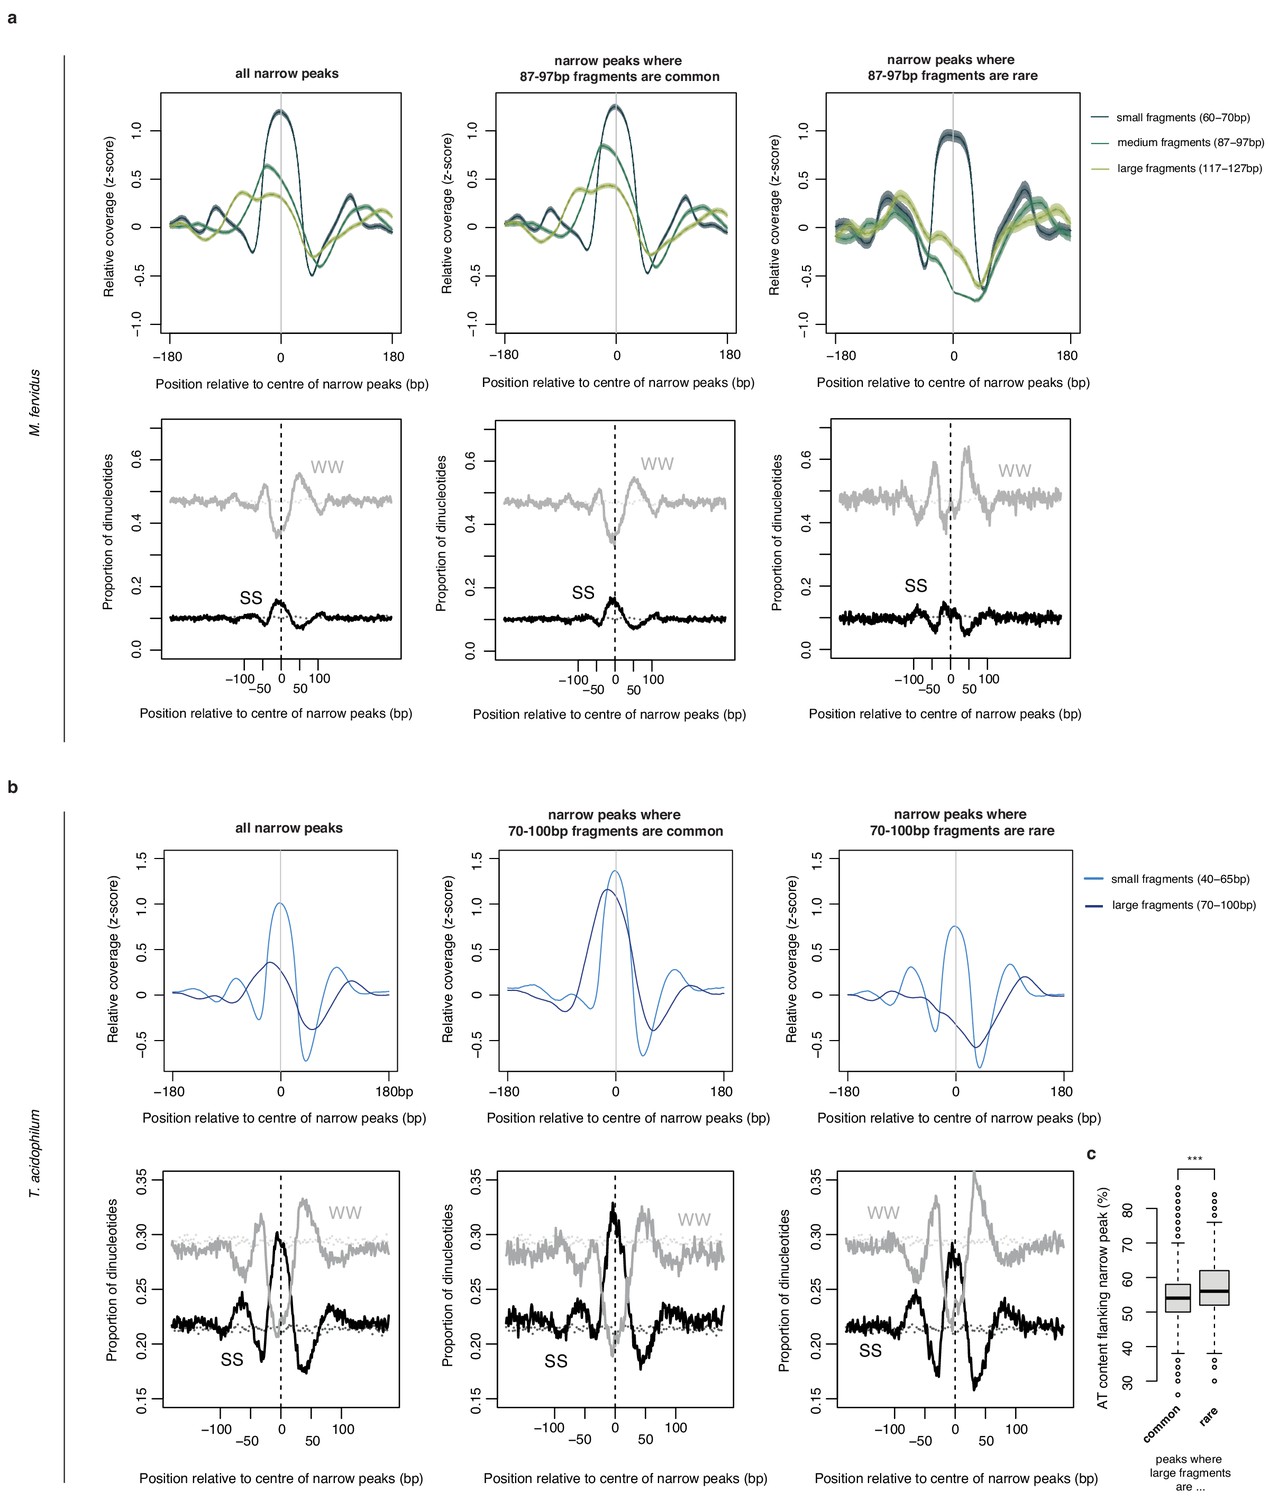
Normalized MNase-Seq coverage relative to the center of narrow peaks oriented according to the abundance of (a) 87–97 bp fragments in M. fervidus and (b) 70–100 bp fragments in T. acidophilum.
Middle and right panels are focused on peaks where 87–97 bp (70–100 bp) fragments are common or rare, respectively. Lower panels display the proportion of SS (=CC|CG|GC|GG) and WW (=AA|AT|TA|TT) dinucleotides at locations matching the upper panels. Dotted lines indicate the proportion of SS or WW dinucleotides expected by chance, estimated by randomly sampling 25000 regions per genome. (c) AT content in the flanks of narrow peaks (defined across the two windows 25–50 bp either side of the center of the peak) is higher at peaks where large fragments are rare (t-test, ***p<2.2×10⁻¹⁶).
Figure 4—figure supplement 3
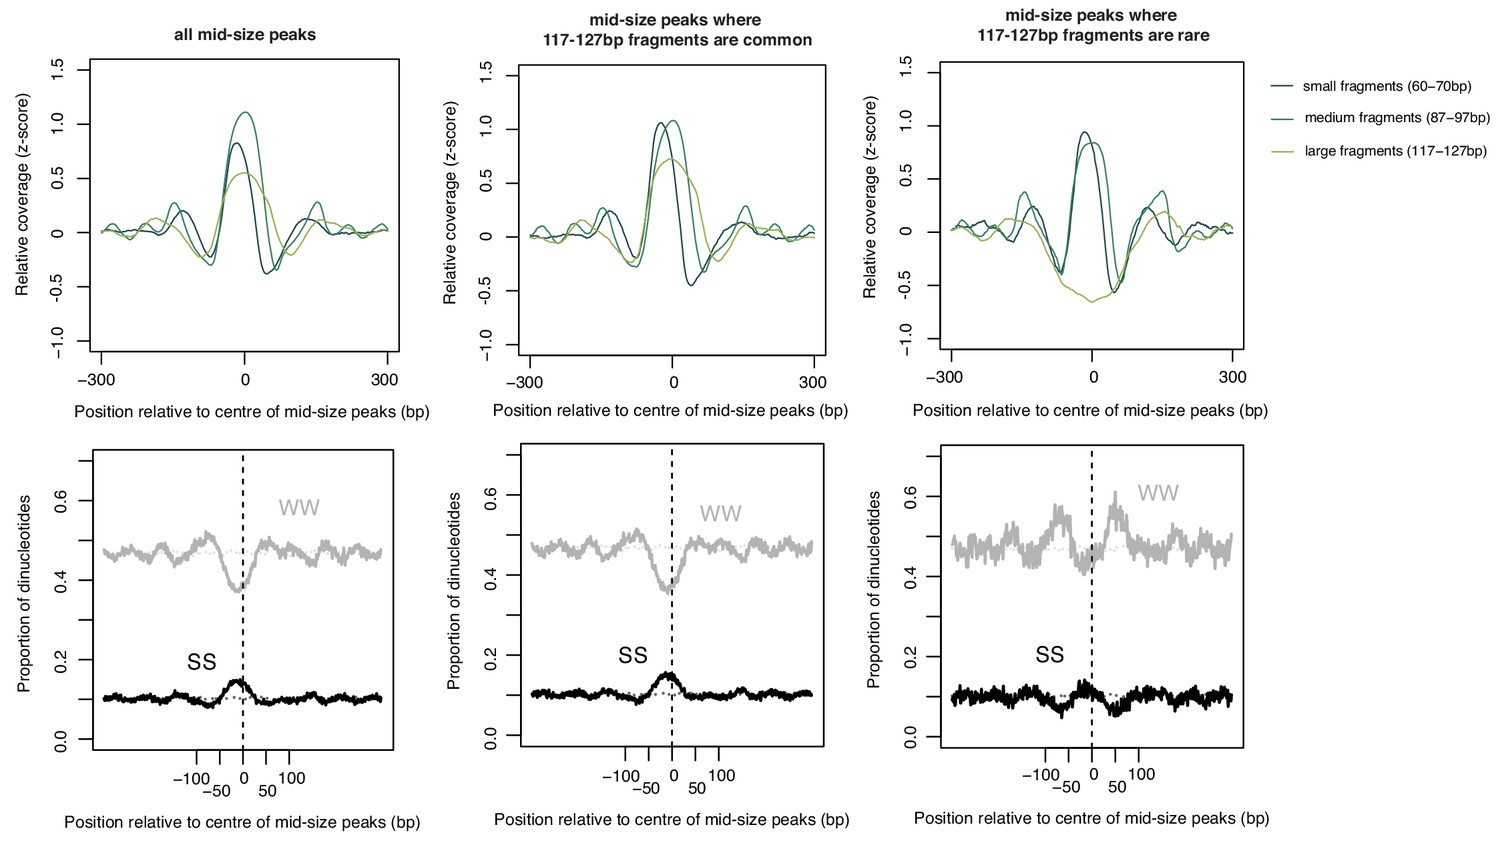
As in Figure 4—figure supplement 2 but for 87–97 bp peaks scored according to 117–127 bp fragments and oriented according to 60–70 bp fragments.
Note the increase in WW content flanking the smaller-sized peaks that do not get extended further.
Figure 5 with 2 supplements
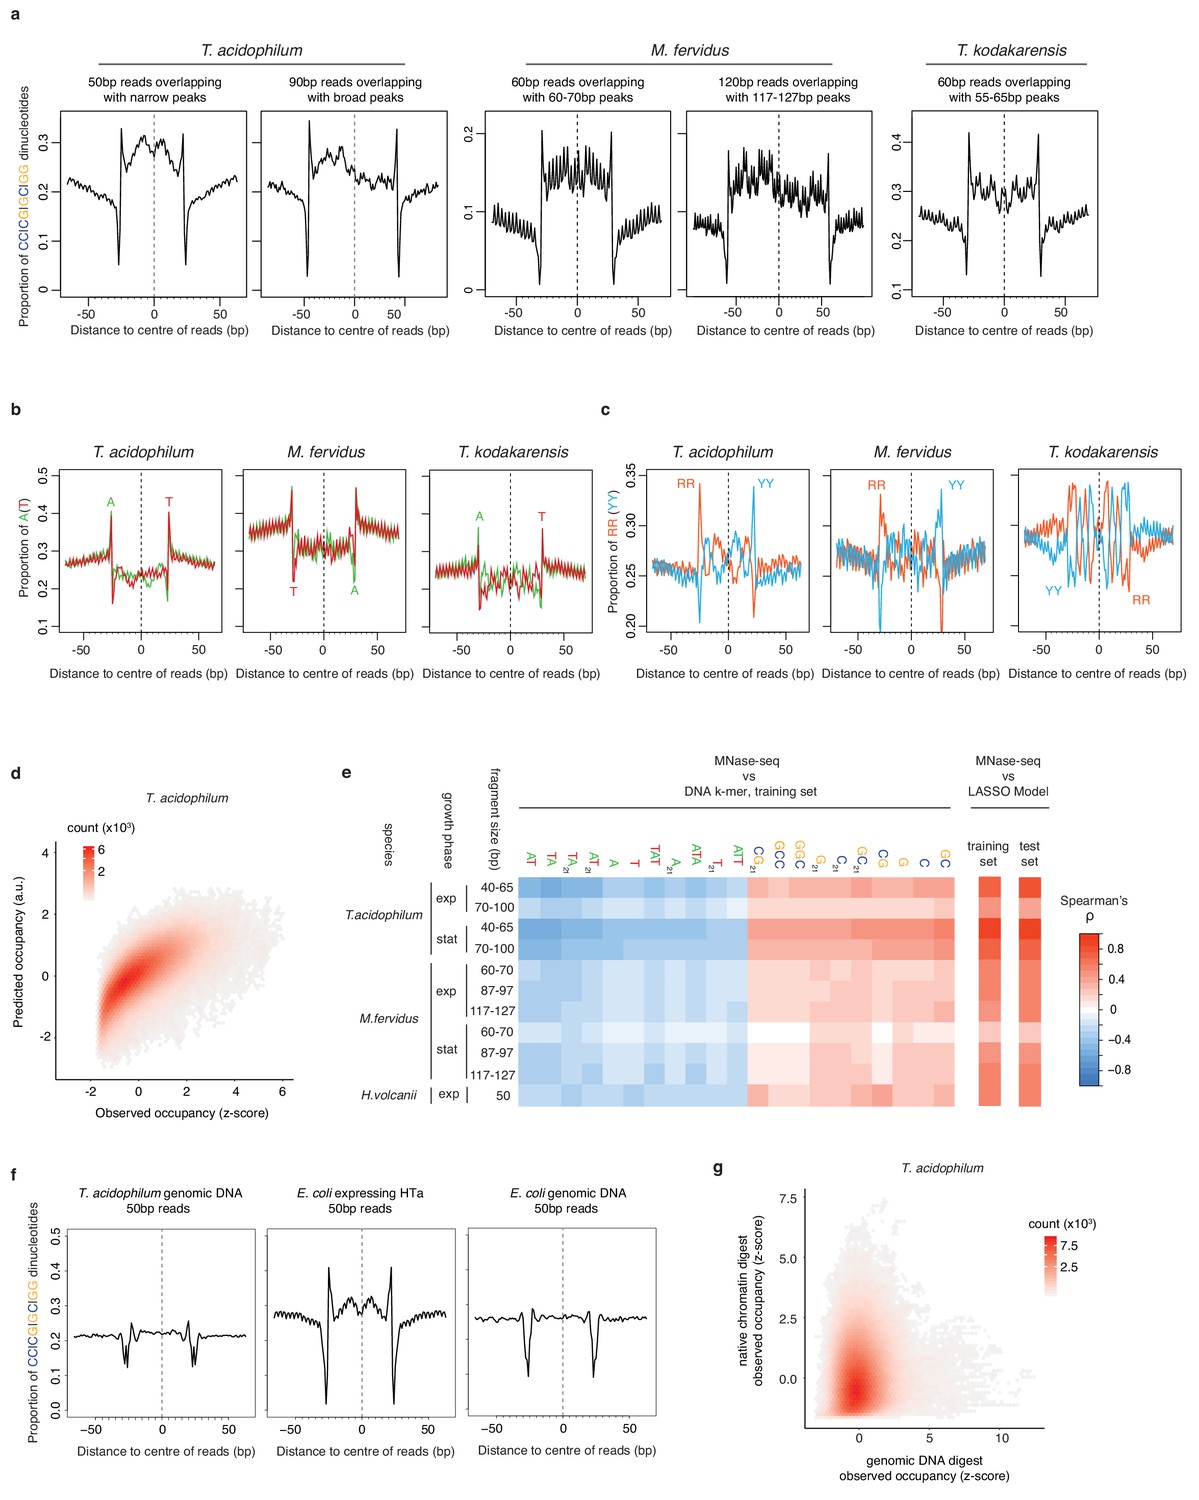
Comparison and predictive power of nucleotide enrichment patterns associated with HTa and archaeal histones.
(a) Proportion of SS (=CC|CG|GC|GG) dinucleotides, (b) A|T mononucleotides, and (c) RR (=purine/purine)|YY (=pyrimidine/pyrimidine) dinucleotides relative to the centers of reads of defined length in different archaeal species (see Materials and methods for read filtering). (d) Density plot comparing observed (day 2, replicate 2) and predicted MNase-Seq coverage across the part of the T. acidophilum chromosome not used for training. (e) Correlation between MNase-seq coverage and individual DNA k-mers with particularly high positive or negative correlation coefficients, as observed in the training data. Overall correlations between measured MNase-Seq coverage and coverage predicted by the LASSO model, for both trained and untrained data, are shown on the right-hand side. (f) Proportion of SS dinucleotides relative to the centers of 50 bp reads from digests of T. acidophilum genomic DNA, E. coli expressing HTa, and E. coli genomic DNA. (g) Genome-wide correlation of normalized occupancy between T. acidophilum genomic DNA and native chromatin digests.
Figure 5—figure supplement 1
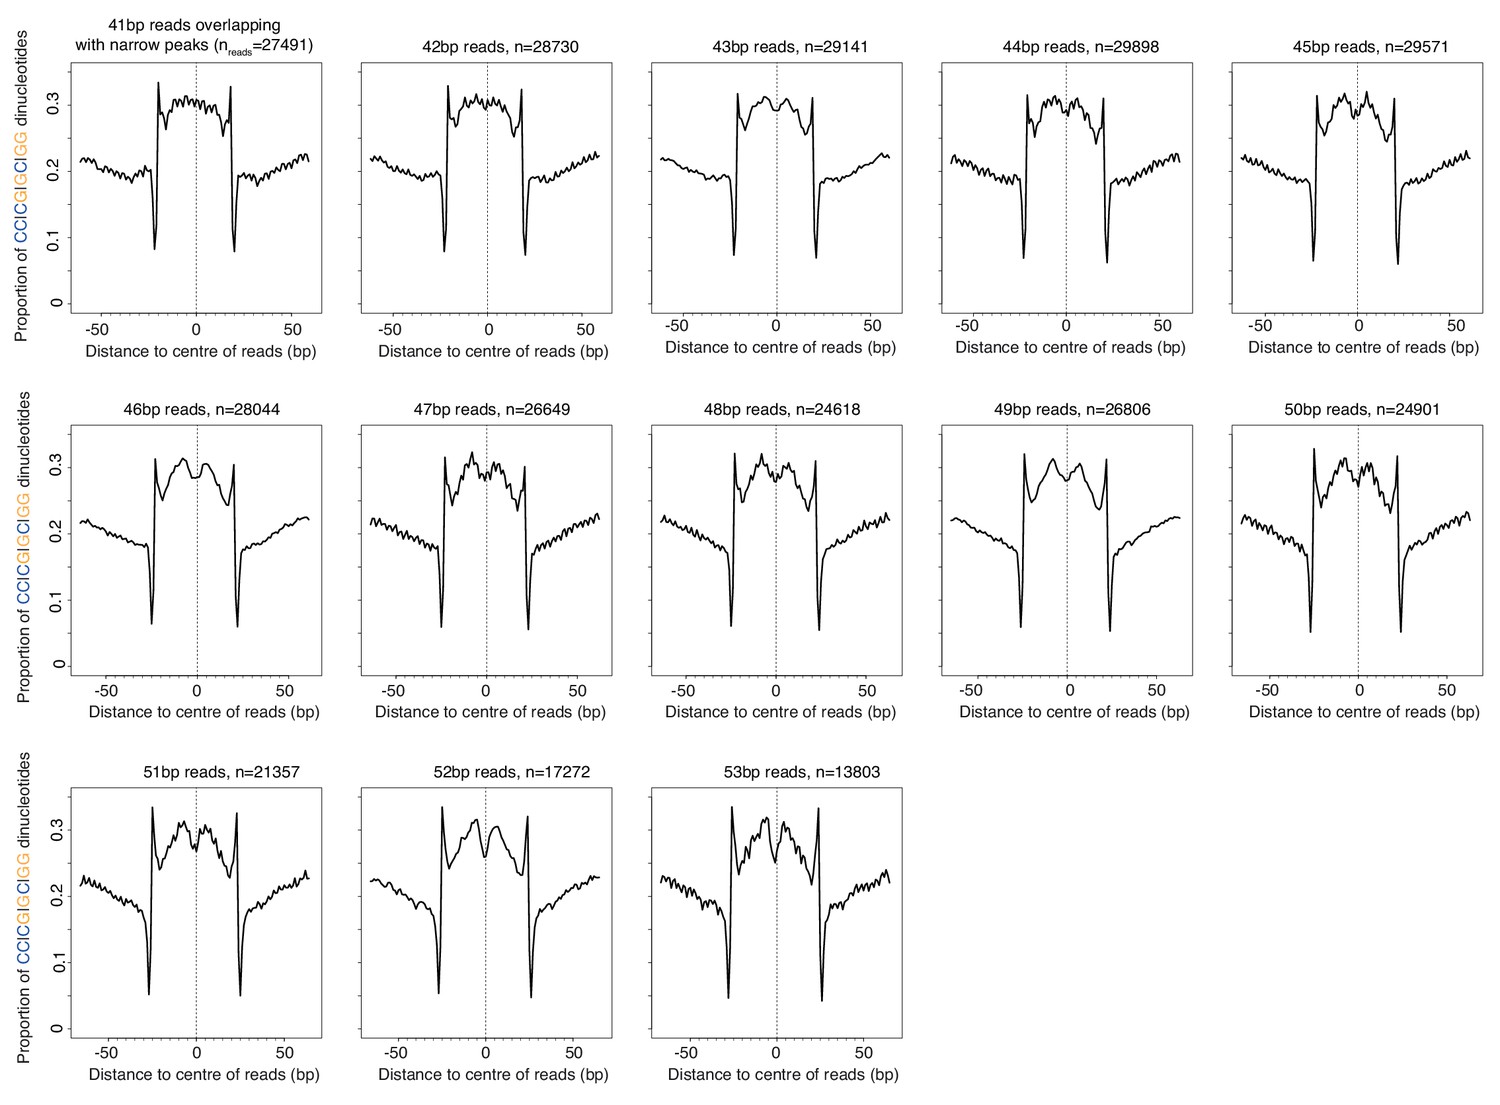
Proportion of SS (=CC|CG|GC|GG) dinucleotides relative to the centers of reads of defined length (41–53 bp) in T. acidophilum.
Figure 5—figure supplement 2
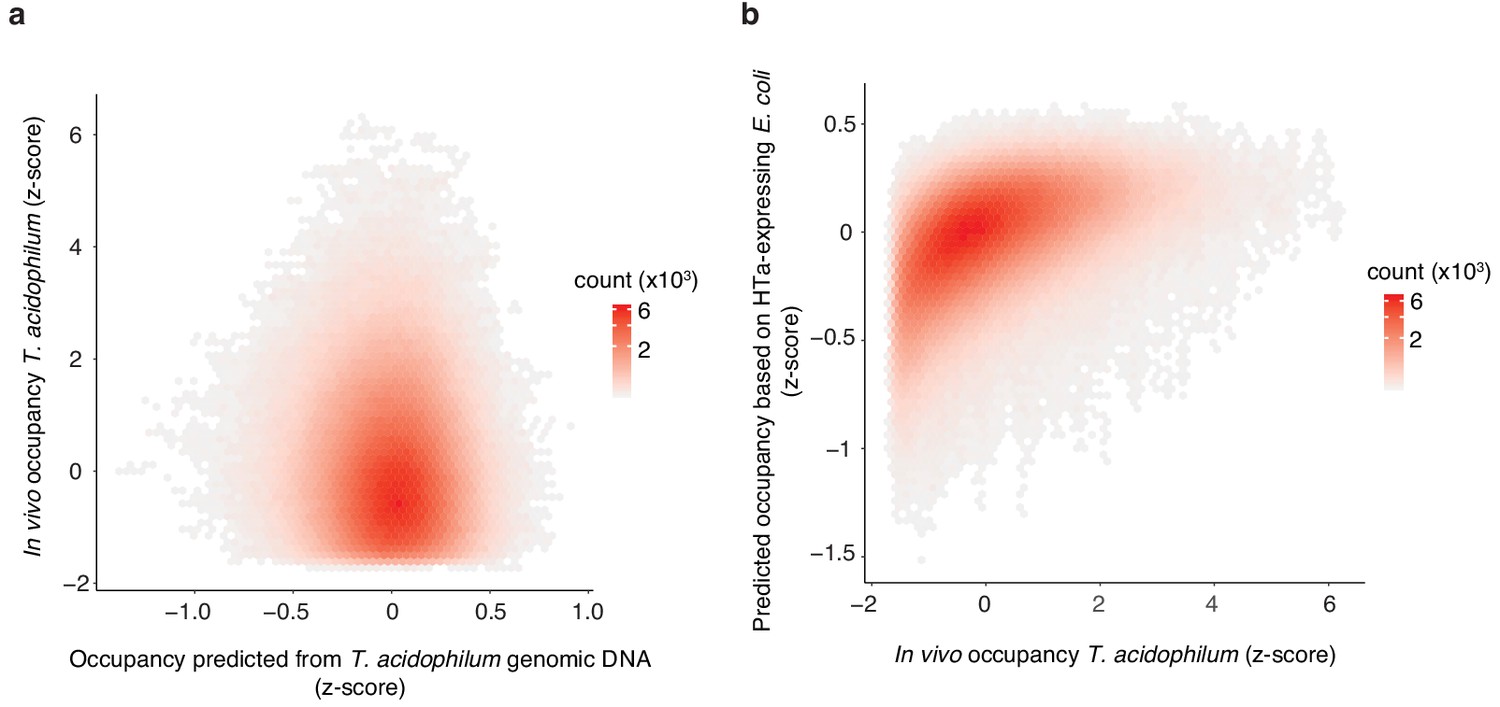
Predicting in vivo HTa occupancy.
(a) In vivo occupancy in T. acidophilum is poorly predicted by a Lasso model trained on a T. acidophilum naked DNA digest (rho = 0.07, p<2.2×10⁻¹⁶). (b) In contrast, in vivo occupancy in T. acidophilum is well predicted by a Lasso model trained on digestion fragments from HTa-expressing E. coli (rho = 0.54, p<2.2×10⁻¹⁶). All correlations/predictions are for short fragments.
Figure 6 with 4 supplements
In vitro experiments to assess HTa binding preferences.
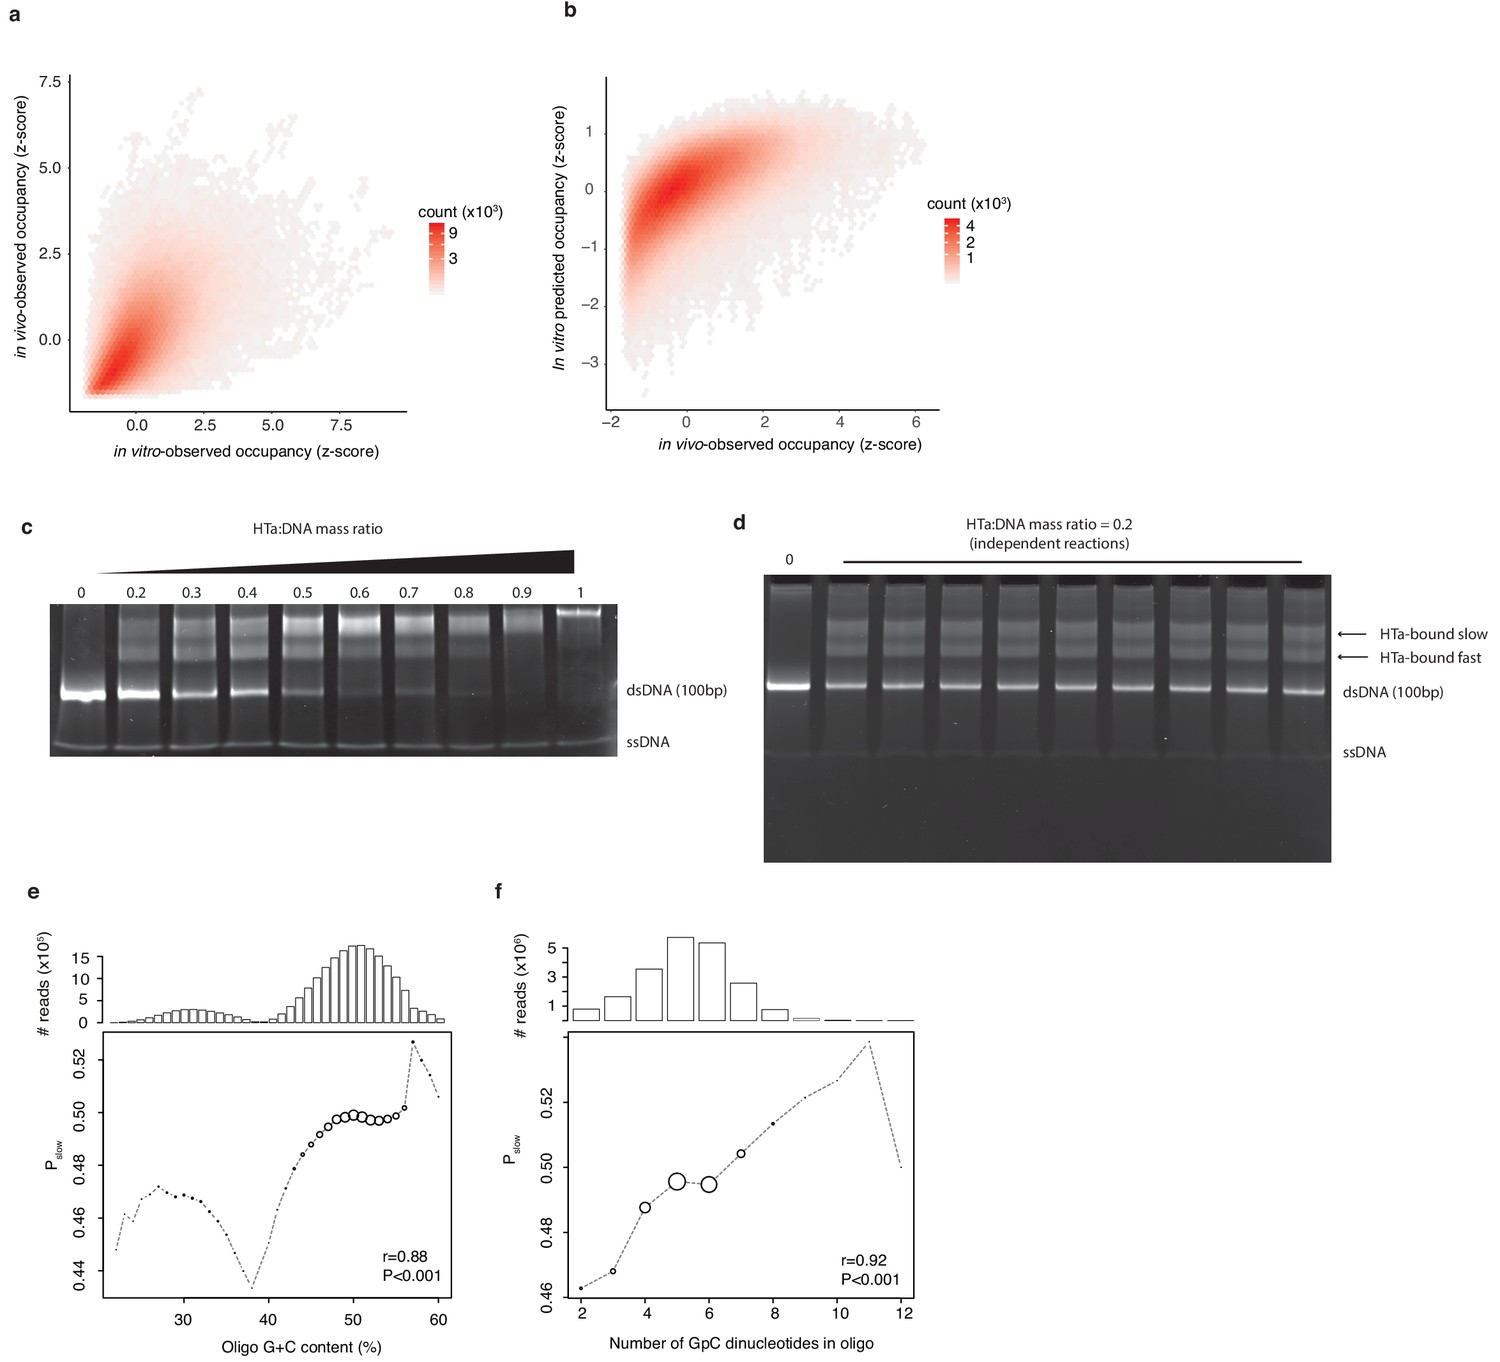
(a) Occupancy of small fragments across the T. acidophilum genome in vivo (day 2) correlates with occupancy following in vitro reconstitution and with (b) occupancy predicted by a Lasso model trained on the in vitro data. (c) EMSAs on libraries of sequence-variable dsDNA oligomers (see main text) in the presence of increasing amounts of HTa. (d) Independent reactions at a HTa:DNA ratio of 0.2 yield highly reproducible band shift patterns. (e) Pslow varies as a function of oligo G+C content and (f) GpC dinucleotide content. Point sizes are scaled according to the relative abundance of reads of a given G+C (GpC) content across the sequenced bands. The absolute number of reads analyzed is given in the panel above. Correlation coefficients (r) are from Pearson correlations between G+C (GpC) content and Pslow weighted by the number of reads at each G+C (GpC) content.
Figure 6—figure supplement 1
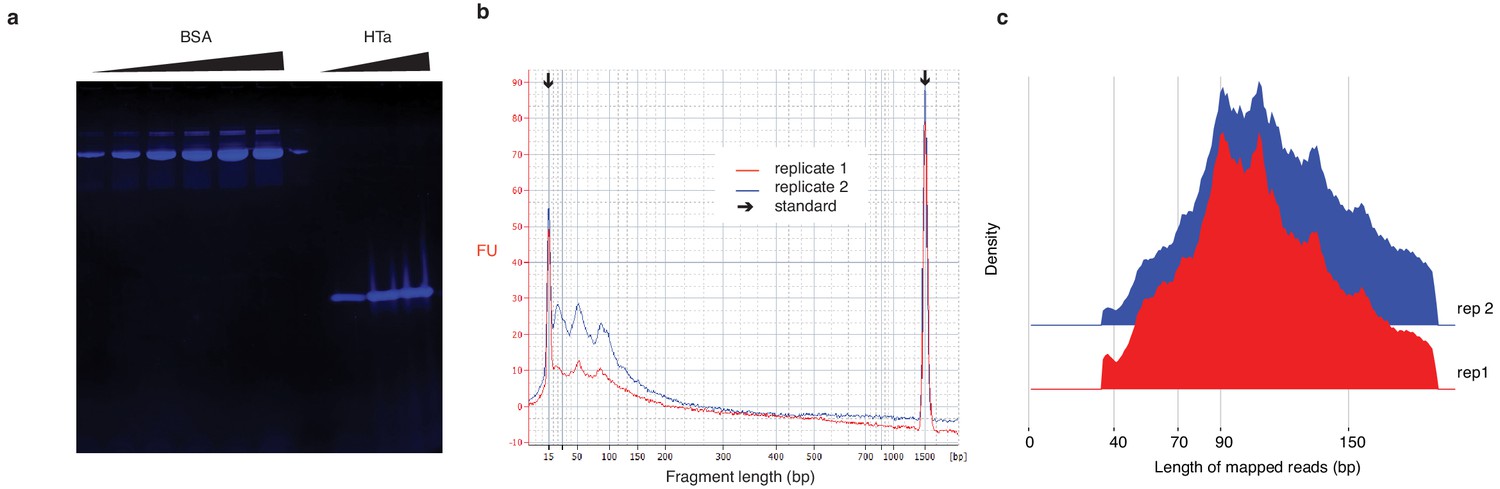
In vitro reconstitution of HTa:DNA nucleoprotein complexes.
(a) 16% TTS protein gel (Biorad) showing different concentrations of BSA (Biorad) and purified untagged HTa. (b) Bioanalyzer trace of in vitro chromatin reconstitution. Two replicates are superimposed. Major peaks are evident at 50 bp and ~ 90 bp in both replicates. (c) Distribution of the lengths of fragments from digested in vitro reconstitutions mapped to the T. acidophilum genome. Note that smaller fragments are much rarer than in (b). We believe this is likely the consequence of preferential amplification of larger fragments during sequencing library preparation. As we sequence to sufficient depth, however, we retain ample read coverage at smaller fragment sizes.
Figure 6—figure supplement 2
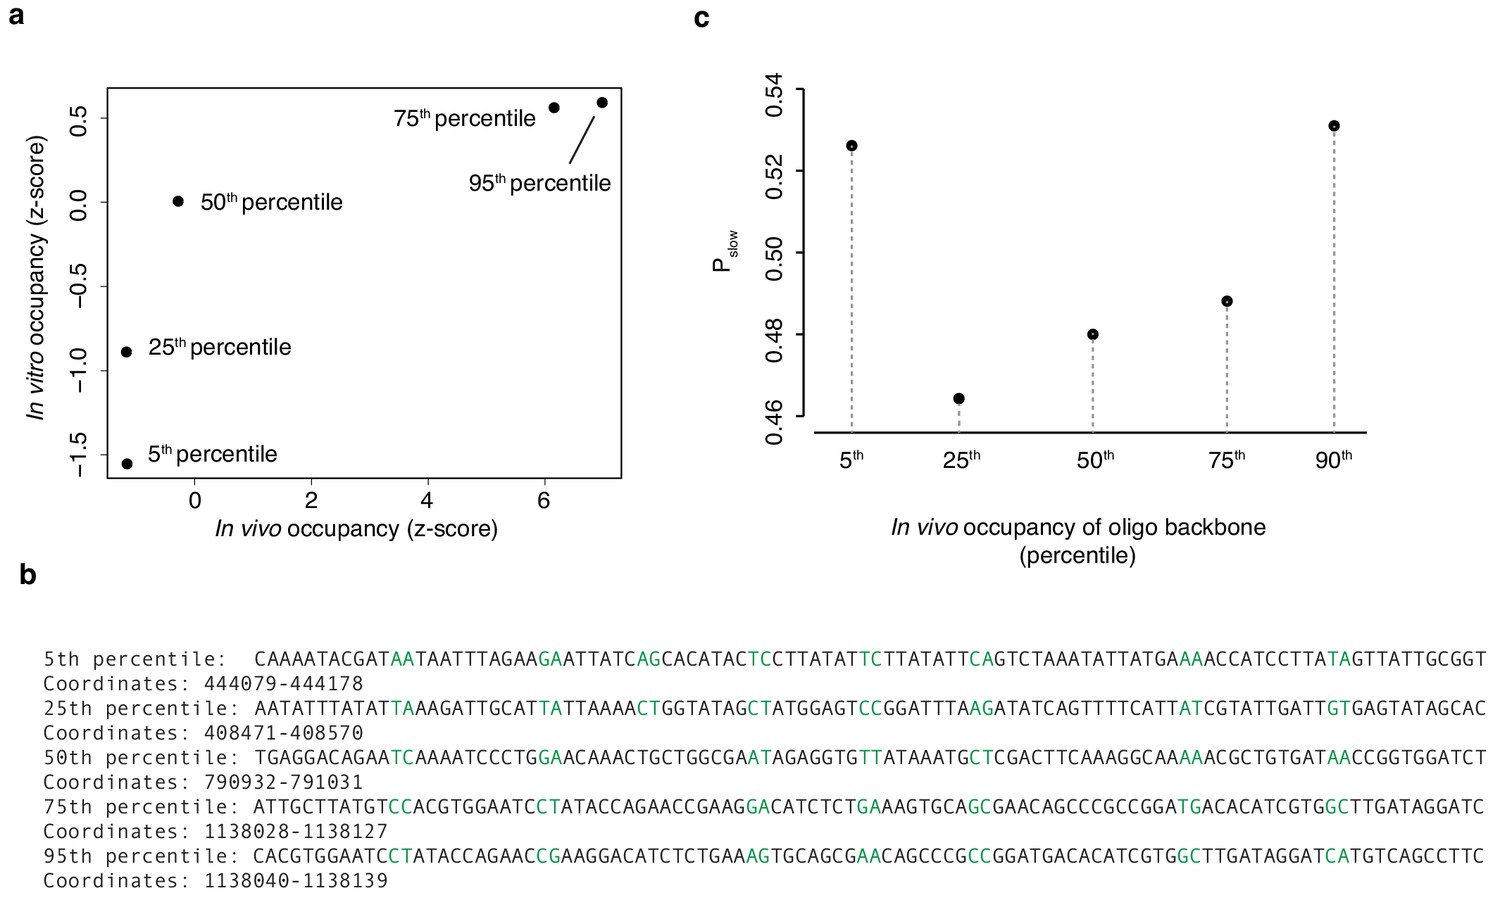
EMSA backbone sequences.
(a) In vivo occupancy (day 2) at five 100 bp regions detailed in (b) is correlated with in vitro occupancy. Randomized dinucleotides are highlighted in green. (c) The proportion Pslow of diversified oligos associated with a given oligo backbone in (b) recovered from the HTa-bound slow band (see Figure 6e). Values in (a) and (c) are based on pooled read data from two independent EMSA experiments. Trends visualized here are also observed for both replicates individually.
Figure 6—figure supplement 3
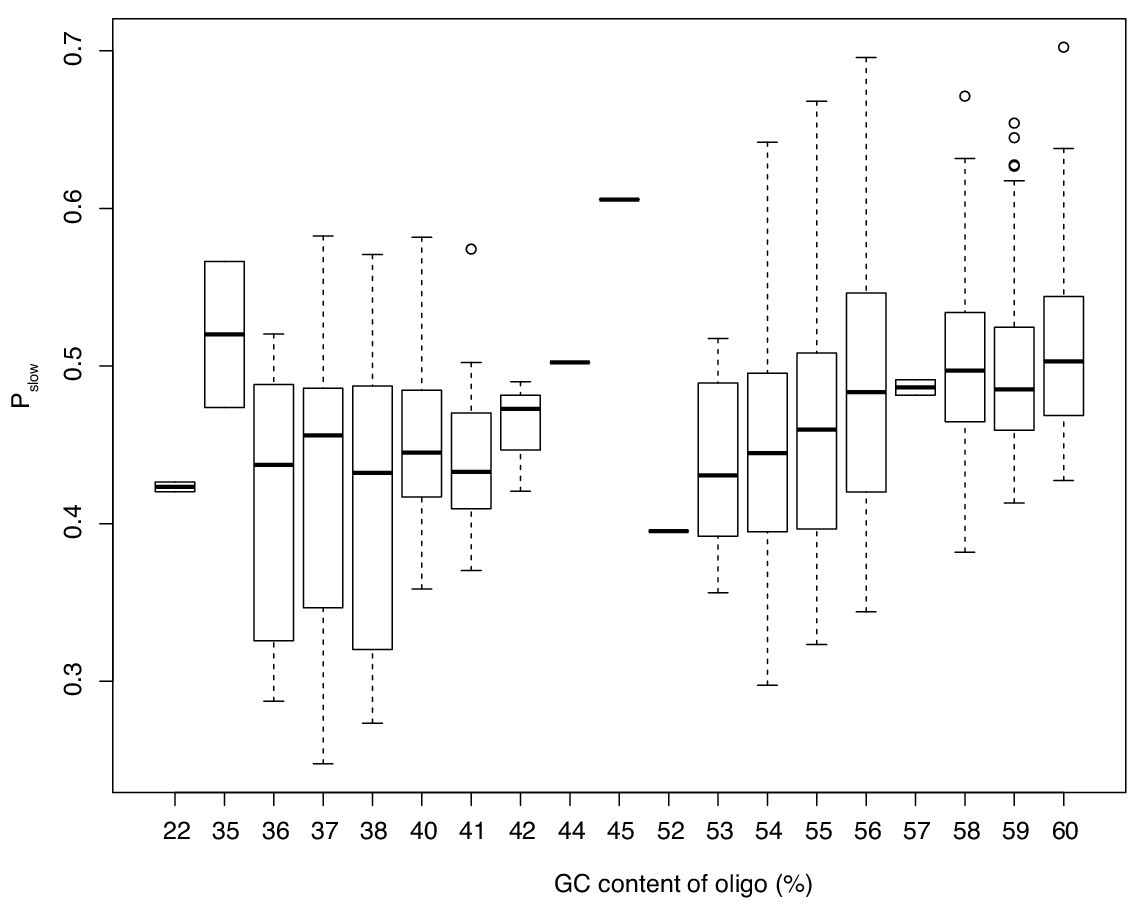
The relationship between GC content of an oligo and Pslow.
Only oligos represented by at least 200 sequenced reads are considered. This analysis shows that results in Figure 6e are not driven by few highly abundant oligos but represent the cumulative effect of different oligos acting in the same direction.
Figure 6—figure supplement 4
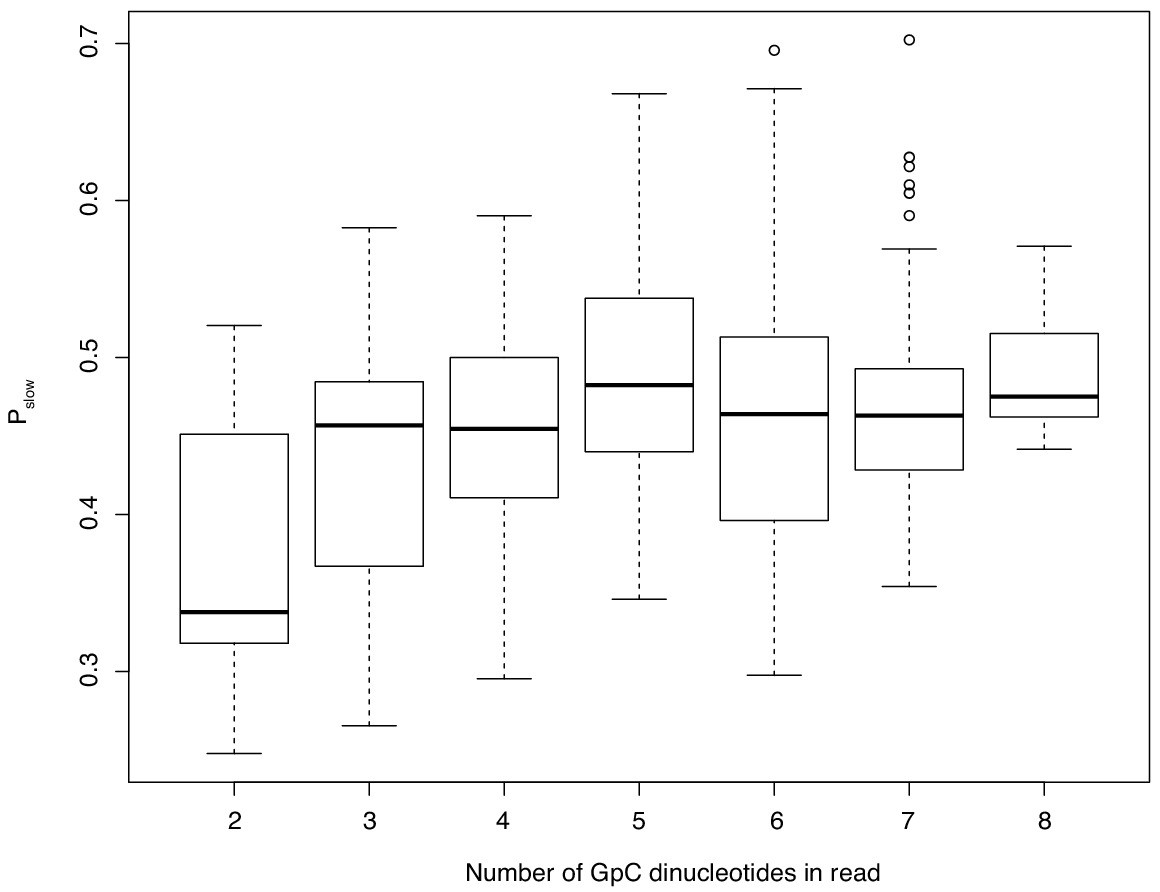
The relationship between GpC dinucleotide content of an oligo and Pslow.
Only oligos represented by at least 200 sequenced reads are considered. This analysis shows that results in Figure 6f are not driven by few highly abundant oligos but represent the cumulative effect of different oligos acting in the same direction.
Figure 7 with 1 supplement
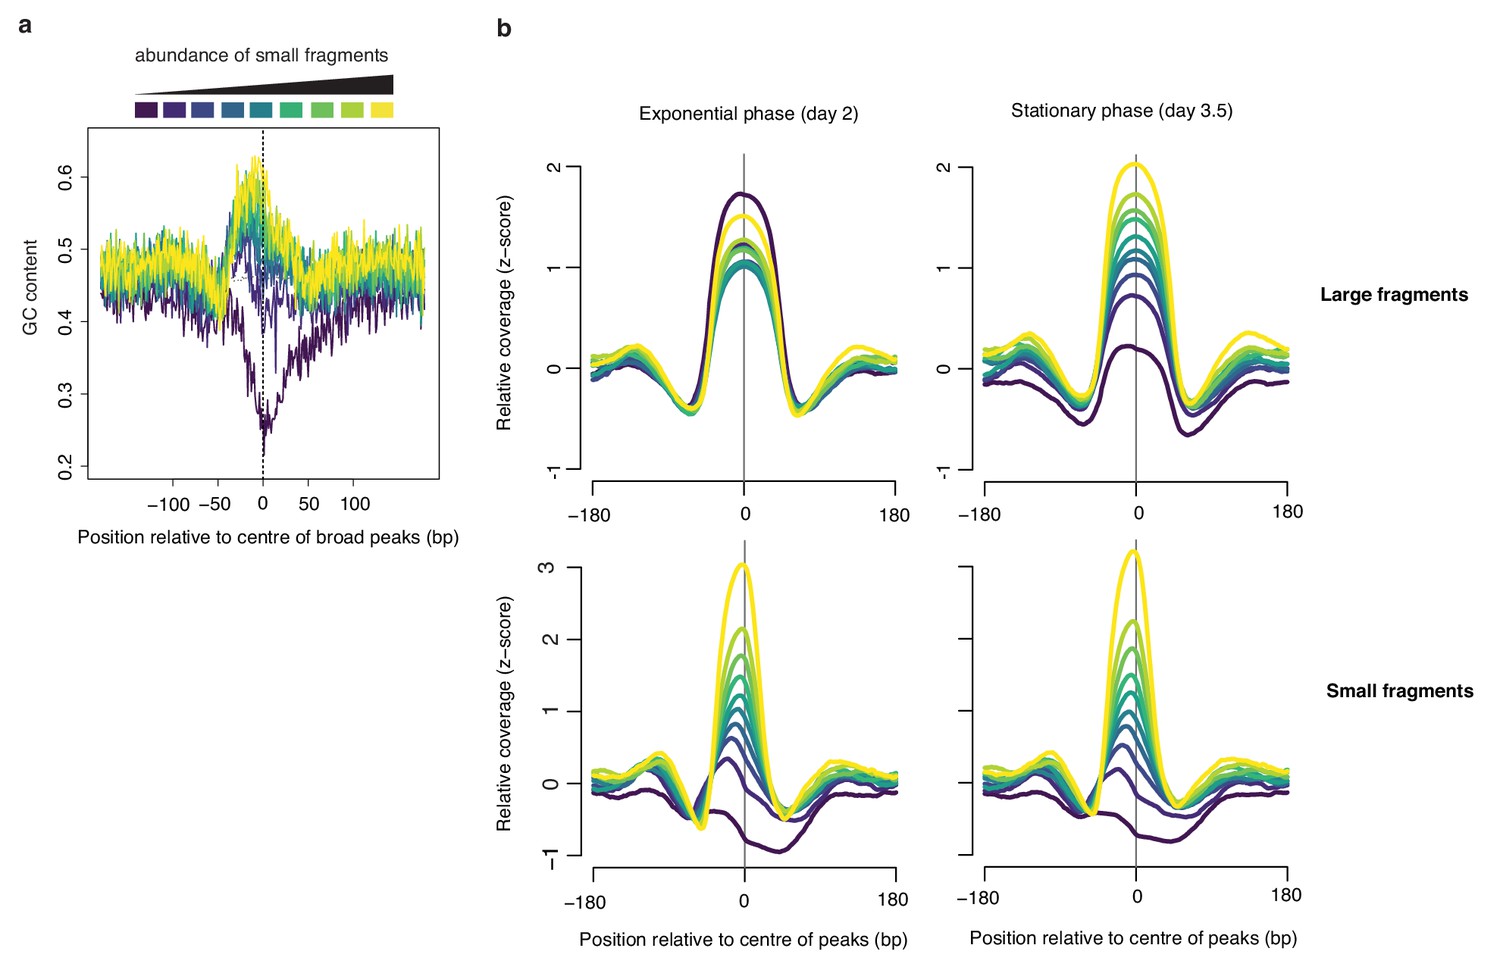
Broad peaks are associated with heterogeneous GC content in exponential but not stationary phase.
(a) Average GC content at broad peaks (day 2), separated into deciles based on the relative abundance of small fragments and (b) the corresponding relative coverage for large and small fragments during exponential and stationary phase. For all graphs, decile decomposition is based on small fragment occupancy during exponential phase (day 2).
Figure 7—figure supplement 1
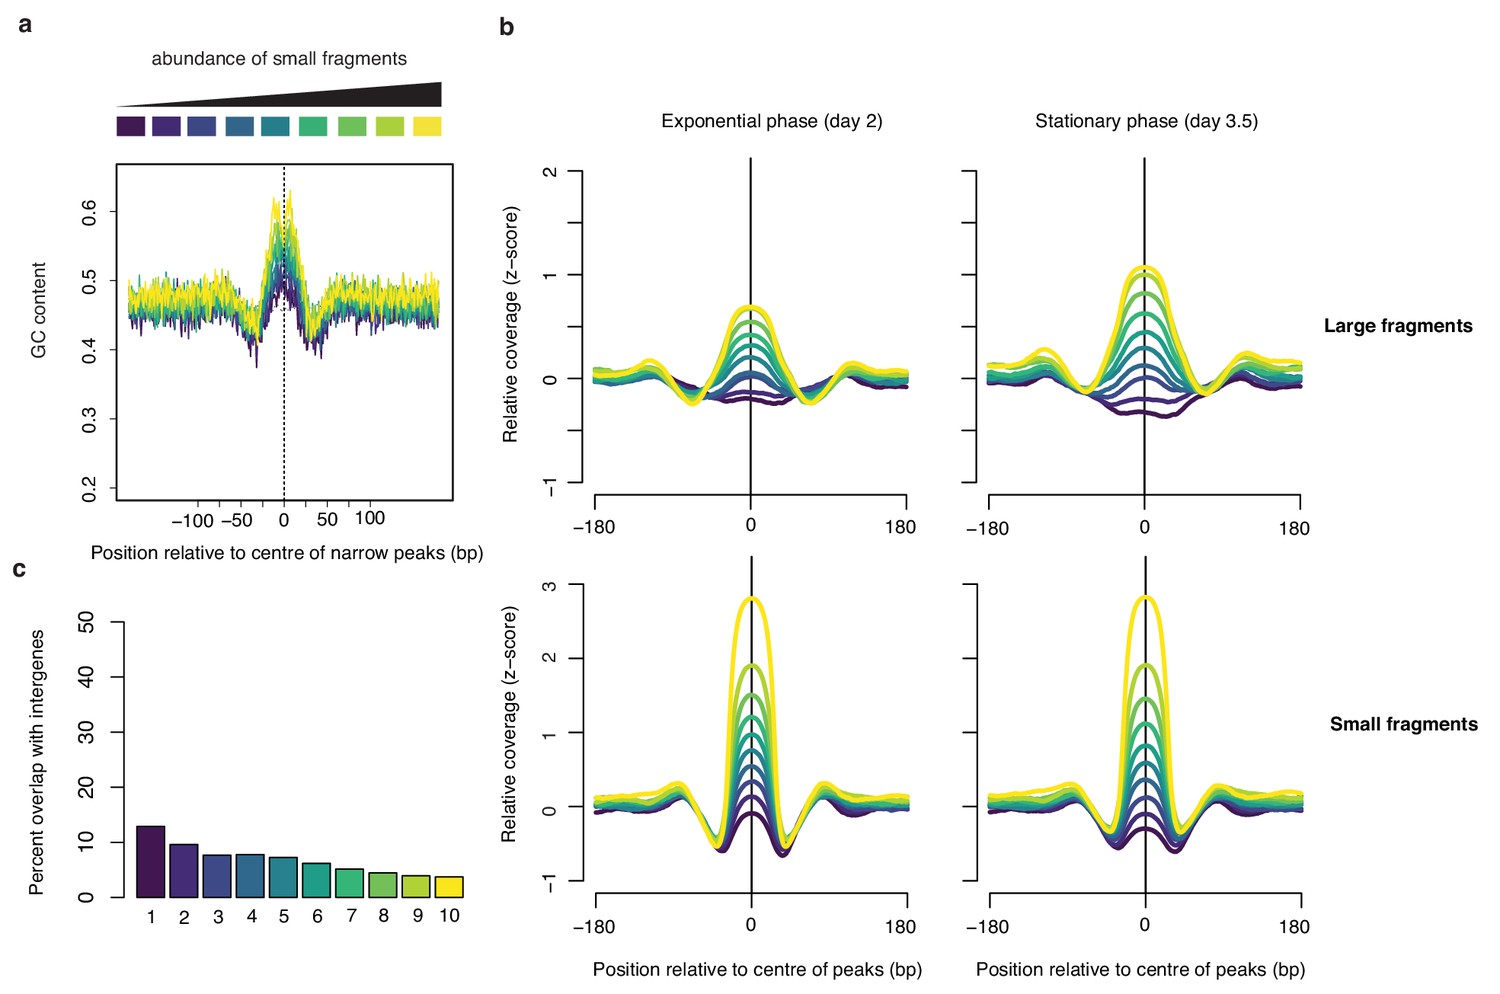
Small fragment abundance at narrow peaks.
(a) Average GC content at narrow peaks (day 2), separated into deciles based on the relative abundance of small fragments. (b) corresponding relative coverage for large and small fragments during exponential and stationary phase. (c) Percentage of overlap between narrow peaks and intergenic regions. For all graphs, decile decomposition is based on small fragment occupancy during exponential phase (day 2).
Figure 8 with 1 supplement

MNase-Seq coverage around transcriptional start sites in T. acidophilum and histone-encoding archaea in the context of dynamic transcription.
(a) Broad peaks associated with low abundance of small fragments are enriched in intergenic regions. (b) Left and central panel: Heat maps indicating MNase-seq coverage by fragment length relative to transcriptional start sites in exponential (day 2) and stationary phase (day 3.5). Right panel: median normalized MNase-seq coverage (considering all fragment sizes) as a function of distance from the transcriptional start site (TSS). (c) as in (b) but for M. fervidus and using the coding start (ATG) rather than the TSS as a reference point. To ensure that the coding start constitutes a reasonable proxy for the TSS, only genes with a divergently oriented neighboring gene are considered, thus eliminating genes internal to operons. (d, e) median of normalized MNase-seq coverage (considering all fragment sizes) as a function of distance from the TSS in T. kodakarensis and Haloferax volcanii. (f) Changes in normalized MNase-seq coverage for small and large fragments around transcriptional start sites in T. acidophilum as a function of growth phase and whether genes are upregulated, downregulated or remain unchanged relative to mRNA abundance on day 1. Genes are grouped according to differential expression (or lack thereof) on day two compared to day 1. Genes with a log2-fold change > 1 were considered significantly upregulated, those with a log2-fold change <-1 significantly down-regulated (FDR < 0.01). The rightmost panels indicate that a majority of genes up-/downregulated on day 2, remain up-/downregulated on days 3 and 3.5.
Figure 8—figure supplement 1
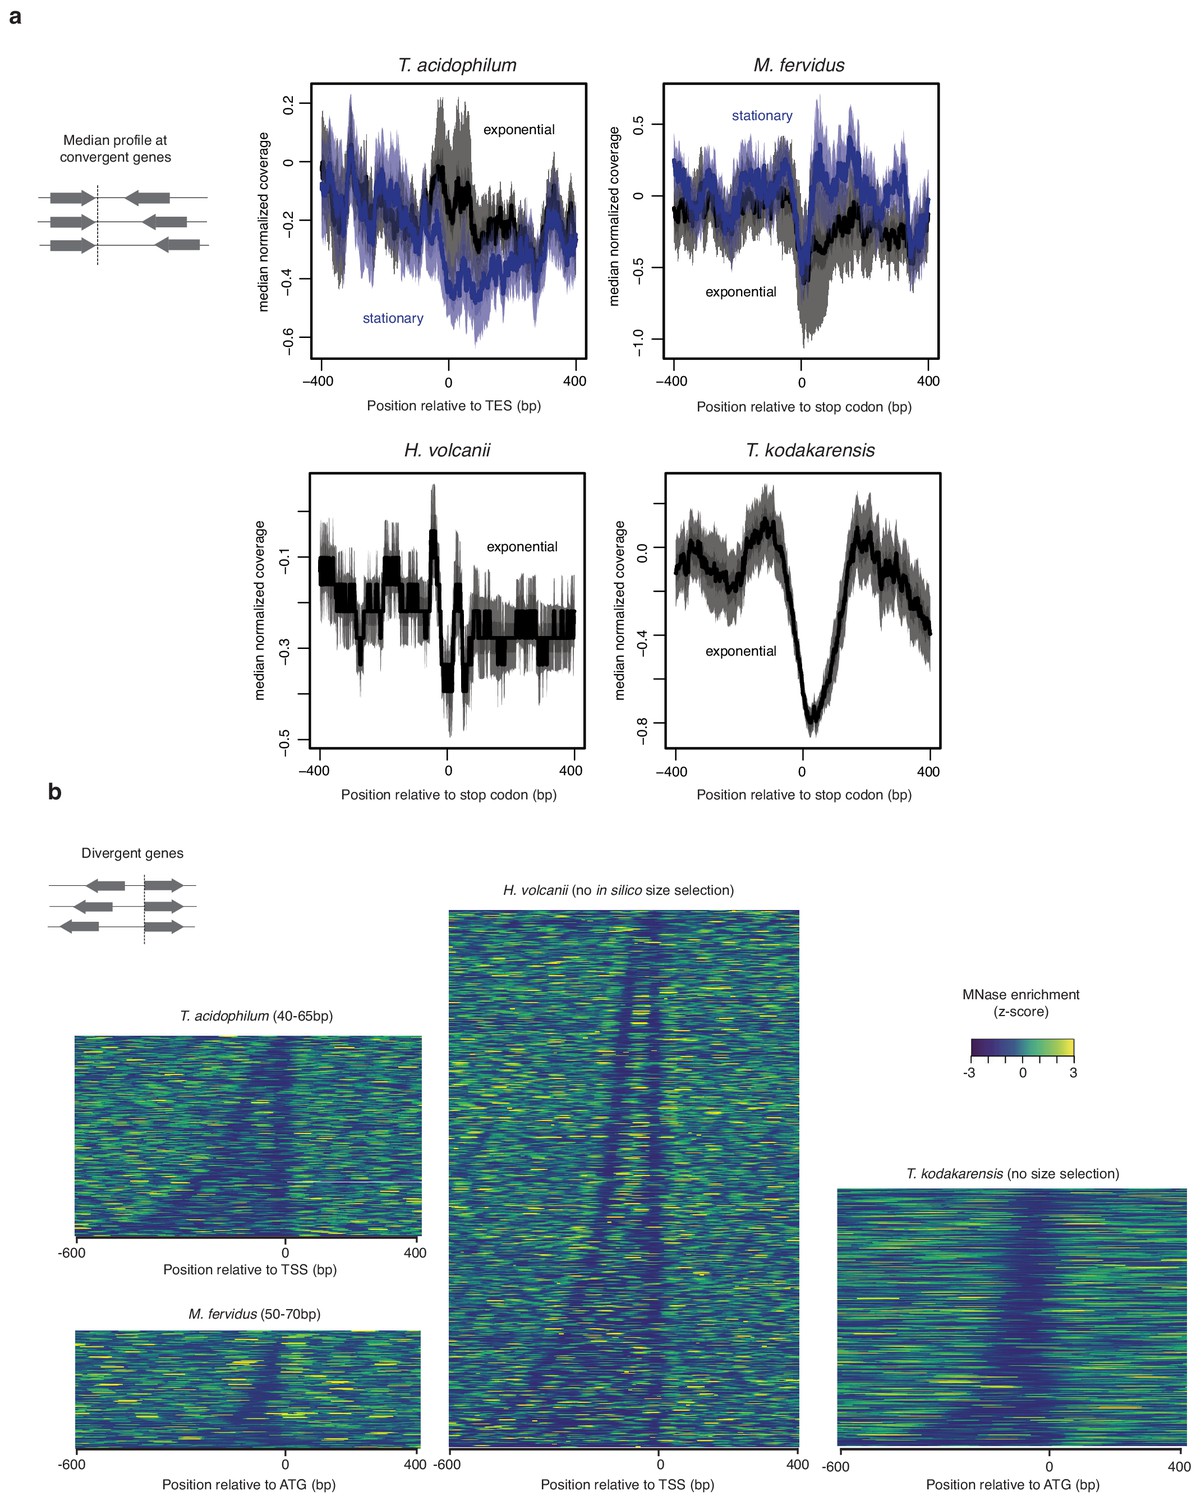
HTa and histone occupancy around transcription end sites.
(a) Median normalized MNase-seq coverage across fragment sizes relative to the distance from TESs or stop codons in different species. To ensure that the stop codons constitute a reasonable proxy for the TES, only genes with a convergently oriented downstream neighboring gene are considered, thus eliminating genes internal to operons. (b) Heat maps displaying normalized MNase-seq coverage at divergent genes relative to the distance from the start codon (ATG) or TSS in different species. Intergenic regions are sorted according to their width.
Author response image 1
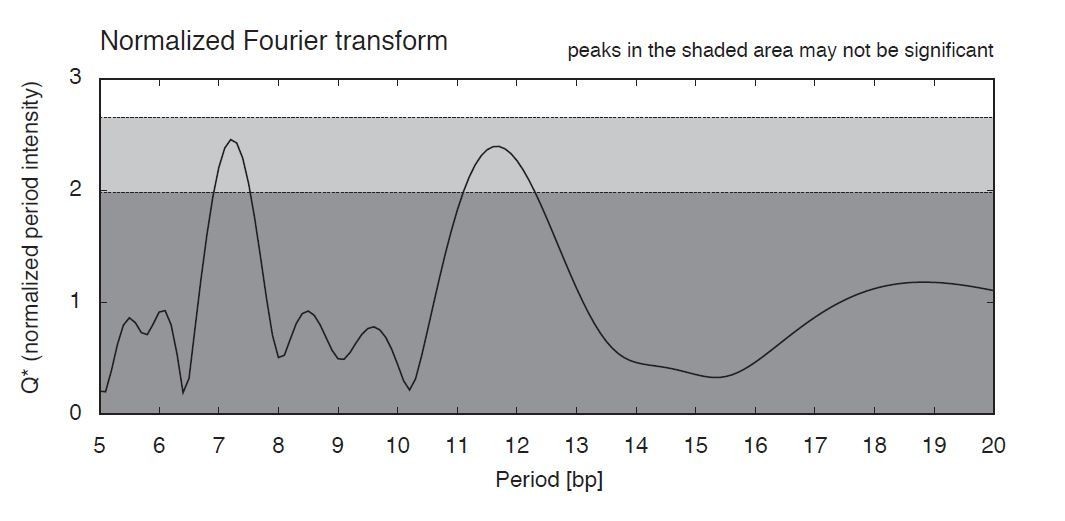
Nucleotide periodicities in the T. acidophilum genome.
Additional files
-
Supplementary file 1
Representation of HU homologs across bacterial phyla.
- https://cdn.elifesciences.org/articles/52542/elife-52542-supp1-v2.docx
-
Supplementary file 2
Examples of putative archaeal and eukaryotic homologs that likely represent contamination during genome assembly.
- https://cdn.elifesciences.org/articles/52542/elife-52542-supp2-v2.docx
-
Supplementary file 3
Fourier filtering parameters.
- https://cdn.elifesciences.org/articles/52542/elife-52542-supp3-v2.docx
-
Transparent reporting form
- https://cdn.elifesciences.org/articles/52542/elife-52542-transrepform-v2.docx
Download links
A two-part list of links to download the article, or parts of the article, in various formats.
Downloads (link to download the article as PDF)
Open citations (links to open the citations from this article in various online reference manager services)
Cite this article (links to download the citations from this article in formats compatible with various reference manager tools)
The DNA-binding protein HTa from Thermoplasma acidophilum is an archaeal histone analog
eLife 8:e52542.
https://doi.org/10.7554/eLife.52542


