Homologue replacement in the import motor of the mitochondrial inner membrane of trypanosomes
- Department of Chemistry and Biochemistry, University of Bern, Switzerland
- Center for Mechanisms of Evolution, Biodesign Institute, School of Life Sciences, Arizona State University, United States
- Biochemistry and Functional Proteomics, Institute of Biology II, Faculty of Biology and Signalling Research Centres BIOSS and CIBSS, University of Freiburg, Germany
Figures
Figure 1 with 2 supplements
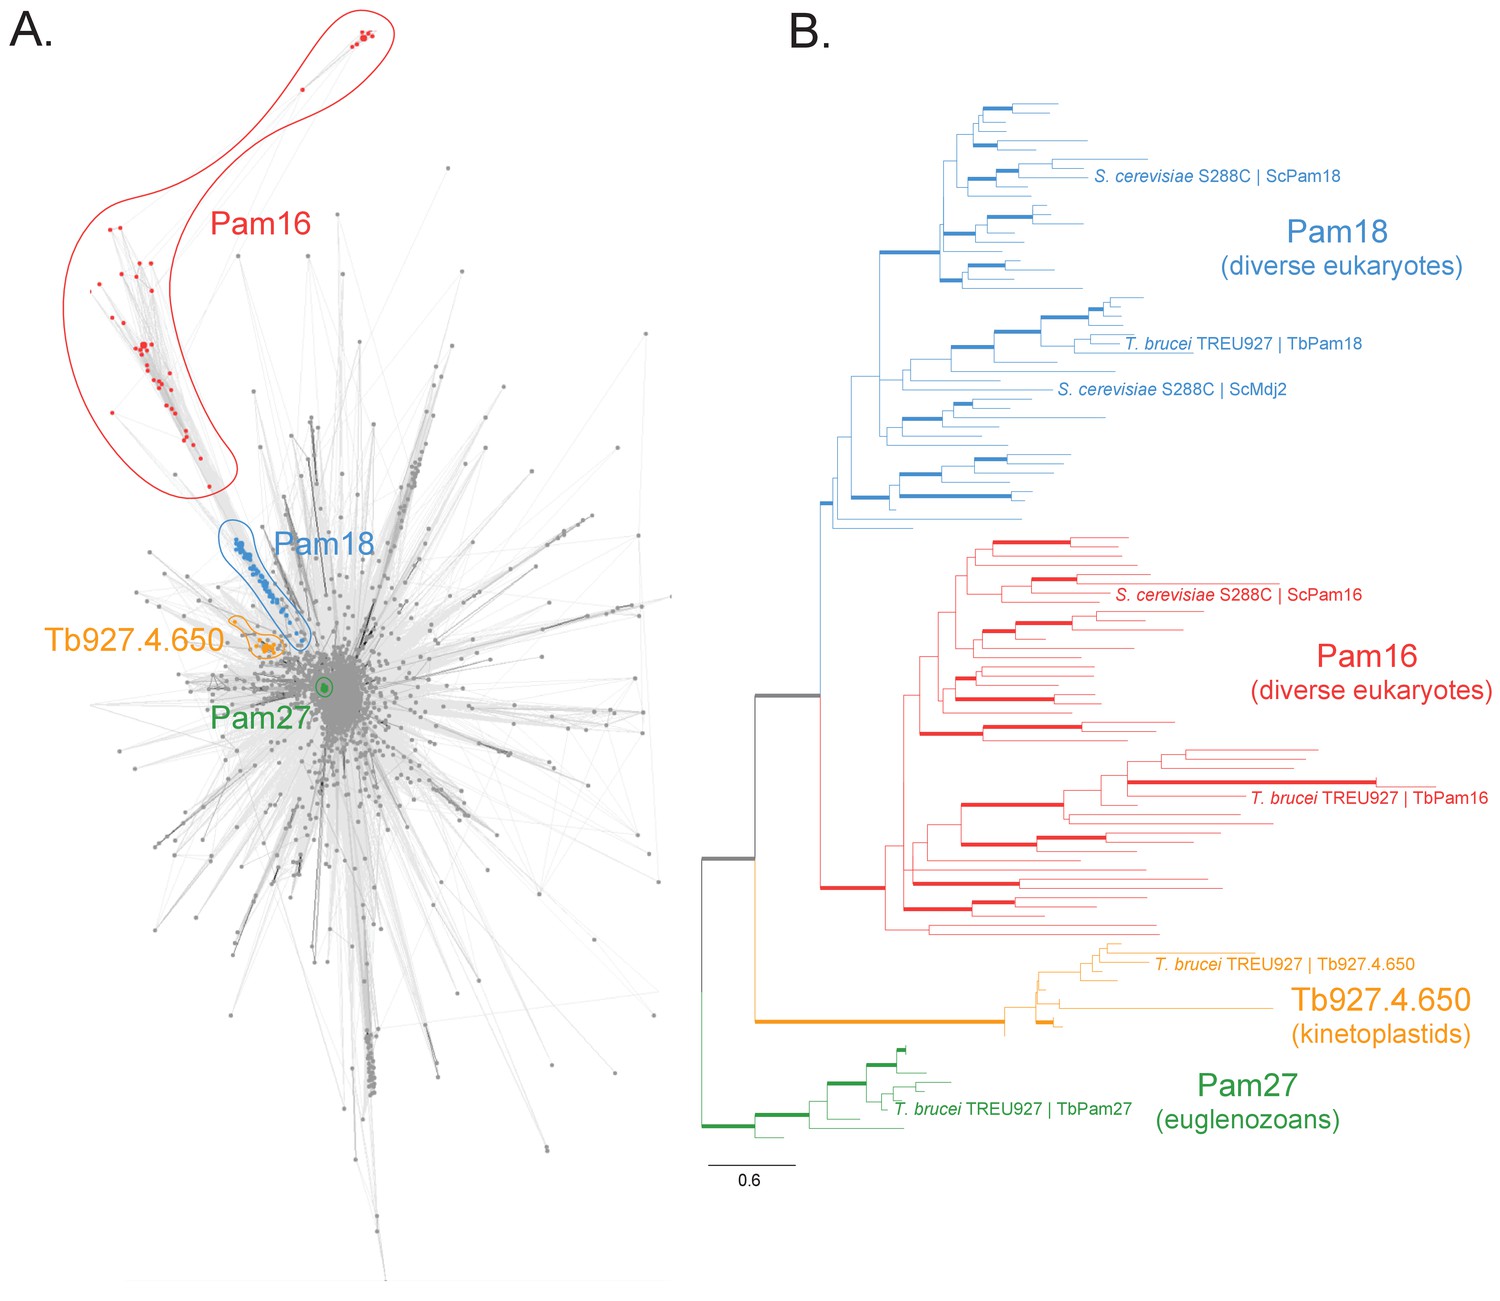
Sequence analysis of the J protein superfamily in eukaryotes and euglenozoans.
(A) Similarity network of DnaJ and Pam16 domain-containing proteins clustered by CLANS with a P-value threshold value of 1 × 10⁻¹². A cohesive Pam18 cluster is recovered (blue), as well as a more diffused Pam16 cluster (red). Two smaller and cohesive Kinetoplastea-specific clusters corresponding to Pam27 (green) and Tb927.4.650 (orange) are also recovered. (B) Condensed phylogenetic tree inferred by IQ-TREE and the best-fitting LG+R5 model from the Pam16, Pam18, Pam27 and Tb927.4.650 clusters identified in the protein similarity network (see Figure 1—figure supplement 2 for a fully annotated phylogenetic tree). Thick branches represent branch support values higher than 70% SH-aLRT and 70% UFBoot2+NNI. Only representative protein sequences corresponding to Saccharomyces cerevisiae S288C and Trypanosoma brucei brucei TREU927 are labeled. The phylogenetic tree recovers clades that correspond to the clusters identified by the protein similarity network. Phylogenetic tree is arbitrarily rooted in the internal branch between the Pam27 and all other clades. - For species name, phylogenetic affiliation and database source for each of the predicted proteomes used in the similarity network and phylogenetic analyses see Figure 1—source data 1.
-
Figure 1—source data 1
Species name, phylogenetic affiliation and database source for each of the predicted proteomes used in the similarity network and phylogenetic analyses.
- https://cdn.elifesciences.org/articles/52560/elife-52560-fig1-data1-v2.xlsx
Figure 1—figure supplement 1
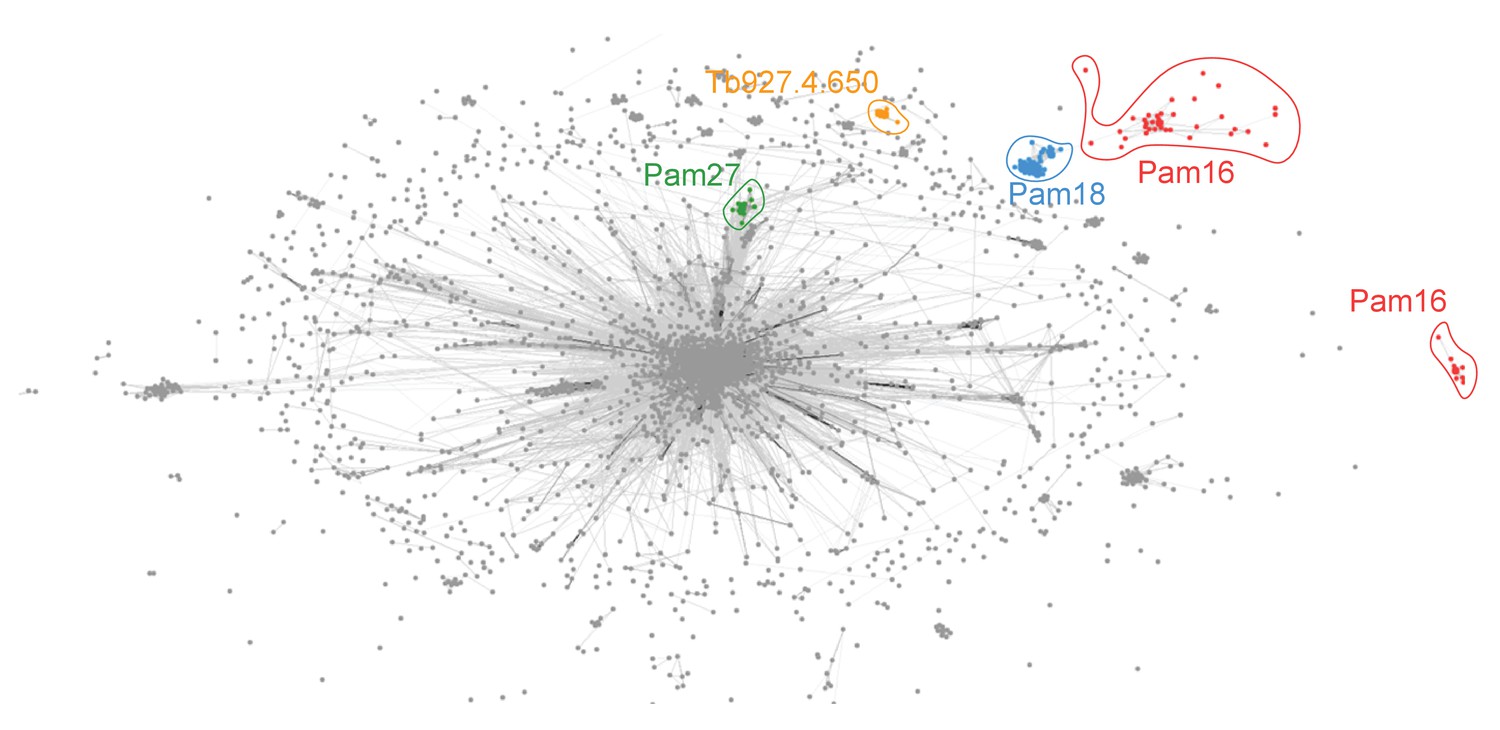
Similarity network of the J protein superfamiliy clustered with a P-value threshold of 1 × 10⁻²⁰.
Similarity network of DnaJ and Pam16 domain-containing proteins clustered by CLANS with a P-value threshold value of 1 × 10⁻²⁰. By lowering the P-value threshold the central tight cluster disassembles to some degree and reveals some of its substructure. The Pam18 (blue), TbPam27 (green) and Tb927.4.650 (orange) clusters remain cohesive. The Pam16 (red) family is now found as two distinct clusters representing most eukaryotes and kinetoplastids.
Figure 1—figure supplement 2
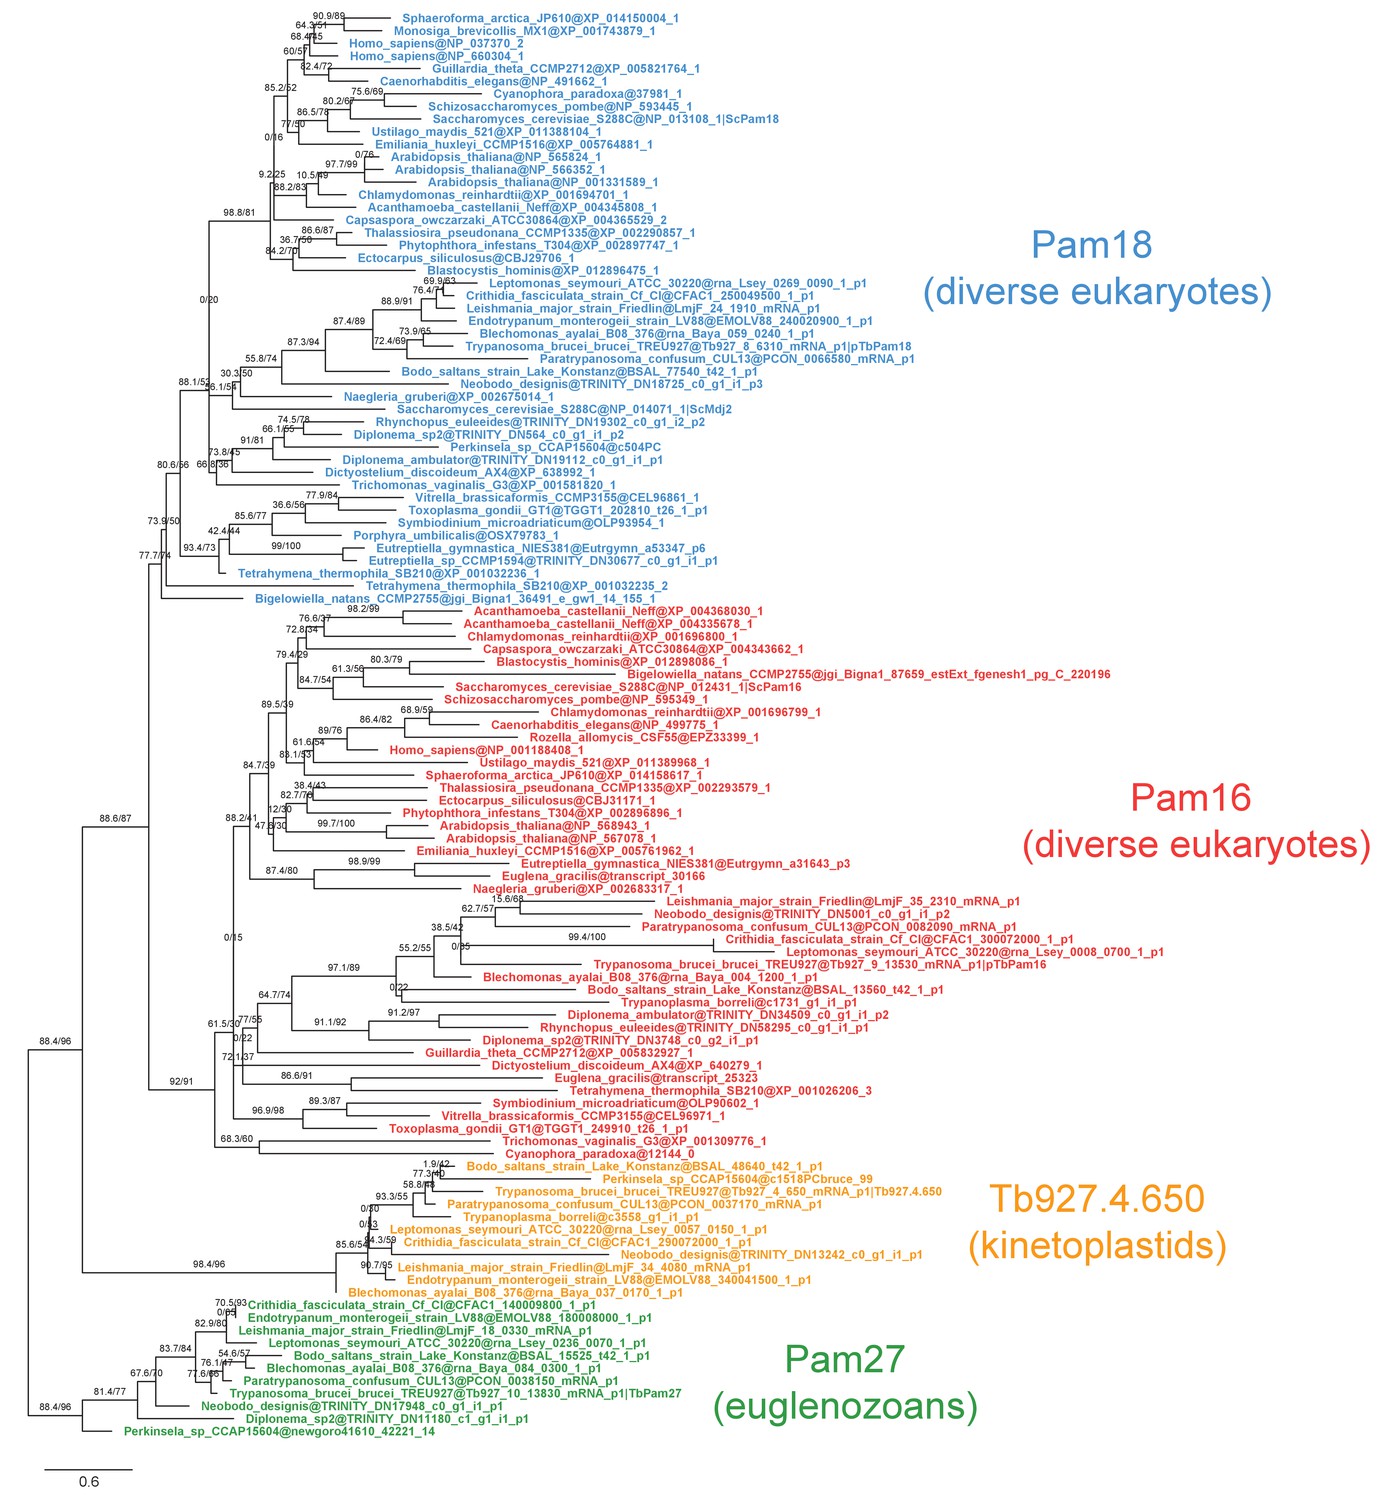
Fully annotated phylogenetic tree of Pam16, Pam18, TbPam27 and Tb927.4.650 J protein subfamilies.
Phylogenetic tree inferred by IQ-TREE and the best-fitting LG+R5 model from the Pam16, Pam18, TbPam27 and Tb927.4.650 clusters identified in the protein similarity network. Thick branches represent branch support values higher than 70% SH-aLRT and 70% UFBoot2+NNI. Only representative protein sequences corresponding to Saccharomyces cerevisiae S288C and Trypanosoma brucei brucei TREU927 are labeled. The phylogenetic tree recovers clades that correspond to the clusters identified by the protein similarity network. Phylogenetic tree is arbitrarily rooted in the internal branch between TbPam27 and all other clades.
Figure 2
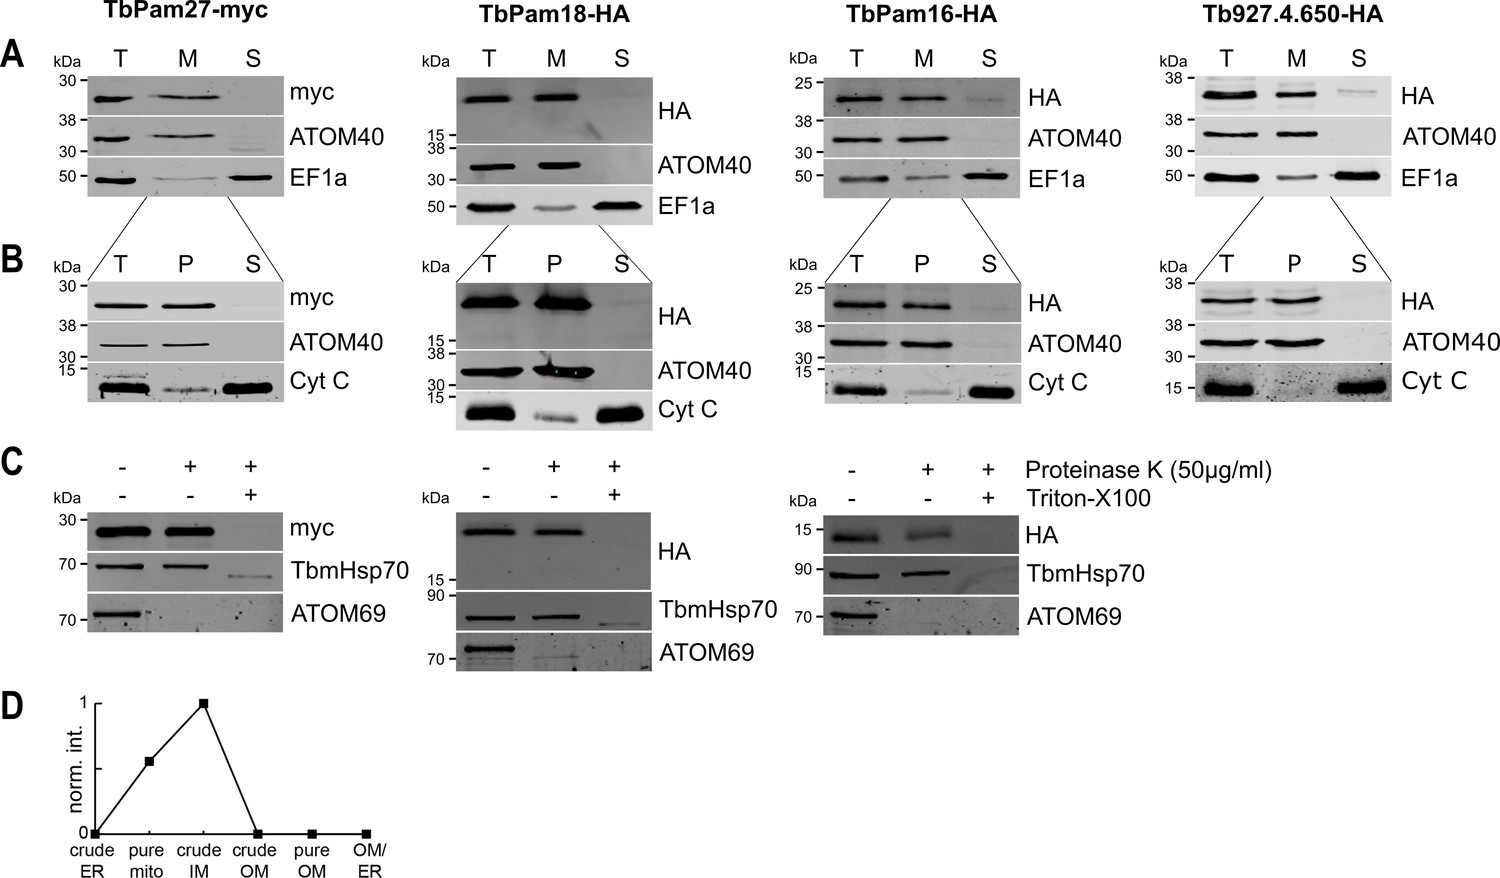
TbPam27, TbPam18, TbPam16 and Tb927.4.650 are inner mitochondrial membrane proteins.
(A) Immunoblot analysis of total cells (T), digitonin-extracted mitochondria-enriched (M) and soluble cytosolic (S) fractions of cells expressing the indicated C-terminally myc- or HA-tagged proteins. The immunoblots were probed with anti-tag antibodies and antisera against ATOM40 and elongation factor 1-alpha (EF1a), which serve as markers for mitochondria and cytosol, respectively. (B) Digitonin-extracted mitochondria-enriched fractions (T) were subjected to alkaline carbonate extraction performed at pH 11.5 resulting in membrane-enriched pellet (P) and soluble supernatant (S) fractions. Subsequent immunoblots were decorated with anti-tag antibodies and antisera against ATOM40 and cytochrome C (Cyt C), which serve as markers for integral membrane and soluble proteins, respectively. (C) Digitonin-extracted mitochondria-enriched fractions were subjected to a protease protection assay. Subsequent immunoblots were probed with anti-tag antibodies. TbmHsp70 and ATOM69 served as control for matrix and OM proteins, respectively. (D) Normalized abundance profile of TbPam27 over six subcellular fractions produced in a previous proteomic analysis (Niemann et al., 2013).
Figure 3 with 1 supplement
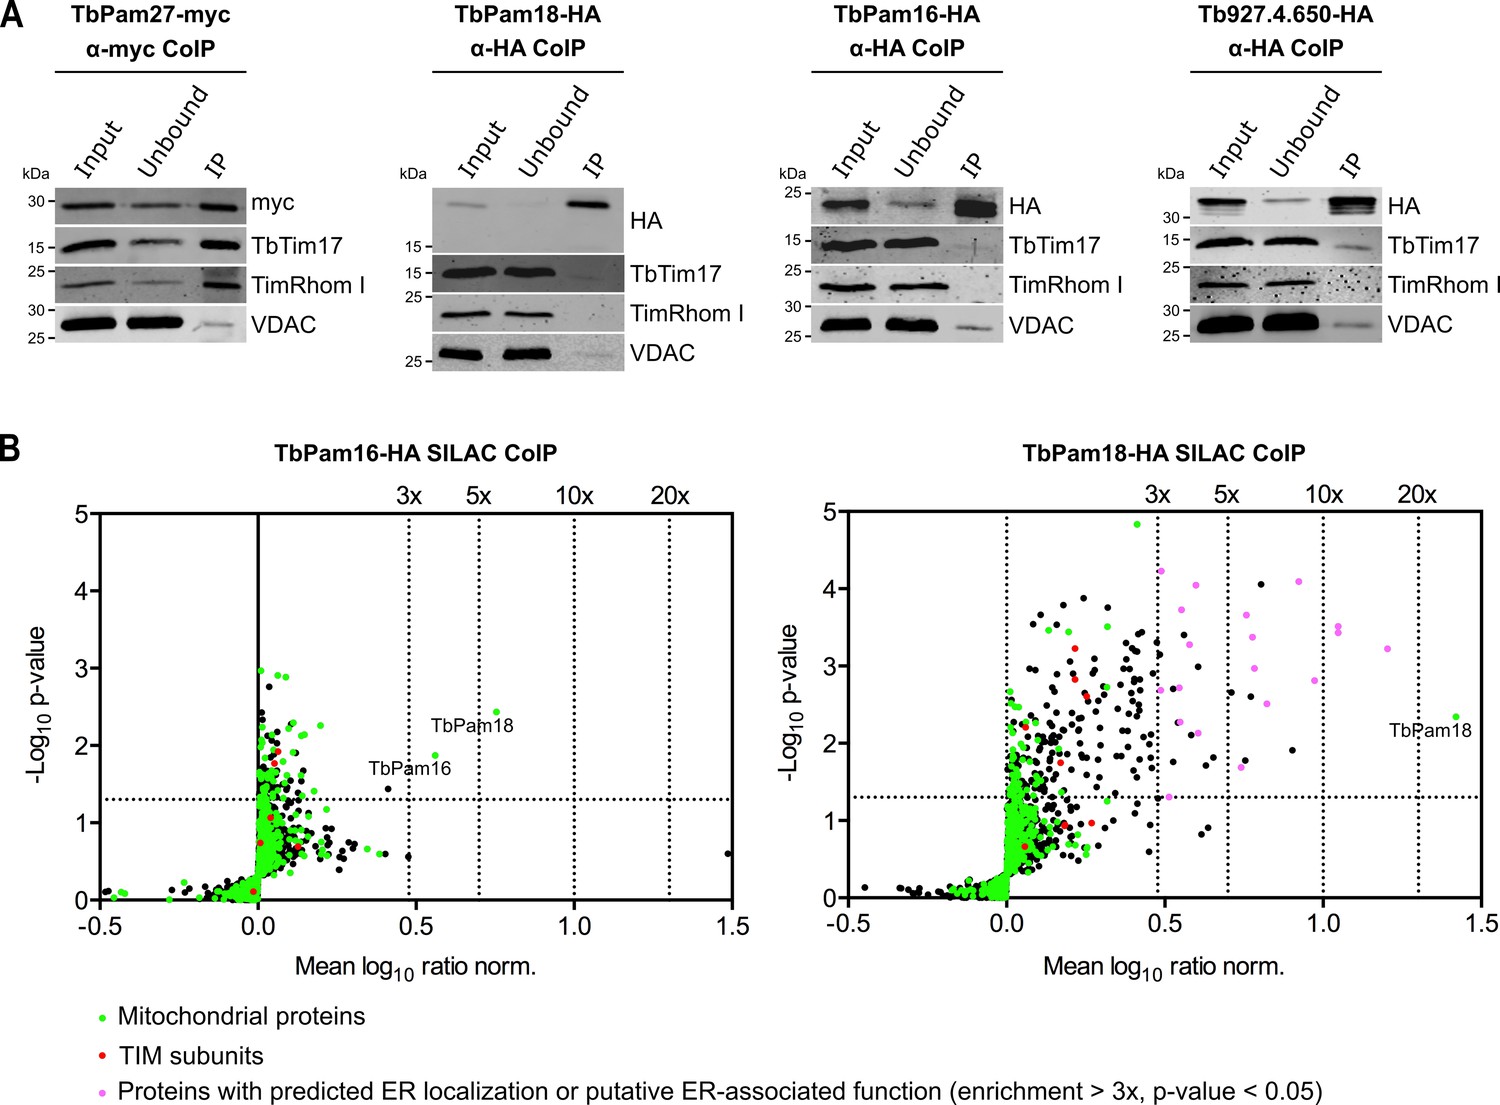
TbPam27, but not TbPam18, TbPam16 and Tb927.4.650, is associated with the TIM complex.
(A) Cell lines expressing the indicated C-terminally triple myc- or HA-tagged proteins were subjected to co-immunoprecipitation (CoIP). 5% each of crude mitochondrial fractions (Input) and unbound proteins (Unbound), as well as 100% of the final eluates (IP) were separated by SDS-PAGE. The resulting immunoblots were probed with anti-tag antibodies and antisera against TIM subunits (TbTim17 and TimRhom I) and VDAC. (B) SILAC-IP experiments of TbPam16-HA and TbPam18-HA from digitonin-extracted mitochondria enriched fractions. Volcano plots show the mean log10 ratios (induced/uninduced) of proteins that were detected in at least two of three independent biological replicates by quantitative MS, plotted against the corresponding -log10 P values (one-sided t-test). The vertical dotted lines specify the indicated enrichment factors. The horizontal dotted line indicates a t-test significance level of 0.05. Green dots represent proteins that are found in the mitochondrial proteome (Peikert et al., 2017), red dots indicate TIM subunits and pink dots represent proteins that are enriched more than three-fold and which, according to the TriTryp database (https://tritrypdb.org/tritrypdb/), are ER-localized or have a putative ER-associated function.
-
Figure 3—source data 1
List of proteins identified by SILAC-MS from a pull down experiment of mitochondria-enriched fractions using C-terminally myc-tagged ACAD as a bait.
- https://cdn.elifesciences.org/articles/52560/elife-52560-fig3-data1-v2.xlsx
-
Figure 3—source data 2
List of proteins identified by SILAC-MS from a pull down experiment of mitochondria-enriched fractions using C-terminally HA-tagged TbPam16 as a bait.
- https://cdn.elifesciences.org/articles/52560/elife-52560-fig3-data2-v2.xlsx
-
Figure 3—source data 3
List of proteins identified by SILAC-MS from a pull down experiment of mitochondria-enriched fractions using C-terminally HA-tagged TbPam18 as a bait.
- https://cdn.elifesciences.org/articles/52560/elife-52560-fig3-data3-v2.xlsx
Figure 3—figure supplement 1
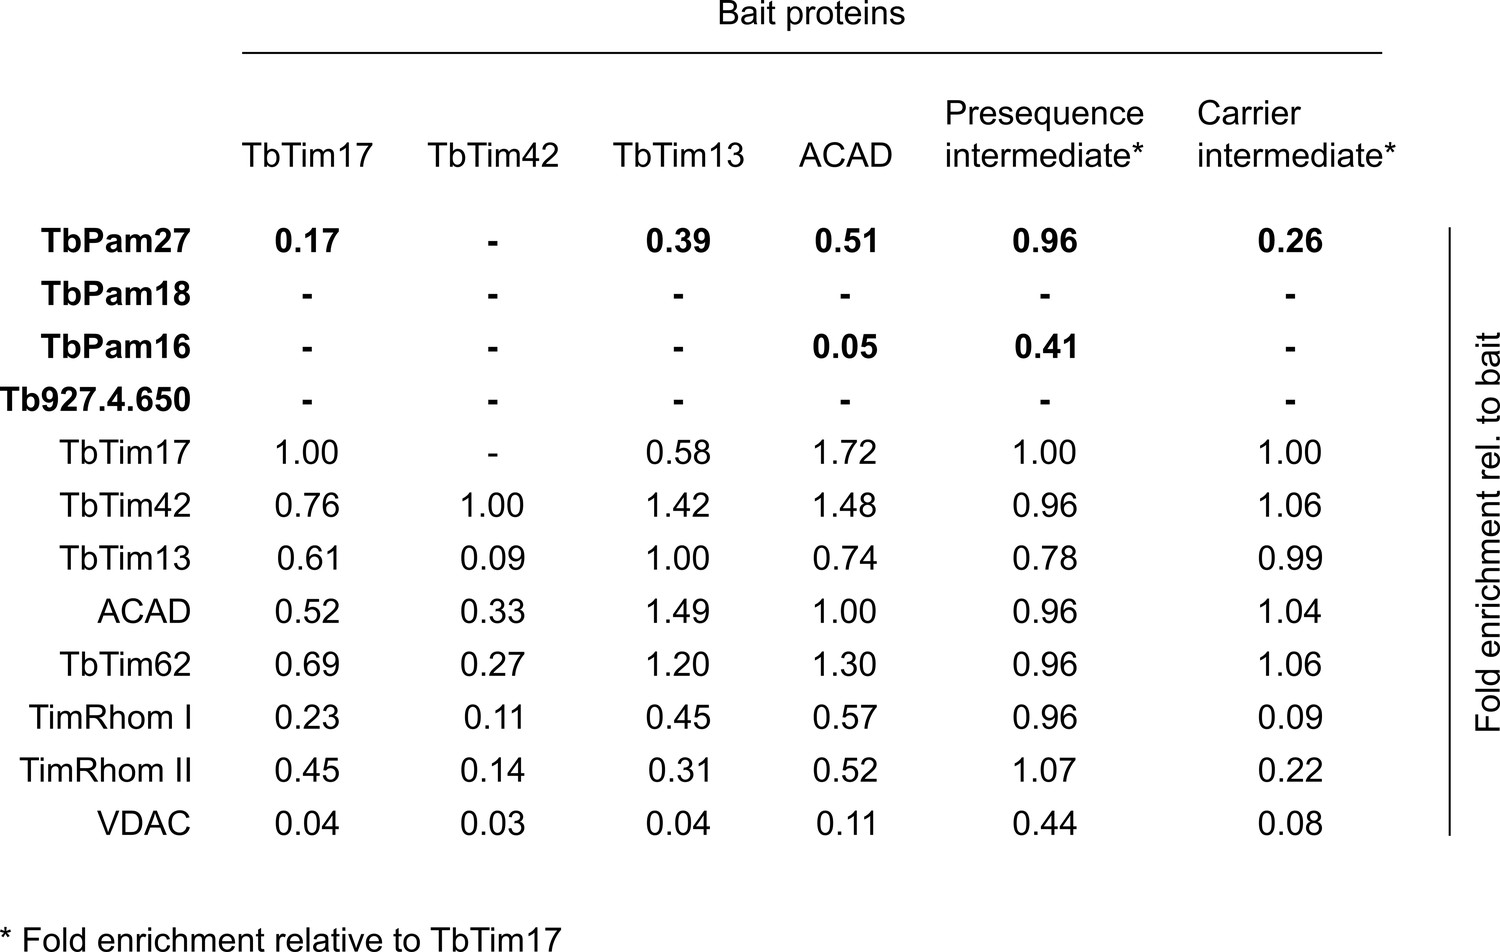
Global proteomic analysis confirm that TbPam27, but not TbPam18, TbPam16 or Tb927.4.650, is associated with the TIM complex.
Listing of the enrichment factors of candidate proteins (bold), TIM core components and the control protein VDAC relative to the bait (or relative to TbTim17 in the last two rows) in the five indicated SILAC-IP experiments. The TbTim17, TbTim42 and TbTim13 SILAC-IPs as well as the SILAC-IPs using the stalled presequence pathway intermediate and the carrier pathway intermediate as the bait, have been published before (Harsman et al., 2016). The SILAC-IP of ACAD has been carried out in this study (Figure 3—source data 1). Dashes indicate that the particular protein has not been detected in the relative SILAC-IP.
Figure 4
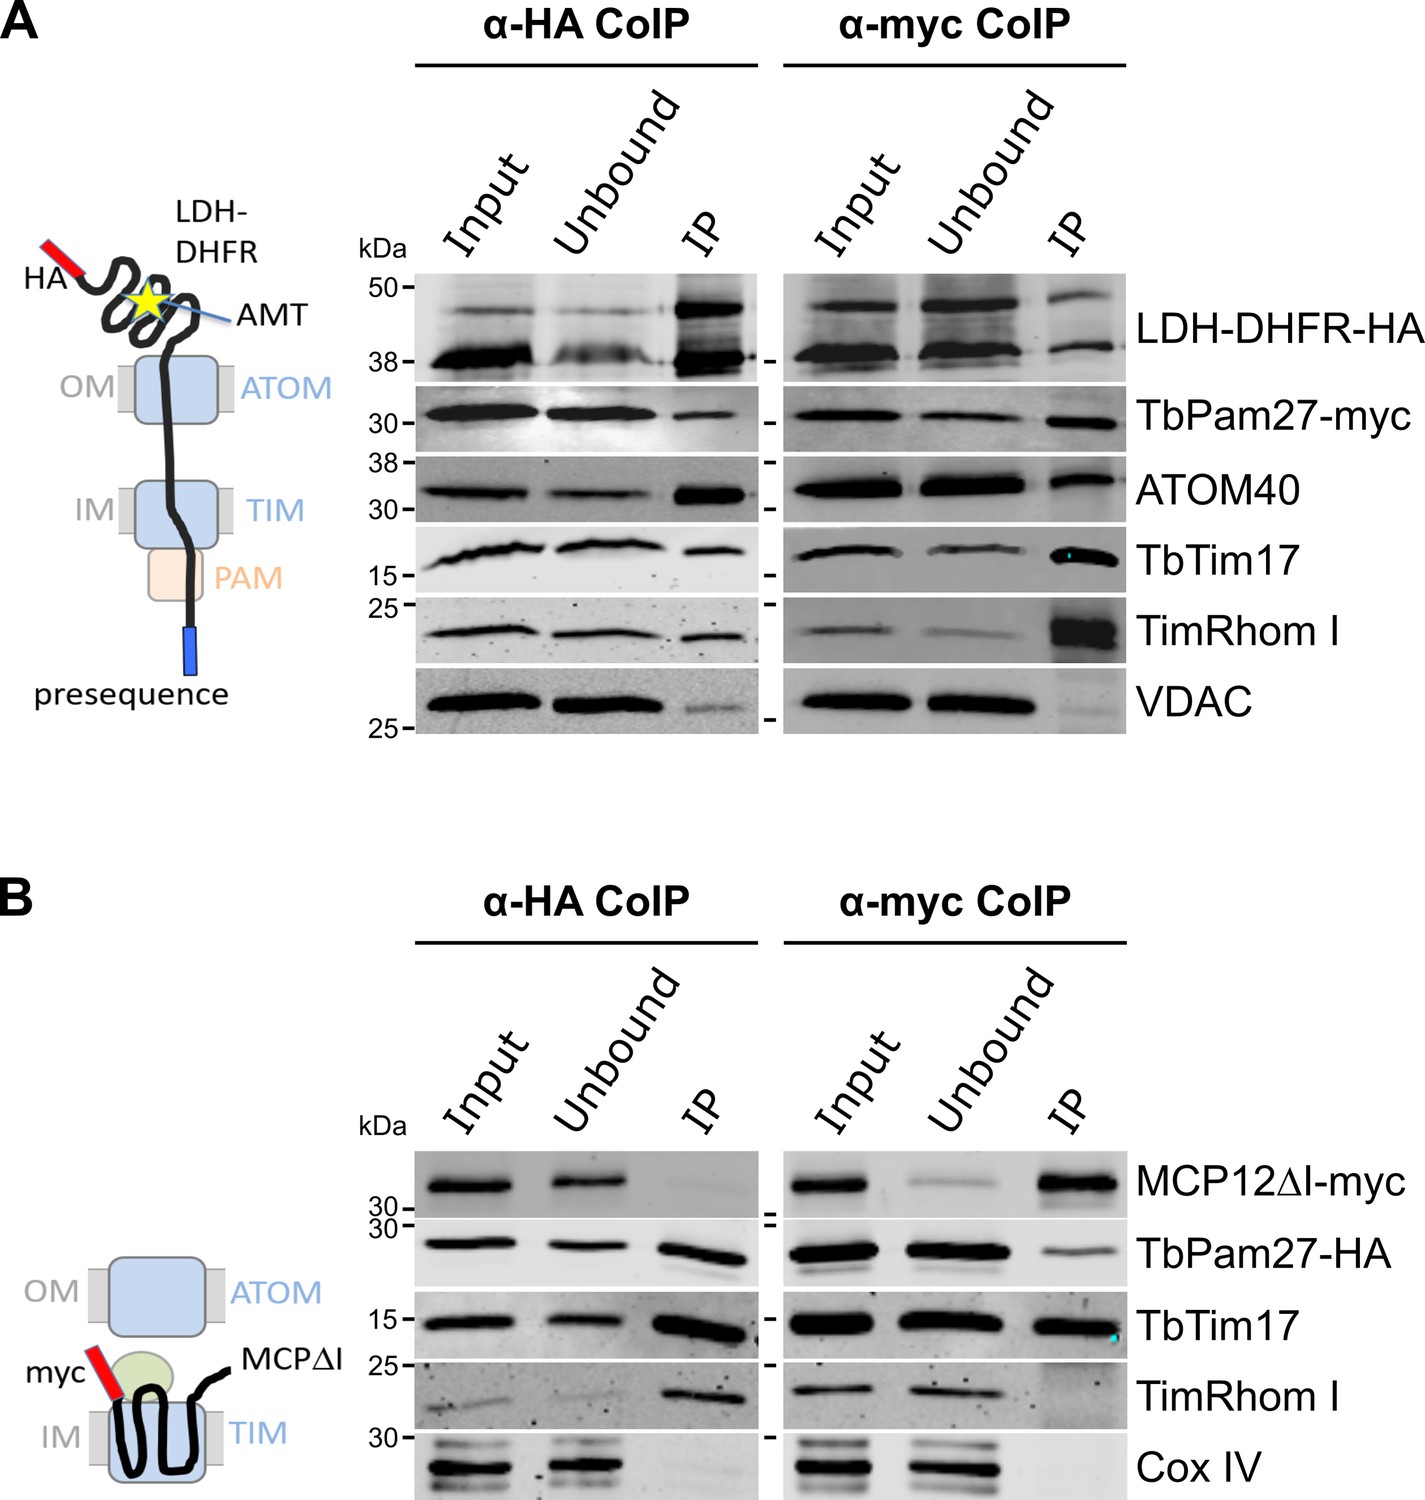
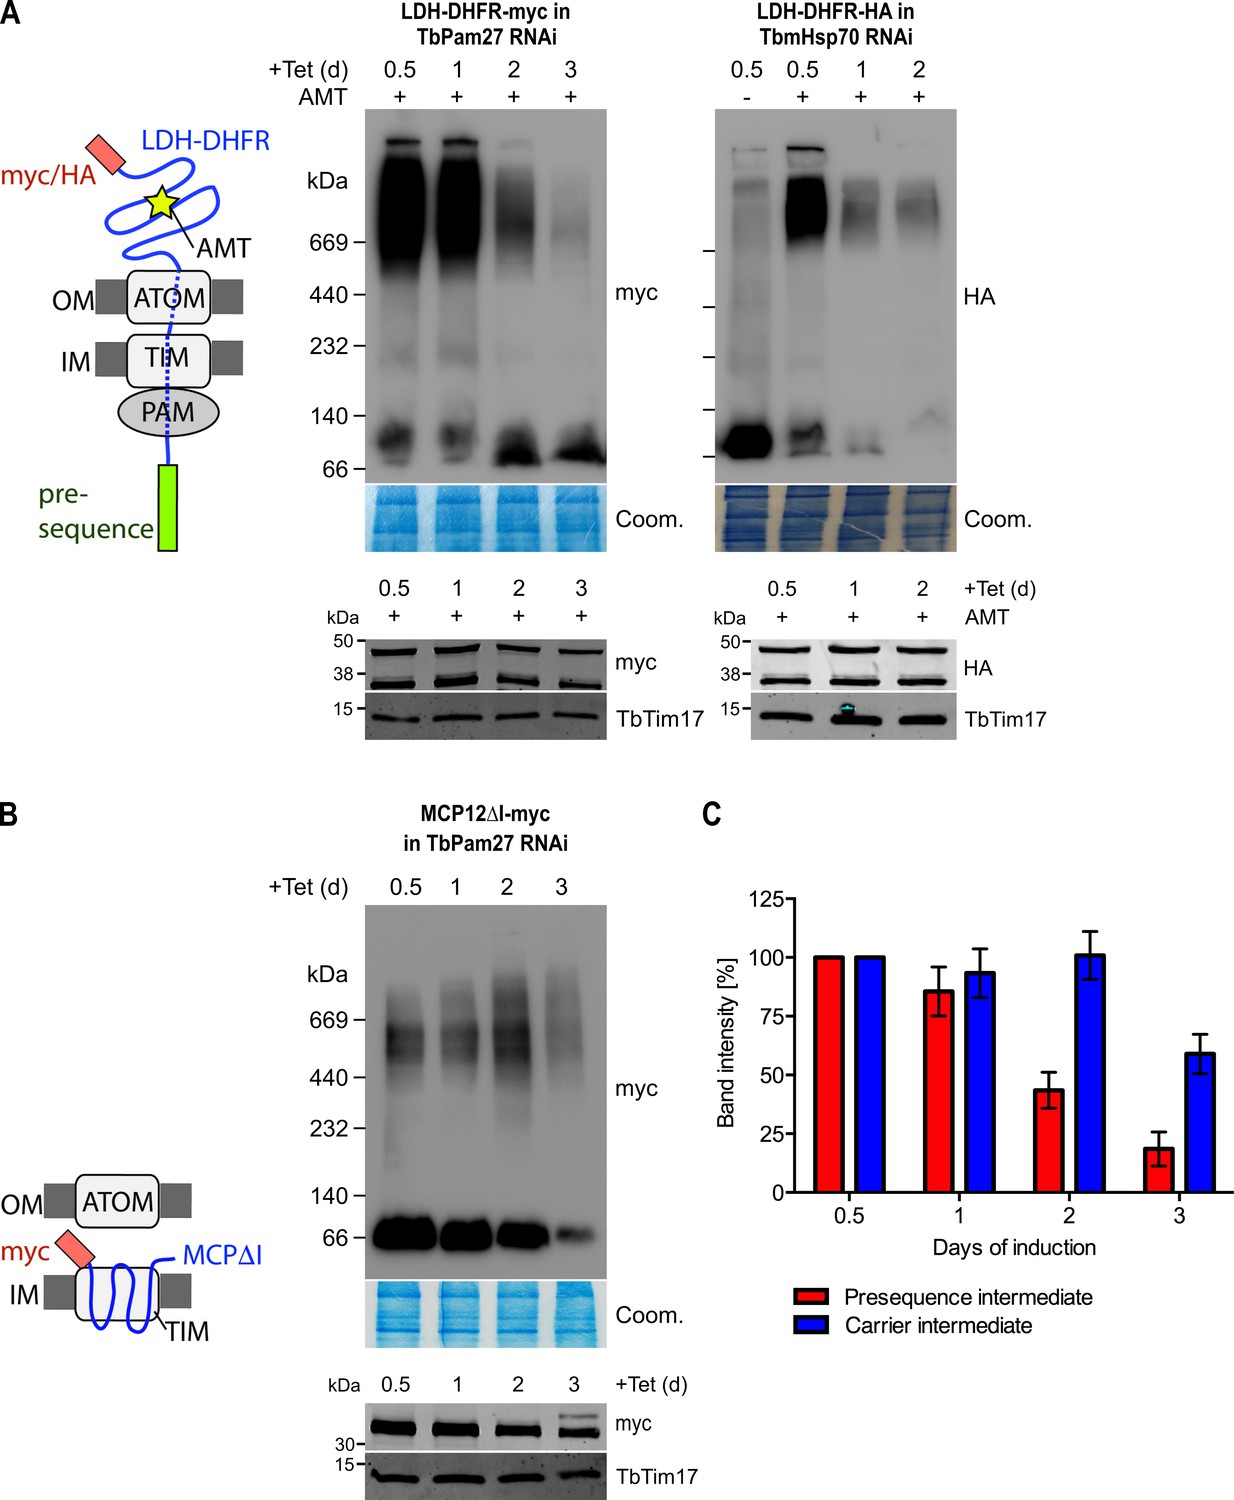
TbPam27 is part of the active presequence translocase but not of the active carrier translocase.
(A) Left: Schematic representation of the stalled presequence intermediate induced by in vivo expression of the LDH-DHFR fusion protein in presence of aminopterin (AMT). Right: Digitonin-solubilized mitochondrial extracts from cells co-expressing LDH-DHFR-HA and TbPam27-myc which were grown in presence of AMT and subjected to co-immunoprecipitation (CoIP) using either the HA- (left panel) or myc-tag (right panel). (B) Left: Schematic depiction of the stalled carrier intermediate induced by the expression of a truncated mitochondrial carrier protein (MCPΔI). Right: Digitonin-solubilized mitochondrial extracts from cells co-expressing MCP12ΔI-myc and TbPam27-HA were subjected to CoIP using either the HA- (left panel) or myc-tag (right-panel). For all CoIPs 5% each of crude mitochondrial fractions (Input) and unbound proteins (Unbound), as well as 100% of the final eluate (IP) were separated by SDS-PAGE. The resulting immunoblots were probed with anti-tag antibodies and antisera against ATOM40, TIM subunits (TbTim17 and TimRhom I), VDAC and Cox IV as indicated. The two bands shown for LDH-DHFR-HA, represent the LDH-DHFR-HA portions without (lower band) or with bound AMT (higher band).
Figure 5
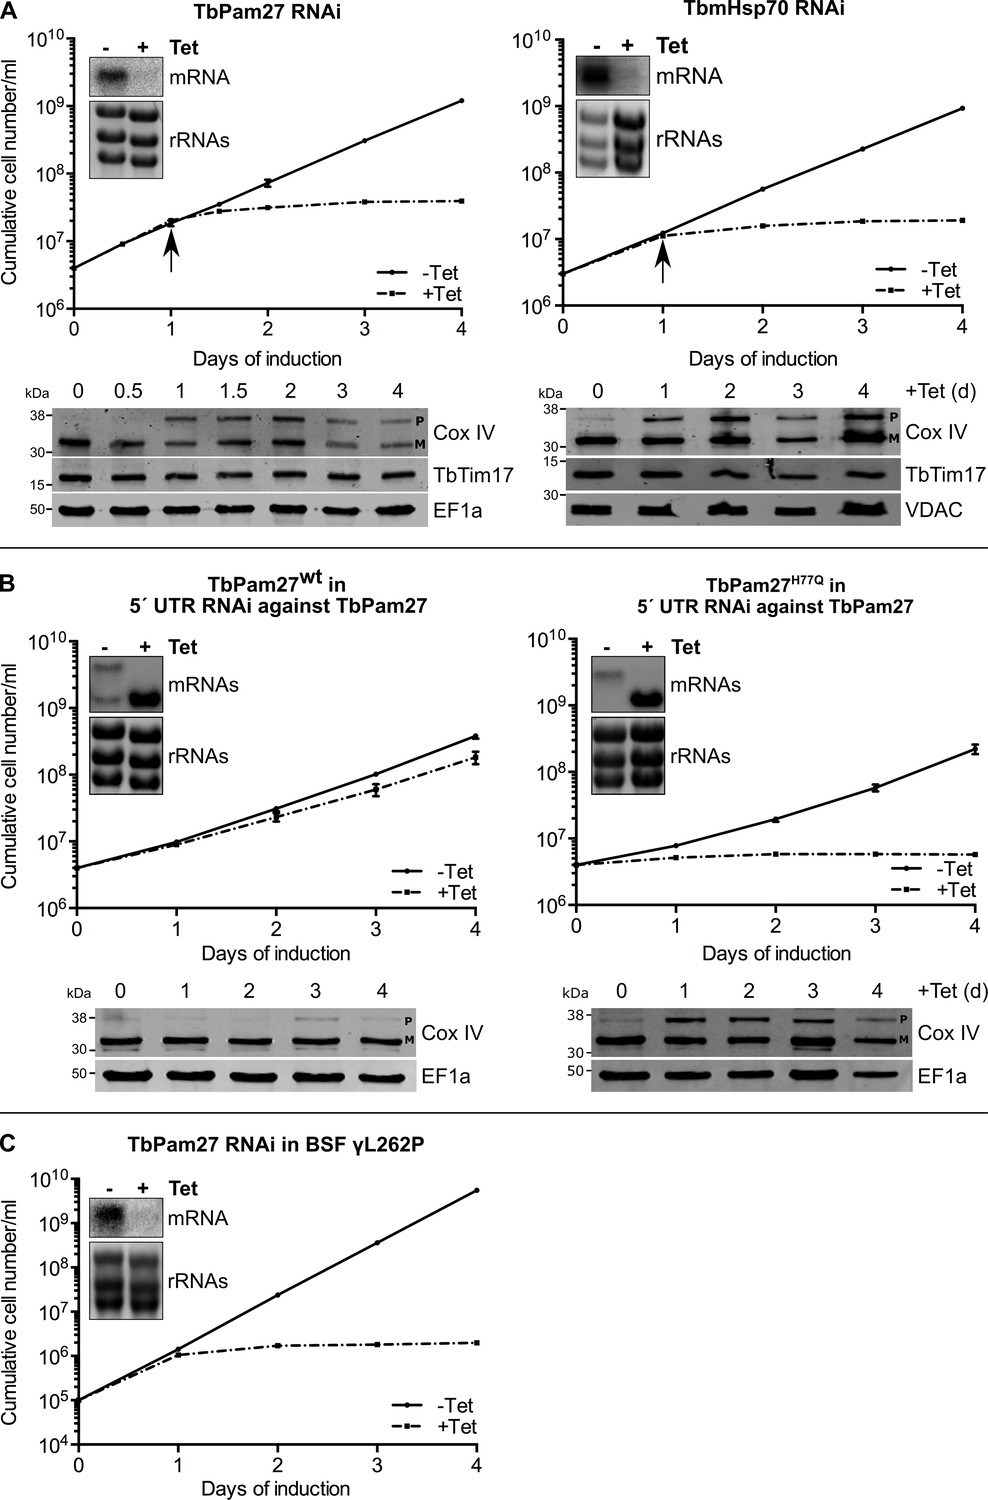
TbPam27 is essential and requires an intact J domain for its function.
(A) Top panel: Growth curves of uninduced (-Tet) and induced (+Tet) procyclic TbPam27 and TbmHsp70 RNAi cell lines. Error bars correspond to the standard deviation (n = 3). Insets show Northern blots of total RNA from uninduced or two days induced cells which were probed for the corresponding mRNAs. Ethidiumbromide-stained rRNAs serve as loading controls. Arrows indicate the onset of the protein import phenotype. Bottom panels: Immunoblot analysis of steady-state protein levels of Cox IV and TbTim17 in whole-cell extracts of the respective RNAi cell line. (B) Top panel: Growth curves of uninduced (-Tet) and induced (+Tet) TbPam27 RNAi cell lines targeting the 5’ UTR that ectopically either express wildtype TbPam27 (TbPam27wt) or a version of TbPam27 carrying the H77Q mutation (TbPam27H77Q). Insets show Northern blots of total RNA from uninduced and two days induced cells, probed for the TbPam27 ORF. The top bands correspond to the endogenous and the bottom bands to the ectopically expressed TbPam27 versions. Ethidiumbromide-stained rRNAs serve as loading controls. Bottom panel: Immunoblot analysis of steady-state protein levels of Cox IV in whole-cell extracts of the respective cell line. In (A) and (B) EF1a or VDAC serve as loading control. The positions of Cox IV precursor (P) and mature (M) forms are indicated. (C) Growth curve of the uninduced (-Tet) and induced (+Tet) bloodstream form (BSF) γL262P RNAi cell line ablating TbPam27. Error bars correspond to the standard deviation (n = 3). Insets show Northern blots of total RNA from uninduced or two days induced cells which were probed for the corresponding mRNAs. Ethidiumbromide-stained rRNAs serve as loading controls.
Figure 6 with 1 supplement
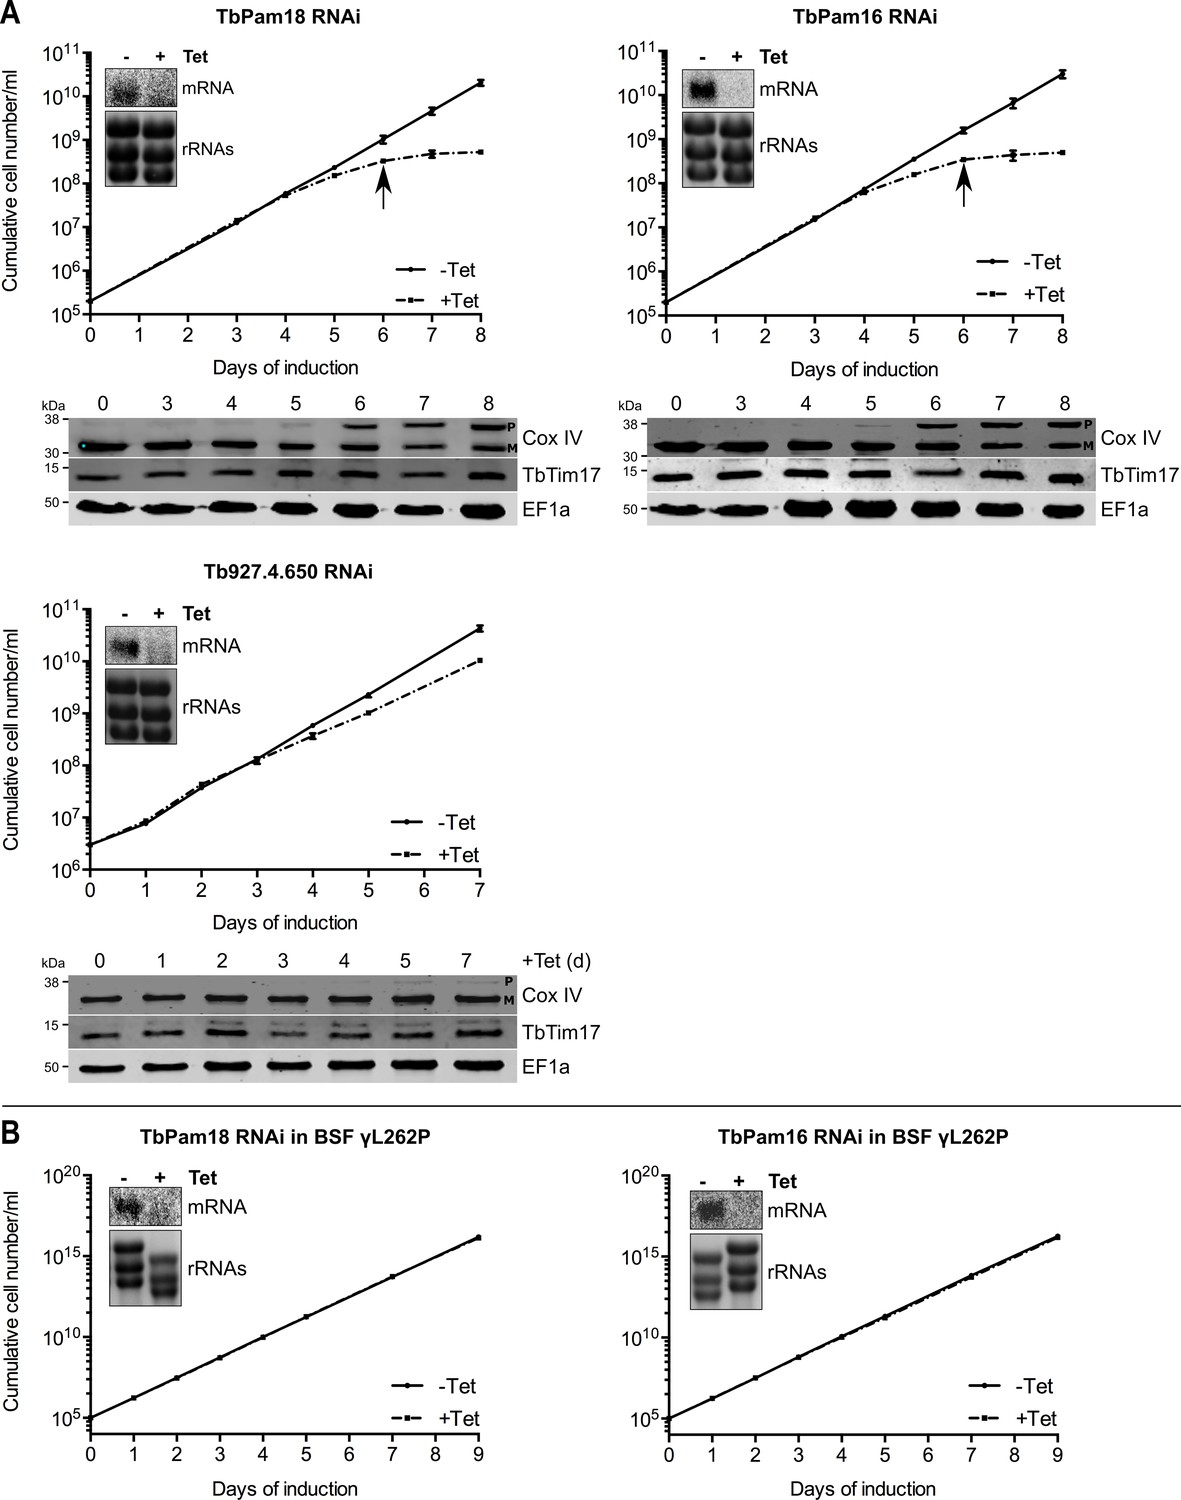
Ablation of TbPam18 and TbPam16 affects growth of procyclic form but not of bloodstream form trypanosomes.
(A) Upper panels: Growth curves of uninduced (-Tet) and induced (+Tet) procyclic TbPam18, TbPam16 and Tb927.4.650 RNAi cell lines. Arrows indicate the onset of the mitochondrial protein import phenotype. Bottom panels: Immunoblot analysis of steady-state protein levels of Cox IV and TbTim17 in whole-cell extracts of the respective RNAi cell lines. EF1a serves as loading control. The positions of Cox IV precursor (P) and mature (M) forms are indicated. (B) Growth curve of the uninduced (-Tet) and induced (+Tet) blood stream form (BSF) γL262P RNAi cell lines ablating TbPam18 or TbPam16. In (A) and (B) error bars correspond to the standard deviation (n = 3). Insets show Northern blots of total RNA from uninduced or two days induced cells which were probed for the corresponding mRNAs. Ethidiumbromide-stained rRNAs serve as loading controls.
Figure 6—figure supplement 1

TbPam18 and TbPam16 are not associated with the TIM complex irrespectively whether TbPam27 is present or not.
(A) Top panel: Growth curves of uninduced (-Tet) and induced (+Tet) procyclic cells expressing C-terminally triple HA-tagged TbPam18 or TbPam16 in TbPam27 RNAi cells. Insets show Northern blots of total RNA from uninduced or two days induced cells which were probed for the corresponding mRNAs. Ethidiumbromide-stained rRNAs serve as loading controls. Bottom panels: Immunoblot analysis of steady-state protein levels of TbPam18-HA or TbPam16-HA in whole-cell extracts of the respective cell lines. EF1a serves as a loading control. (B) Two days induced cell lines expressing TbPam18-HA or TbPam16-HA in TbPam27 RNAi were subjected to CoIP. 5% each of crude mitochondrial fractions (Input) and unbound proteins (Unbound), as well as 100% of the final eluates (IP) were separated by SDS-PAGE. The resulting immunoblots were probed with anti-tag antibodies and antisera against TIM subunits (TbTim17 and TimRhom I) and Cox IV.
Figure 7
TbPam27 is required for the formation of the presequence but not for the carrier intermediate.
(A) Left: Schematic representation of the stalled presequence intermediate induced by in vivo expression of the LDH-DHFR fusion protein in presence of aminopterin (AMT). Right, upper panels: BN-PAGE analysis of the presequence intermediate in cell lines expressing HA- or myc-tagged LDH-DHFR in the background of RNAi against either TbPam27 or TbmHsp70 as indicated. Cells were grown in the absence or presence (0.5 days) of AMT as specified. (B) Left: Schematic depiction of the stalled carrier intermediate induced by the expression of the truncated mitochondrial carrier protein (MCPΔI). Right, upper panel: BN-PAGE analysis of the carrier intermediate in a cell line expressing myc-tagged MCP12ΔI in the background of RNAi against TbPam27. For all experiments digitonin-extracted mitochondrial fractions were prepared after the indicated number of days of RNAi induction and separated on a 4–13% BN-PAGE. The resultant immunoblots were probed with anti-tag antibodies. Coomassie-stained gel sections (Coom.) serve as loading controls. In (A) and (B) the right, lower panels show SDS-PAGE analysis of whole-cell extracts of the respective cell lines. Immunoblots were probed with anti-tag antibodies, to demonstrate a constant LDH-DHFR-myc/-HA or MCP12ΔI-myc expression. The two bands shown for LDH-DHFR-myc/-HA, represent the LDH-DHFR-myc/-HA portions without (lower band) or with bound AMT (higher band). Probing for TbTim17 demonstrates integrity of the TIM complex. (C) Densitometric quantification of the BN-PAGE signals to compare the amounts of LDH-DHFR-myc (as shown in A) and MCP12ΔI-myc (as shown in B) in the TbPam27-RNAi cell line found in the respective high molecular weight complexes. The levels after 0.5 days of RNAi induction were set to 100%. Error bars correspond to the standard error of the mean of three biological replicates.
Figure 8
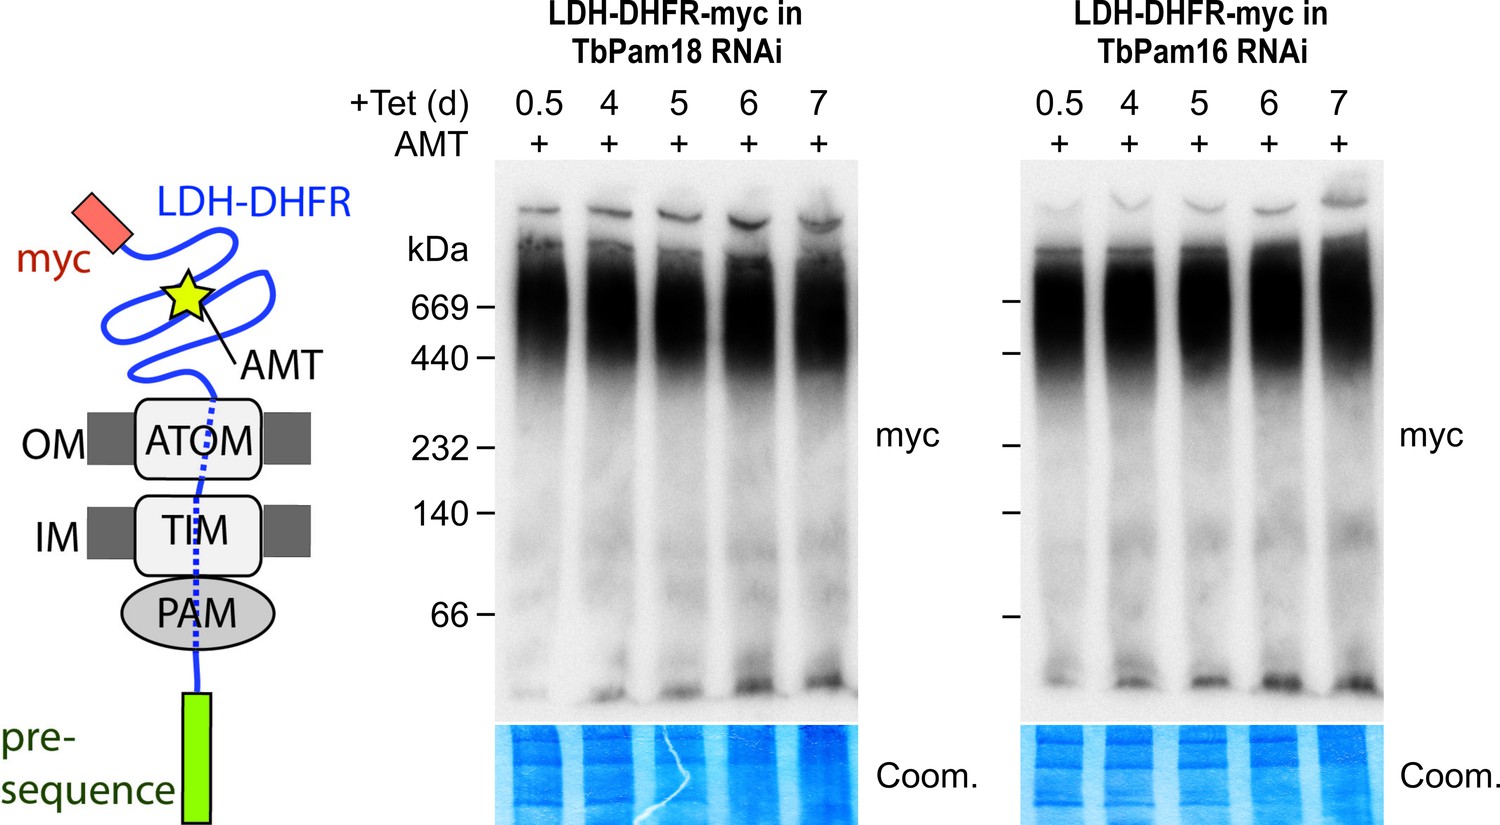
Ablation of neither TbPam18 nor TbPam16 does affect the formation of the presequence intermediate.
Left: Schematic representation of the stalled presequence intermediate induced by in vivo expression of the LDH-DHFR fusion protein in presence of aminopterin (AMT). Right: BN-PAGE analysis of the presequence intermediate in cell lines expressing myc-tagged LDH-DHFR in the background of RNAi against either TbPam18 or TbPam16 as indicated. Experiments were done exactly as described in Figure 7A.
Figure 9 with 1 supplement
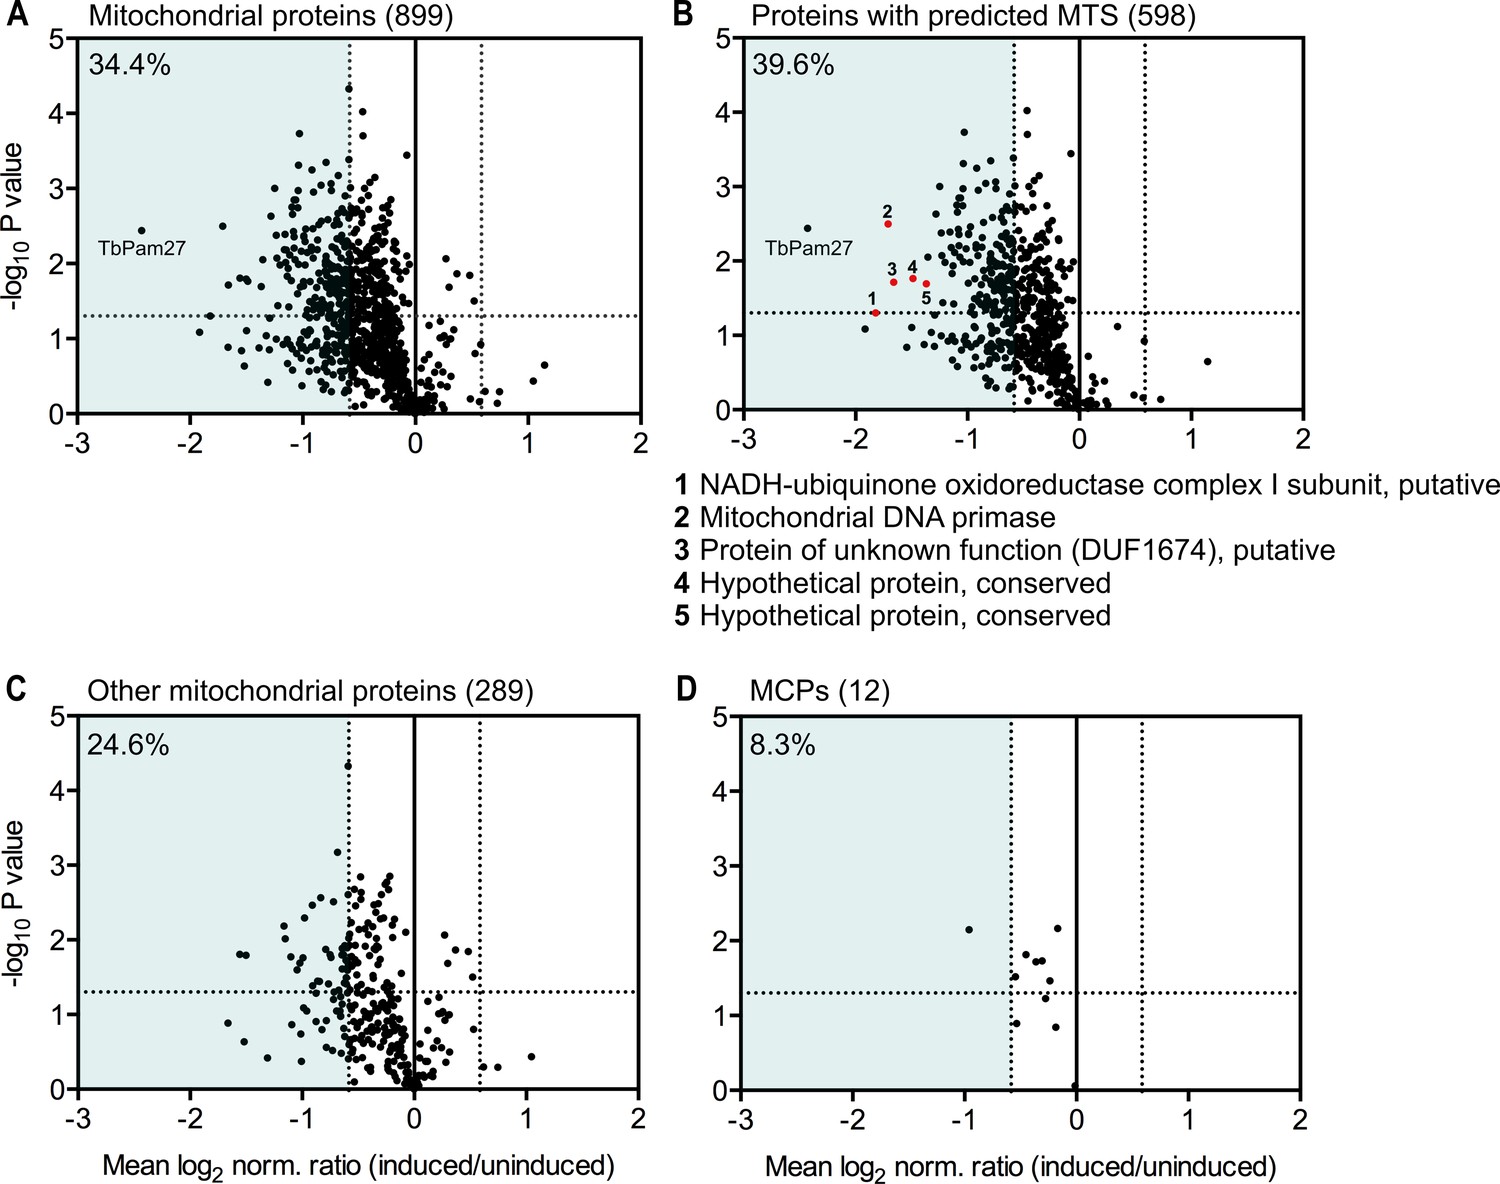
Global mitochondrial proteome changes upon ablation of TbPam27.
Digitonin-extracted mitochondria-enriched fractions of uninduced and 1.5 days induced TbPam27 RNAi cells were subjected to SILAC-based quantitative MS. The mean log2 of normalized ratios (induced/uninduced) was plotted against the corresponding -log10 P value (two sided t-test). (A) Volcano plot depicts all mitochondrial proteins identified in this experiment (Peikert et al., 2017). (B) Volcano plot shows proteins with a predicted mitochondrial targeting sequence (MTS) (Almagro Armenteros et al., 2019). Numbered red dots and the respective protein names below the figure, correspond to the five most downregulated, significantly detected proteins besides TbPam27. (C) Volcano blot depicts the remaining other mitochondrial proteins, which were detected in this experiment, besides mitochondrial carrier proteins (MCPs), which are shown in (D). Numbers in parentheses specify how many proteins were detected in each subset. The horizontal dotted line indicates a t-test significance level of 0.05. The vertical dotted lines mark a fold-change in protein abundance of ±1.5 in each plot. The blue background indicates a downregulation of 1.5-fold. The percentage of proteins that are downregulated more than 1.5-fold in each sub-dataset is indicated in the upper left corner of each panel. For a list of all proteins identified in the SILAC-MS experiment see Figure 9—source data 1.
-
Figure 9—source data 1
List of proteins identified in SILAC-MS experiments of mitochondria-enriched fractions from TbPam27 RNAi cells.
- https://cdn.elifesciences.org/articles/52560/elife-52560-fig9-data1-v2.xlsx
Figure 9—figure supplement 1

Ablation of TbPam27 has no direct effect on the TIM complex stability.
Digitonin-extracted mitochondria-enriched fractions of uninduced and 1.5 days induced TbPam27 RNAi cells were subjected to SILAC-based quantitative MS (triplicate experiments). The mean log2 of normalized ratios (induced/uninduced) was plotted against the corresponding -log10 P value (two sided t-test) for the 14 detected components of the TIM complex. The horizontal dotted line indicates a t-test significance level of 0.05 and vertical dotted line marks a fold-change in protein abundance of ±1.5.
Figure 10

Evolutionary scenario explaining the homologue replacement observed in the T. brucei PAM.
(A) Ancestral situation predicted for LECA. TIM23 and TIM22 complexes are shown in light gray their and respective pore-forming subunits (Tim23, Tim22) are indicated. PAM subunits are shown in dark orange. Only Pam18, Pam16 and mHsp70 are shown. (B) The J domain-containing protein TbPam27 (light orange) is recruited to the ancient pro-kinetoplastid TIM22 complex and may has enabled interaction with mHsp70. Initially this would have been neutral. (C) The TIM22 complex of the ancient kinetoplastid acquires the capability to translocate presequence-containing proteins, possibly through the recruitment of the trypanosomal presequence translocase specific TimRhom I and TimRhom II (D). This allows for deleterious mutations and eventual disappearance of the trypanosomal TIM23 complex. TbPam18 and TbPam16 were retained because they either acquired a new as yet unknown function, or hold an overlooked ancestral role.
Tables
Key resources table
| Reagent type (species) or resource | Designation | Source or reference | Identifiers | Additional information | |
|---|---|---|---|---|---|
| Gene (Trypanosoma brucei) | TbPam27 | TriTrypDB:Tb927.10.13830 | |||
| Gene (T. brucei) | TbPam18 | TriTrypDB:Tb927.8.6310 | |||
| Gene (T. brucei) | TbPam16 | TriTrypDB:Tb927.9.13530 | |||
| Gene (T. brucei) | Tb927.4.650 | TriTrypDB:Tb927.4.650 | |||
| Gene (T. brucei) | TbmHsp70 | TriTrypDB:Tb927.6.3740; Tb927.6.3750; Tb927.6.3800 | |||
| Gene (T. brucei) | ACAD | TriTrypDB:Tb927.8.1420 | |||
| Cell line (T. brucei) | 29–13, procyclic | PMID: 10215027 | |||
| Cell line (T. brucei) | L1γL262P, BSF | PMID: 23959897 | |||
| Antibody | Anti-HA (mouse, monoclonal) | BioLegend | 901503 (MMS-101R) | WB(1:5000) | |
| Antibody | Anti-myc (mouse, monoclonal) | Invitrogen | 132500 | WB(1:2000) | |
| Antibody | Anti-ATOM40 (rabbit, polyclonal) | Other | Previously produced in our lab WB(1:10000) | ||
| Antibody | Anti-TbTim17 (rat, polyclonal) | Other | Previously produced in our lab WB(1:100) | ||
| Antibody | Anti-TimRhom I (rabbit, polyclonal) | Other | Previously produced in our lab WB(1:150) | ||
| Antibody | Anti-VDAC (rabbit, polyclonal) | Other | Previously produced in our lab WB(1:1000) | ||
| Antibody | Anti-Cox IV (rabbit, polyclonal) | Other | Previously produced in our lab WB(1:1000) | ||
| Antibody | Anti-EF1a (mouse, monoclonal) | Merk Millipore | 05–235 | WB(1:10000) | |
| Antibody | Anti-Cytochrome C (rabbit, polyclonal) | Other | Previously produced in our lab WB(1:100) | ||
| Antibody | Anti-ATOM69 (rabbit, polyclonal) | Other | Previously produced in our lab WB(1:50) | ||
| Antibody | Anti-mouse (goat, HRP-coupled) | Sigma Aldrich | A4416 | WB(1:5000) | |
| Antibody | Anti-mouse IRDye 680LT conjugated (goat) | LI-COR Biosciences | PN 926–68020 | WB(1:20000) | |
| Antibody | Anti-rabbit IRDye 800CW conjugated (goat) | LI-COR Biosciences | PN 926–32211 | WB(1:20000) | |
| Recombinant DNA reagent | TbPam27 ORF RNAi (plasmid) | This paper | See Material and methods | ||
| Recombinant DNA reagent | TbPam27 5’UTR RNAi (plasmid) | This paper | See Material and methods | ||
| Recombinant DNA reagent | TbPam18 ORF RNAi (plasmid) | This paper | See Material and methods | ||
| Recombinant DNA reagent | TbPam16 ORF RNAi (plasmid) | This paper | See Material and methods | ||
| Recombinant DNA reagent | Tb927.4.650 ORF RNAi (plasmid) | This paper | See Material and methods | ||
| Recombinant DNA reagent | TbPam27-3xmyc (plasmid) | This paper | See Material and methods | ||
| Recombinant DNA reagent | TbPam27-3xHA (plasmid) | This paper | See Material and methods | ||
| Recombinant DNA reagent | TbPam27wt(plasmid) | This paper | See Material and methods | ||
| Recombinant DNA reagent | TbPam27H77Q(plasmid) | This paper | See Material and methods | ||
| Recombinant DNA reagent | TbPam18-3xHA (plasmid) | This paper | See Material and methods | ||
| Recombinant DNA reagent | TbPam16-3xHA (plasmid) | This paper | See Material and methods | ||
| Recombinant DNA reagent | Tb927.4.650-3xHA (plasmid) | This paper | See Material and methods | ||
| Recombinant DNA reagent | LDH-DHFR-3xHA (plasmid) | PMID: 27991487 | |||
| Recombinant DNA reagent | LDH-DHFR-3xmyc (plasmid) | PMID: 27991487 | |||
| Recombinant DNA reagent | MCP12ΔI-myc (plasmid) | PMID: 27991487 | |||
| Commercial assay or kit | Prime-a-Gene labelling kit | Promega | U1100 | Radioactive labelling of Northern probes | |
| Commercial assay or kit | SuperSignal West Femto maximum sensitivity substrate | Thermo Scientific | 34096 | Detection of BN-PAGE Western blot signals | |
| Chemical compound, drug | Tetracycline Hydrochloride | Sigma Aldrich | T7660 | Induction of gene expression | |
| Chemical compound, drug | Aminopterin | Sigma Aldrich | A1784 | Presequence pathway intermediate stalling | |
| Chemical compound, drug | Sulfanilamide | Sigma Aldrich | S9251-100G | Presequence pathway intermediate stalling | |
| Chemical compound, drug | Digitonin | Biosynth | 103203 | Generation of crude mitochondrial fractions | |
| Chemical compound, drug | Lysine-L U-13C, U-15N | Euroisotop | CNLM-291-H-0.5 | SILAC labelling | |
| Chemical compound, drug | Arginine-L U-13C6, U-15N4 | Euroisotop | CNLM-539-H-1 | SILAC labelling | |
| Software, algorithm | GraphPad Prism, version 6.0 f | GraphPad Software | www.graphpad.com | Depiction of growth curves, quantifications and volcano blots. | |
| Software, algorithm | ImageJ | https://doi.org/10.1038/nmeth.2089 | Densitometric quantifications | ||
| Other | EZView Red Anti-c-myc affinity gel | Sigma Aldrich | E6654 | CoIP | |
| Other | Anti-HA affinity matrix | Roche | 11815016001 | CoIP | |
Additional files
Download links
A two-part list of links to download the article, or parts of the article, in various formats.
Downloads (link to download the article as PDF)
Open citations (links to open the citations from this article in various online reference manager services)
Cite this article (links to download the citations from this article in formats compatible with various reference manager tools)
Homologue replacement in the import motor of the mitochondrial inner membrane of trypanosomes
eLife 9:e52560.
https://doi.org/10.7554/eLife.52560


