Linker histone H1.2 and H1.4 affect the neutrophil lineage determination
- Max Planck Institute for Infection Biology, Department of Cellular Microbiology, Germany
- University of Dundee, School of Life Sciences, Division of Cell Signalling and Immunology, United Kingdom
- Institut für Biologie, Humboldt Universität zu Berlin, Germany
- Max Planck Institute for Molecular Genetics, Germany
- Department of Cell Biology, Albert Einstein College of Medicine, United States
Figures
Figure 1 with 1 supplement

A genome-wide screen to identify genes required for PLB-985 cells differentiation and function.
(a–d) Characterization of PLB-985 differentiation and function at d0, d3 and 7 of differentiation. (a) Electron microscopy images of PLB-985 showing acquisition of granules (green arrows, the black arrow at d0 indicates mitochondria) and changes in nuclear morphology. Scale bars correspond to 5 μm. (b) ROS production of PLB-985 in response to 100 nM PMA, showing that only fully differentiated PLB-985 produced an oxidative burst. (c) Surface expression of CD11b, depicted is the percentage of CD11b positive cells out of all viable singlets. (d) PMA-induced cell death was measured over time after addition of the cell-impermeable DNA dye SYTOX Green and analysis of fluorescence indicating cell death. ‘d7 naïve’ indicates differentiated cells, which were not treated with PMA. (e) Representative images of differentiated PLB-985 (d7) after addition of SYTOX Green and treatment with or without PMA. Scale bars are 20 μm. (f) Outline of the CRISPR/Cas9 screen. Cells were transduced with a genome-wide CRISPR/Cas9 library (lentiviral particles, small circles), differentiated for 7 days, treated with PMA for 16 hr and survivors were sorted and sequenced to identify sgRNAs. (g) Top 10 of the screen, H1.2 (HIST1H1C) and indicated genes with known neutrophil functions, ranked first by % of overrepresented guides and then by median overrepresentation and mapped to a proteome list of human primary neutrophils. (b–d) Depicted are mean -/+ SEM of 3 independent experiments.
-
Figure 1—source data 1
List of genes identified as hits in the CRISPR/Cas9 screen.
The table shows gene ID and the fold representation of identified sgRNAs in PMA-treated versus untreated PLB-985. sgRNAS that were not identified in either sample are labelled as NA. The table also shows the median and mean values per gene and the percentage of overrepresented (at least two fold) sgRNAs.
- https://cdn.elifesciences.org/articles/52563/elife-52563-fig1-data1-v3.xlsx
Figure 1—figure supplement 1
Characterization of PLB-985 function and morphology.
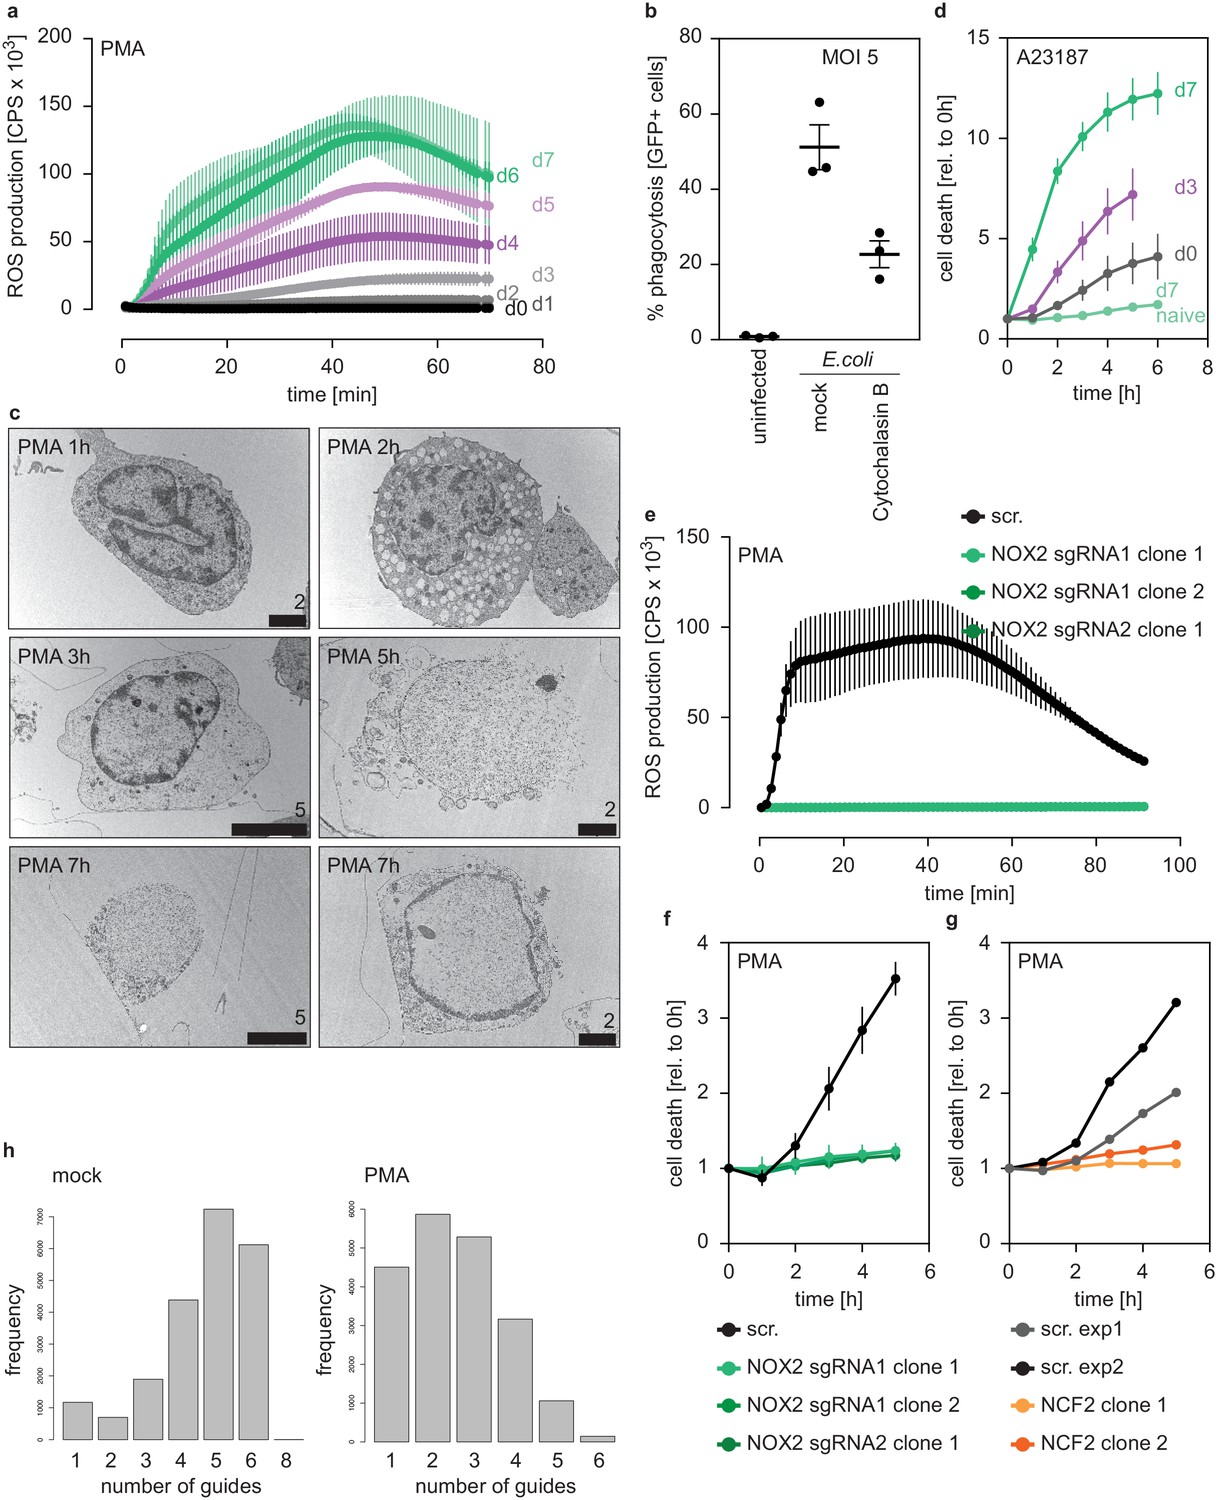
(a) ROS production of PLB-985 in response to PMA at different time points of differentiation, depicted are mean -/+ SEM of two independent experiments. (b) Phagocytosis assay of differentiated (d7) PLB-985 incubated with GFP-expressing E. coli (multiplicity of infection (MOI): 5), phagocytosis was analyzed by flow cytometry of GFP-positive cells. The phagocytosis inhibitor cytochalasin B (Sigma, 5 μM) was used as a control. (c) Transmission electron microscopy (TEM) images of differentiated PLB-985 (d7) stimulated with PMA for the indicated time points, demonstrating nuclear expansion and, in some cases (5 hr example), nuclear rupture and chromatin release. Scale bars correspond to indicated values in μm. (d) Cell death in response to the calcium ionophore A23187 (5 μM) at different time points of differentiation, measured by SYTOX Green fluorescence. Depicted are mean -/+ SEM of 3 independent experiments, ‘d7 naive’ are differentiated, but untreated cells and are the same values as in Figure 1d. (e) ROS production of independent NOX2 (CYBB) - / - clones (derived from two sgRNAs) after treatment with PMA. (f) Cell death of independent NOX2 - / - clones (derived from two sgRNAs) after treatment with PMA. (e, f) depicted is the mean -/+ SEM of 2–3 independent experiments. (g) Reduced cell death of two clones deficient in NCF2 in response to PMA, depicted is the mean of 1 experiment per clone and the scrambled (scr.) controls for the respective experiments. (h) sgRNA distribution of PLB-985 after library transduction and differentiation. The left panel shows all sgRNAs identified in the mock-treated sample and demonstrates that mostly 4–6 sgRNAs per gene were identified, indicating good library coverage. The right panel shows the PMA-treated condition where fewer sgRNAs were identified and a left shift was observed, demonstrating selection pressure.
Figure 2 with 1 supplement
H1.2 and H1.4 are required for PLB-985 differentiation.
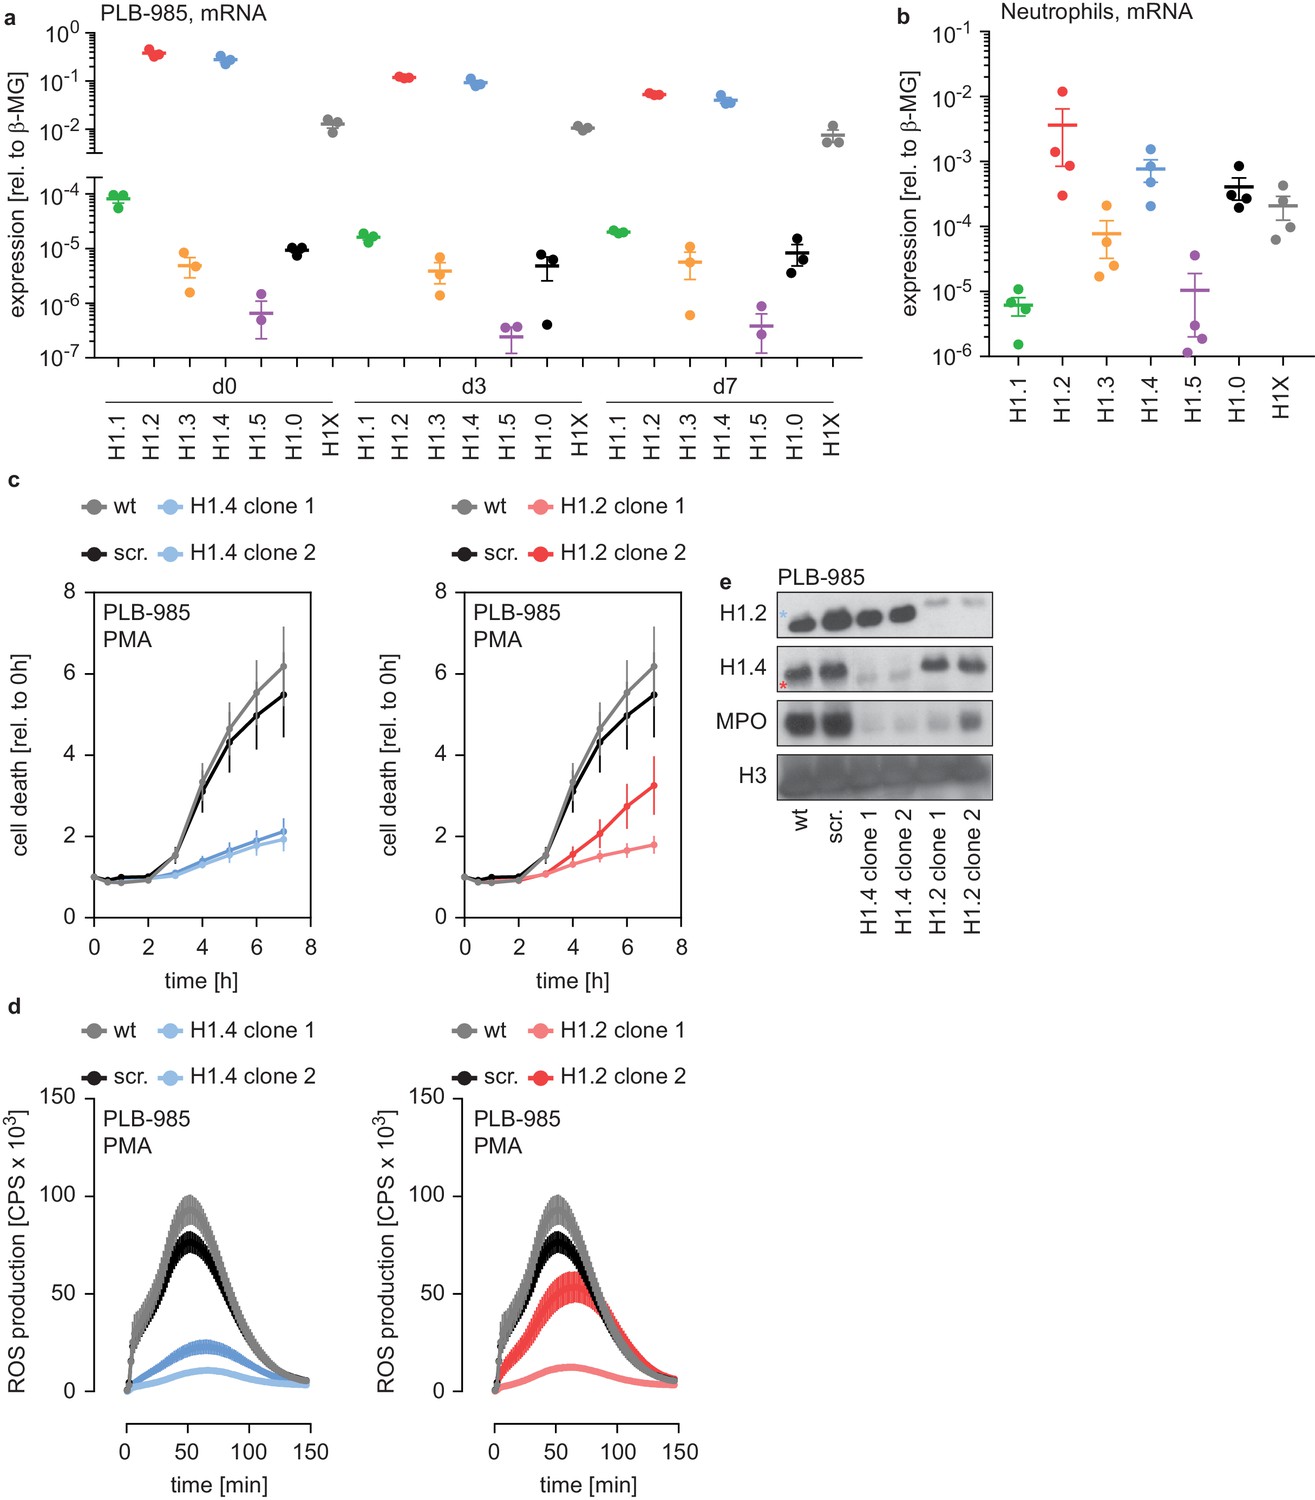
(a) mRNA expression levels of indicated H1 subtypes (nomenclature refers to protein names) in PLB-985 cells at d0, d3 and d7 of differentiation, relative to the housekeeping gene β-microglobulin, depicted is the mean -/+ SEM of 3 independent experiments. (b) mRNA expression levels of indicated H1 subtypes in human primary neutrophils, relative to β-microglobulin. Data points are from four different donors, error bars are mean -/+ SEM. (c) PMA-induced cell death of wild type (wt) scrambled sgRNA (non-target, scr.) and two clones of either H1.2 or H1.4 over time, measured by SYTOX Green fluorescence. Depicted are mean -/+ SEM of 5 independent experiments of cells at d7 of differentiation. (d) Measurement of PMA-induced ROS production from wt, scr. and H1.2 or H1.4 deficient PLB-985, depicted are mean -/+ SEM of 5 independent experiments at d7 of differentiation. (c, d) wt and scr. values are the same in the left and right panels, respectively. (e) Western blot of lysates of PLB-985 at d3 of differentiation, showing efficient disruption of H1.2 and H1.4 (both antibodies recognize the other subtype, which is marked by a red asterisk for H1.2 and a blue asterisk for H1.4) as well as reduced MPO expression, the core histone H3 served as loading control.
Figure 2—figure supplement 1
H1 expression levels in human PBMCs, monocytes and PLB-985.
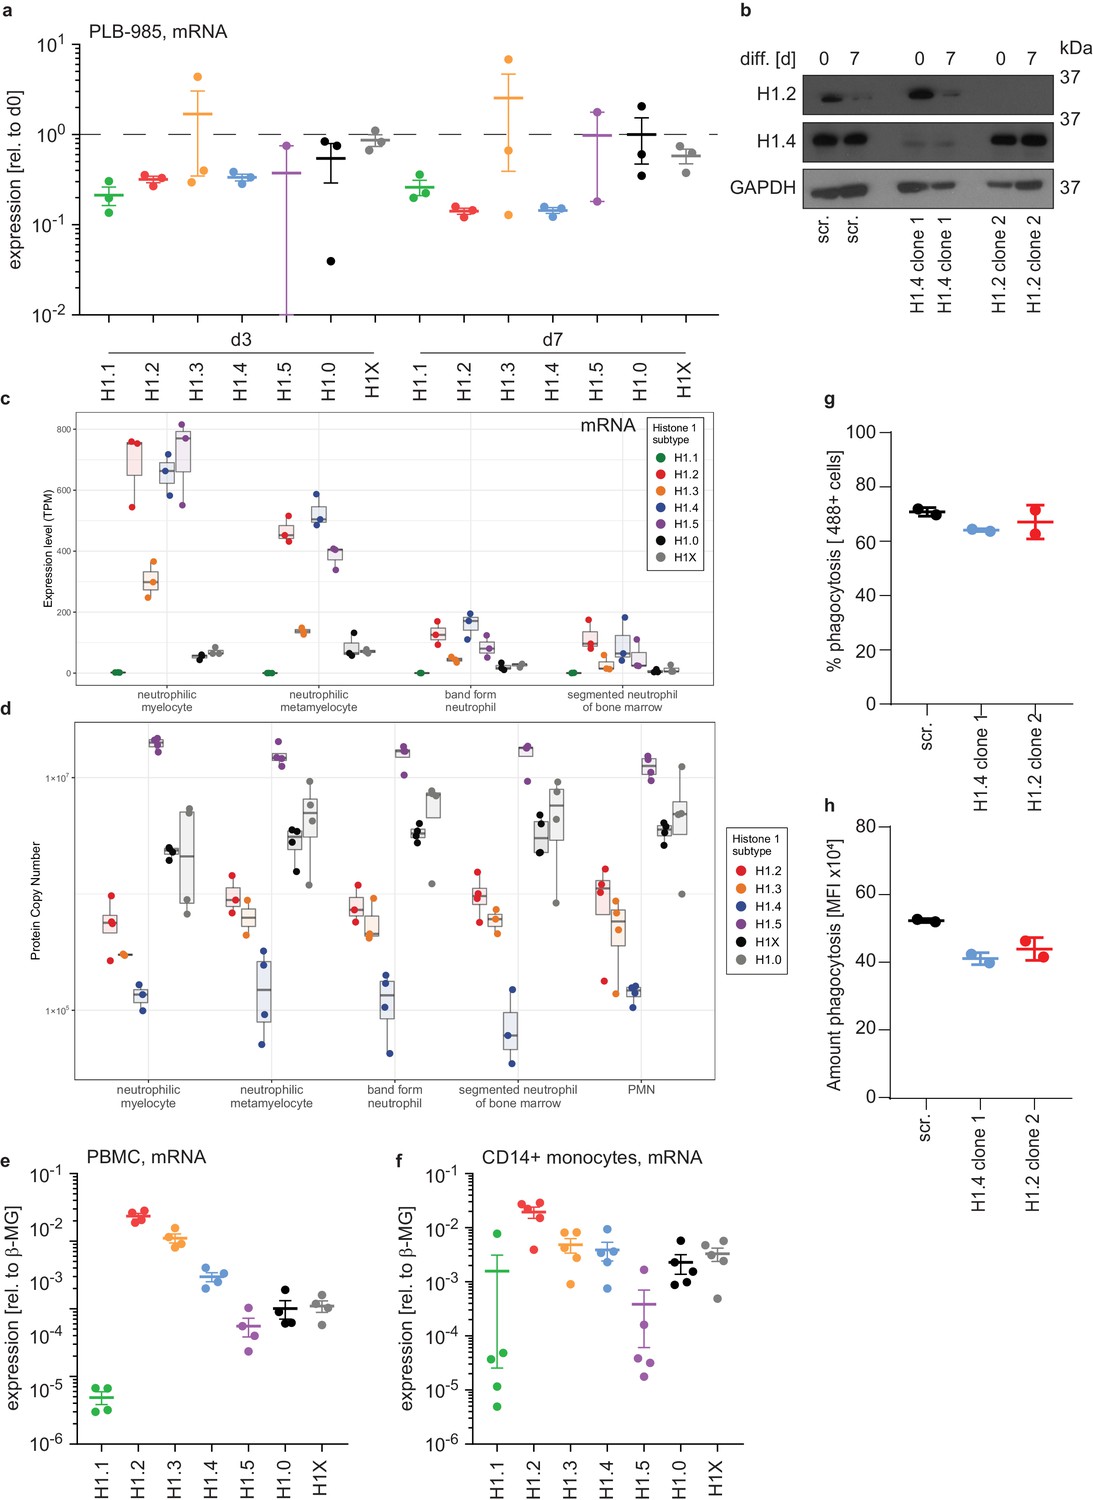
(a) Relative mRNA expression levels corresponding to Figure 2a, values are relative to d0 of differentiation and indicate reduction of mRNA expression for genes encoding H1.1, H1.2, H1.4 and H1.5 during differentiation. Dashed line indicates unchanged expression. Note that the distribution of samples varied much more in the lowest expressed subtypes H1.3 and H1.5. (b) Western blot analysis of H1.2 and H1.4 levels during differentiation of PLB-985 at d0 and d7. Depicted are control (scr.) cells as well as one clone per sgRNA for H1.4 and H1.2. (c) Transcripts per million (TPM) for the indicated H1 subtypes were calculated for human primary bone marrow cells (Metzler et al., 2011) at indicated (increasing from left to right) stages of differentiation. mRNA for somatic H1 subtype decreases with differentiation, reflecting exit of cell cycle. (d) Estimated protein copy numbers for the indicated H1 subtypes calculated from a proteomics dataset (Iwasaki et al., 2006) at indicated time points of differentiation. H1 subtype protein expression is relatively stable over time. (e, f) mRNA expression levels of indicated H1 subtypes in human primary peripheral blood mononuclear cells (PBMC) (c) or in MACS-sorted CD14+ human primary monocytes (d). Each dot represents a healthy donor, error bars are -/+ SEM. (g, h) Phagocytosis of fluorescently labelled E. coli by PLB-985 of the indicated genotypes at d7 of differentiation. Shown is the percentage (g) and the MFI (h) of cells. Loss of H1.2 or H1.4 does not affect phagocytosis. Each dot represents an independent experiment, error bars are -/+ SD.
Figure 3 with 1 supplement
H1 effects on PLB-985 differentiation are subtype-specific.
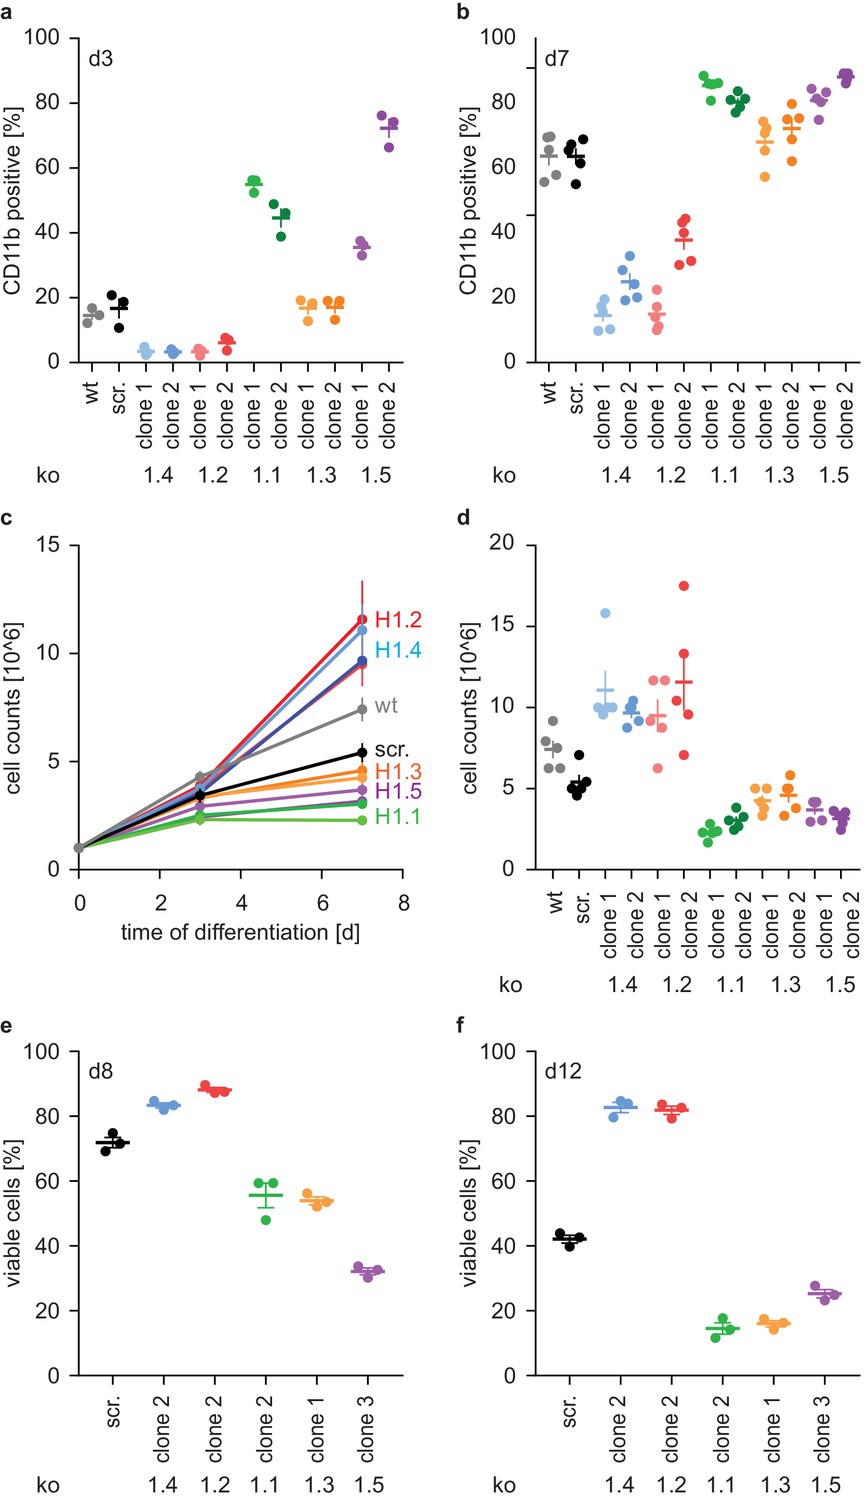
(a, b) Expression of the surface marker CD11b at d3 (a) or d7 (b) of differentiation. Depicted is the percentage of CD11b-positive cells out of all living singlets for wt, scrambled (scr.) and two knockout clones per H1 subtype. (c, d) Growth curves of PLB-985 during differentiation (c) and cell counts at d7 of differentiation (d) show restricted growth of H1.1, H1.3 and H1.5-deficient cells and enhanced growth of H1.2 and H1.4-deficient clones. (a–d) Depicted are five independent experiments, error bars are SEM. (e, f) Viability, as determined by DAPI negative cells, at d8 (e) and d12 (f) of differentiation of 3 independent experiments. Error bars are SEM.
Figure 3—figure supplement 1
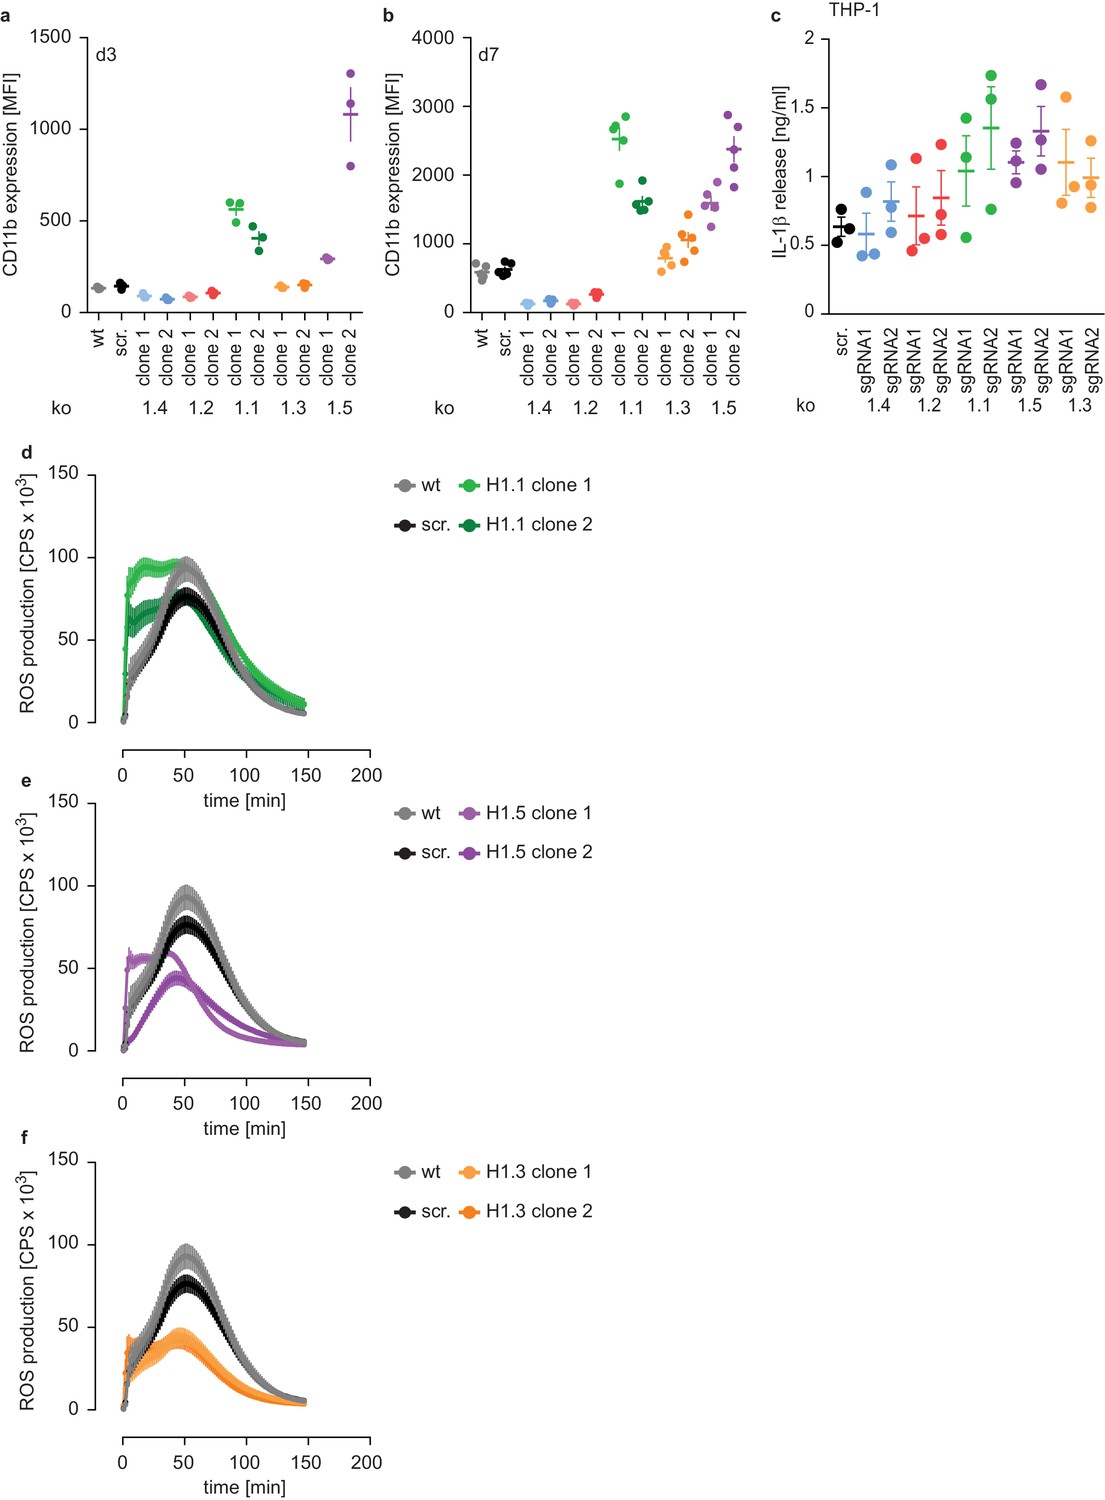
Subtype-specific H1 impact on PLB-985 maturation and function.
(a, b) Flow cytometry analysis corresponding to Figure 3a,b, depicted is the mean fluorescence intensity (MFI) of CD11b in indicated samples at d3 (a) or d7 (b) of differentiation. Each dot represents an independent experiment; error bars are -/+ SEM. (c) IL-1β production of THP-1 as a readout of monocyte activation. THP-1 of the indicated genotypes were differentiated with PMA for 3 days, primed with 1 μg/ml ultrapure LPS overnight and induced to secrete IL-1β with 100 μg/ml silica crystals for 6 hr. Each dot represents an independent experiment, shown is the mean -/+ SEM. d-e ROS production of indicated clones in response to PMA. Depicted is the mean -/+ SEM of 5 independent experiments. wt and scr. values are the same as in Figure 2d.
Figure 4 with 3 supplements
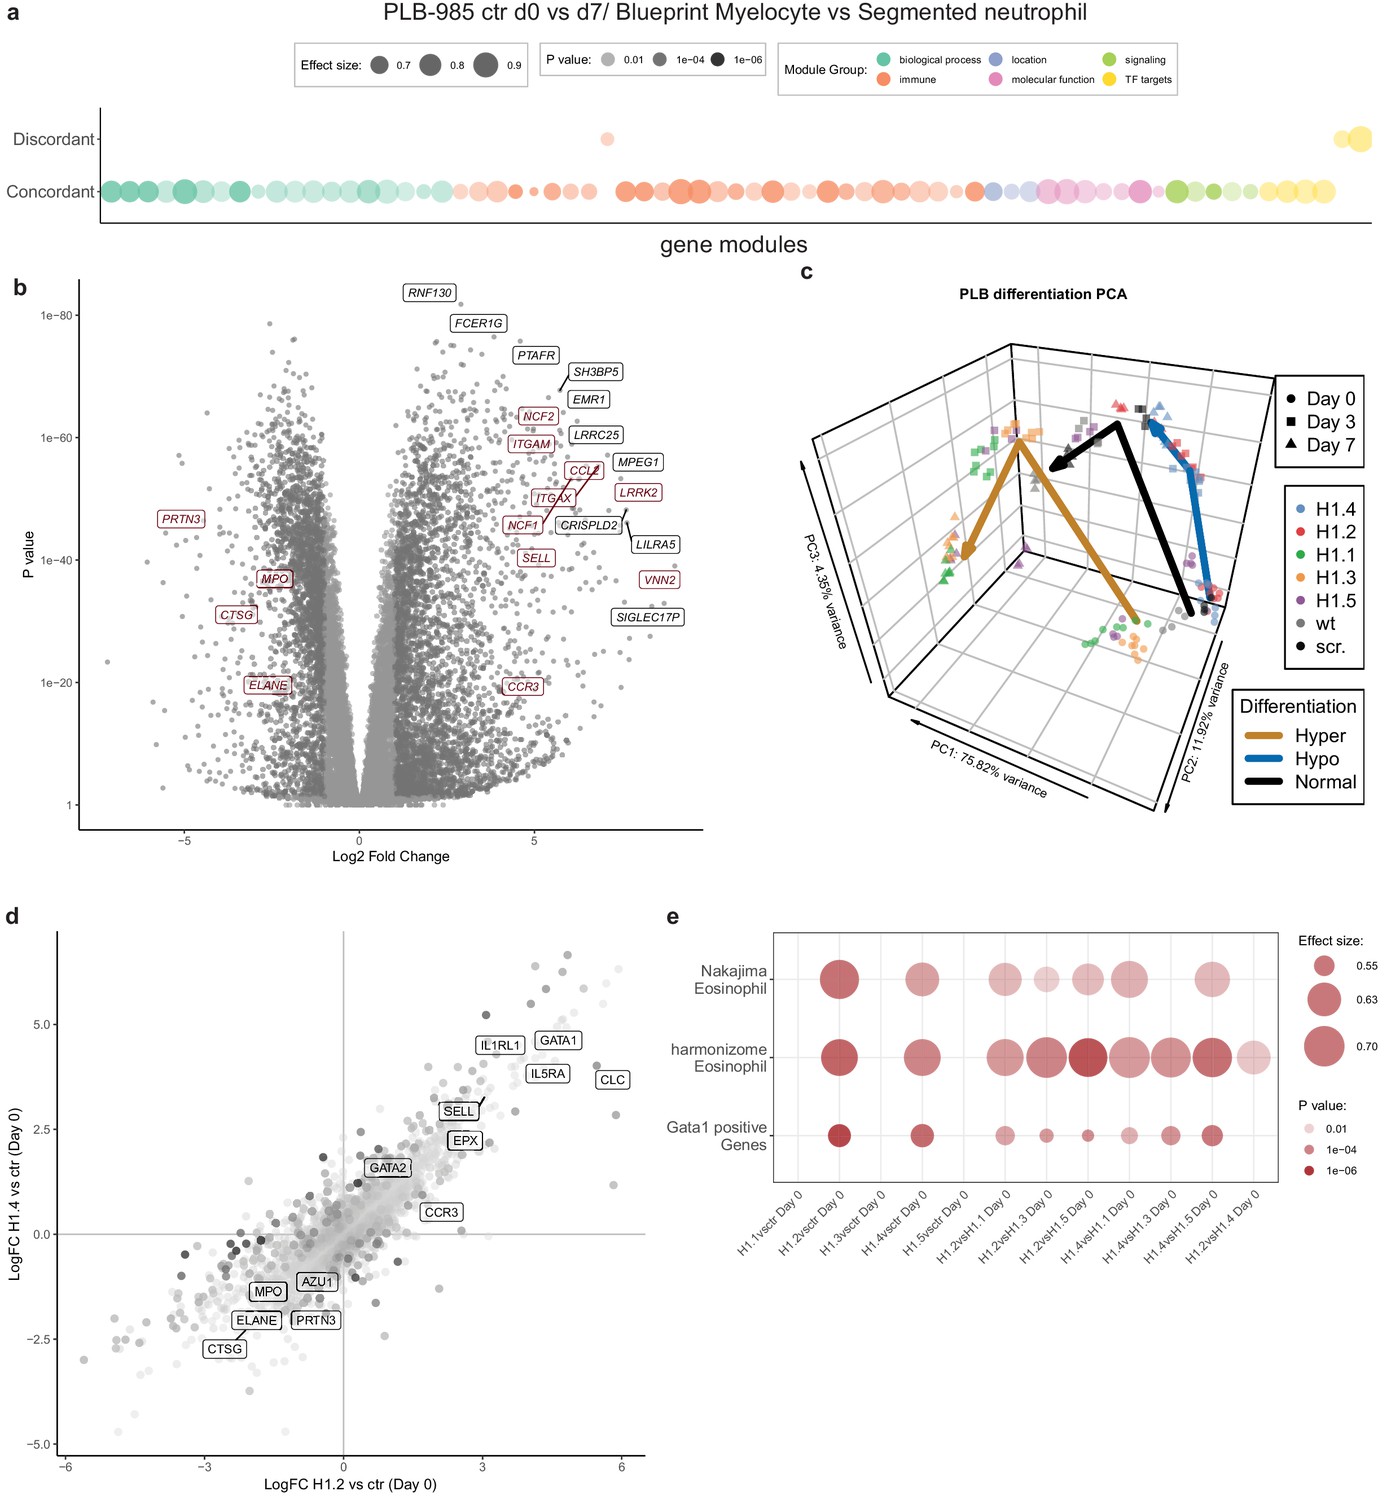
RNA-seq reveals H1 subtype-specific effects on differentiation and an eosinophilic signature of undifferentiated H1.2/H1.4 knockout lines.
(a) Concordantly and discordantly regulated genes when comparing PLB-985 differentiation (wt and scr., d0 to d7) and human neutrophil differentiation (Blueprint, neutrophilic myelocyte to segmented neutrophil of bone marrow) using discordance scores and tmod. Most modules are concordantly regulated. (b) Volcano plot of all differentially expressed genes of control cells (wt and scr.) between d7and d0, darker gray depicts p<0.05 and logFC >2. A selection of strongly upregulated genes is labelled and neutrophil markers are highlighted in red. Expression of granule proteins, such as MPO, neutrophil elastase (ELANE), proteinase 3 (PRTN3) and cathepsin G (CTSG) decreases during differentiation. (c) Principal component analysis (PCA) of control and mutant PLB-985 during differentiation shows clustering according to experimental replicates and genotypes and separates samples according to differentiation state. Lines indicate the center-of-mass trajectory for ‘normal’ (wild type and scr. cells), ‘hyper’ (H1 clones with enhanced differentiation) and ‘hypo’ (H1 clones with reduced differentiation) samples. While lines deficient in H1.1, H1.3 and H1.5 already at d3 cluster closely to wt and scr. at d7, indicating faster and more efficient differentiation, H1.2 and H1.4-deficient clones at d7 still only cluster with wt and scr. at d3, indicating a stalled development.(d) Scatter dot plot depicting differentially expressed genes of H1.2 knockouts vs control cells at d0 of differentiation (x axis) and H1.4 knockouts vs control cells at d0 of differentiation (y axis), color (alpha) indicates p-value of differential expression between H1.2 and H1.4 at d0. Neutrophil genes such as neutrophil elastase (ELANE), proteinase 3 (PRTN3), cathepsin G (CTSG), azurocidin (AZU1) and MPO are strongly downregulated in both conditions when compared to wt and scr., whereas eosinophil genes such as galectin 10 (CLC), interleukin-5 receptor alpha (IL5RA), GATA-1 (GATA1), GATA-2 (GATA2) or eosinophil peroxidase (EPX) are upregulated. (e) Gene set enrichment analysis of indicated samples at d0 of differentiation shows enhanced expression of eosinophil and GATA-1 gene sets (see Materials and methods) in H1.2 and H1.4-deficient lines, but not in other knockout conditions.
-
Figure 4—source data 1
RNA-seq expression tables.
The individual sheets display expression values of indicated conditions (Cont. is wild type and scr. combined, for the respective H1 subtypes values of 2 clones are combined).
- https://cdn.elifesciences.org/articles/52563/elife-52563-fig4-data1-v3.xlsx
Figure 4—figure supplement 1
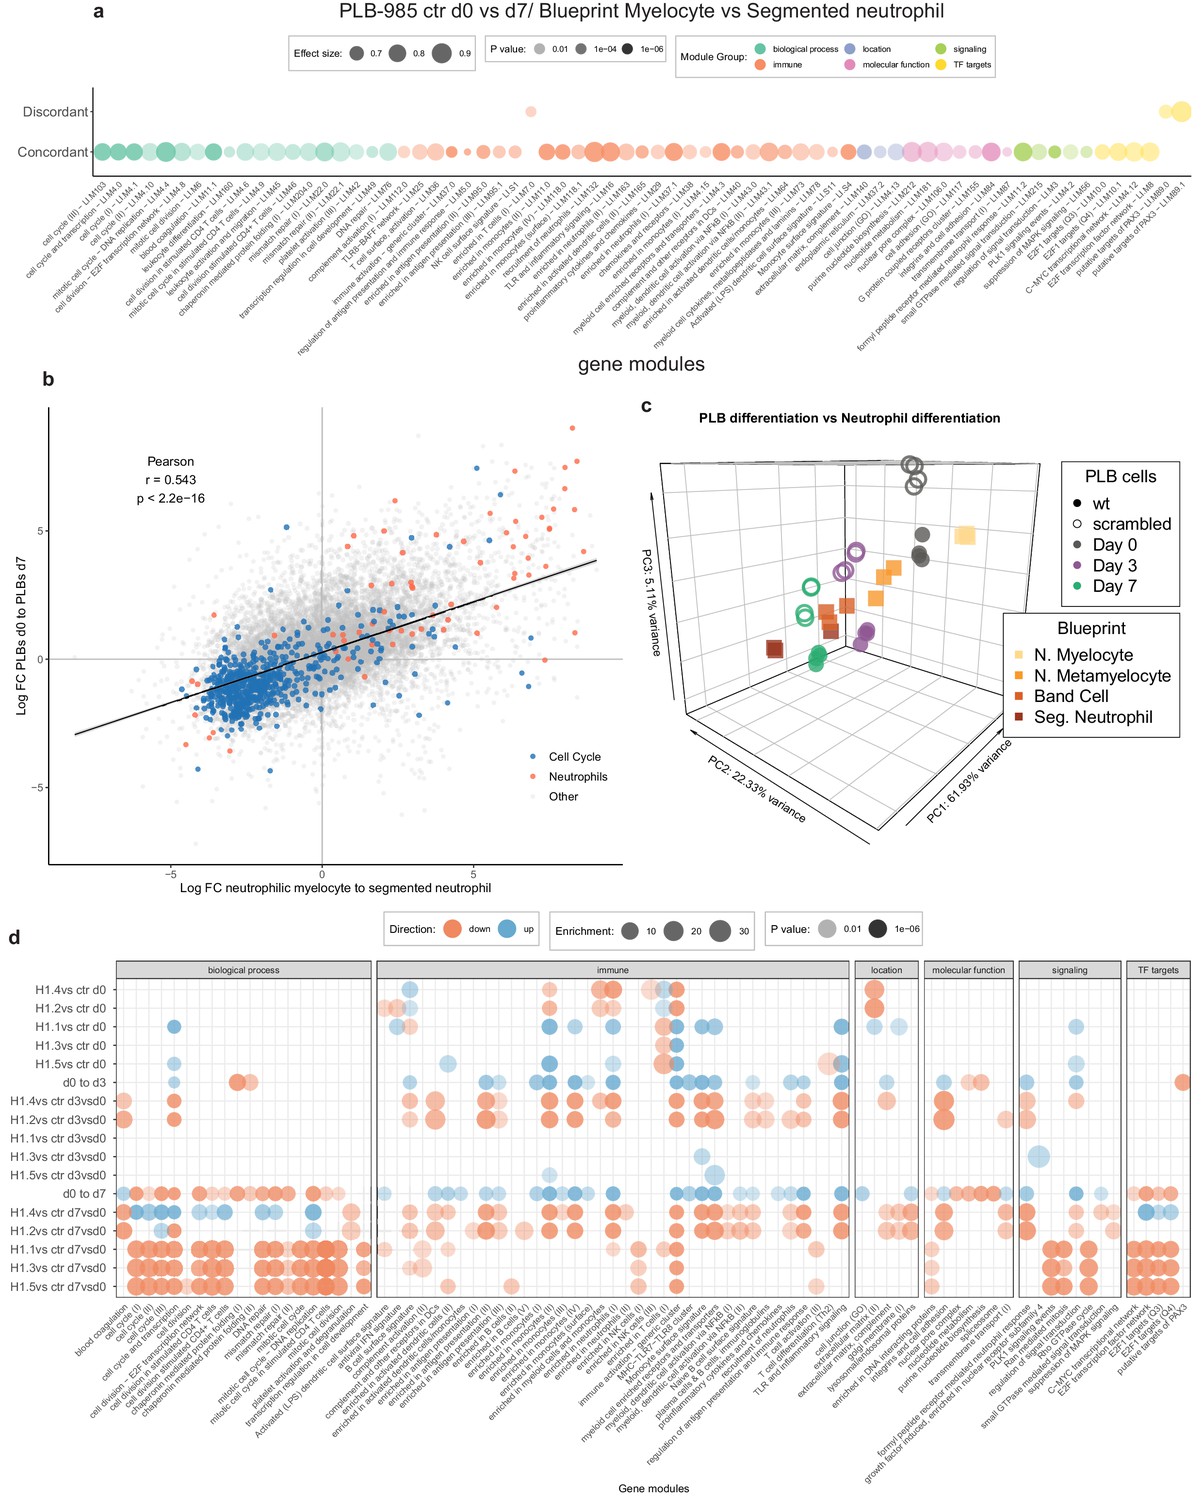
Transcriptional differences between H1-deficient clones during differentiation.
(a) Concordantly and discordantly regulated modules when comparing PLB-985 differentiation (wt and scr., d0 to d7) and human neutrophil differentiation (Blueprint, neutrophilic myelocyte to segmented neutrophil of bone marrow) using discordance scores and tmod. Same values as in Figure 4a, showing the annotated names of modules. (b) Scatter dot plot showing all genes (each dot represents one gene, colors refer to genes belonging to the aggregated neutrophil or cell cycle modules) and their regulation in differentiating PLB-985 compared to human primary cells, demonstrating that neutrophil-annotated modules and cell cycle-annotated modules are mostly regulated in a concordant manner. (c) Principal component analysis of control (wt and scr.) samples compared to human primary RNA-seq data of bone marrow neutrophil precursors (Myelocytes, Metamyelocytes, Band cells and segmented neutrophils of the bone marrow), derived from the blueprint consortium, showing a similar developmental trajectory of primary cells and PLB-985. (d) Gene module enrichment analysis of indicated genotypes; for mutant differentiation, the relative changes of gene module enrichment when compared to control cell differentiation is depicted.
Figure 4—figure supplement 2

Dysregulation of several transcription factors upon loss of H1 subtypes.
Heatmap showing the expression of mRNAs encoding GATA-1, GATA-2 and the indicated C/EBP family transcription factors identified in the RNA-seq data. Loss of H1.2 and H1.4 induces GATA-1 and GATA-2 expression and reduces expression levels of C/EBP-α at d0 of differentiation. C/EBP-β and C/EBP-δ are reduced at later time points whereas C/EBP-ε expression is enhanced at d7. Loss of H1.1, H1.3 and H1.5 induces expression of C/EBP-α, C/EBP-γ and C/EBP-ζ at d0 and of C/EBP-α, C/EBP-β and C/EBP-δ at later time points, whereas expression of C/EBP-ε is reduced at d7.
Figure 4—figure supplement 3
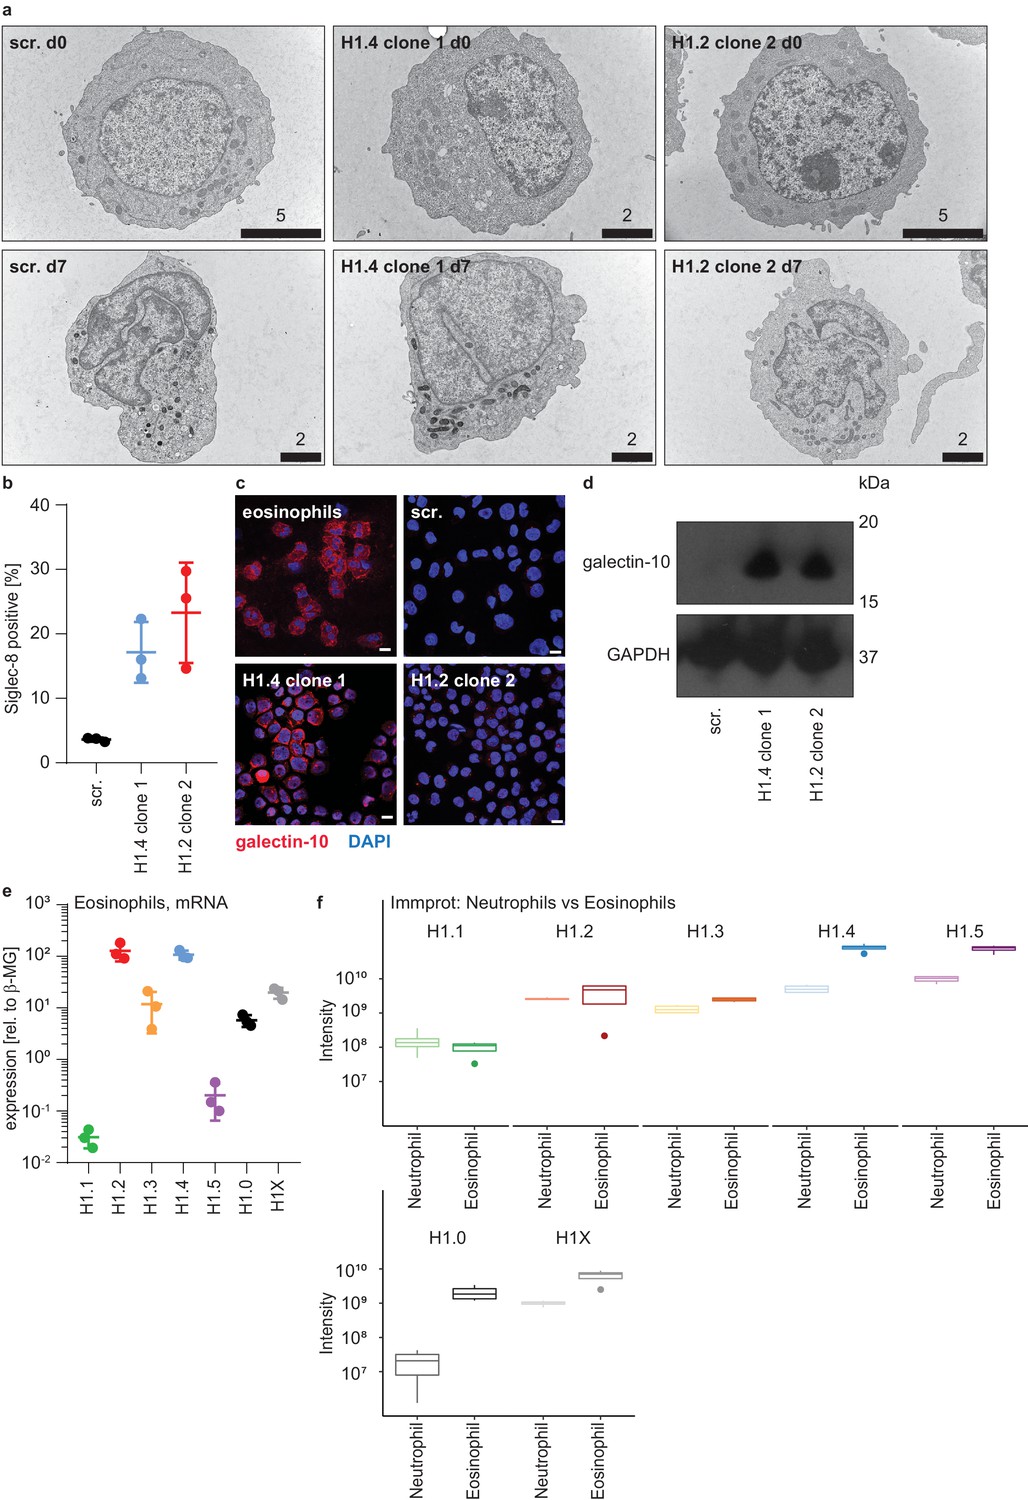
Expression of eosinophil markers in PLB-985 upon loss of H1.2 or H1.4.
(a) Transmission electron microscopy (TEM) pictures of control (scr.) PLB-985 and a clone of H1.4- and H1.2-deficient cells at indicated time points of differentiation. No clear changes in overall cell morphology were observed, except a more lobulated nuclear shape in scr. cells at d7. Numbers above bars indicate scale in μm. (b) Surface marker analysis at d7 of the eosinophil marker Siglec-8 by flow cytometry shows a subset of cells in H1.4- and H1.2-deficient cells expressing Siglec-8. Each dot represents an independent experiment, error bars are SD. (c) Immunofluorescence images of d7 PLB-985 of the indicated genotypes and of human primary eosinophils. The cells are stained with an antibody against galectin-10 (CLC), an eosinophil protein, and nuclei are counterstained with DAPI. Note that H1.2-deficient cells express galectin-10, but with a different localization in one granular spot. Scale bars represent 10 μm. (d) Western Blot analysis of galectin-10 expression in d7 PLB-985 of the indicated genotypes confirms enhanced expression of galectin-10 in H1.4- or H1.2-deficient cells. (e) qRT-PCR experiments showing mRNA expression levels of the indicated H1 subtypes in human primary eosinophils isolated from blood. Each dot represents a healthy donor, error bars are mean +/- SD. (f) Protein expression intensity values derived from the ‘Immprot’ dataset (Rieckmann et al., 2017) were used to compare neutrophils versus eosinophils to show that eosinophil protein intensities of H1 subtypes are similar to or higher than neutrophils.
Figure 5 with 7 supplements
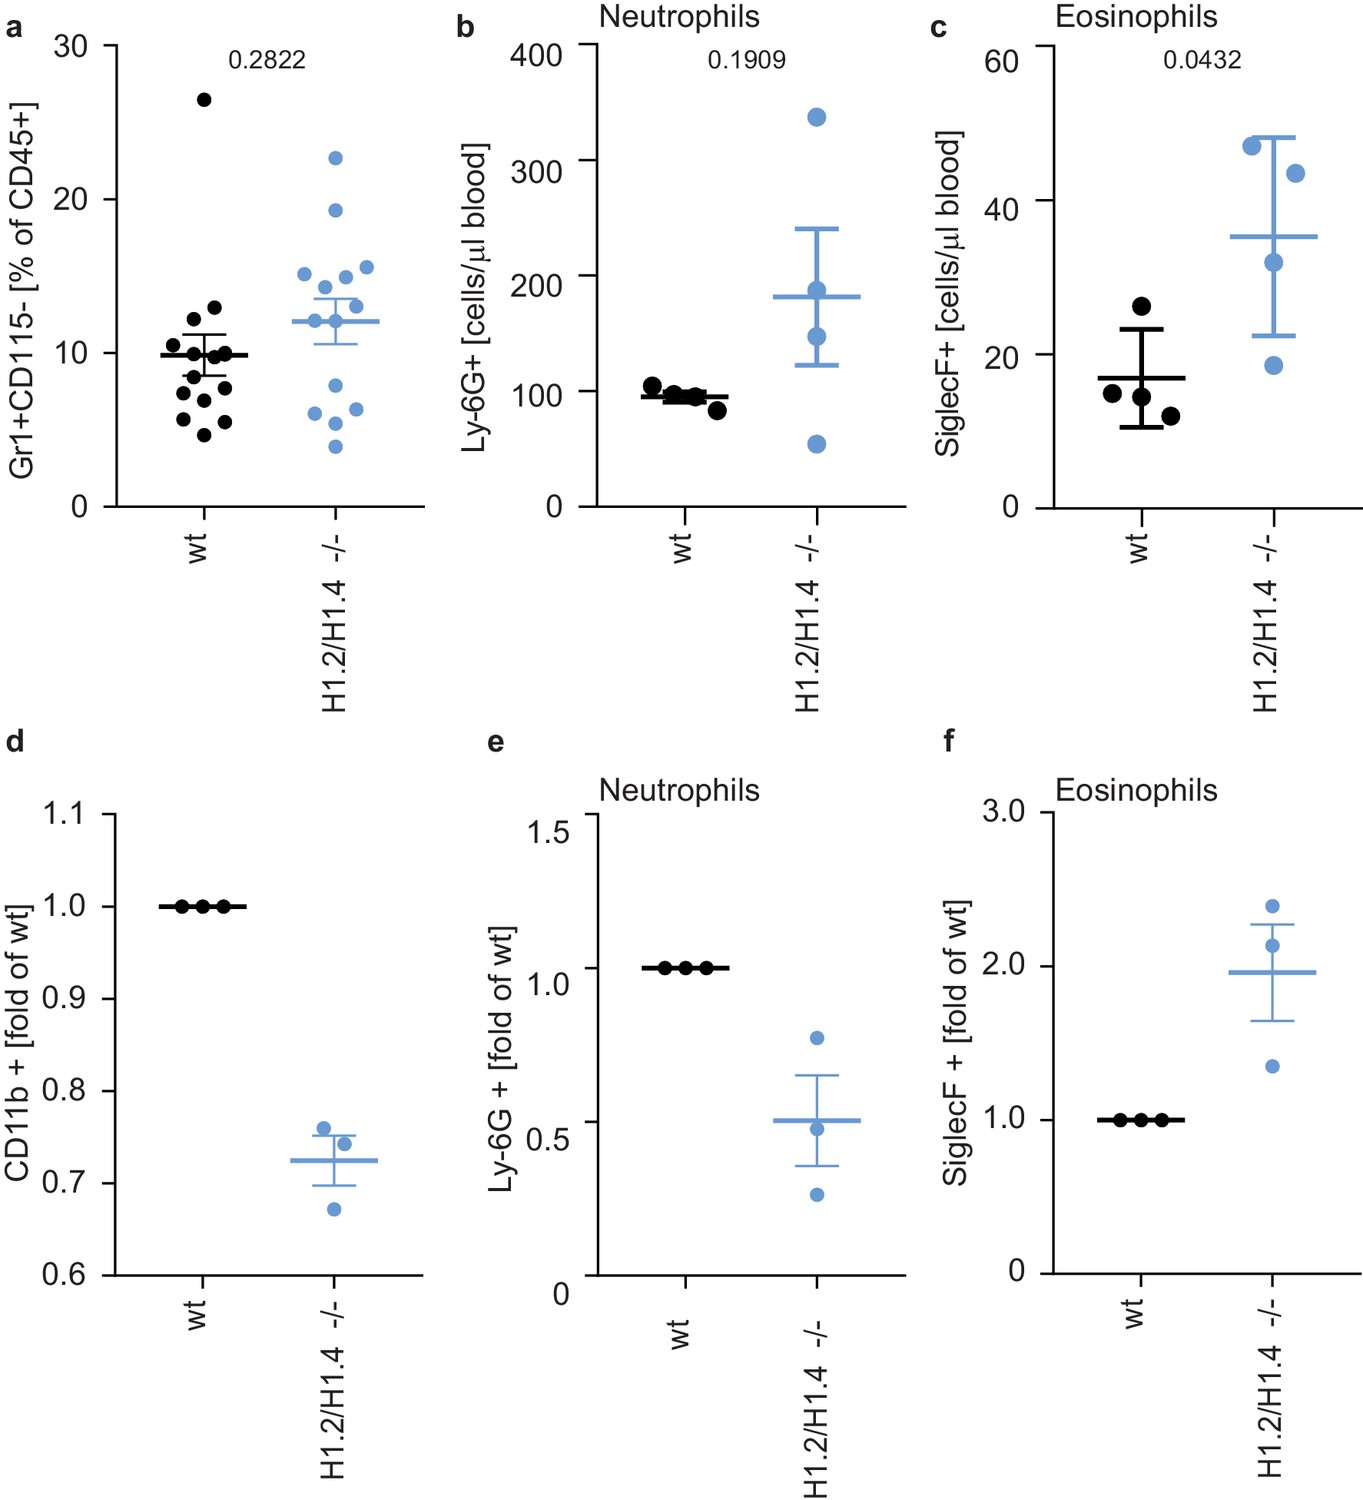
Deletion of H1.2 or H1.4 biases murine hematopoietic cells towards an eosinophil lineage.
(a–c) Analysis of circulating neutrophils and eosinophils in wild type (wt) and H1.2/H1.4-double deficient mice (H1.2/H1.4 -/-). p Values, derived from unpaired two-tailed T tests, are indicated. (a) Flow cytometry analysis of neutrophils (Gr1 positive, CD115 negative) in whole blood of adult age-matched animals (wt n = 15, H1.2/H1.4 - / - n = 14), other immune cell types are shown in Figure 5—figure supplement 1. (b) Flow cytometry analysis of absolute amounts of neutrophils (Ly-6G positive cells) in whole blood (n = 4). (c) Flow cytometry analysis of amounts of eosinophils (SiglecF positive) in whole blood (n = 4). H1.2/H1.4 - / - animals show enhanced eosinophil numbers in circulation. d-f Lineage-negative hematopoietic stem cells were sorted from murine bone marrow and cultured for 6 days in the presence of various cytokines allowing differentiation into several immune cell lineages. Depicted are CD11b positive cells (d) and the fraction of neutrophils (e) or eosinophils (f) within CD11b-positive cells. Each dot represents an independent experiment consisting of two mice per genotype, the mean of the two wild type animals was set to one and the mean of the two H1.2/H1.4 - / - animals is depicted relative to wt. (a–f) Error bars are SEM.
Figure 5—figure supplement 1
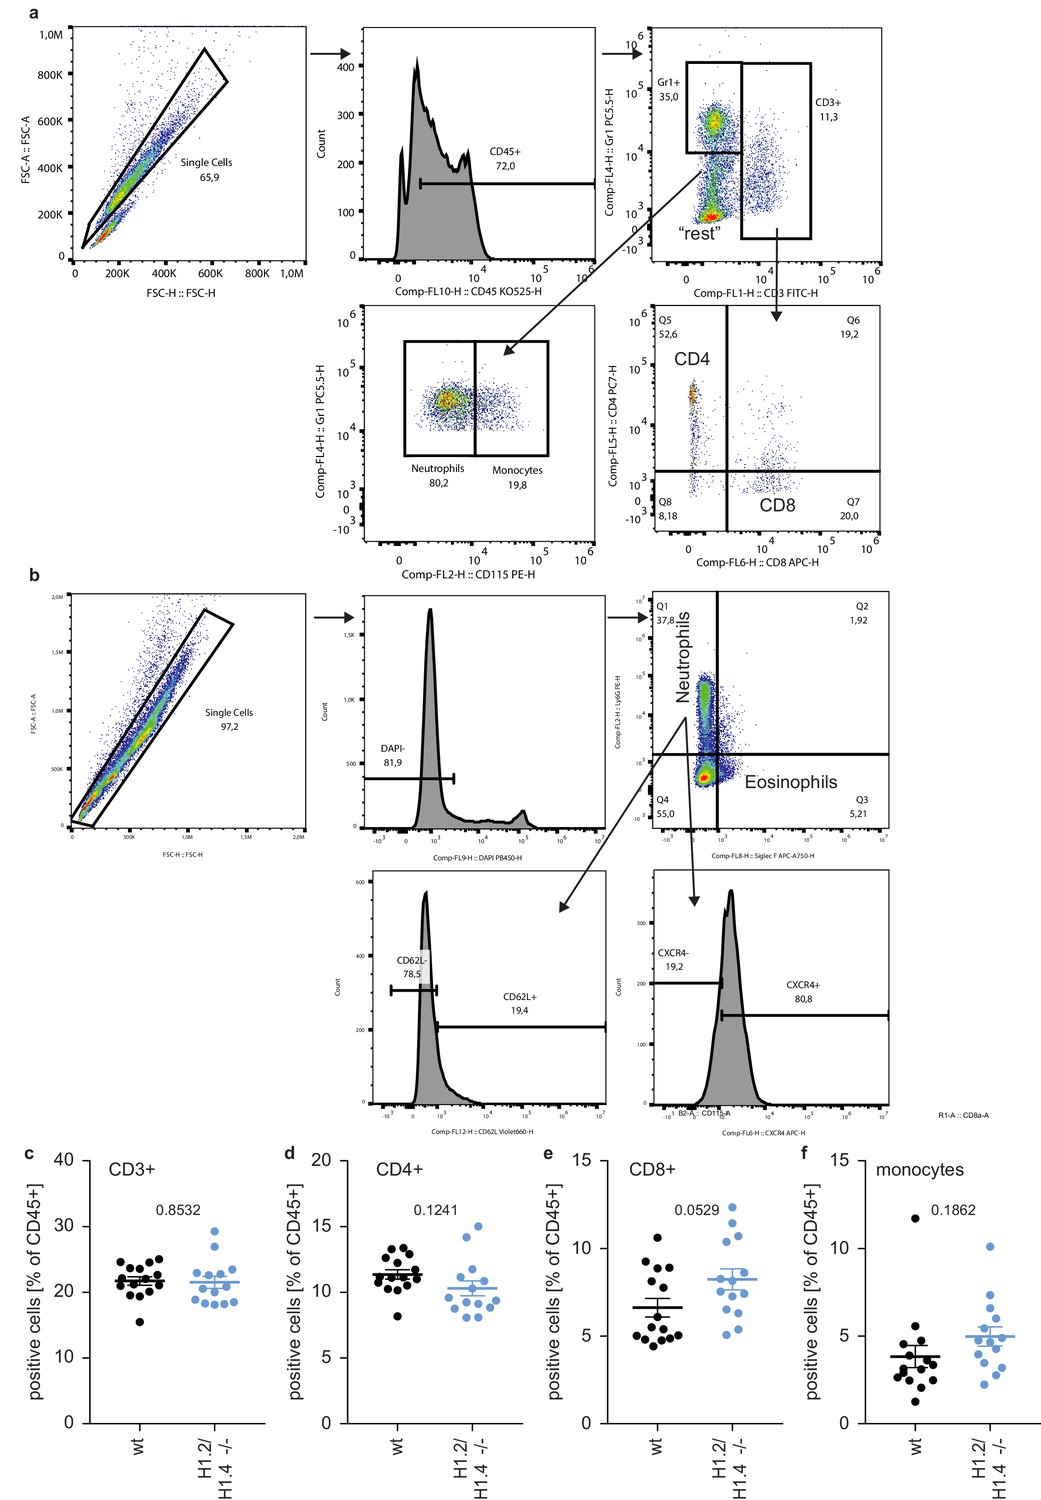
Gating strategies and circulating leukocytes.
(a, b) Gating strategy for different subsets of immune cells in whole blood and bone marrow. (a) Single cells are gated for expression of CD45, then for CD3. CD3 positive cells are divided into CD4 and CD8 positive T cells, CD3 negative fractions are divided into neutrophils (GR1 positive, CD115 negative), monocytes (GR1 positive CD115 positive) and ‘rest’ (B cells, NK cells and others). (b) Gating strategy for neutrophils, eosinophils and ageing markers of neutrophils. Single cells are gated for viable (DAPI negative) cells and subsequently into neutrophils (Ly-6G positive) and eosinophils (SiglecF positive). Neutrophils are divided into young and aged populations by expression of surface markers CD62L and CXCR4.(c–f) Abundance of the indicated leukocytes in whole blood of wild type (wt, n = 15) and H1.2/H1.4 double-deficient (H1.2/H1.4 -/-, n = 14) animals, each dot represents a mouse, error bars are mean -/+ SEM. p values are indicated and derived from an unpaired two-tailed t test. The profile of circulating immune cells in H1.2/H1.4 - / - animals looks normal.
Figure 5—figure supplement 2
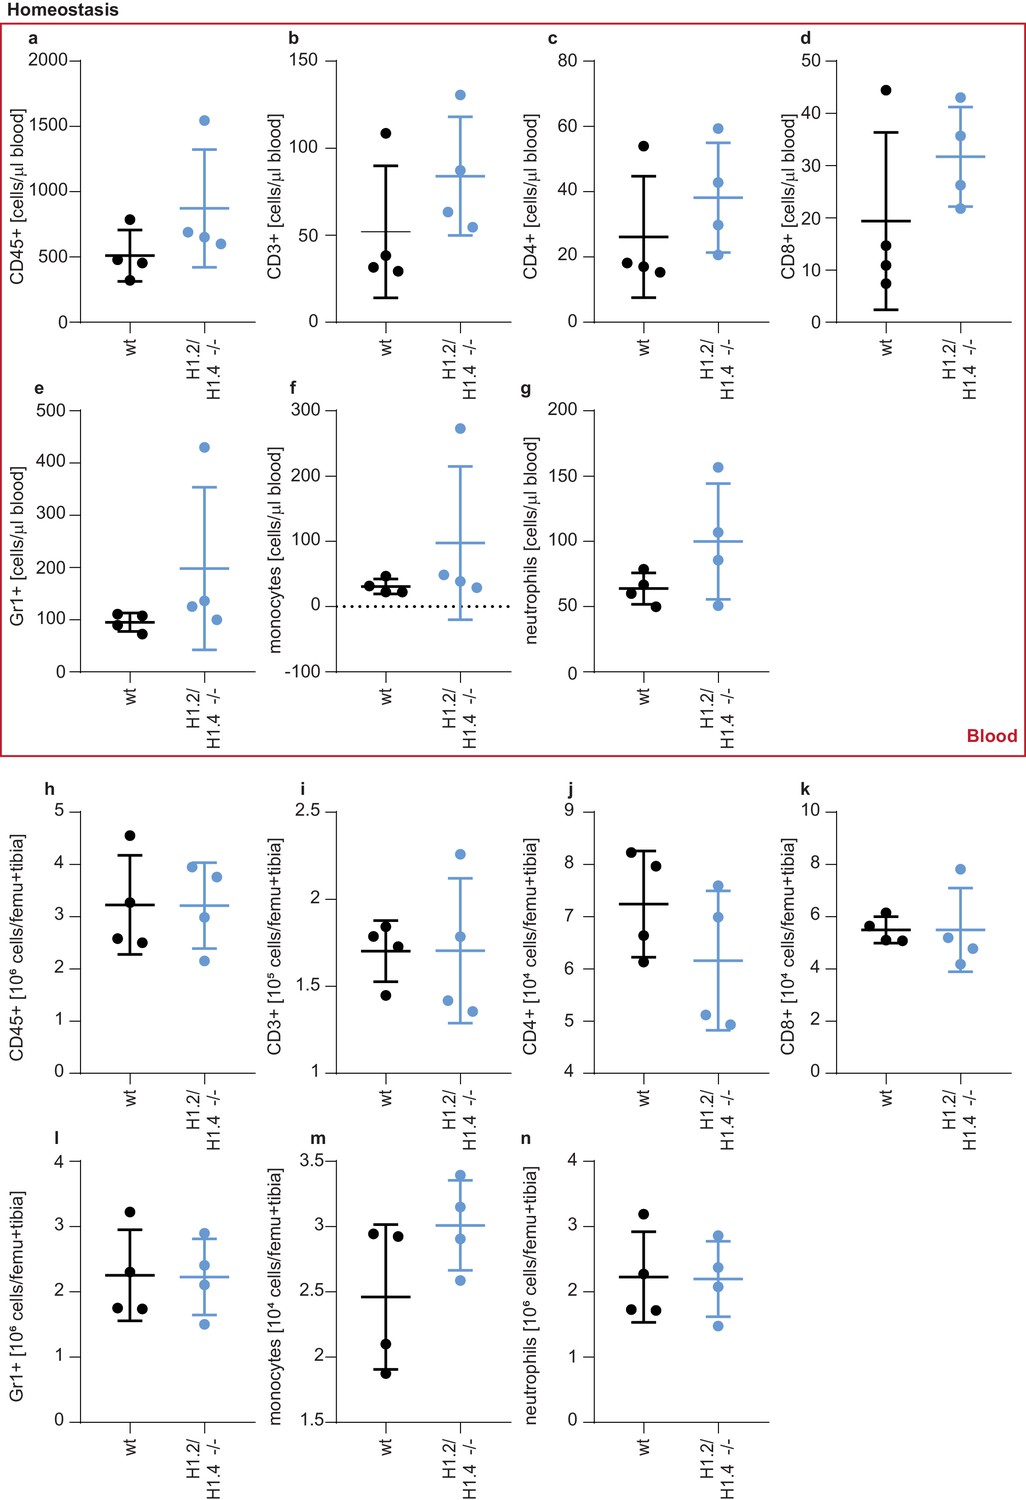
Leukocytes in circulation and bone marrow in homeostasis.
(a–n) Analysis of leukocytes in blood (a–g) and bone marrow (h–n) of wild type and H1.2/H1.4-deficient female mice (n = 4). Animals were sacrificed, bone marrow and blood was isolated and directly stained with the indicated surface markers (for gating strategies see Figure 5—figure supplement 1a). Each dot represents a mouse, values are calculated as cells/μl blood (a–g) or as cells per femur and tibia (h–n). Error bars are mean +/- SD. Note that g) essentially displays the same population of cells also shown in Figure 5a. Figure 5a shows the percentage of neutrophils in blood (with corresponding other leukocyte percentages shown in Figure 5—figure supplement 1c–f), whereas in Figure 5—figure supplement 2 the counts of neutrophils are shown.
Figure 5—figure supplement 3
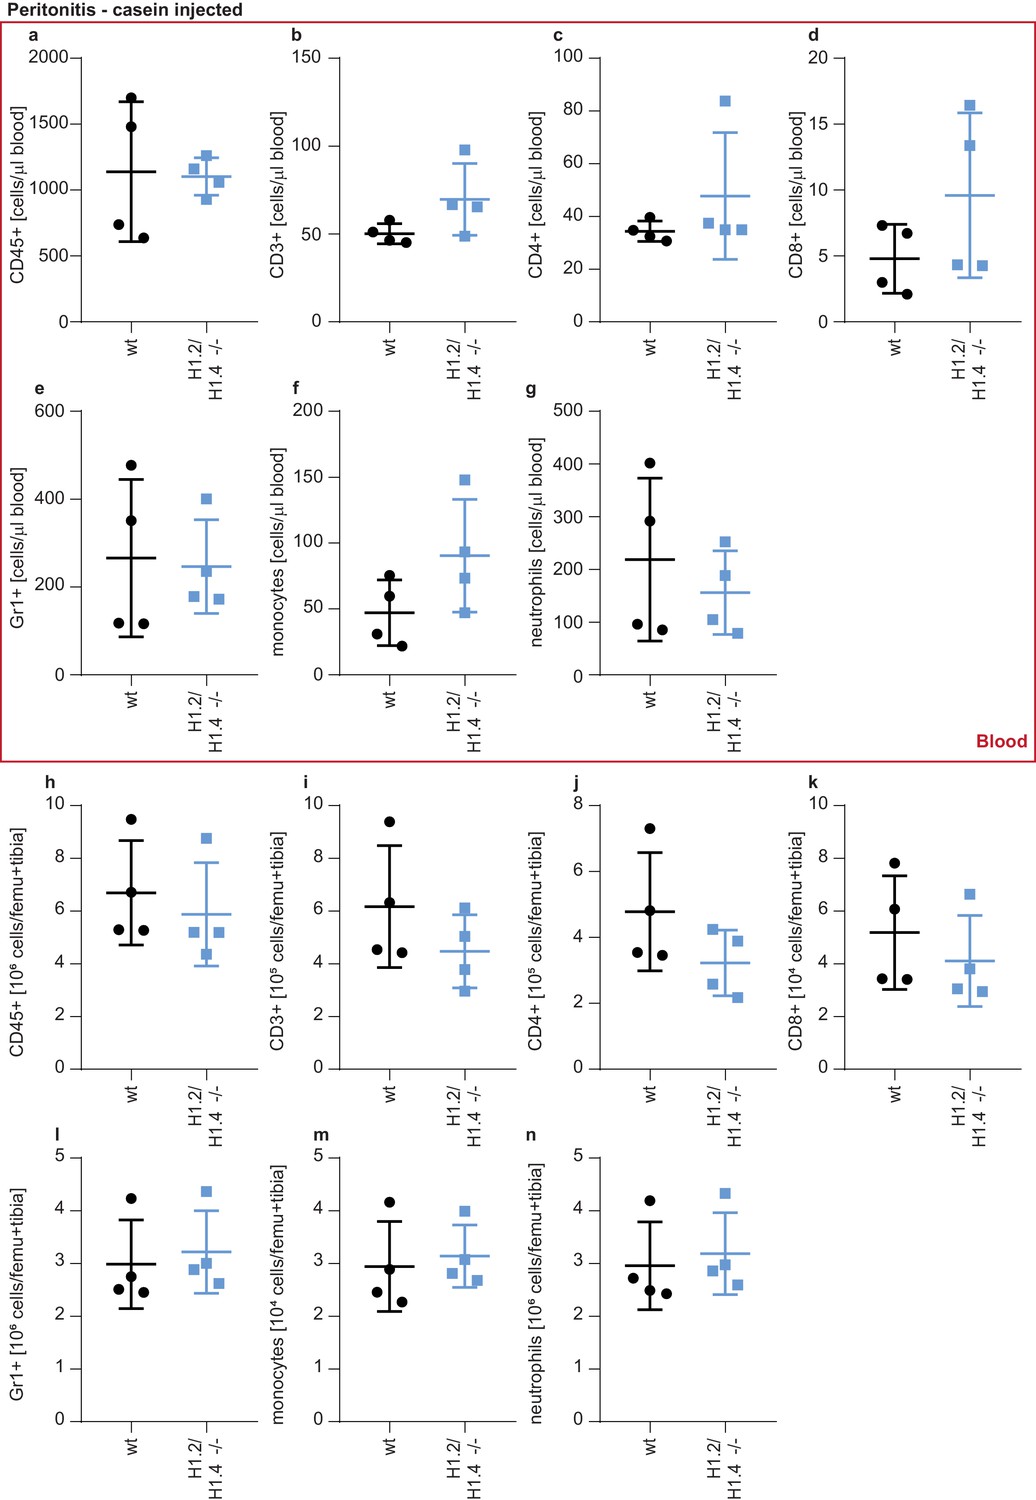
Leukocytes in circulation and bone marrow upon casein injection.
(a–n) Same cell populations and staining procedure as in Figure 5—figure supplement 2, but upon injection of 2 × 1 ml 7% casein into the peritoneal cavity of female mice (n = 4). Animals were sacrificed at 24 hr after the first injection and blood and bone marrow were analyzed for the indicated immune cell populations. Error bars are mean +/- SD.
Figure 5—figure supplement 4
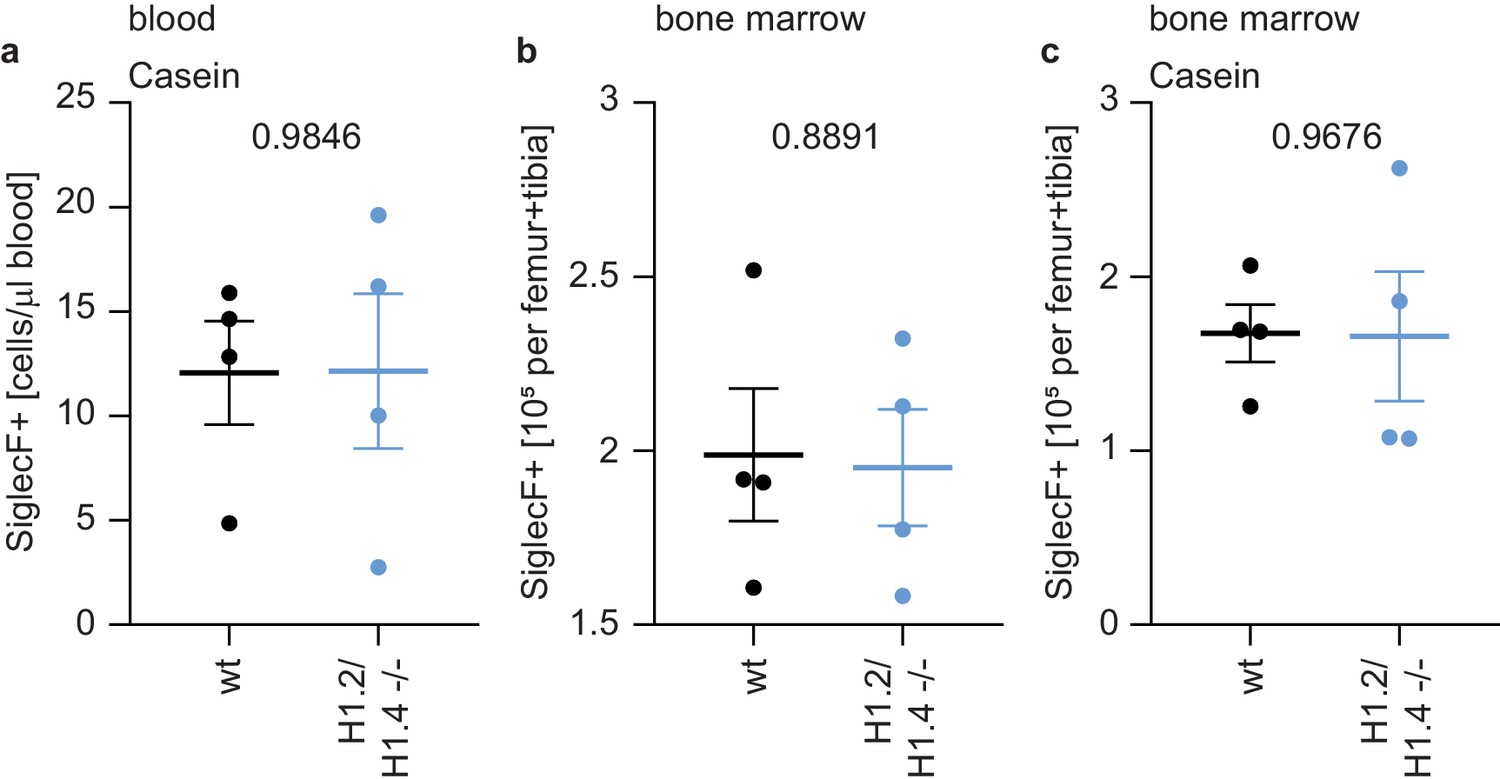
Eosinophil counts in bone marrow upon casein injection and in circulation.
(a) Counts of eosinophils in the blood of casein-injected animals, showing that the enhanced number of eosinophils seen in homeostatic H1.2/H1.4-deficient mice is not seen in inflammatory conditions. (b, c) Counts of eosinophils in the bone marrow of wild type and H1.2/H1.4-deficient mice during homeostasis (b) and upon casein injection (c), the numbers of eosinophils do not differ between genotypes. Depicted are mean +/- SEM, each data point represents one mouse. p values are indicated and derived from an unpaired, two-tailed t test.
Figure 5—figure supplement 5
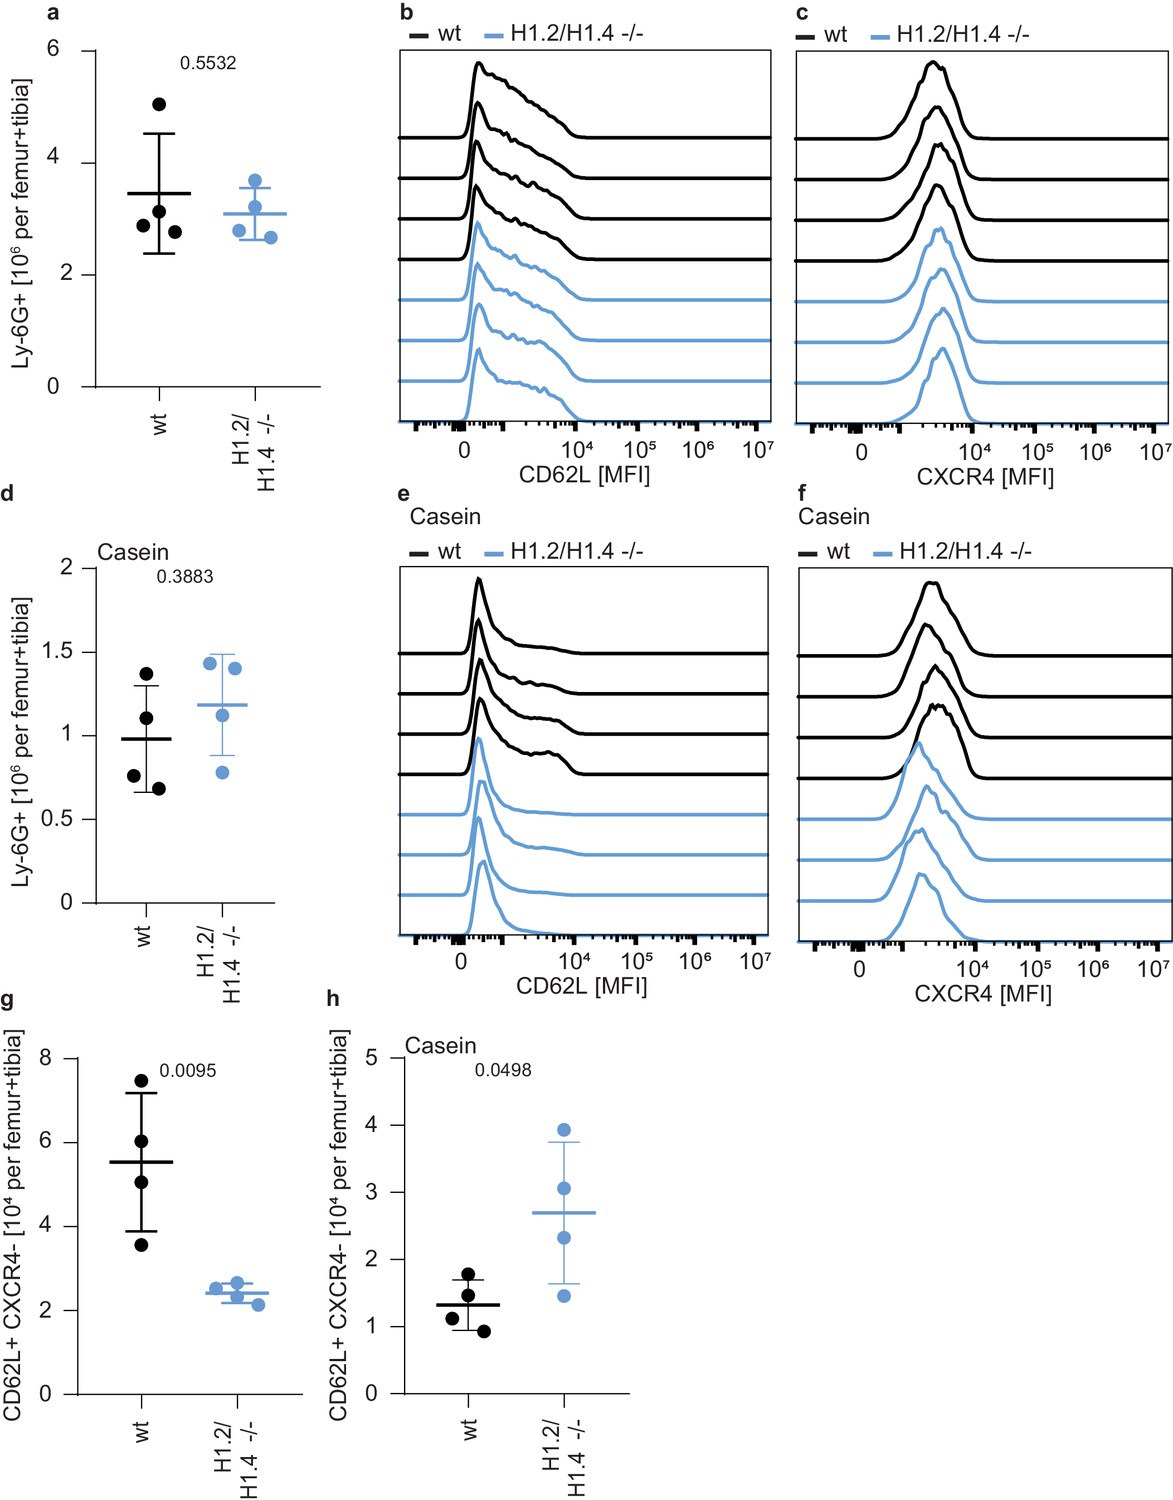
Differentially regulated ageing markers in H1.2/H1.4-deficient mice.
a Counts of neutrophils in the bone marrow of wild type and H1.2/H1.4-deficient animals, showing similar numbers of neutrophils in both genotypes. (b) Mean fluorescence intensity (MFI) of CD62L surface expression in bone marrow neutrophils of the indicated genotype. (c) MFI of CXCR4 surface expression in bone marrow neutrophils of the indicated genotype. d-f Same analysis as in a–c), but in casein-injected animals. There is a difference in CD62L (e) and CXCR4 (f) expression in H1.2/H1.4-deficient animals. (g, h) Percentage of CD62L+ CXCR4- (young) neutrophils in the bone marrow of homeostatic (g) and casein-injected (h) animals of the indicated genotype. a,d,g,h Each data point represents one mouse. p values are indicated and derived from an unpaired, two-tailed t test. b,c,e,f each histogram represents one mouse.
Figure 5—figure supplement 6
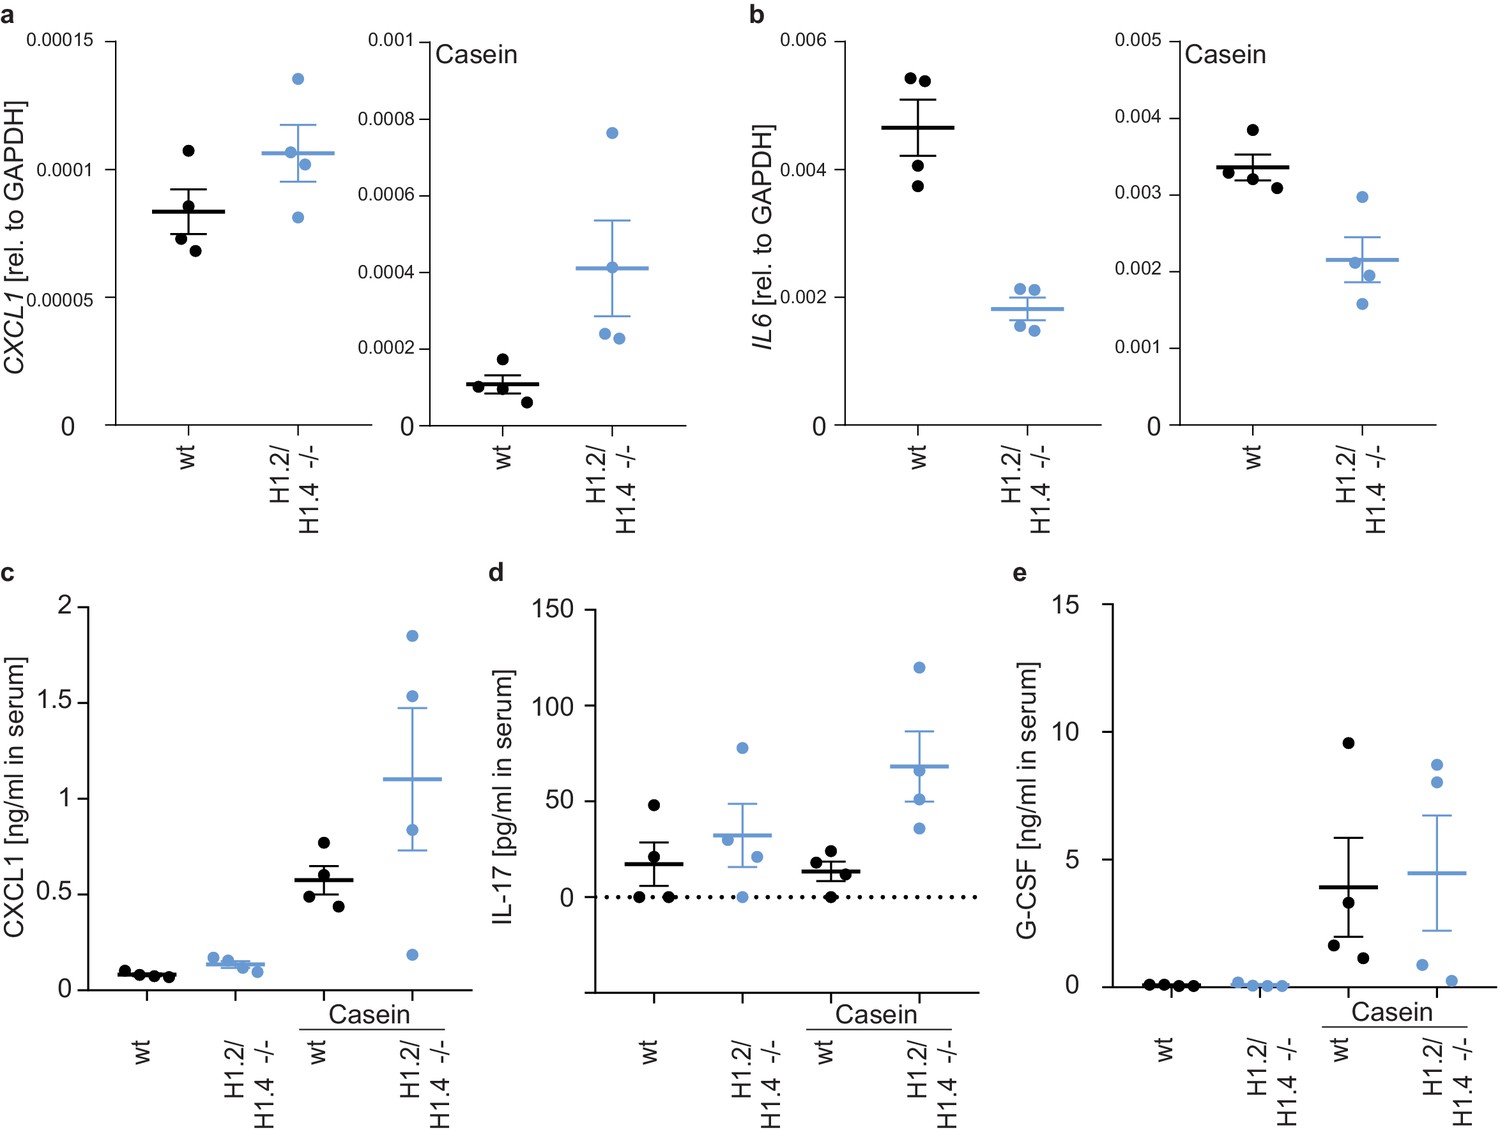
Differentially regulated cytokines in H1.2/H1.4-deficient mice.
a, b mRNA expression of the chemokine CXCL1 (a) and the inflammatory cytokine IL6 (b) in homeostatic (left panel) and casein-injected (right panel) animals. H1.2/H1.4-deficient bone marrow cells transcribe more CXCL1 and less IL6. (c–e) protein levels of the indicated cytokines and chemokines in the serum of homeostatic and casein-injected mice. The enhanced expression of CXCL1 is also seen in serum (c). Casein injection leads to an upregulation of IL-17 (d) and G-CSF (e) and the upregulation of IL-17 is stronger in H1.2/H1.4-deficient animals. Depicted is the mean -/+ SD, each data point represents one mouse. p values are indicated and derived from an unpaired, two-tailed t test.
Figure 5—figure supplement 7
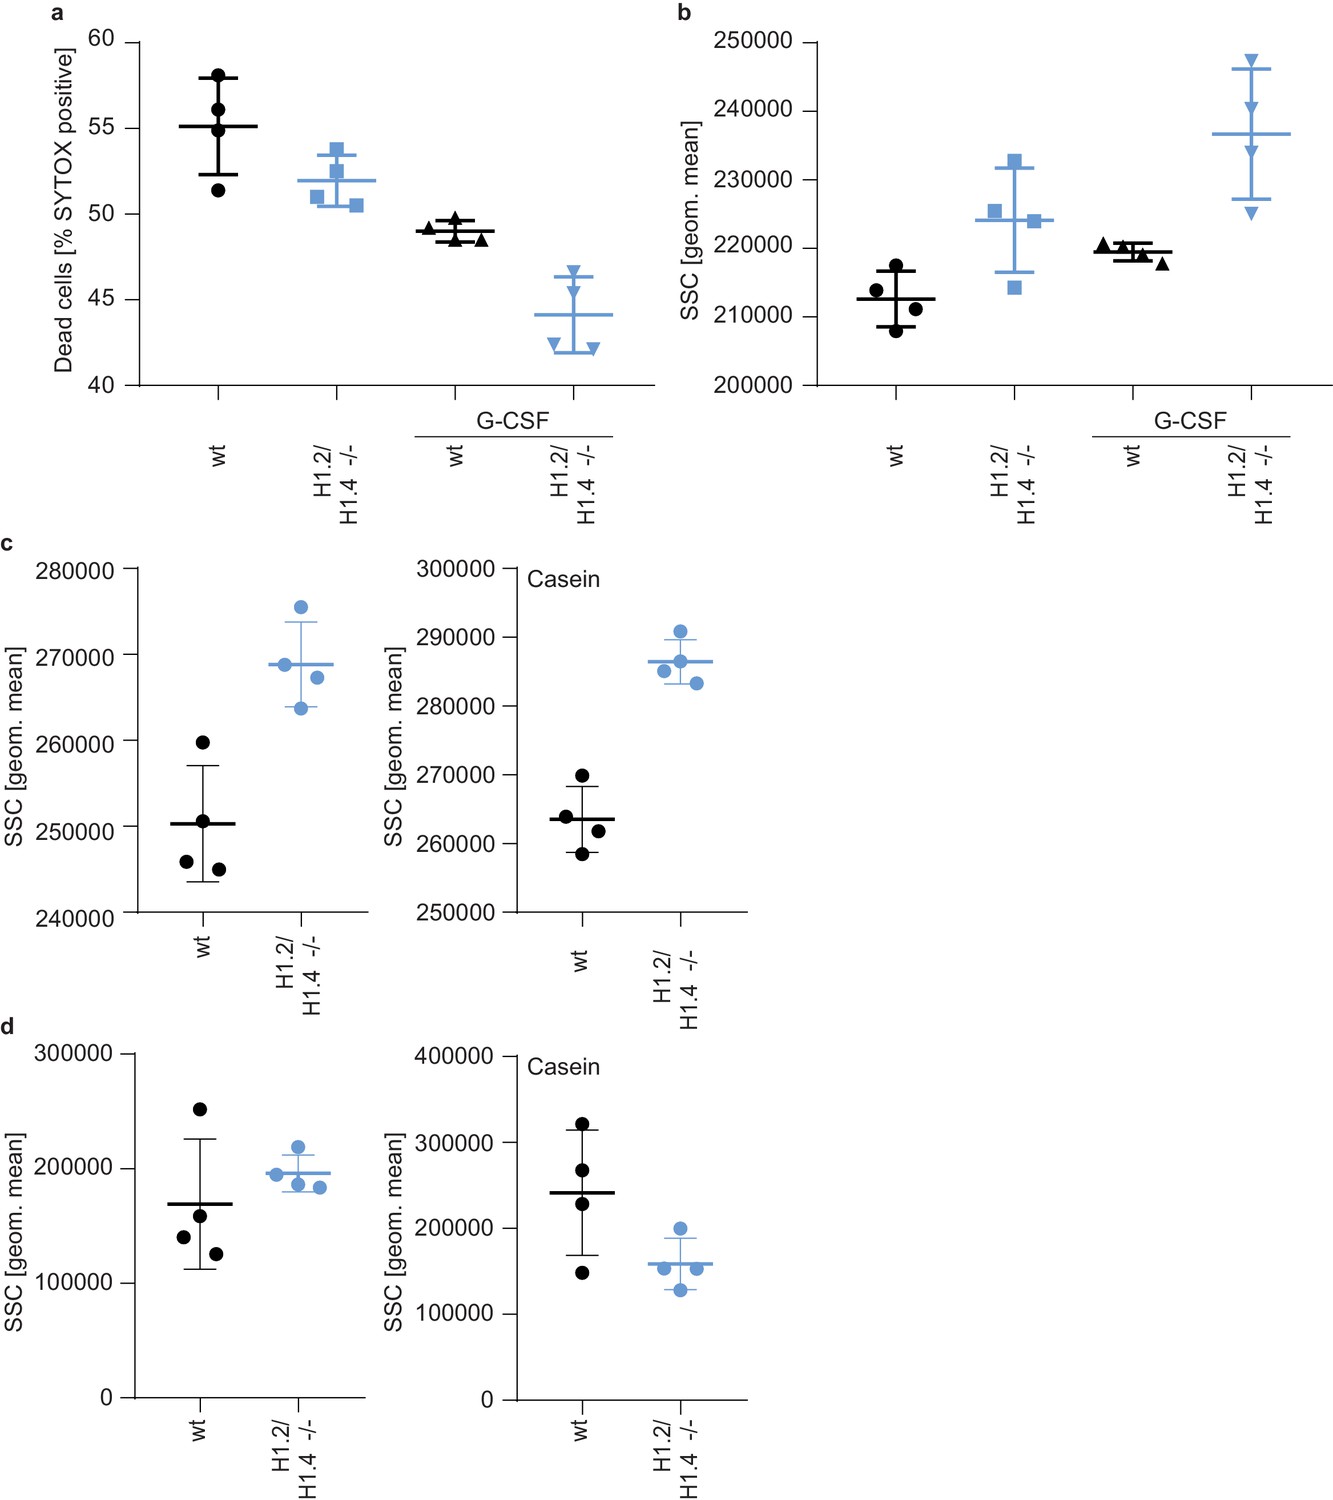
Enhanced survival and granularity of H1.2/H1.4-deficient bone marrow cells and neutrophils.
(a) Bone marrow of casein-injected wild type and H1.2/H1.4-deficient mice was incubated overnight in the presence or absence of G-CSF (100 ng/ml). G-CSF enhanced the survival of cells, measured by adding SYTOX Green and analyzing SYTOX Green positive cells by flow cytometry. The effect of G-CSF on cell survival was stronger on H1.2/H1.4-deficient cells. (b) Granularity of bone marrow cells after overnight incubation as depicted by side scatter (SSC) in flow cytometry. H1.2/H1.4-deficient cells show enhanced granularity. (c, d) Flow cytometry analysis of granularity of neutrophils (Ly-6G+ cells) in the bone marrow (c) and blood (d) of wild type and H1.2/H1.4-deficient mice during homeostasis (left panel) or upon casein injection (right panel). Bone marrow neutrophils of H1.2/H1.4-deficient mice are more granular than wild type cells. (a–d) Each data point represents a mouse, error bars are mean +/- SD.
Figure 6 with 2 supplements
Deficiency of H1.2 or H1.4 is rescued by inhibition of GATA-2.
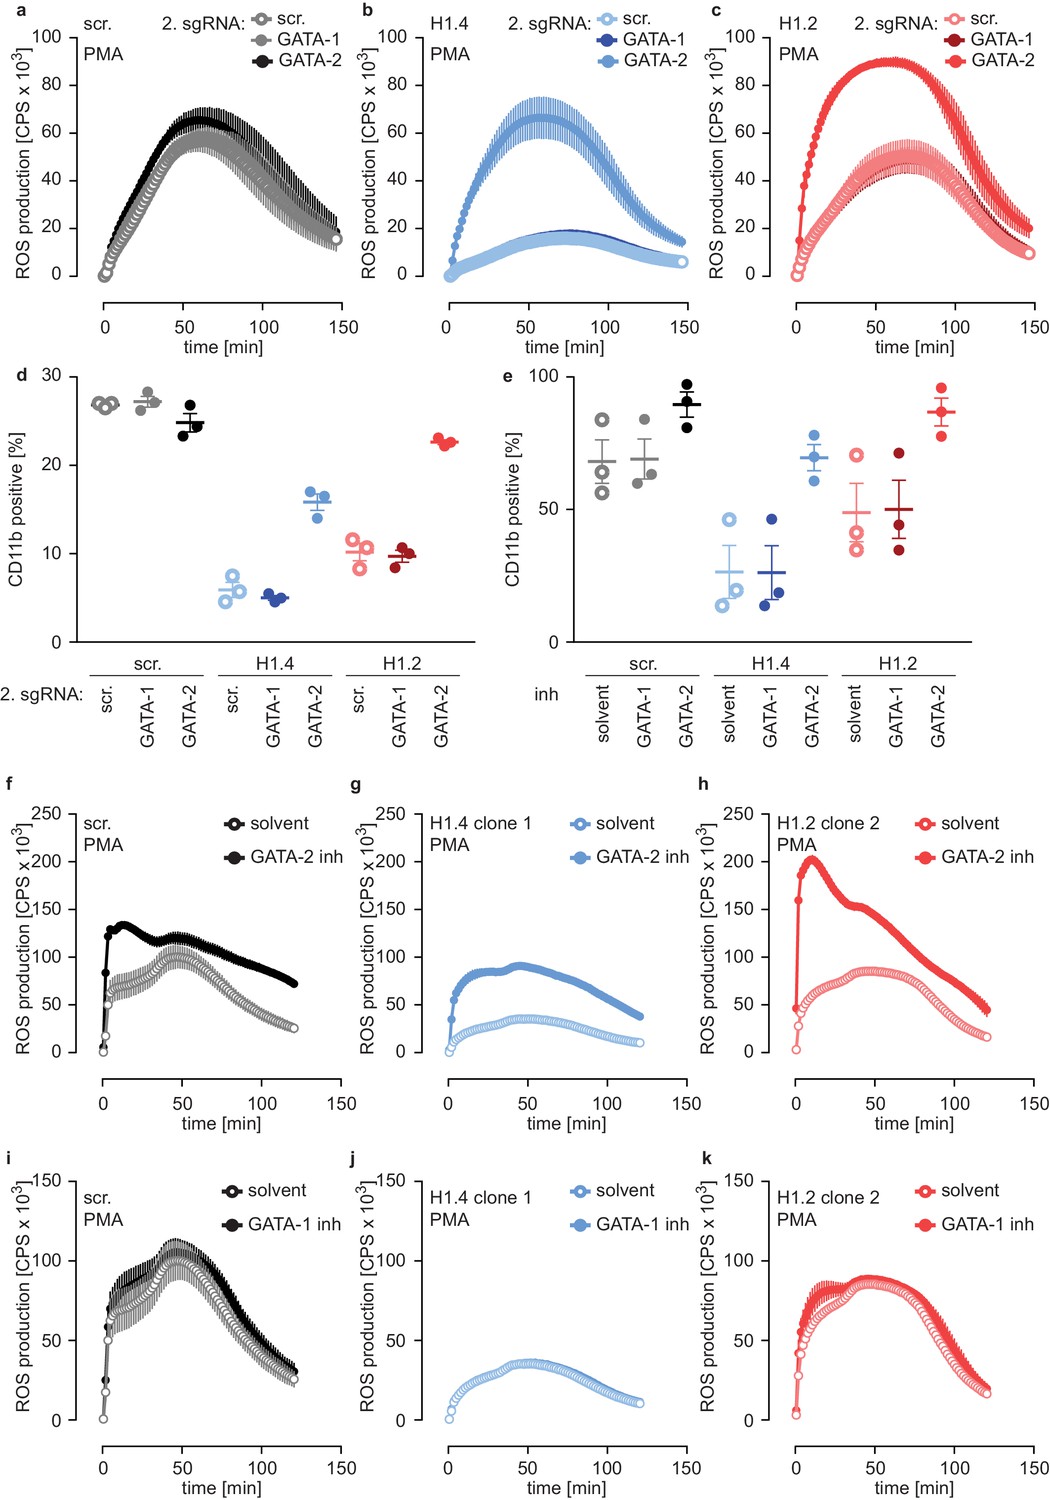
(a–c) Deficiency in GATA-2 but not GATA-1 rescues H1.2 and H1.4 deficiency. Populations are batches of PLB-985. scr. (a), H1.4 (b) and H1.2 (c) knockout lines were transduced with an sgRNA against GATA1 or GATA2 or with a scr. sgRNA as control and analyzed for ROS production in response to PMA at d4 of differentiation. (d) Deficiency in GATA-2 rescues CD11b expression of H1.2 and H1.4-deficient PLB-985. CD11b expression of the indicated genotypes was measured at d4 of differentiation. (e) Treatment of PLB-985 with GATA-2 but not GATA-1 inhibitor rescues expression of CD11b, especially in lines deficient in H1.2 and H1.4. (f–k) ROS production of PLB-985 in response to PMA is affected upon GATA-2, but not GATA-1 inhibition during differentiation. (f–k) PLB-985 ROS production was measured at d7 of differentiation, indicated genotypes were treated with indicated inhibitors or solvent before the onset of differentiation and at d4. (a–k) Shown is the mean -/+ SEM of 3 independent experiments.
Figure 6—figure supplement 1
Expression of GATA-1, GATA-2 and C/EBP transcription factors in PLB-985 and murine bone marrow.
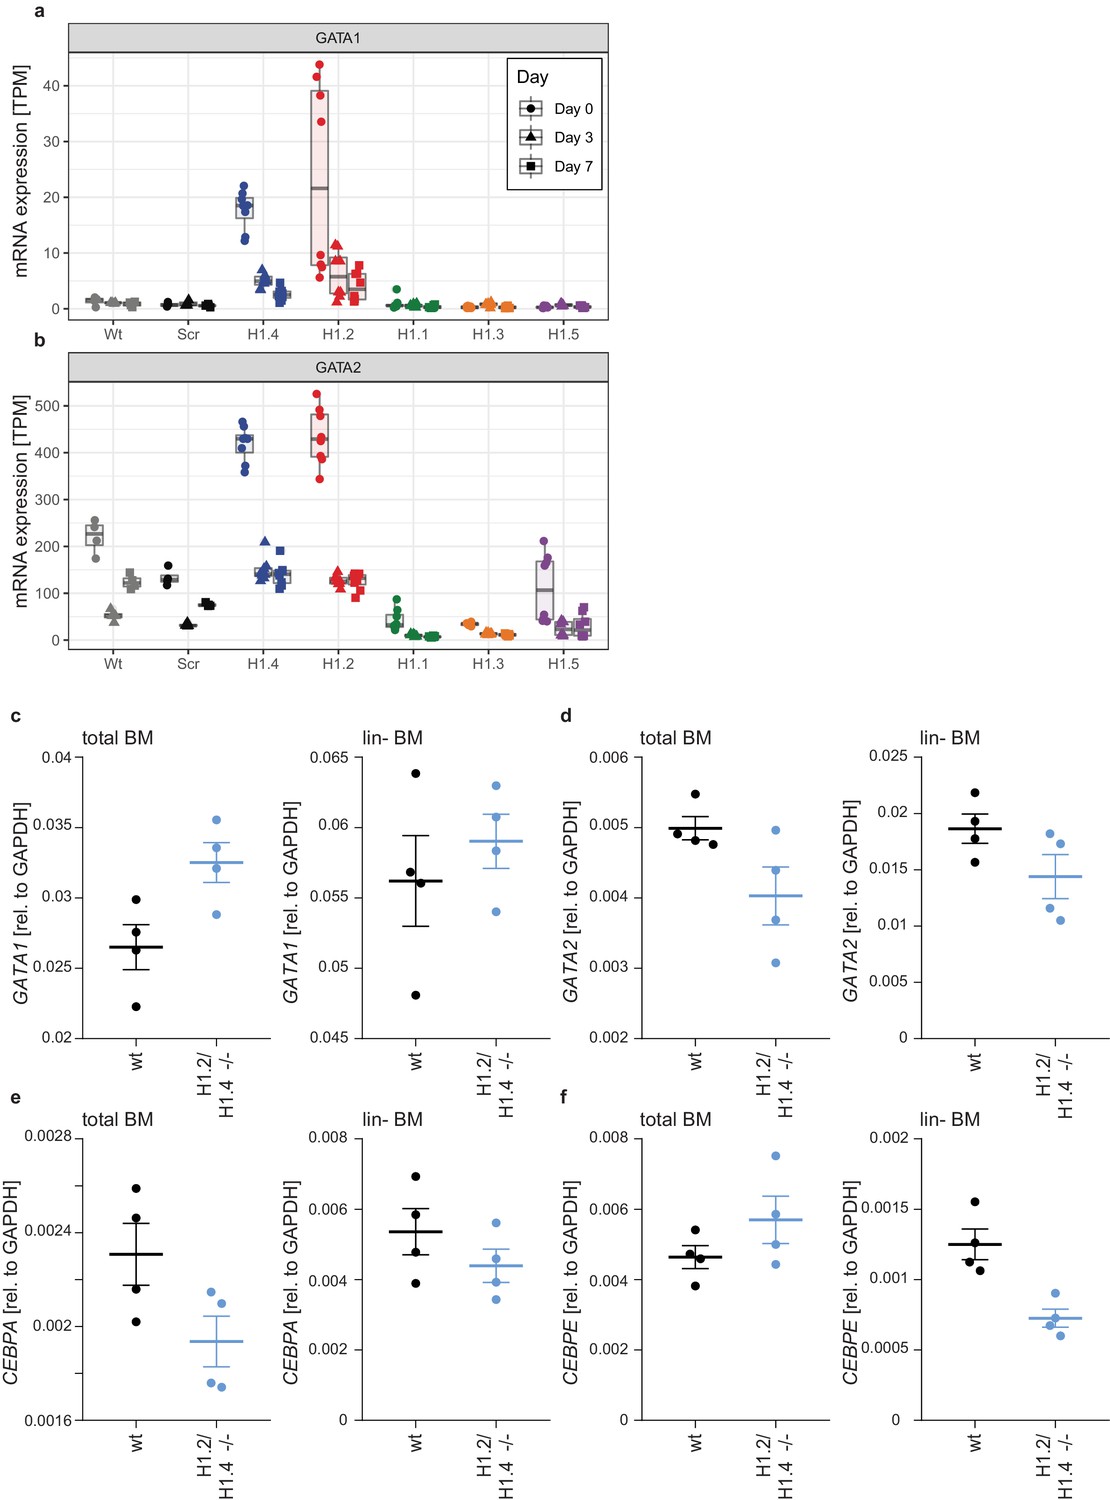
(a, b) Transcripts per million (TPM) were calculated from PLB-985 RNA-seq data for GATA1 (a) and GATA2 (b) for the indicated genotypes at all time points of differentiation. GATA1 expression is enhanced in H1.2 and H1.4 knockout lines at the onset of differentiation. GATA2 expression is generally higher than GATA1 and further elevated in knockout lines for H1.2 and H1.4. (c–f) Expression of the indicated transcription factors was analyzed by qRT-PCR in murine bone marrow (left panel) or lineage negative stem cells isolated from bone marrow (right panel). H1.2./H1.4 deficiency leads to an enhanced expression of GATA1 in total bone marrow (c), confirming results obtained in PLB-985. GATA2 expression was unchanged (d). Expression of CEBPA was reduced in total bone marrow of H1.2/H1.4-deficient animals, as also seen in PLB-985 (e), whereas expression of CEBPE remained unchanged.
Figure 6—figure supplement 2
H1.2 or H1.4 deficiency can be reverted by inhibition of GATA-2.
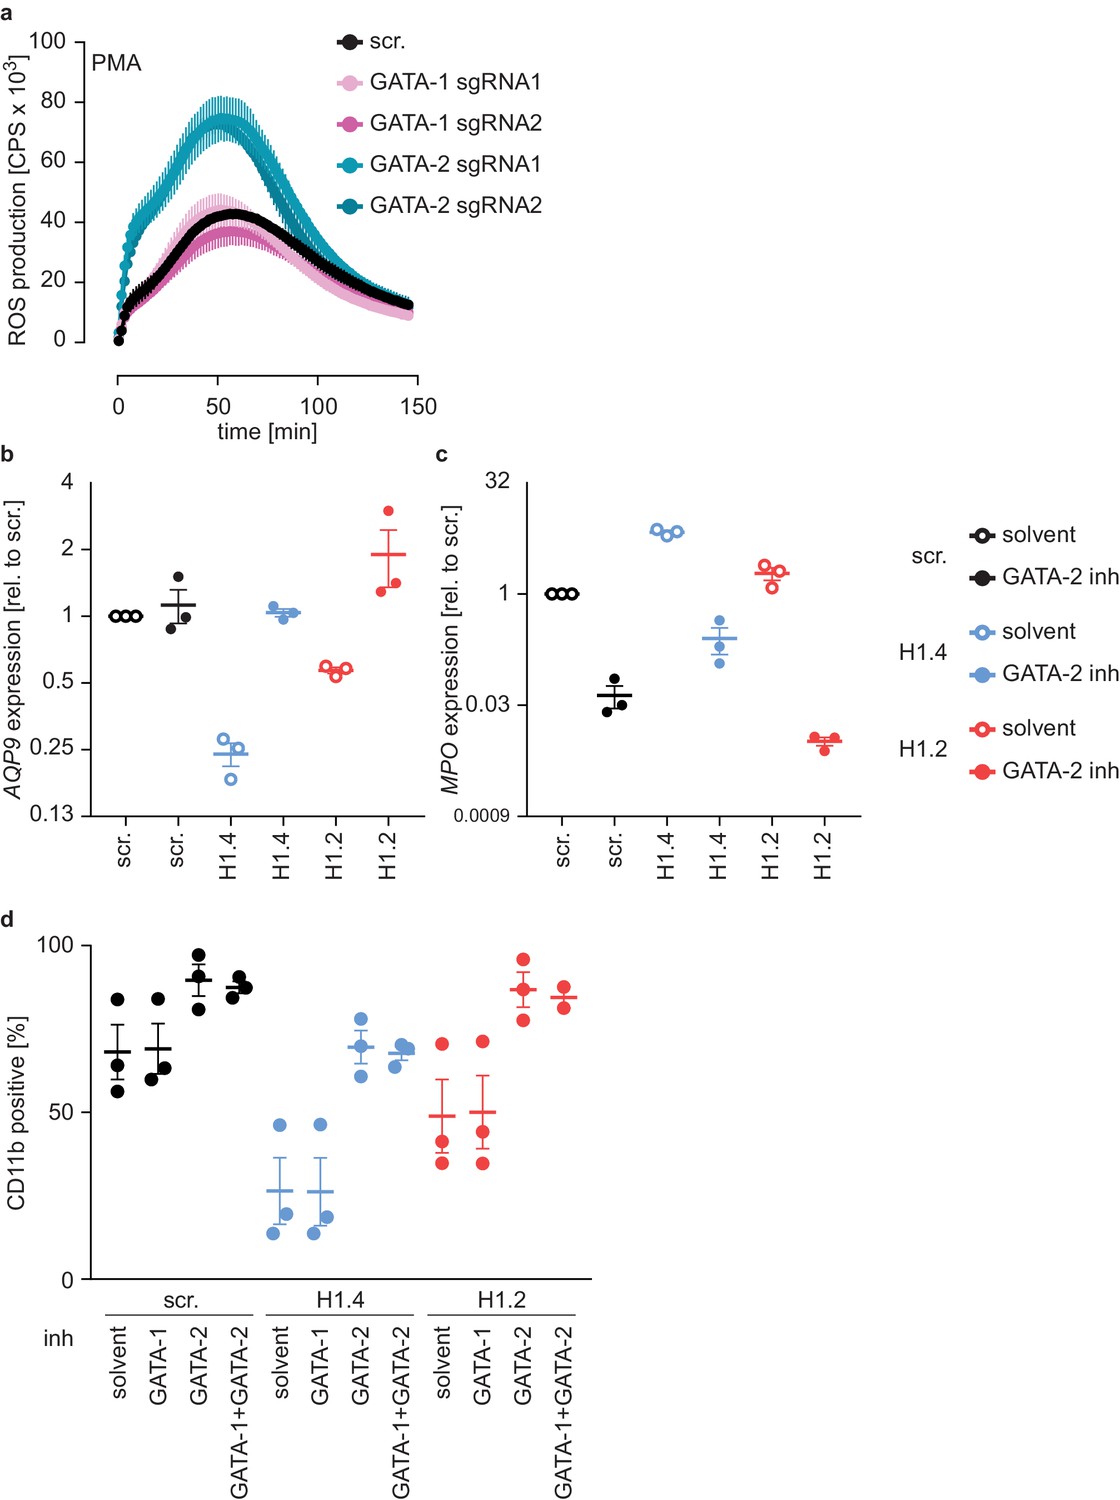
(a) PLB-985 were transduced with two sgRNAs against GATA1 and 2 sgRNAs against GATA2. Cells were differentiated in batches and ROS production in response to PMA was measured at d4 of differentiation. Shown is the mean -/+ SEM of 3 independent experiments. (b, c) Treatment of PLB-985 cells with GATA-2 inhibitor during differentiation improves maturation of cells as shown by increased mRNA levels of AQP9 (b) and decreased mRNA levels of MPO (c). The effect was particularly strong in knockout lines for H1.2 and H1.4. Shown is the mean -/+ SEM of 3 independent experiments. (d) CD11b expression of PLB-985 of the indicated genotypes at d7 of differentiation. Cells were treated with solvent or the indicated inhibitors before differentiation and at d4. Same experiments as in Figure 6e, including treatment with a combination of inhibitors. Shown is mean -/+ SEM of 3 independent experiments. Source Data and supplementary material.
Additional files
-
Supplementary file 1
List of sgRNA sequences, primer sequences and antibodies.
Individual sheets contain sequences of sgRNAs, sequencing primers, qRT-PCR primers and antibody catalog and lot numbers.
- https://cdn.elifesciences.org/articles/52563/elife-52563-supp1-v3.xlsx
-
Supplementary file 2
Key Resources table.
Table of reagents, cell lines, genetically modified organisms, others.
- https://cdn.elifesciences.org/articles/52563/elife-52563-supp2-v3.docx
-
Transparent reporting form
- https://cdn.elifesciences.org/articles/52563/elife-52563-transrepform-v3.docx
Download links
A two-part list of links to download the article, or parts of the article, in various formats.
Downloads (link to download the article as PDF)
Open citations (links to open the citations from this article in various online reference manager services)
Cite this article (links to download the citations from this article in formats compatible with various reference manager tools)
Linker histone H1.2 and H1.4 affect the neutrophil lineage determination
eLife 9:e52563.
https://doi.org/10.7554/eLife.52563


