Application of optogenetic Amyloid-β distinguishes between metabolic and physical damages in neurodegeneration
- Science Division, Yale- NUS College, Singapore
- Institute of Molecular and Cell Biology (IMCB), Singapore
- Department of Physiology, YLL School of Medicine, Singapore
- Department of Biochemistry, National University of Singapore, Singapore
Figures
Figure 1 with 4 supplements
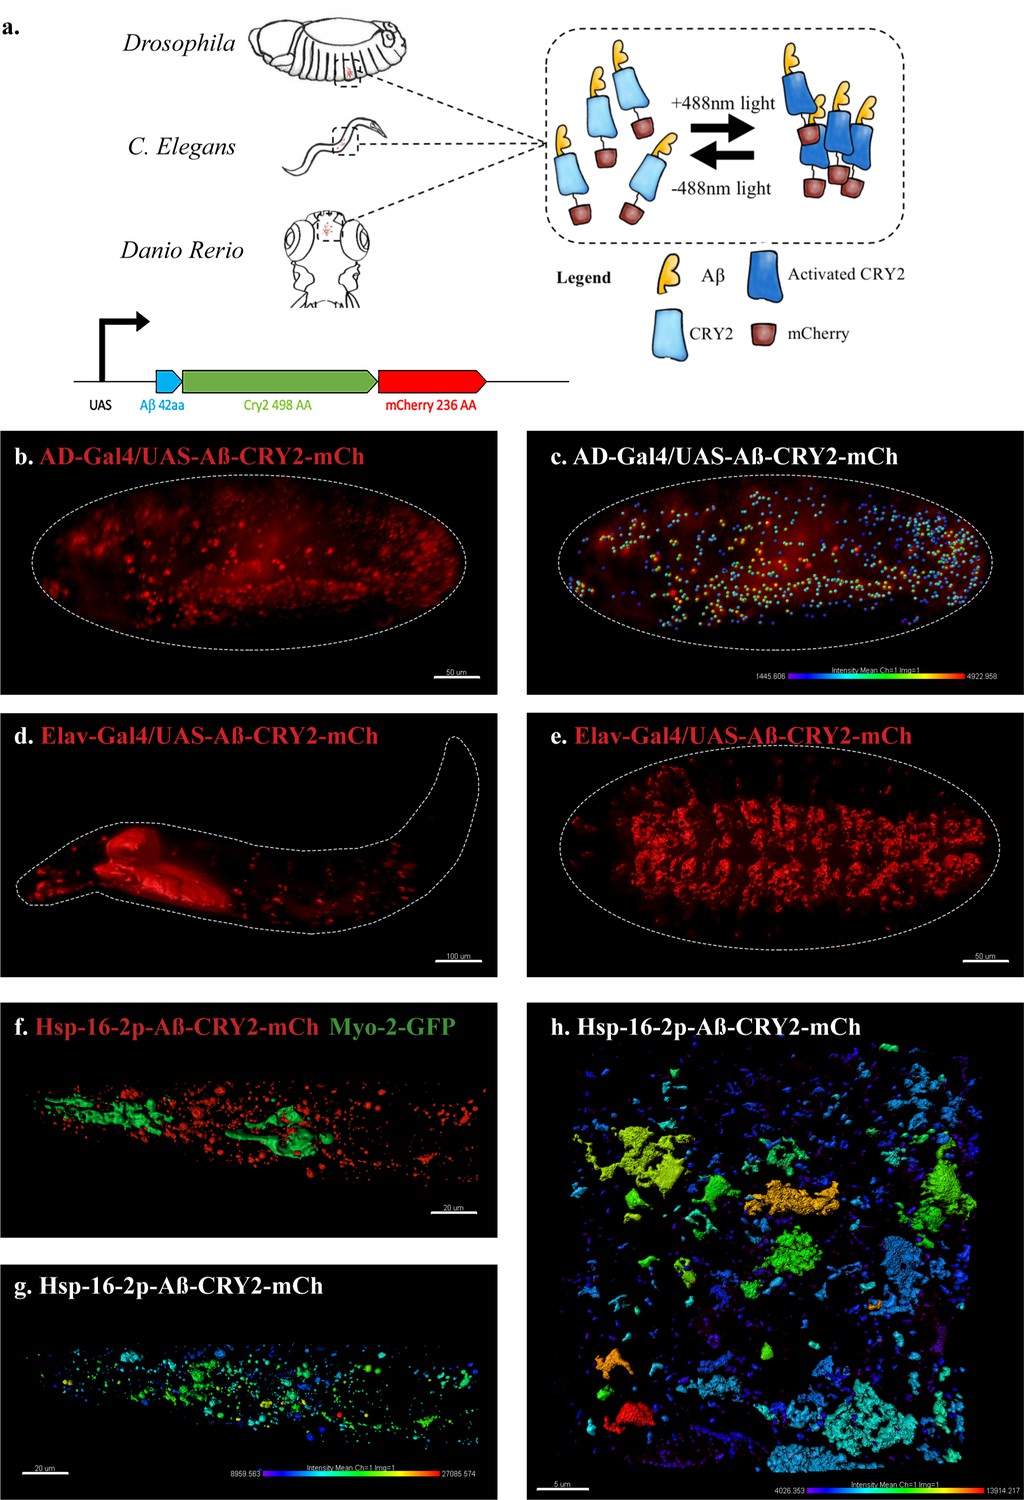
An in vivo, light-dependent, oligomerization switch for the formation or dissolution of Aβ aggregates in the fruit fly and nematode.
(a) A schematic of the strategy and a relative size comparison of the three components of UAS-Aβ-CRY2-mCh. (b) Expression of AD-Gal4/UAS-Aβ-CRY2-mCh in a Drosophila embryo. (c) Mean intensity of aggregates in the same AD-Gal4/UAS-Aβ-CRY2-mChDrosophilaembryo. (d and e) Expression of Elav-Gal4/UAS-Aβ-CRY2-mCh in a Drosophila larva and embryo. (f) Expression of hsp-16–2 p-Aβ-CRY2-mCh in heat-shocked C. elegans with myo-2-gfp marker, that marks its pharyngeal pump and serves as an indicator for positive microinjection. (g and h) Mean intensity of aggregates in the hsp-16–2 p-Aβ-CRY2-mCh in C.elegans under 20x and 63x magnification of the confocal microscope; 63x image was processed using the Zeiss Airyscan.
Figure 1—figure supplement 1
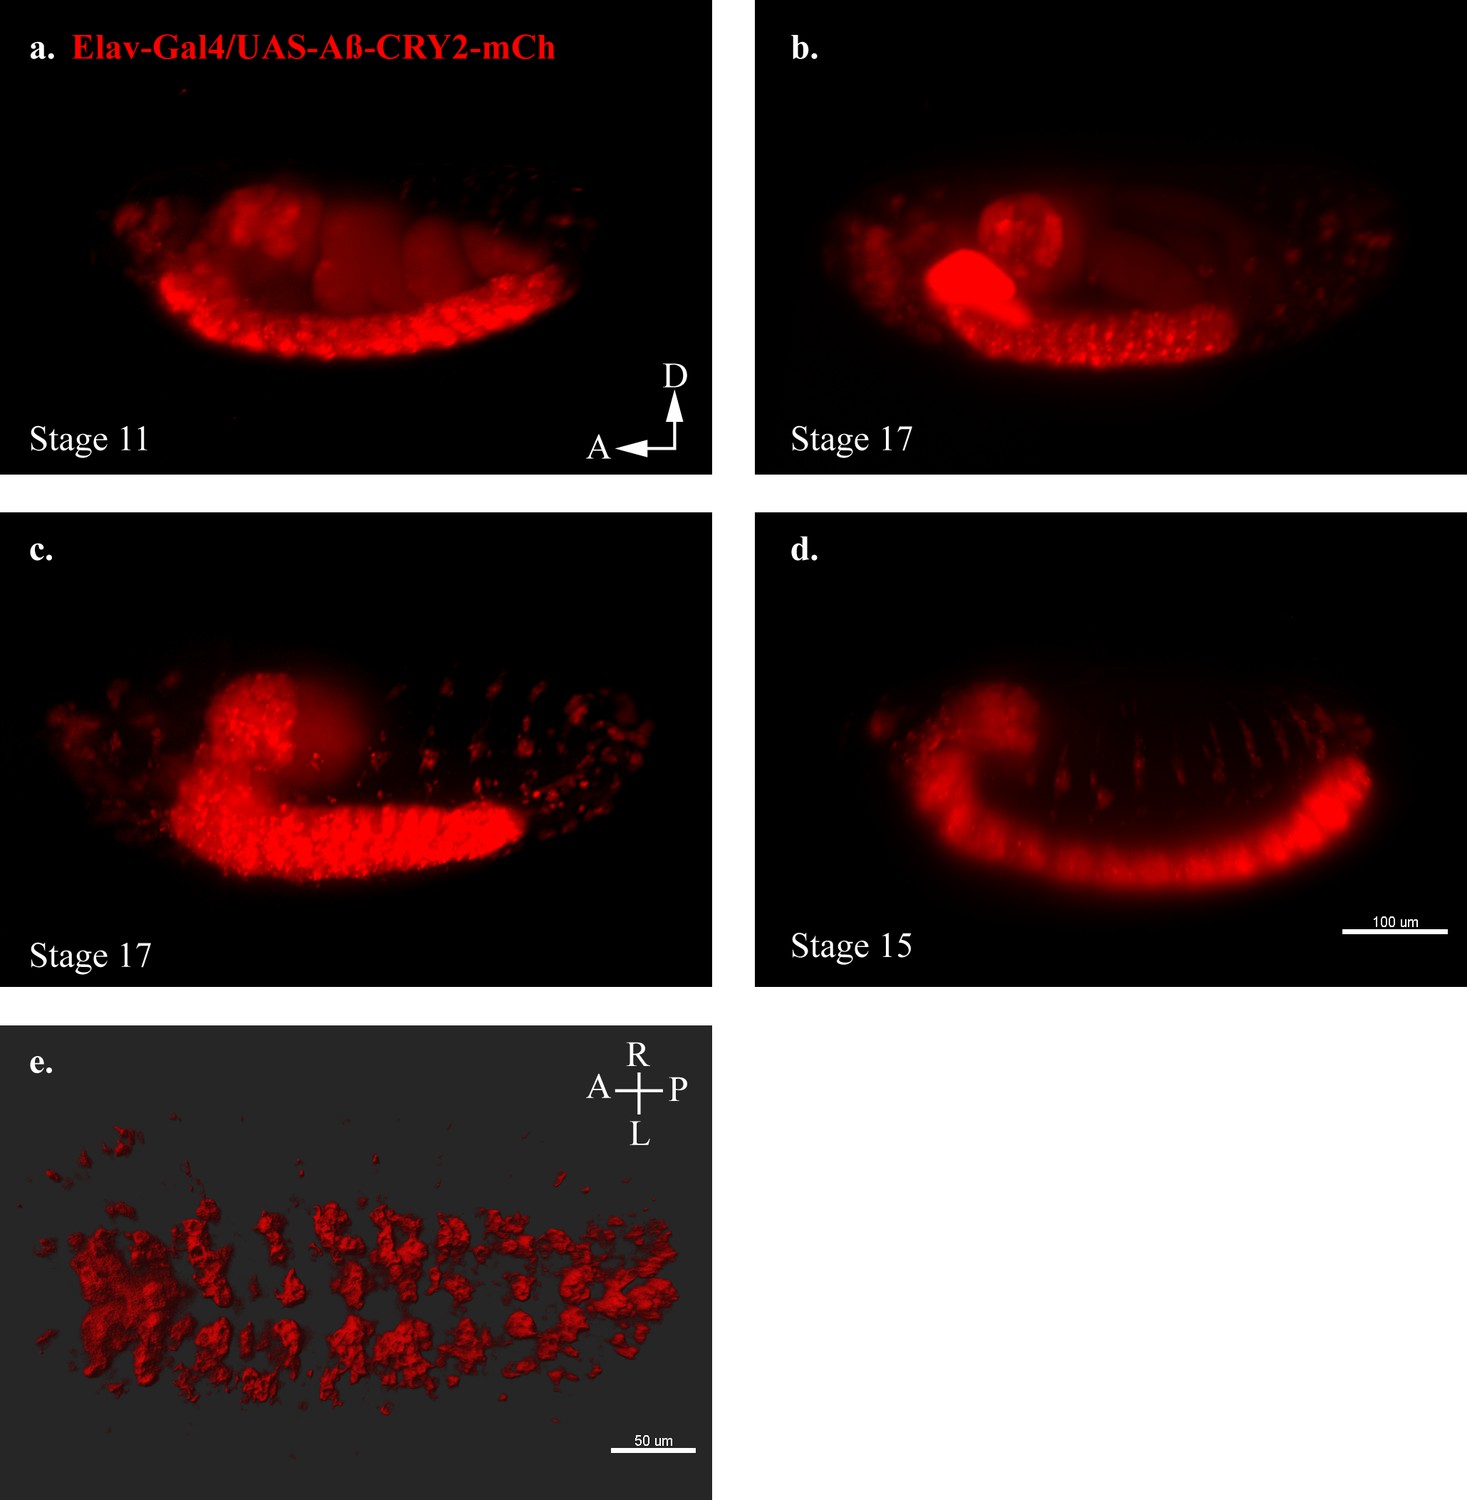
Transgenic Drosophila model expressing Aβ-CRY2-mCh.
(a–d) Still images from lightsheet timelapse microscopy of Elav-Gal4/UAS-Aβ-CRY2-mCh in neurons detected by mCh fluorescence (red) in transgenic Drosophila embryos at different developmental stages. (e) Aβ localization to neuronal cell body volume in a Drosophila embryo expressing the mentioned construct.
Figure 1—figure supplement 2
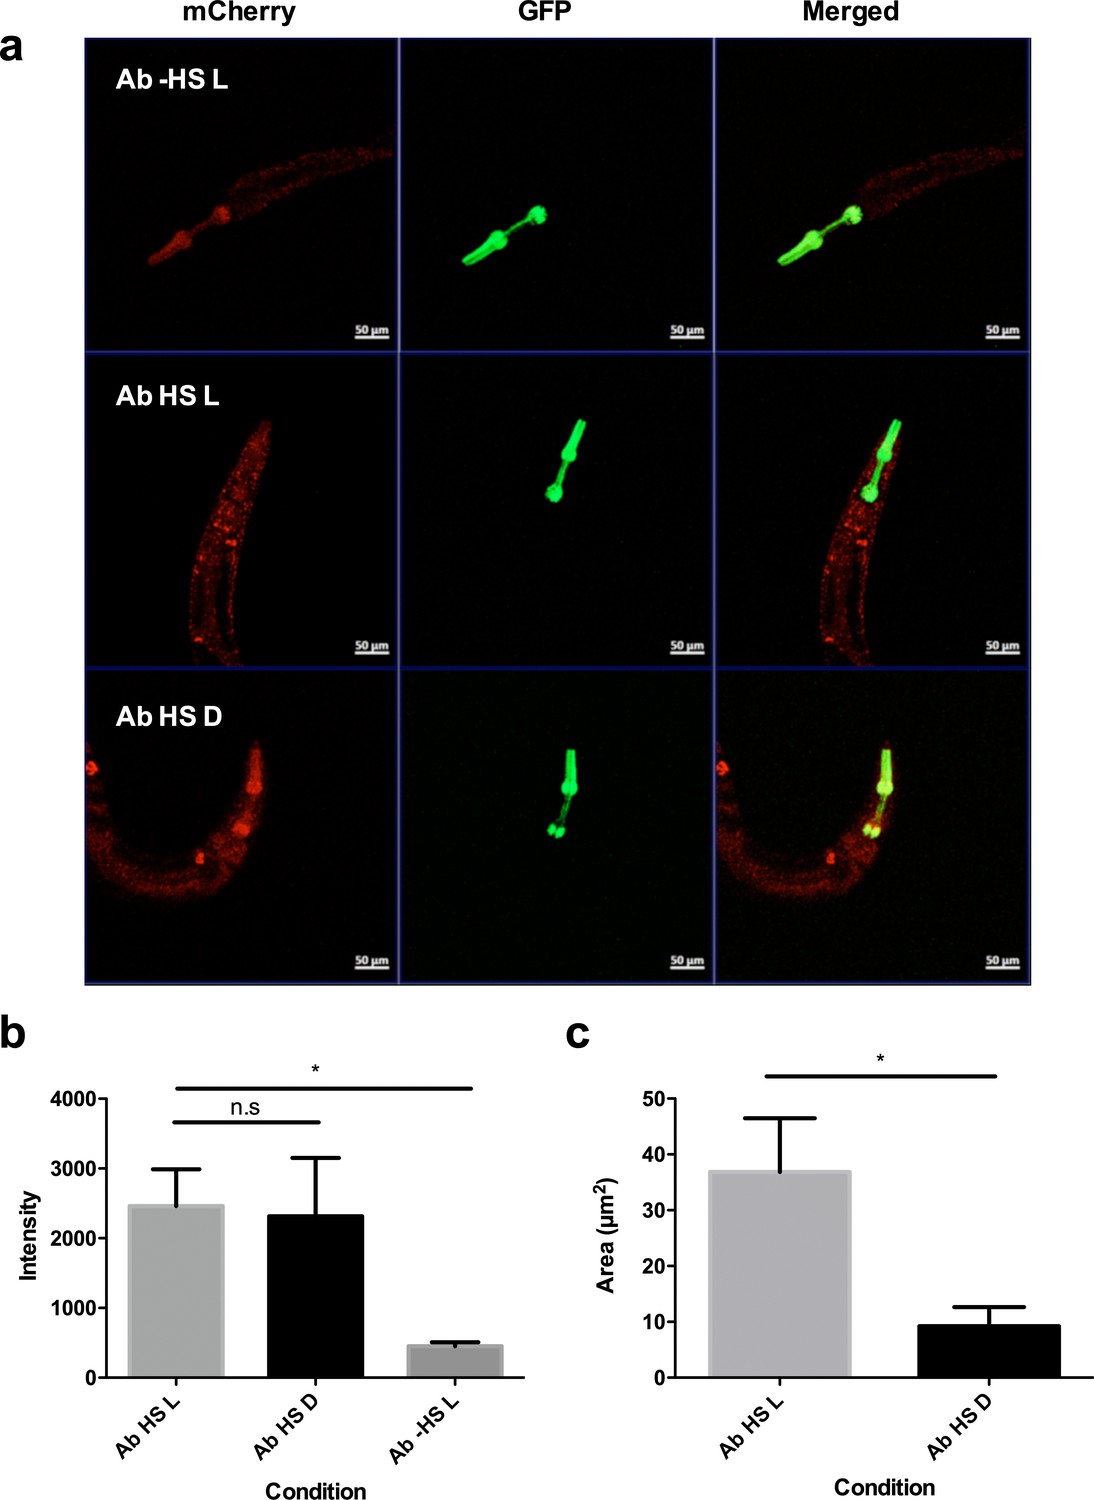
Exposure to light drives Aβ aggregation in C. elegans strains 24 hr post heat- shock.
(a) Confocal microscopy images of mutant C. elegans 24 hr post heat-shock at 20x magnification in Aβ -HS L (no heat shock, exposed to light), Aβ HS L (with heat shock, exposed to light) and Aβ HS D (with heat shock, kept in the dark) conditions. Aβ -HS L worms are used as a control for quantifying baseline Aβ expression. Distinct puncta (yellow) can be seen in animals in Aβ HS L condition. No red fluorescence was observed in control animals without the transgene (not shown). (b) Quantification of intensity of red fluorescence measured in the animals in Aβ HS L (n = 13), Aβ HS D (n = 9) and Aβ -HS L (n = 5) conditions 24 hr post heat-shock. Difference in expression between Aβ HS L conditions and Aβ -HS L is statistically significant (p=0.034). (C) Quantification of total area of bright puncta in the animals in Aβ HS L (n = 13), and Aβ HS D (n = 9) conditions 24 hr post heat-shock. Difference in area of fluorescence between Aβ HS L conditions and Aβ HS D is statistically significant (p=0.031).
Figure 1—figure supplement 3

Light-induced Aβ aggregation in Drosophila embryos resulted in distinct developmental defects.
(a) Still images from a 24 hr recording of Elav-Gal4/UAS-Aβ- CRY2-mCh aggregates in a Drosophila embryo without blue light illumination resulted in normal development. Time stages t = 1–6 showed embryonic development stages 12–13 (~440–620 min after fertilization), where germ band retraction starts and ends respectively. Germ band was 5.125 mm at t = 1, and retracted to 2.875 mm by t = 6. (b) Still images from a 24 hr recording of Elav-Gal4/UAS-Aβ-CRY2-mCh aggregates in a Drosophila embryo with blue light illumination every 2.5 min resulted in the arrest of embryogenesis during late germ band retraction stages. Time stages t = 1–6 showed embryonic development from late stage 10 to early stage 12 (~300–460 min after fertilization), where germ band retraction begins (stage 12). Germ band was 5.125 mm at t = 1, and retracted only to 4.25 mm by t = 6. (c) Still images from a 24 hr recording of uniform expression AD-Gal4/UAS-Aβ-CRY2-mCh aggregates in a Drosophila embryo without blue light illumination resulted in normal development. Time stages t = 1–6 showed embryonic development stages 14–16 (~620–900 min after fertilization), where dorsal closure of midgut and epidermis and shortening of ventral nerve cord occurs. In this case, the ventral nerve cord shortening was not clearly visible. (d) Still images from a 24 hr recording of AD-Gal4/UAS-Aβ-CRY2-mCh aggregates in a Drosophila embryo with blue light illumination at every 2.5 min resulted in the arrest of embryogenesis at dorsal closure stages. Time stages t = 1–6 corresponded to embryonic development stage 14 (approximately 620–680 min after fertilization), where dorsal closure begins.
Figure 1—figure supplement 4
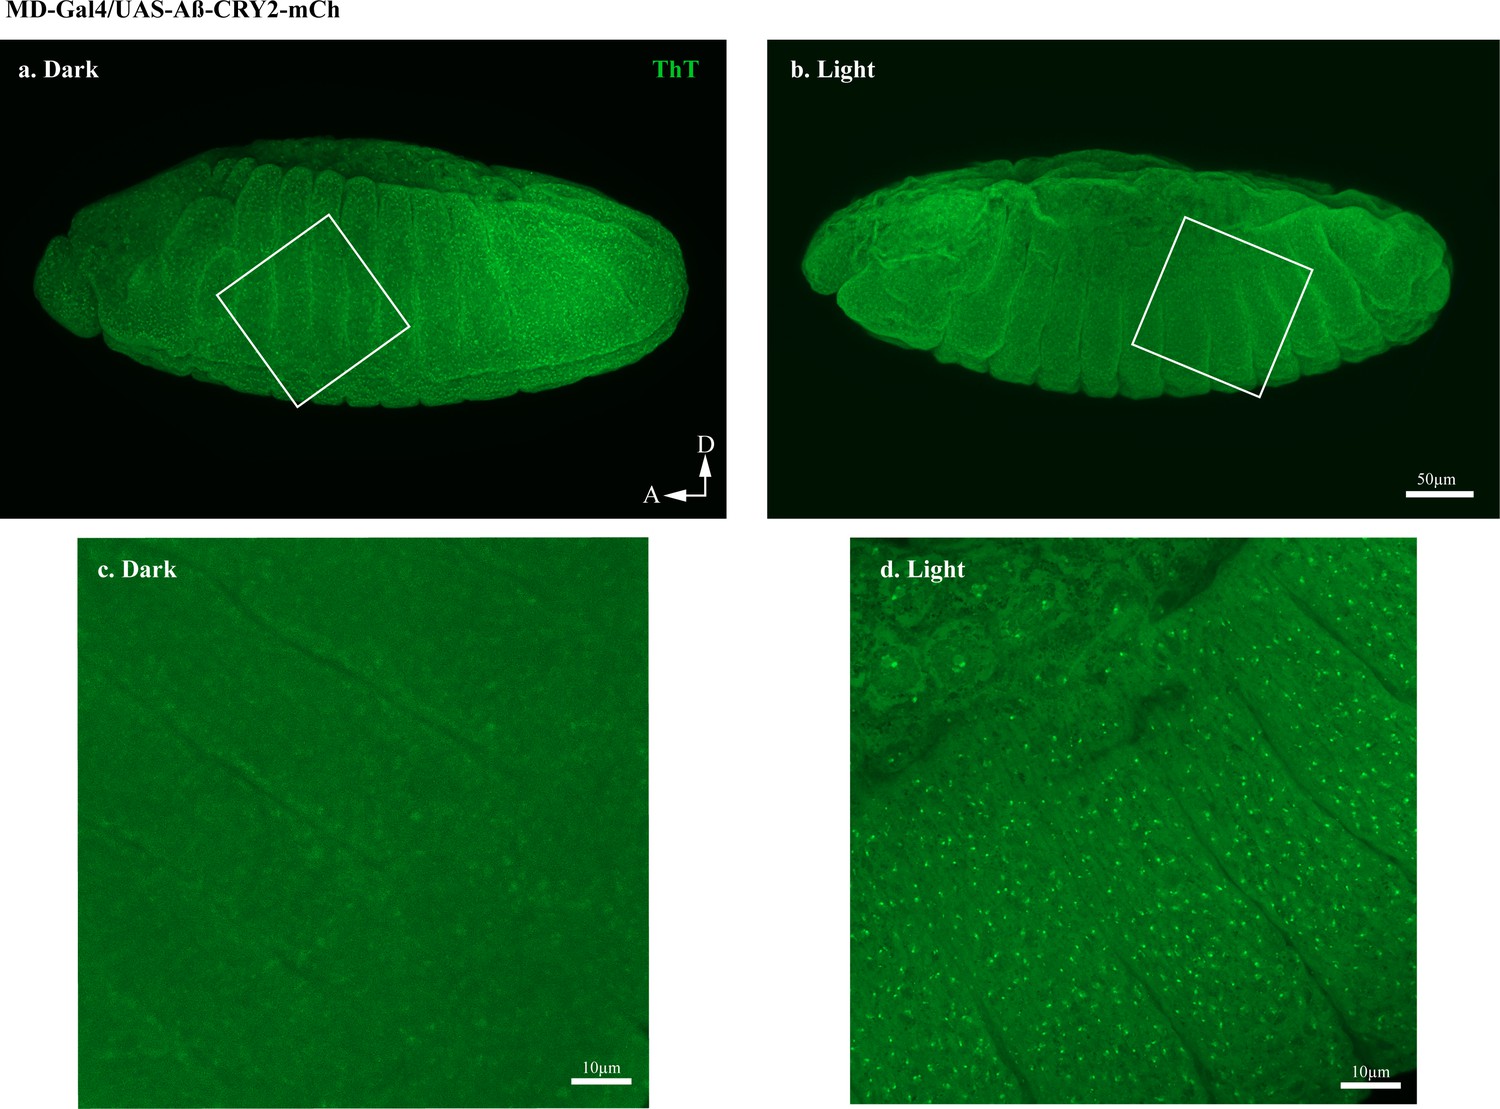
Thioflavin T (ThT) staining showing the Aβ aggregation transgenic Drosophila embryos ubiquitously expressing Aβ-CRY2-mCh.
Embryos expressing Aβ-CRY2-mCh ubiquitously showed significantly lesser Aβ aggregates in the (a) dark as compared to (b) embryo exposed to light. (a, b) were imaged at 20x. (c, d) were magnified images of the box in (a, b) imaged at 63x.
Figure 2
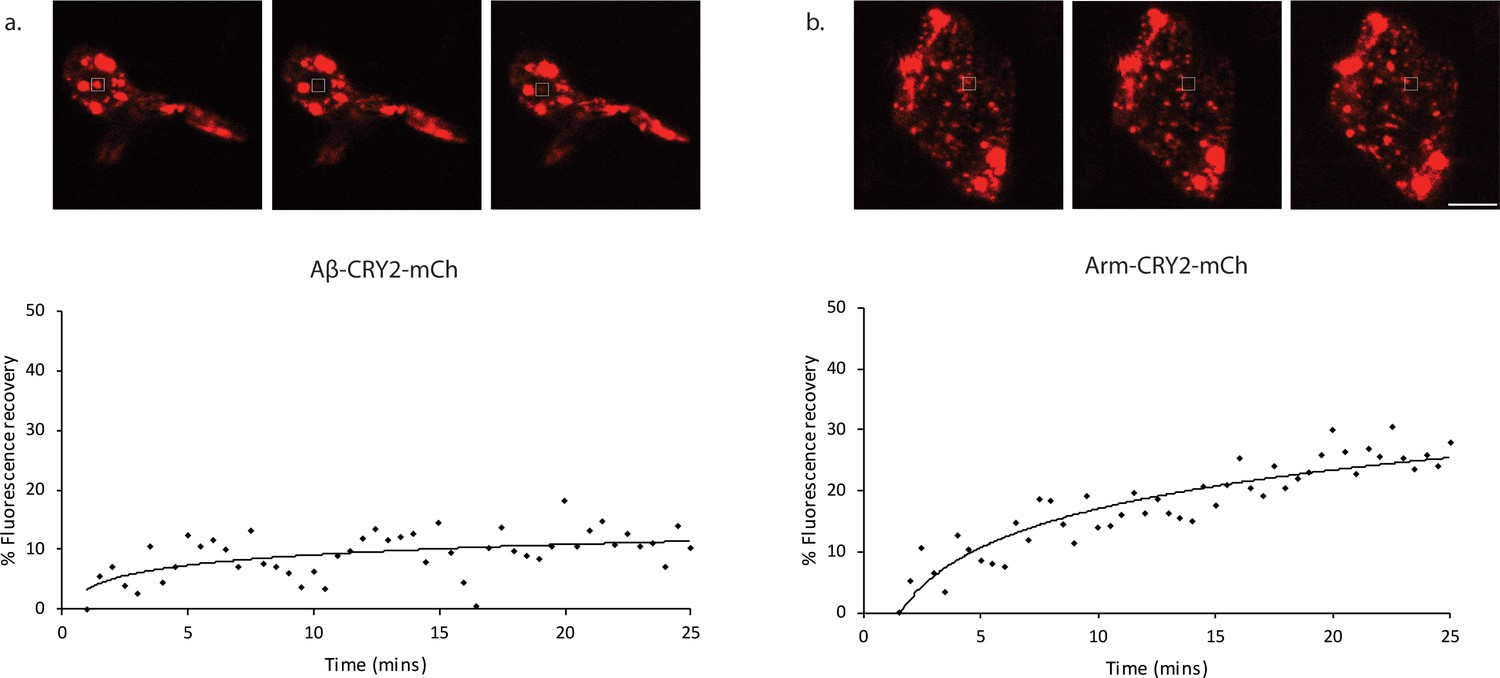
Fluorescence recovery after photobleaching (FRAP) analysis of Aβ-CRY2-mCh expressing cells compared to Arm-CRY2-mCh expressing cells inDrosophilagut.
Images and percentage fluorescence recovery after bleaching of (a) Aβ-CRY2-mCh expressing intestinal stem cells from esg-Gal4, UAS-GFP; UAS-Aβ-Cry2-mCh flies and (b) Arm-CRY2-mCh expressing stem cells from esg-Gal4, UAS-GFP; UAS-Arm-Cry2-mCh flies. Aβ-Cry2-mCh showed a much slower recovery of fluorescence post-bleaching as compared to an unrelated CRY2 construct (Arm-CRY2-mCh). Scale bar represents 5 µm.
Figure 3 with 1 supplement

Analysis of lifespans in transgenic Aβ-aggregation C. elegans and Drosophila and adult models.
(a) Kaplan-Meier survival curves of transgenic Aβ Drosophila adults driven by AD-Gal4 kept in the dark, exposed to light, exposed to light for 24 days then moved to the dark and exposed to light but fed with a lithium-supplemented diet. (b) Kaplan-Meier survival curves of transgenic Aβ Drosophila adults driven by Elav-Gal4 kept in the dark, exposed to light, exposed to light for 24 days then moved to the dark and exposed to light but fed with a lithium-supplemented diet. (c) Kaplan-Meier survival curves of control non-heat shocked nematodes, transgenic Aβ heat-shocked worms with the hsp-16–2 p promoter kept in the dark and transgenic Aβ heat-shocked worms with the hsp-16–2 p promoter kept in the light; those in light show a significantly shortened lifespan (overall significance by log-rank test: ****p<0.0001) (d) Table showing number of samples used with the mean and maximum survival times for all conditions.
Figure 3—figure supplement 1
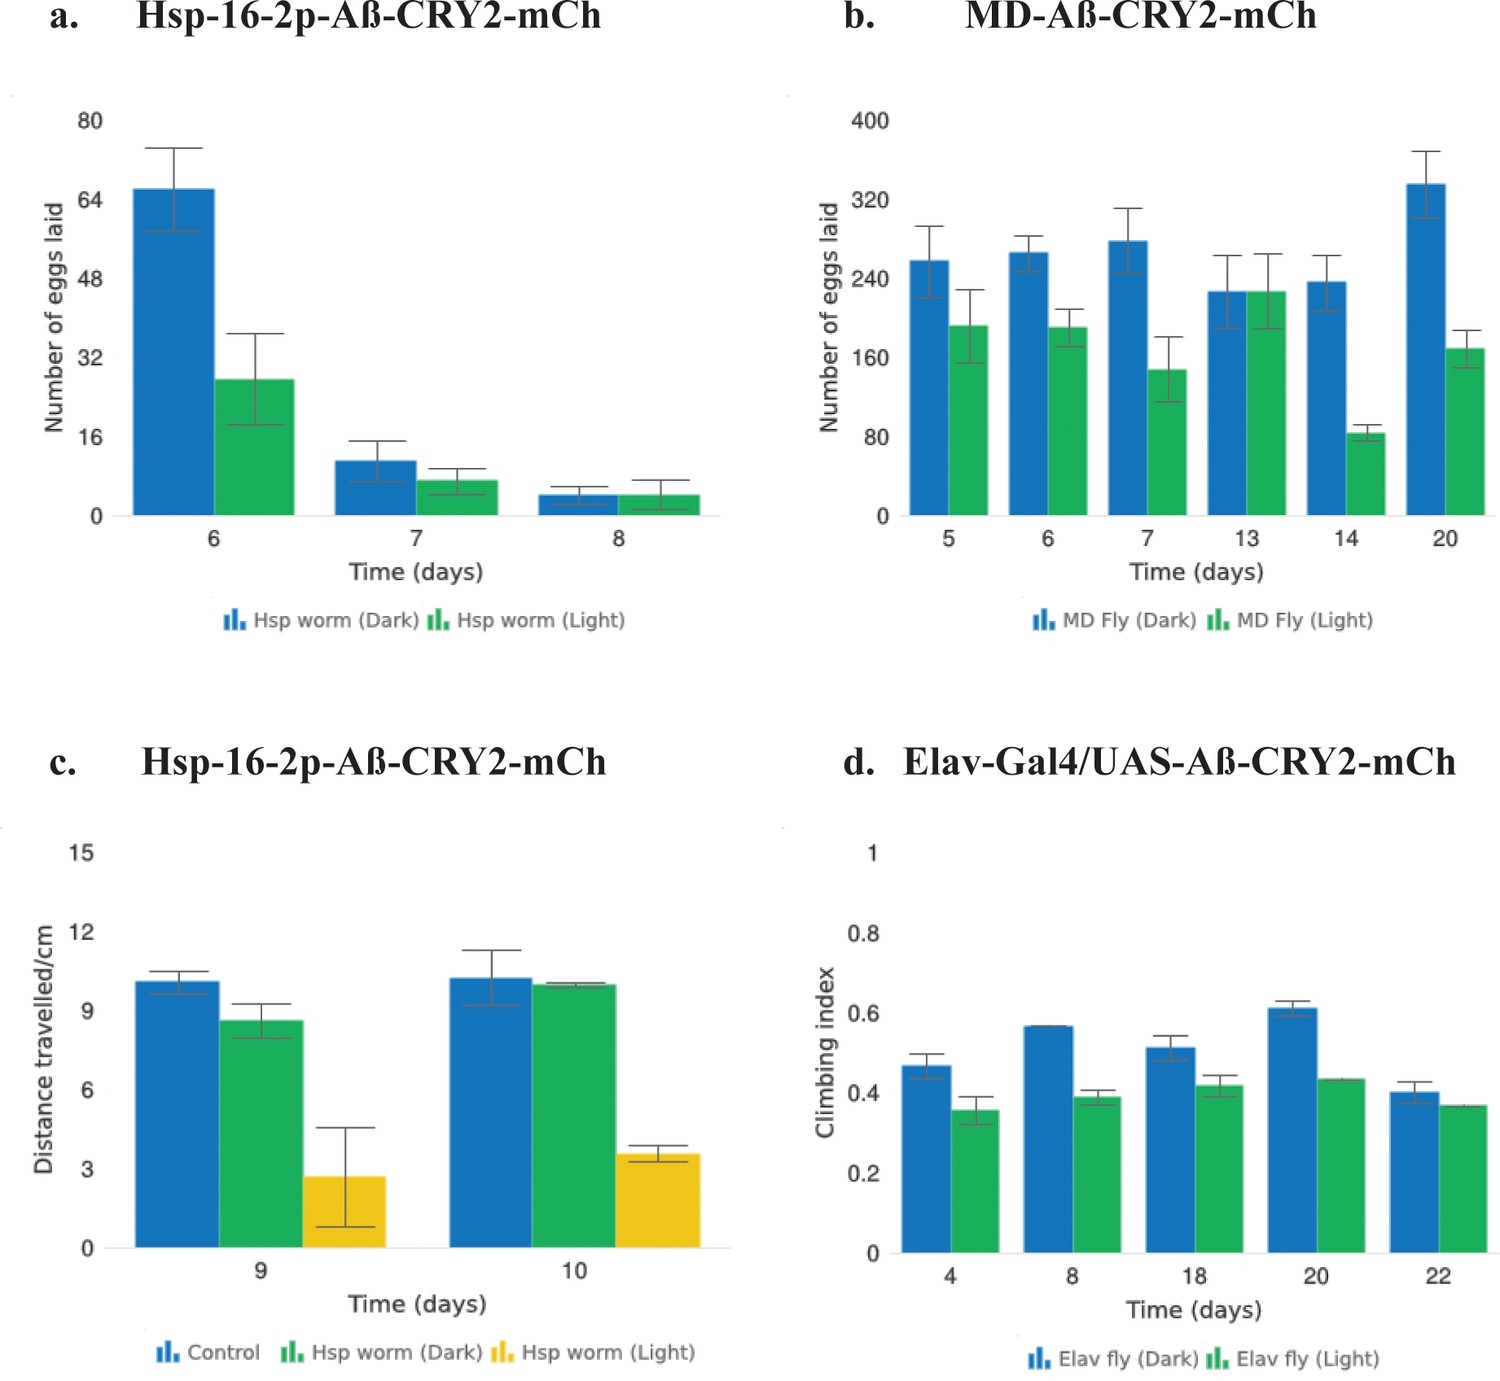
Aβ-CRY2-mCh expressing transgenic C. elegans and Drosophila reared in light showed signs of reduced fitness.
(a) Exposing Aβ-CRY2-mCh C. elegans to blue light significantly reduced progeny numbers. Two-way ANOVA, p=0.1. Data were sampled over three days (Days 6–8), n = 8 light and dark worms. (b) MD-Gal4 driven Aβ-CRY2-mCh transgenic Drosophila produced significantly lower number of progeny when exposed to blue light. Two-way ANOVA ****p<0.0001. Data were sampled on Days 5, 6, 7, 13, 14, and 20, n = 25 light and dark pairs of Drosophila. (c) Aβ-CRY2-mCh C. elegans have significantly reduced locomotive ability when reared in light. Distance travelled was reduced by about three-folds compared to the dark control and non-heat shocked control. Data were sampled on Days 9 and 10, two-way ANOVA **p<0.01 n = 6 light, dark and non-heat shocked controls. (d) Climbing assay showed that transgenic Aβ Drosophila displayed sensorimotor impairments when exposed to light. Two-way ANOVA ****p<0.0001. n = 18 light and dark conditions.
Figure 4 with 1 supplement
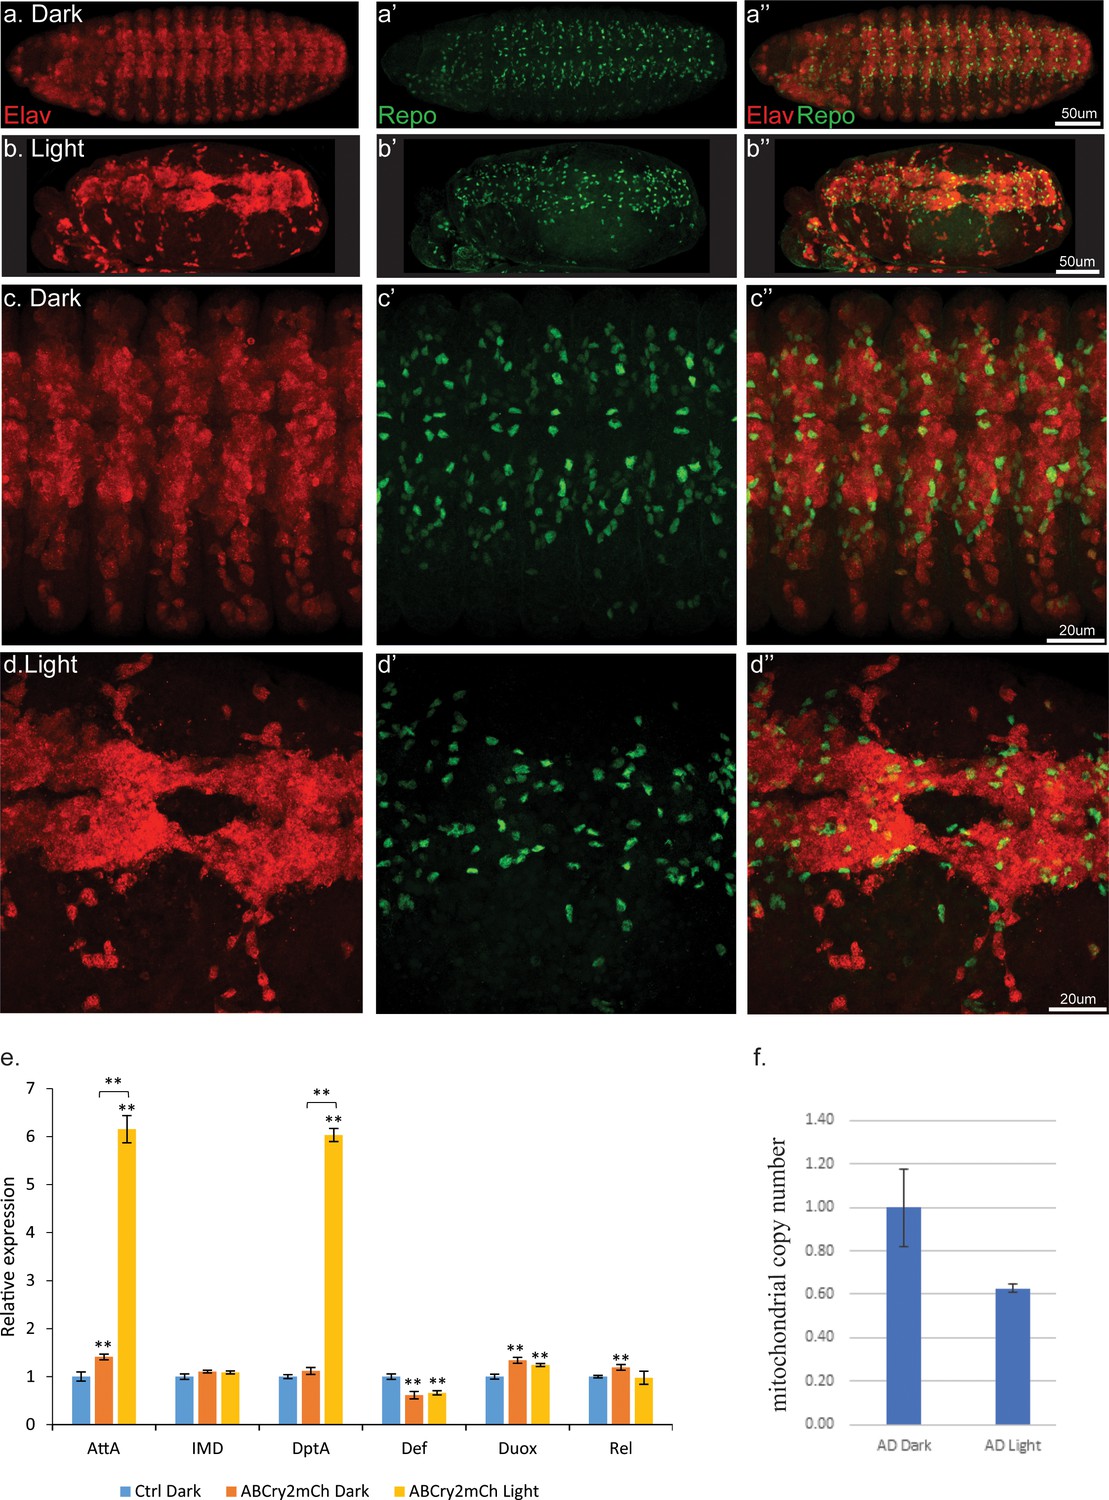
Light induced aggregation causes physical disruption of embryonic neural tissues.
(a–a’’) Elav-Gal4/UAS-Aβ-CRY2-mCh embryos kept in the dark and imaged for neurons (Elav) and glial cells (Repo). (b–b’’) Elav-Gal4/UAS-Aβ-CRY2-mCh embryos exposed to light and imaged for neurons (Elav) and glial cells (Repo). (c–d’’) Close ups. (E) Aggregation induced inflammatory response as measured by qPCR for inflammatory response genes. (f) The number of mitochondria in transgenic Aβ Drosophila embryo was reduced by 40% in light.
Figure 4—figure supplement 1
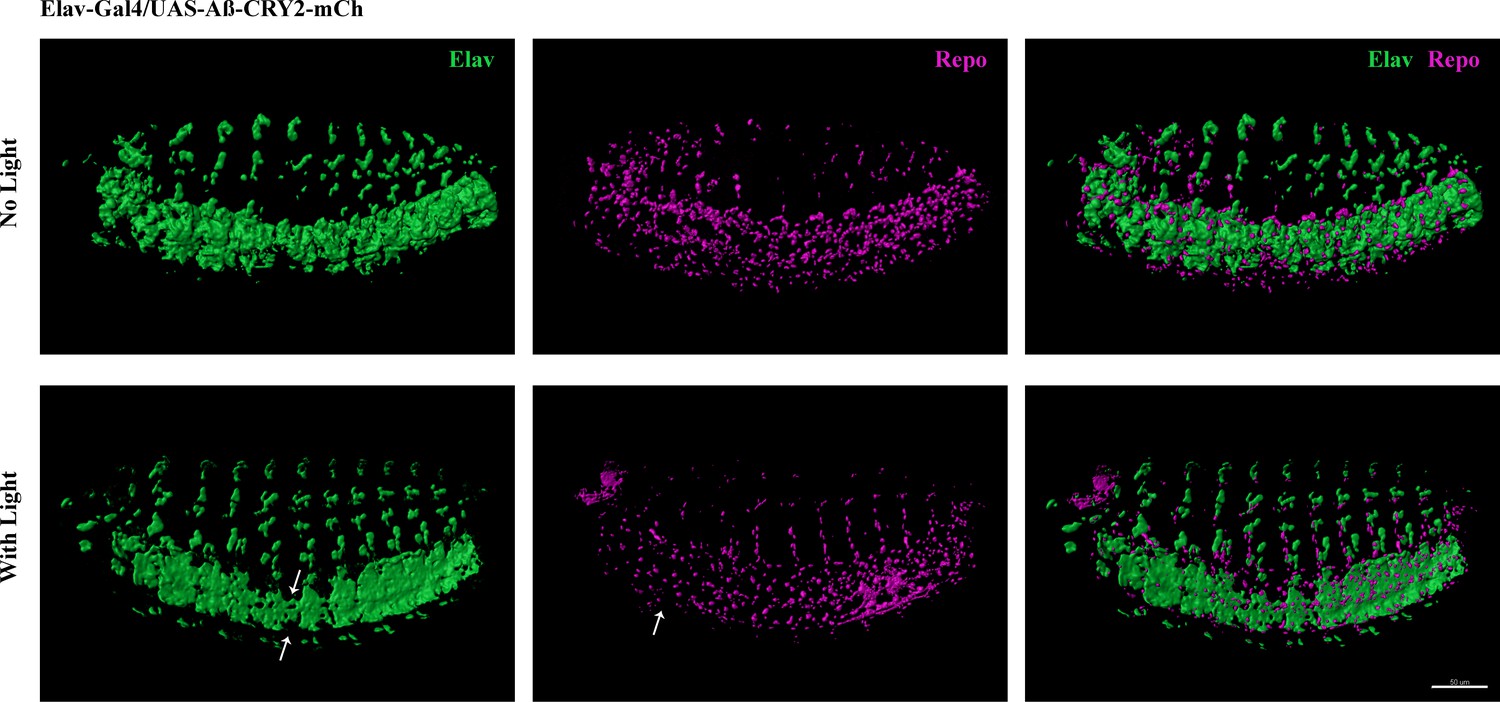
Light-induced Aβ aggregation leads to developmental deficits in transgenic Drosophila embryo.
Reduction of neurons and glia cells (arrows) detected by immunostaining of Elav and Repo in transgenic Aβ Drosophila embryos imaged at 40x.
Figure 5
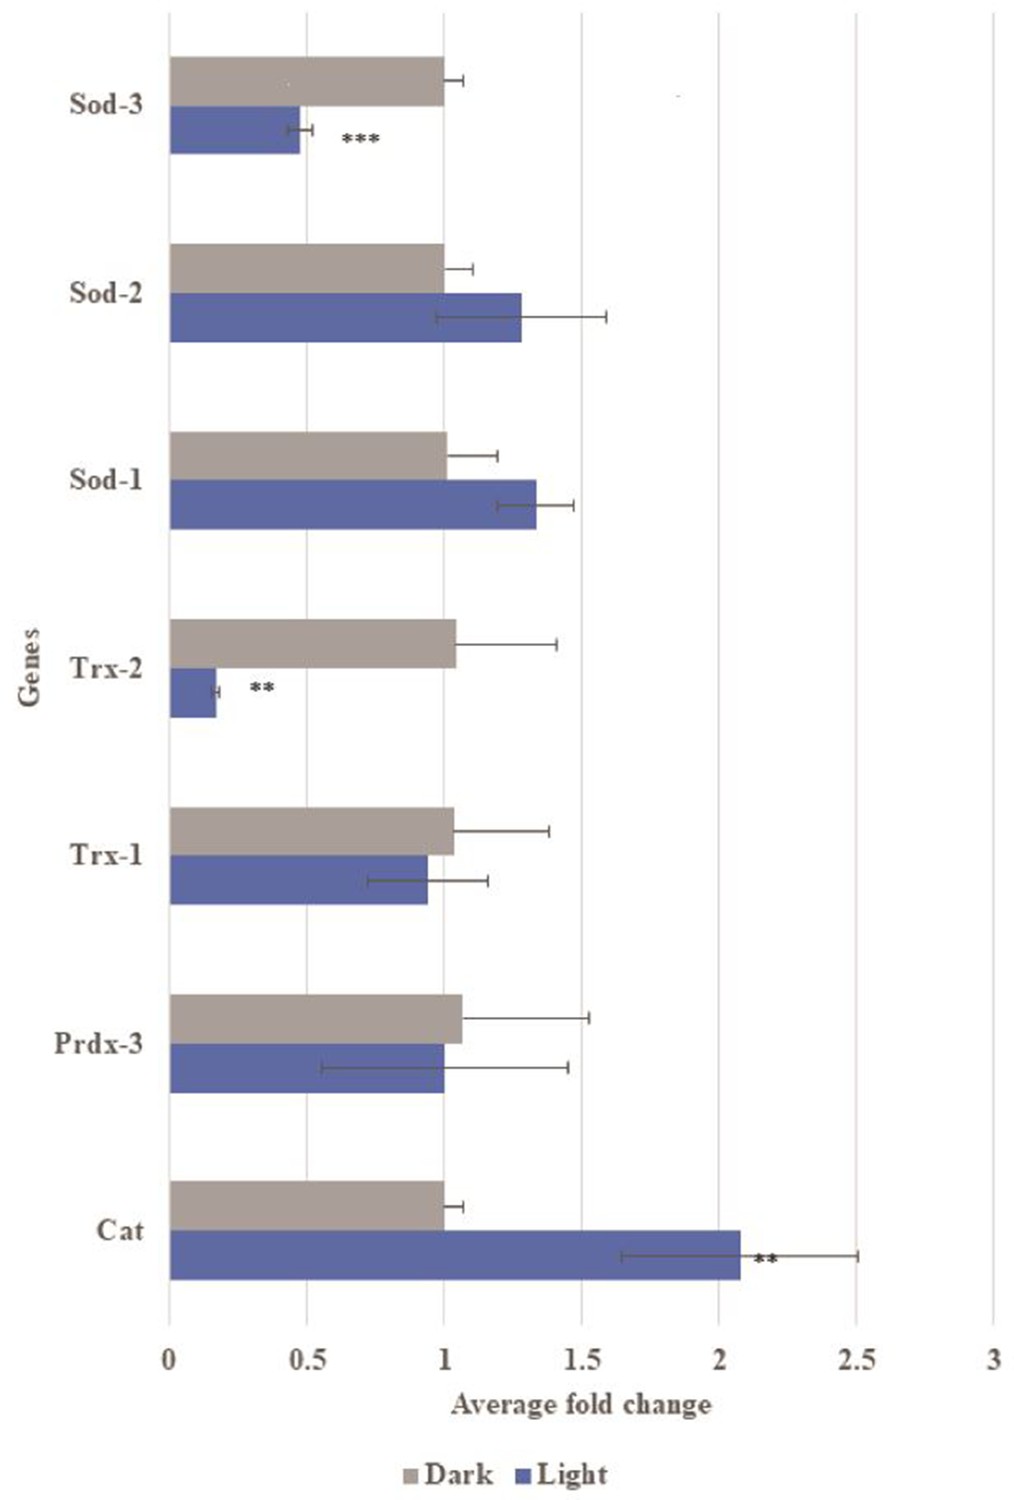
Gene expression of oxidative stress related genes in transgenic Aβ C. elegans with and without light-induction.
Differential gene expression of catalase (Cat), peroxiredoxin-3 (Prdx3), thiroredoxin-1 (Trx-1), thioredoxin-2 (Trx-2), superoxide dismutase-1 (SOD-1), superoxide dismutase-2 (SOD-2) and superoxide dismutase-3 (SOD-3) in transgenic Aβ C. elegans in light condition compared to control dark condition. Light-induced Aβ aggregation showed up-regulation in expression of Cat (**p<0.01) and down-regulation in expression of Trx-2 (*p<0.01) and Sod-3 (***p<0.001).
Figure 6
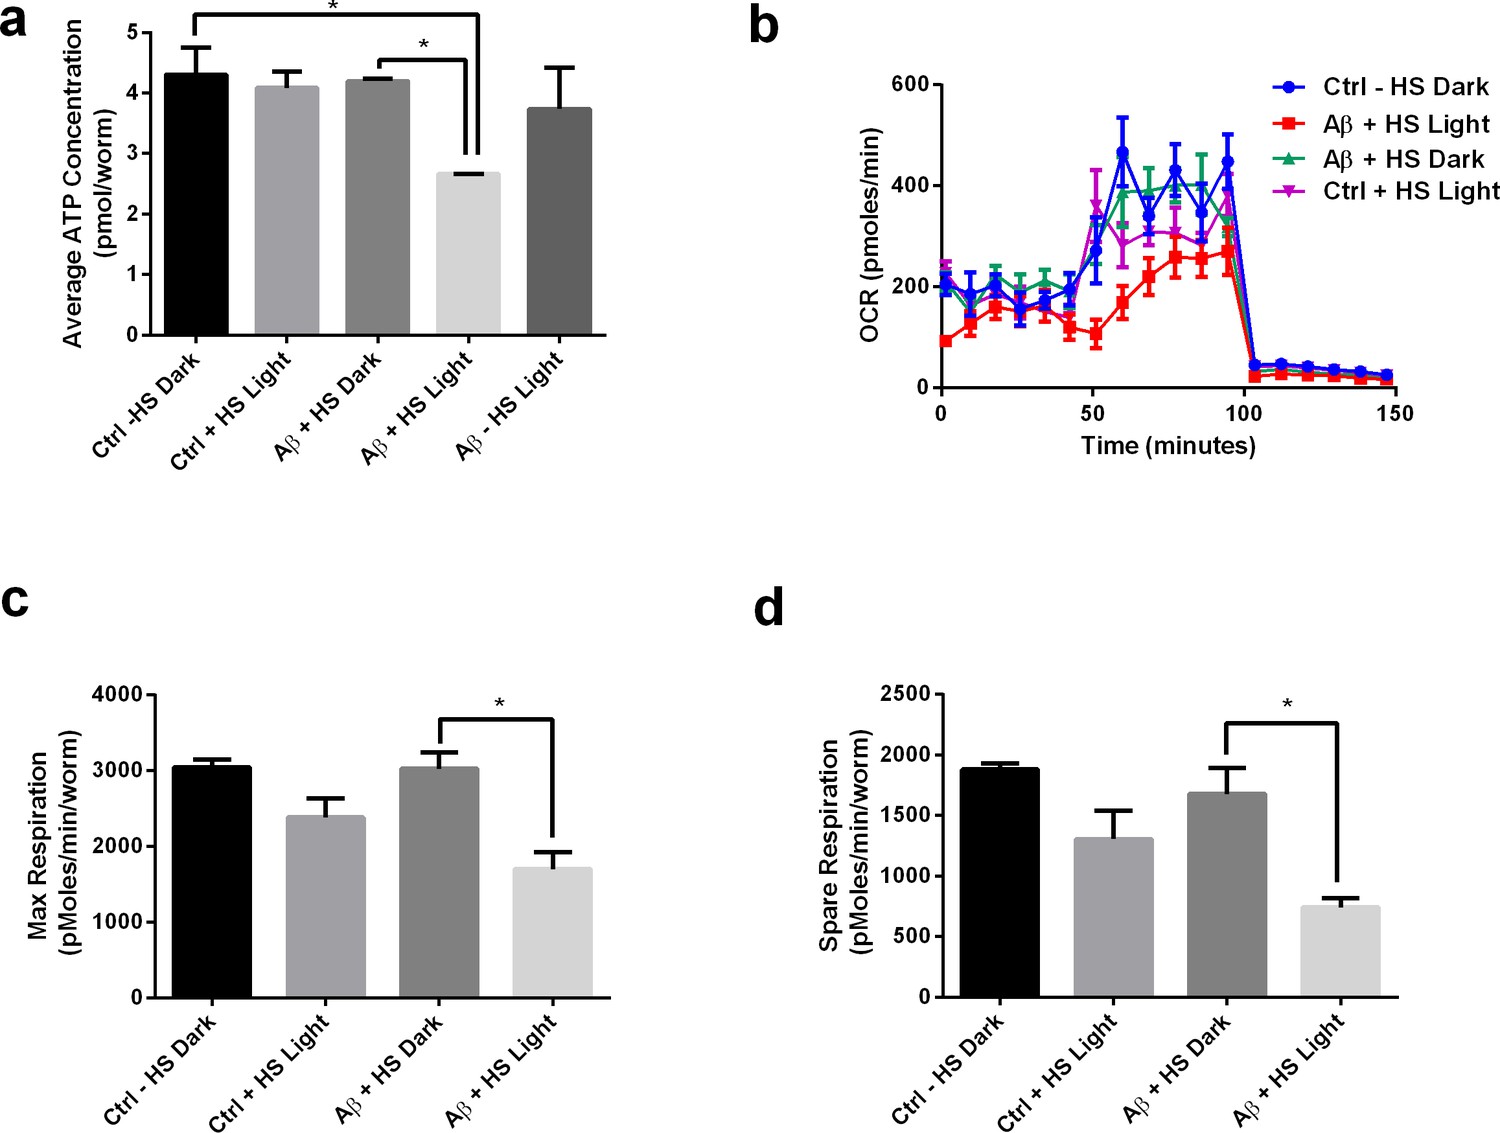
Light-induced Aβ oligomerization is required for the manifestation of metabolic defects in transgenic C.elegans.
(a) ATP levels of control and transgenic Aβ nematodes (n = 3 repeats for each condition, with 100 nematodes per repeat; ANOVA post-test p<0.05, *). (b) Oxygen consumption profile (OCR) of control and transgenic Aβ nematodes (n = 6 repeats for each condition, with 10 nematodes per repeat). (c) Maximal respiration derived from OCR (n = 6 repeats for each condition, with 10 nematodes per repeat; ANOVA post-test p<0.05, *). (d) Spare respiration derived from OCR (n=6 repeats for each condition, with 10 nematodes per repeat; ANOVA post-test p<0.05, *).
Figure 7
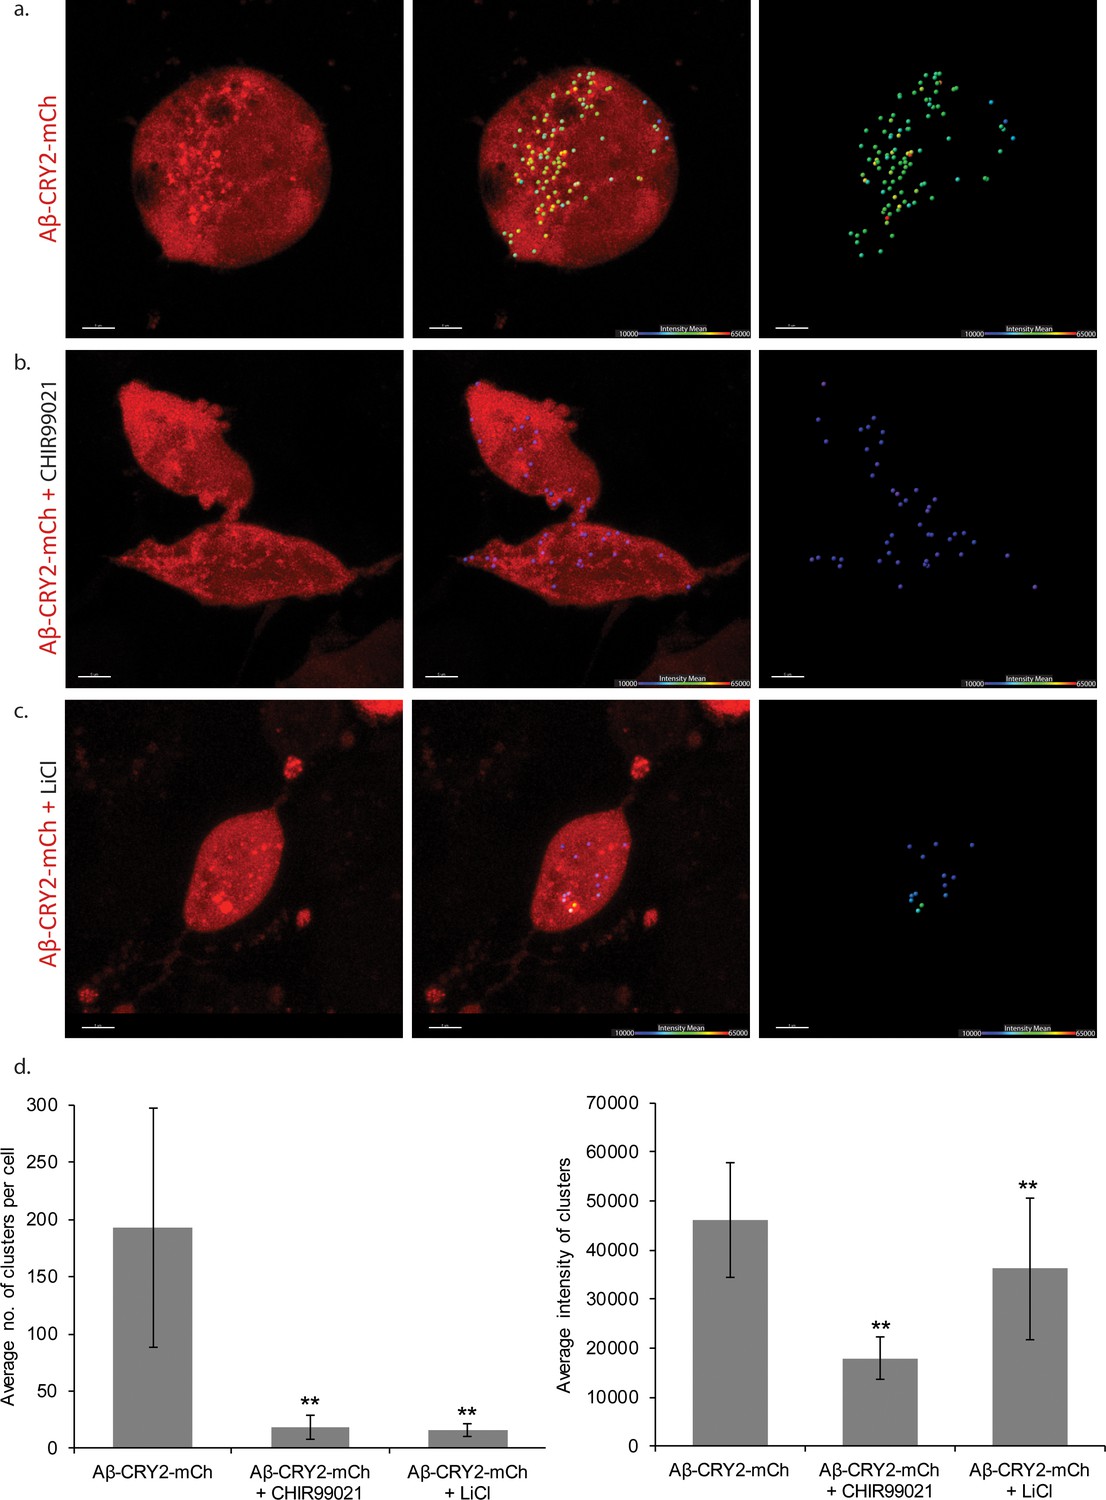
HEK cells expressing Aβ-CRY2-mCh in light condition.
(a) Untreated control HEK cells show light-induced clustering of Aβ-CRY2-mCh and increased number of vacuoles under blue light illumination. (b) HEK cells treated with GSK3 inhibitor CHIR99021 (positive control) show little clustering of the light-induced Aβ-CRY2-mCh. Fewer cellular vacuoles observed. (c) HEK cells treated with lithium chloride show homogenous expression of Aβ-CRY2-mCh, whereby blue light illumination did not result in significant clustering of Aβ-CRY2-mCh. (d) Quantification of cluster number per cell showed significantly reduced cluster formation in cells treated with CHIR99021 and lithium chloride as compared to control cells. (**p<0.01) (e) Quantification of the mean intensity of the clusters showed significantly reduced intensity of the clusters when the cells were treated with GSK3 inhibitor CHIR99021 and lithium chloride as compared to control cells.
Figure 8 with 1 supplement
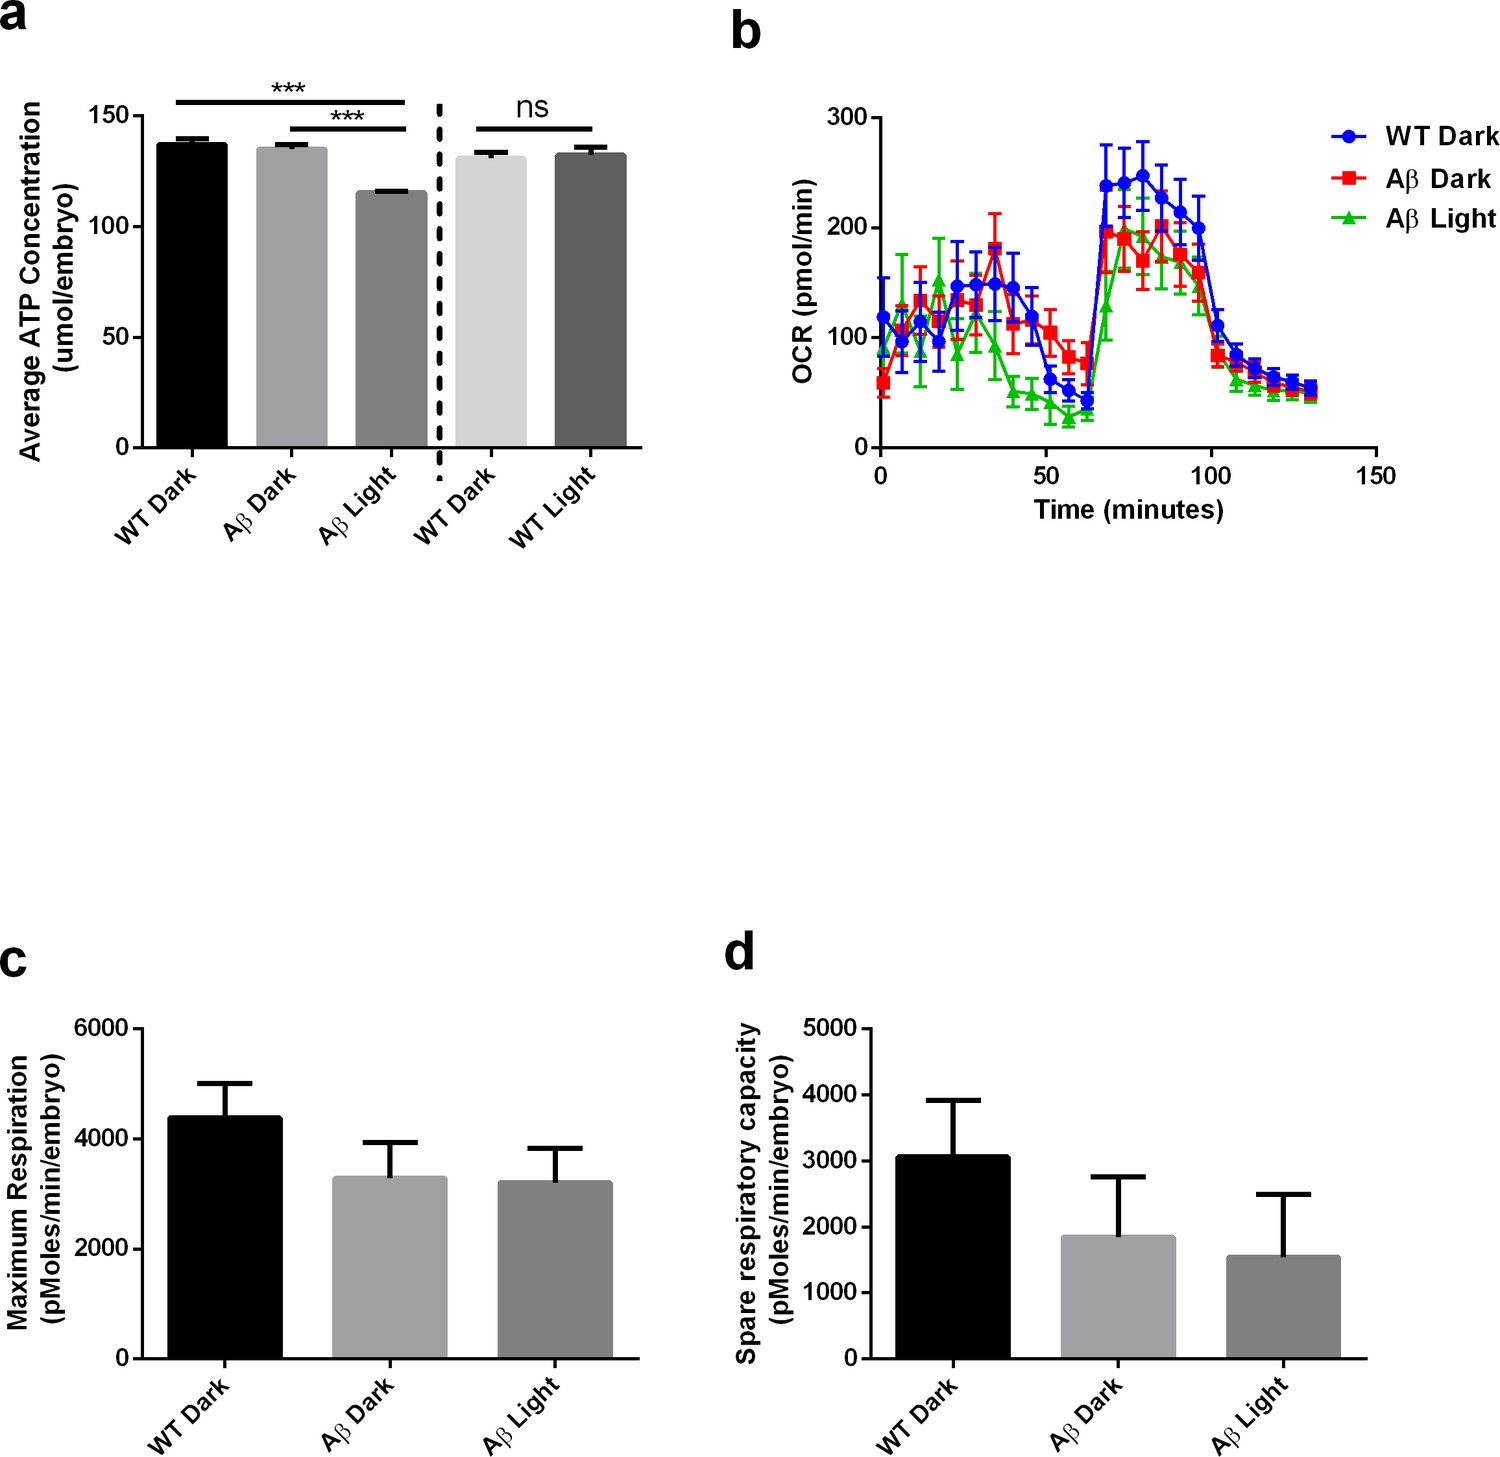
Light-induced Aβ oligomerization is required for the manifestation of metabolic defects in transgenic D. Rerio.
(a) ATP levels of control and transgenic Aβ D. rerio embryos (n = 8 repeats for each condition; ANOVA post-test p<0.001, ***). Light treatment did not affect ATP levels in control embryos (performed in a separate experiment). (b) Oxygen consumption profile (OCR) of control and transgenic Aβ D. rerio embryos (24 embryos/condition) (c) Maximal respiration derived from OCR. (d) Spare respiration derived from OCR.
Figure 8—figure supplement 1
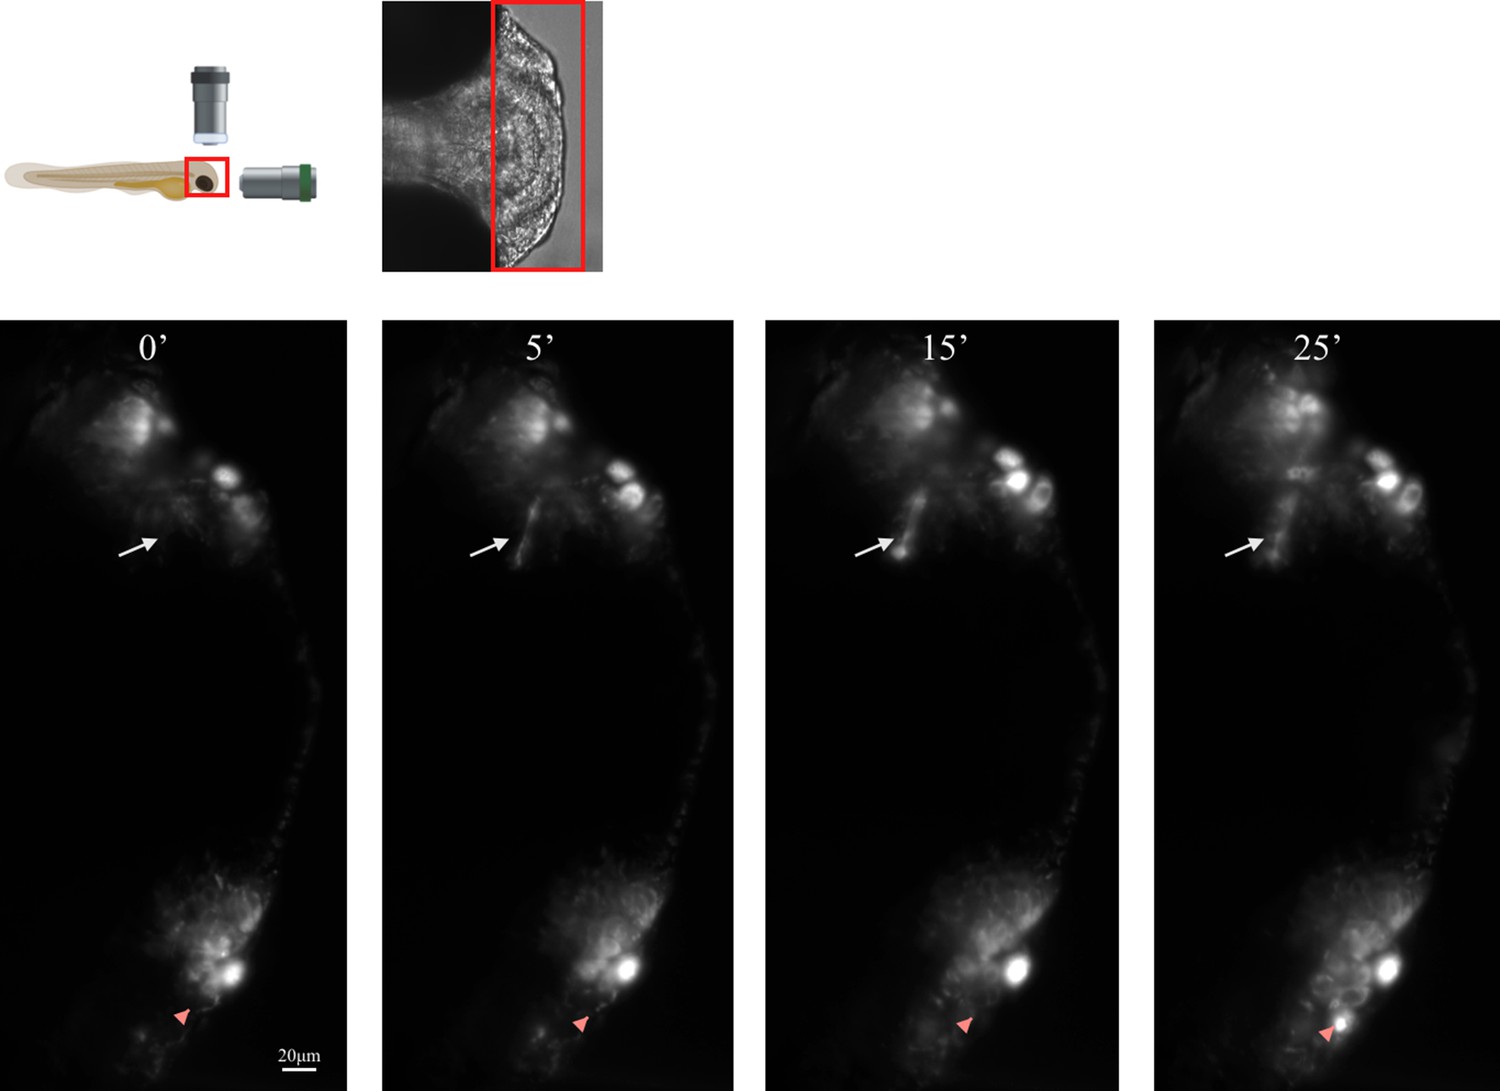
Transgenic Aβ model in Danio Rerio embryo expressing Aβ-CRY2-mCh (red).
Schematic of lightsheet imaging/illumination lens orientation to D. rerio embryo, and stills from Video 4.
Videos
Video 1
Elav-Gal4/UAS-Aβ-CRY2-mCh embryos kept in the dark and imaged for neurons in red mCherry and glial cells Repo-QF2 >QUAS GFP.
Blue laser power kept low to allow imaging of glial cells, but not high enough to activate aggregation.
Video 2
Elav-Gal4/UAS-Aβ-CRY2-mCh embryos exposed to light and imaged for neurons in red mCherry and glial cells Repo-QF2 >QUAS GFP.
Blue laser power at higher setting to allow imaging of glial cells and activate aggregation.
Video 3
Elav-Gal4/UAS-MyrTomato embryos exposed to light and imaged for neurons in red (tdTom) and glial cells Repo-QF2 >QUAS GFP.
Blue laser power at higher setting to allow imaging of glial cells and control for laser damage.
Video 4
Expression of Aβ-CRY2-mCh in zebrafish developing brains.
Schematic of imaging set up and area of interest. Imaging of cell movement, Aβ-CRY2-mCh aggregation and cell death.
Video 5
Expression Aβ-mCh in zebrafish developing brains.
Schematic of imaging set up and area of interest. No obvious cell movement or cell death despite Aβ-mCh expression.
Additional files
Download links
A two-part list of links to download the article, or parts of the article, in various formats.
Downloads (link to download the article as PDF)
Open citations (links to open the citations from this article in various online reference manager services)
Cite this article (links to download the citations from this article in formats compatible with various reference manager tools)
Application of optogenetic Amyloid-β distinguishes between metabolic and physical damages in neurodegeneration
eLife 9:e52589.
https://doi.org/10.7554/eLife.52589


