Highly regulated, diversifying NTP-dependent biological conflict systems with implications for the emergence of multicellularity
- Computational Biology Branch, National Center for Biotechnology Information, National Library of Medicine, National Institutes of Health, United States
Figures
Figure 1 with 2 supplements
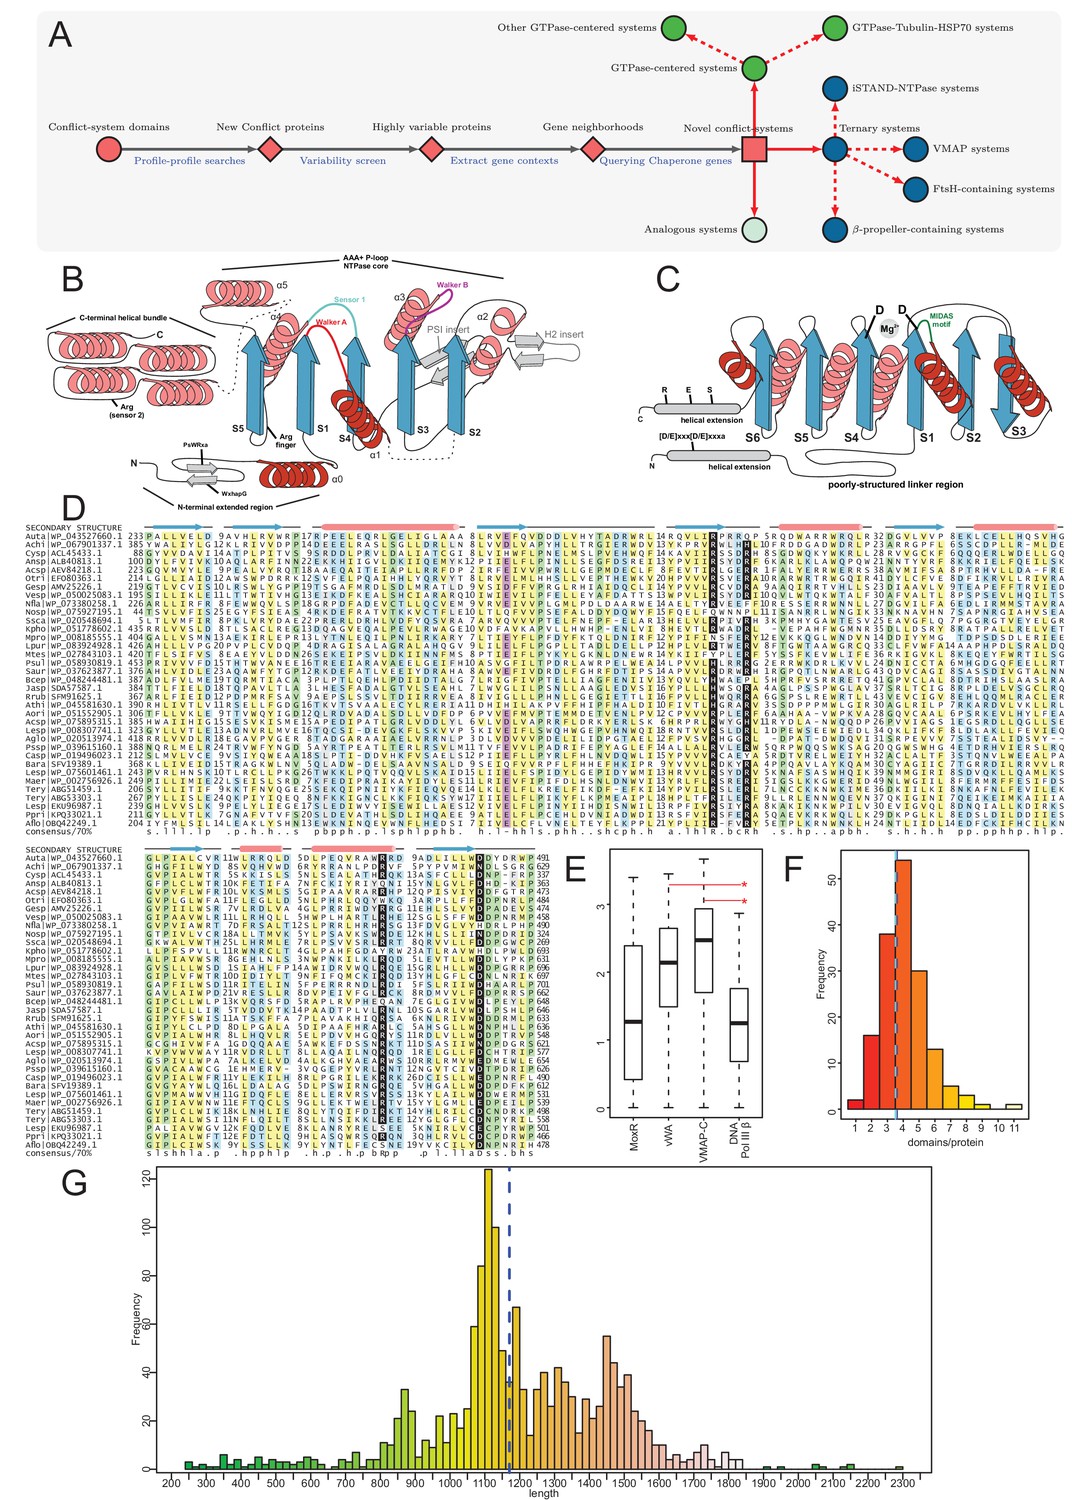
Identification of novel conflict systems and overview of core ternary system components.
(A) Flowchart showing the process used to identify the conflict systems in this study. (B–C) Topology diagrams of the vWA (B) and MoxR (C) domains highlighting characteristic conserved features. (D) Multiple sequence alignment of VMAP-C domain. Sequences are labeled to the left by organism abbreviation (see Figure 1—source data 1) and accession number. Predicted secondary structure is shown on top and the consensus conservation used for coloring is given below. (E) Boxplot comparing sequence entropy values for VMAP core ternary system domains, collected from a common set of genomes containing all four components. Significant p-values determined by Wilcoxon Rank-Sum Test: *, p-value<2.2e-16. (F) Distribution of the number of effector domains C-terminally fused to the core vWA domain of the classical ternary systems. Dashed vertical lines, colored in cyan and blue, indicate median and mean domain number, respectively. (G) Histogram of the length distribution of the core vWA domain-containing component of the VMAP ternary systems, with dashed line as in (F).
-
Figure 1—source data 1
Comparative genomics data.
- https://cdn.elifesciences.org/articles/52696/elife-52696-fig1-data1-v2.pdf
Figure 1—figure supplement 1
Histograms of vWA-fused effector protein length distributions by effector domain type.
Dashed blue vertical line indicates mean length.
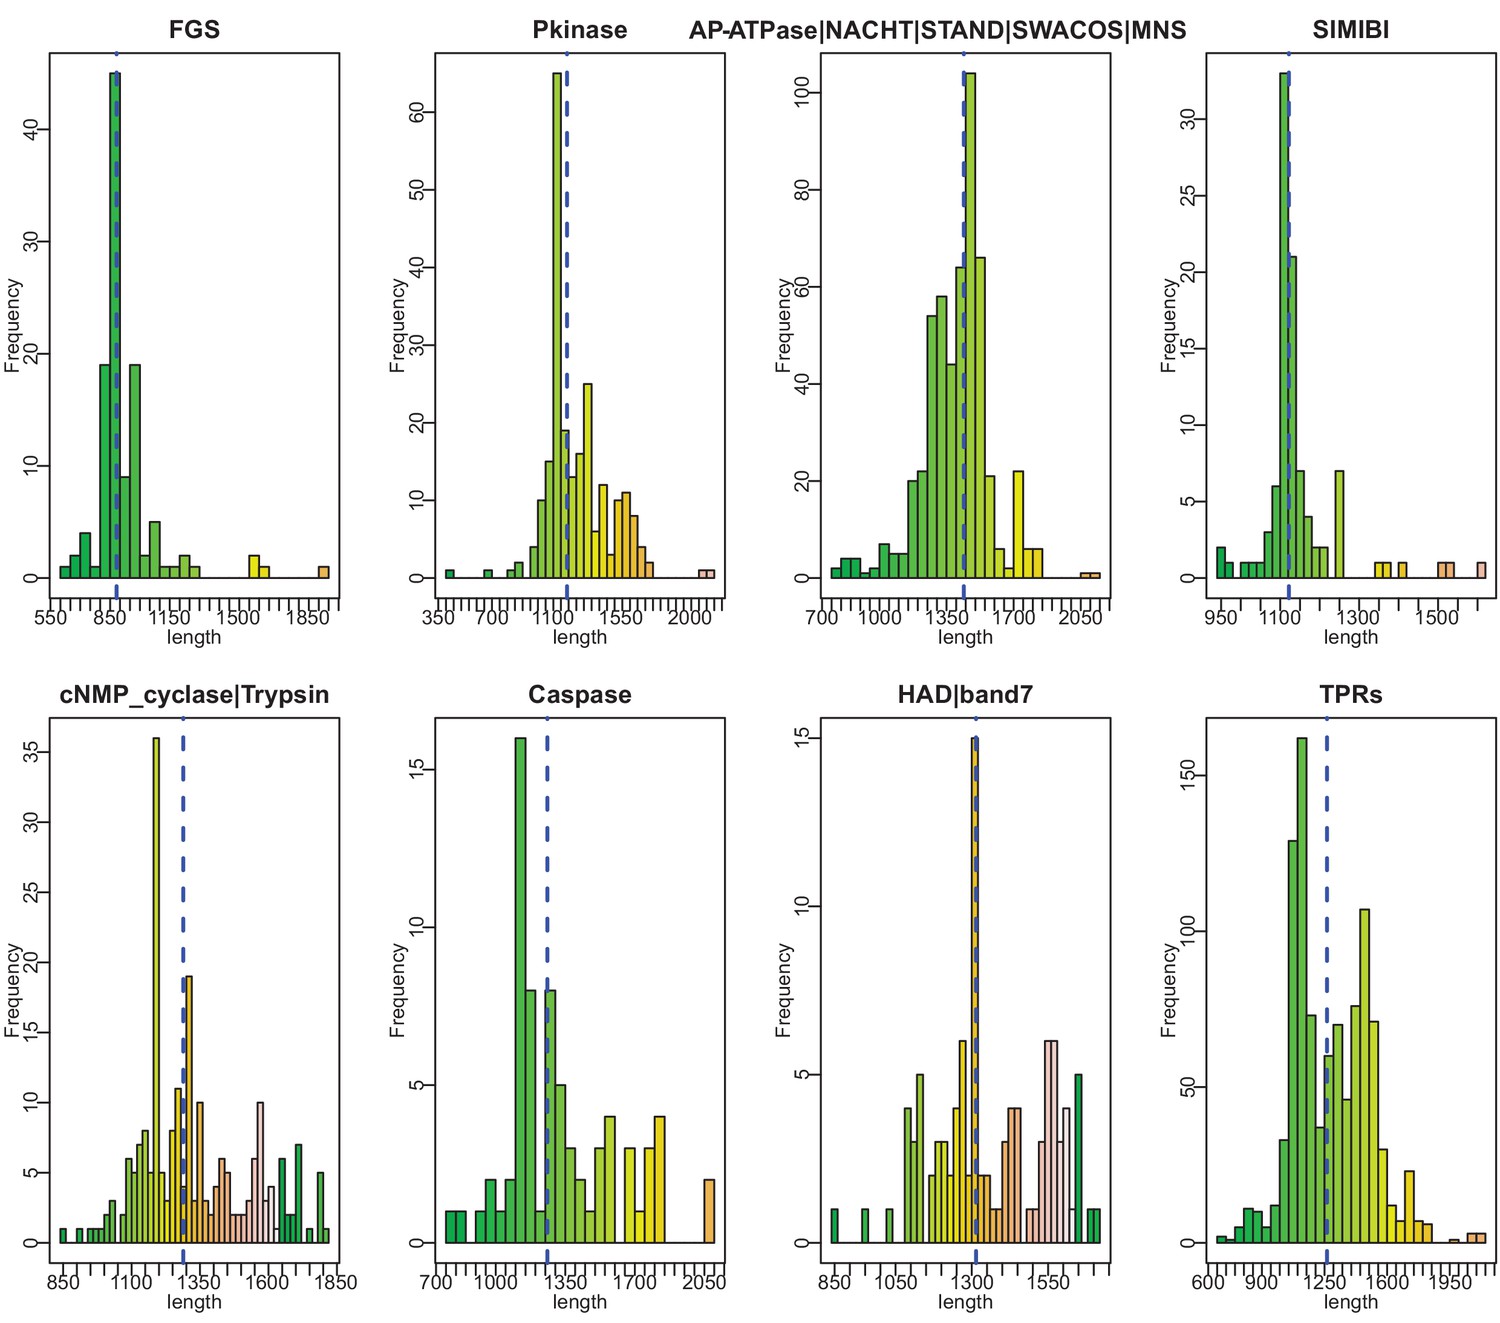
Figure 1—figure supplement 2
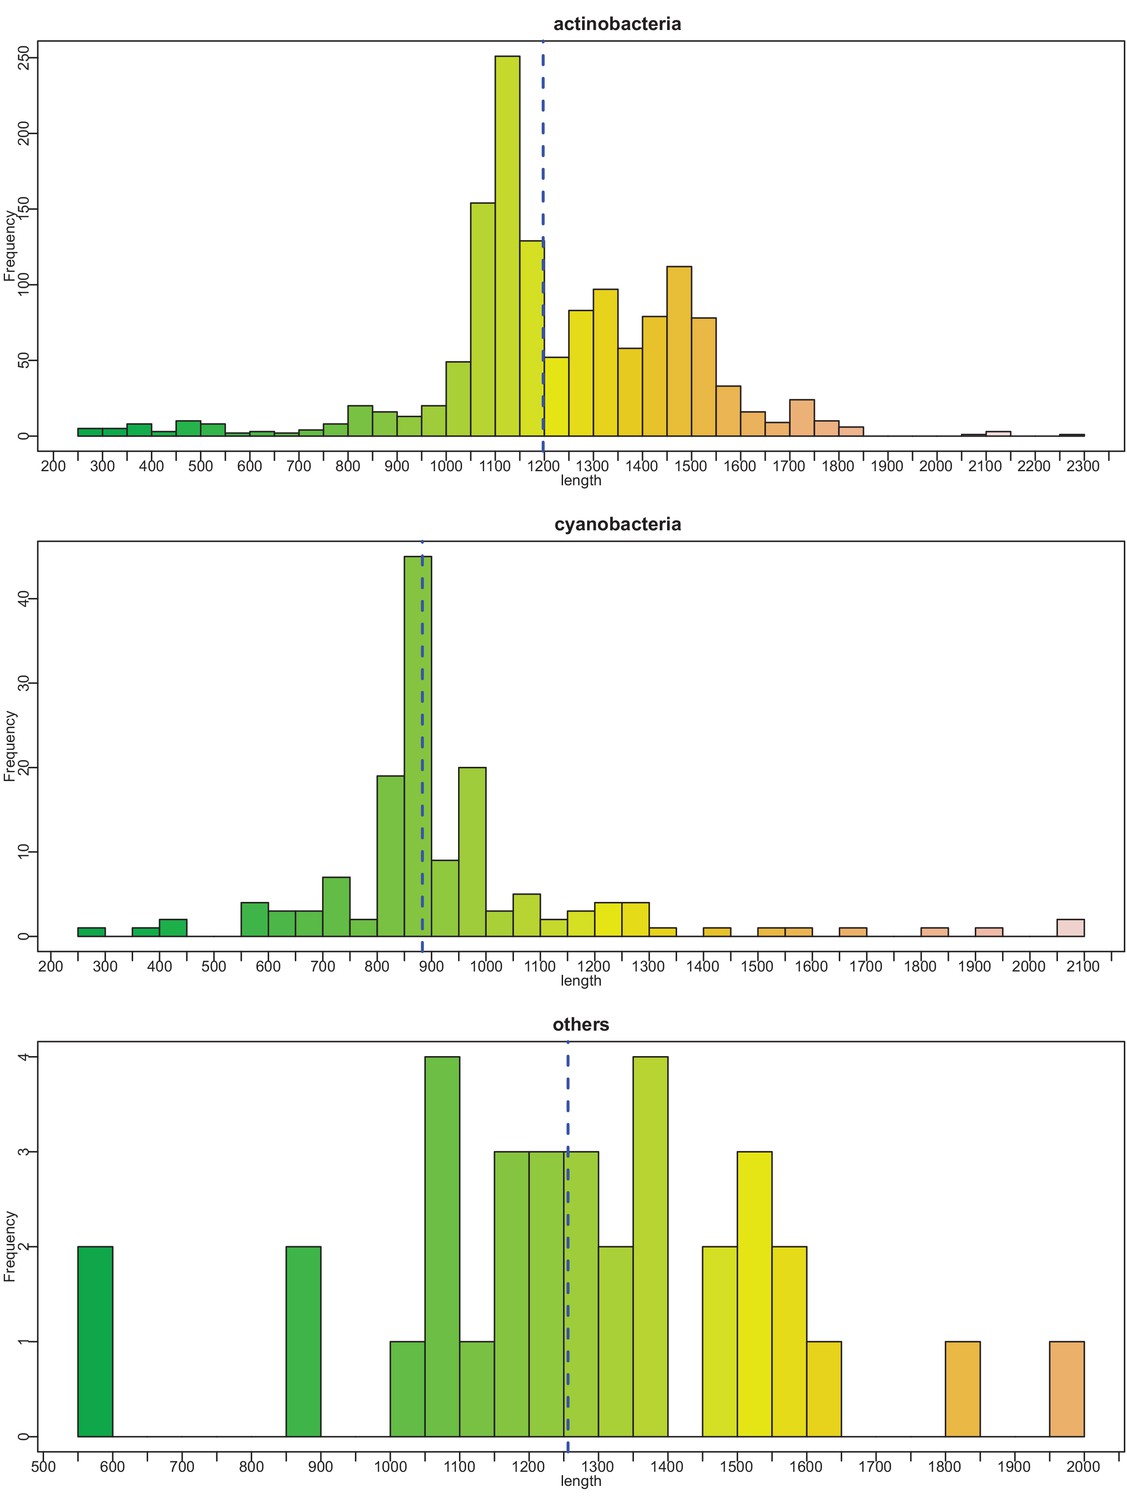
Histograms of vWA-fused effector protein length distributions by taxonomy.
Dashed blue vertical line indicates mean length.
Figure 2 with 1 supplement
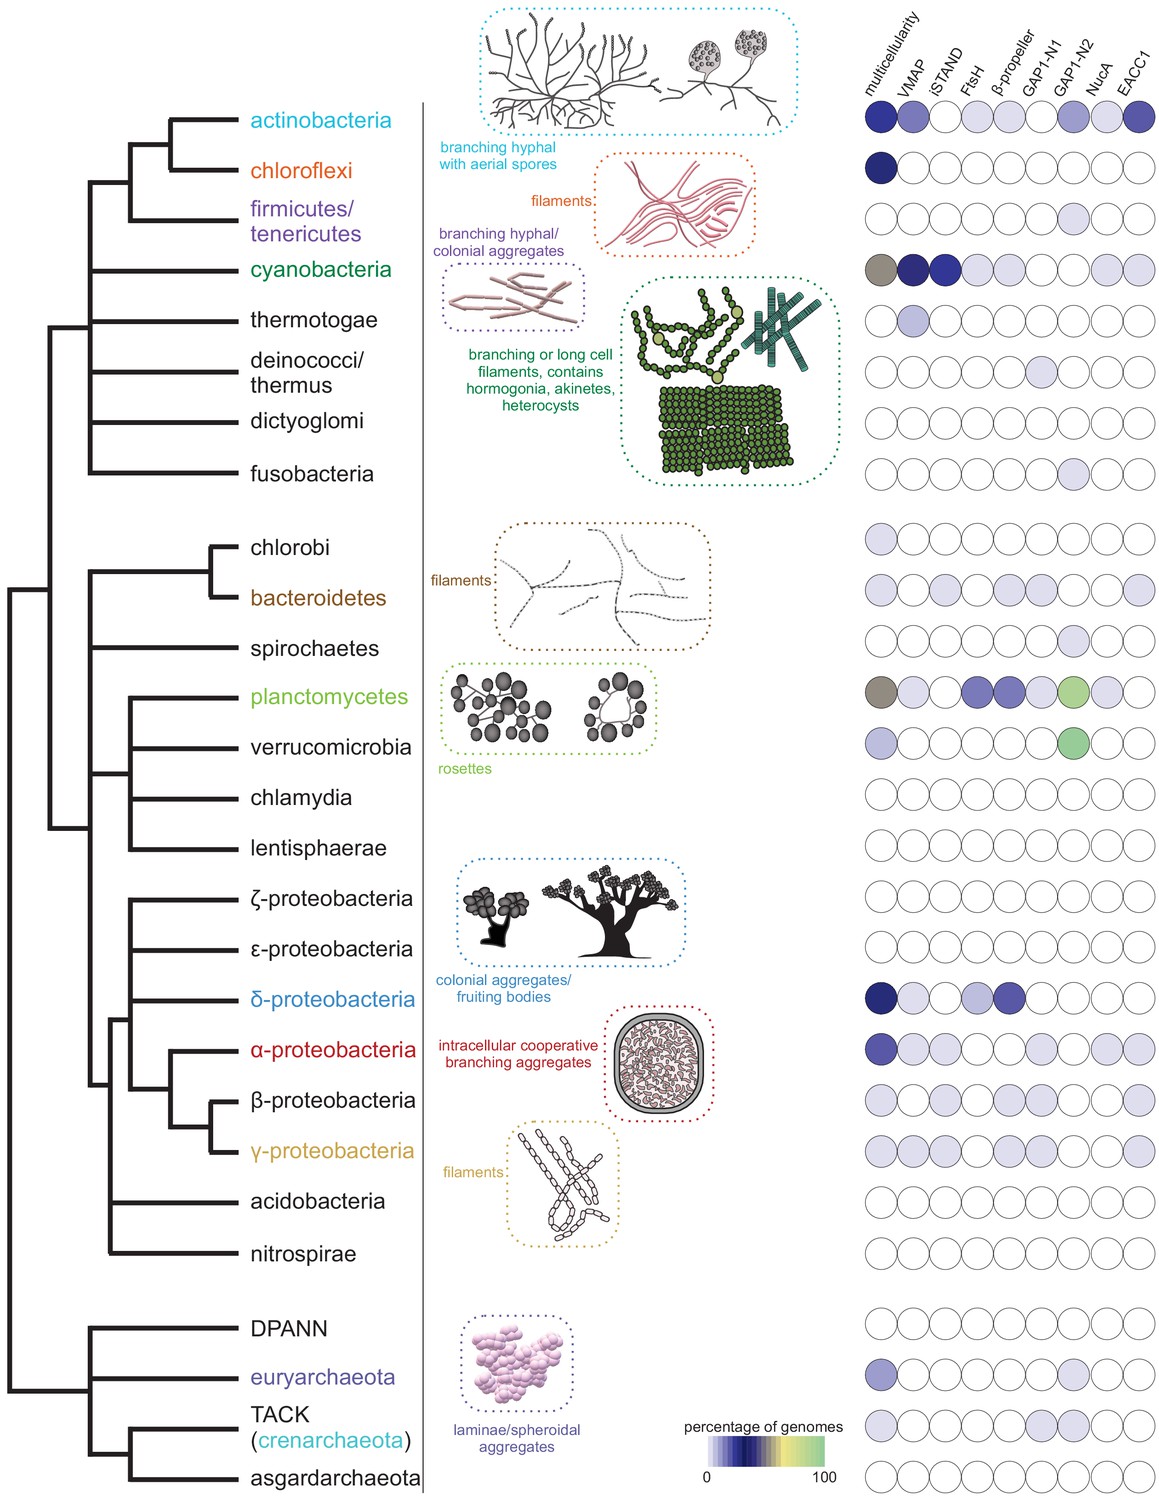
Emergence of multicellularity across prokaryotes and the presence of the newly-identified conflict systems.
Tree of prokaryotic life (left) with general description and illustrations of known multicellular arrangements within clades (center) juxtaposed against presence/absence of the described systems (right). Coloring of clade labels matches multicellular descriptions. On the right, the fraction of organisms containing a system within a specific clade from the curated database (Materials and methods) is color-coded according to bottom legend. The first column on the right provides the fraction of known multicellular organisms within a clade in the curated database.
Figure 2—figure supplement 1
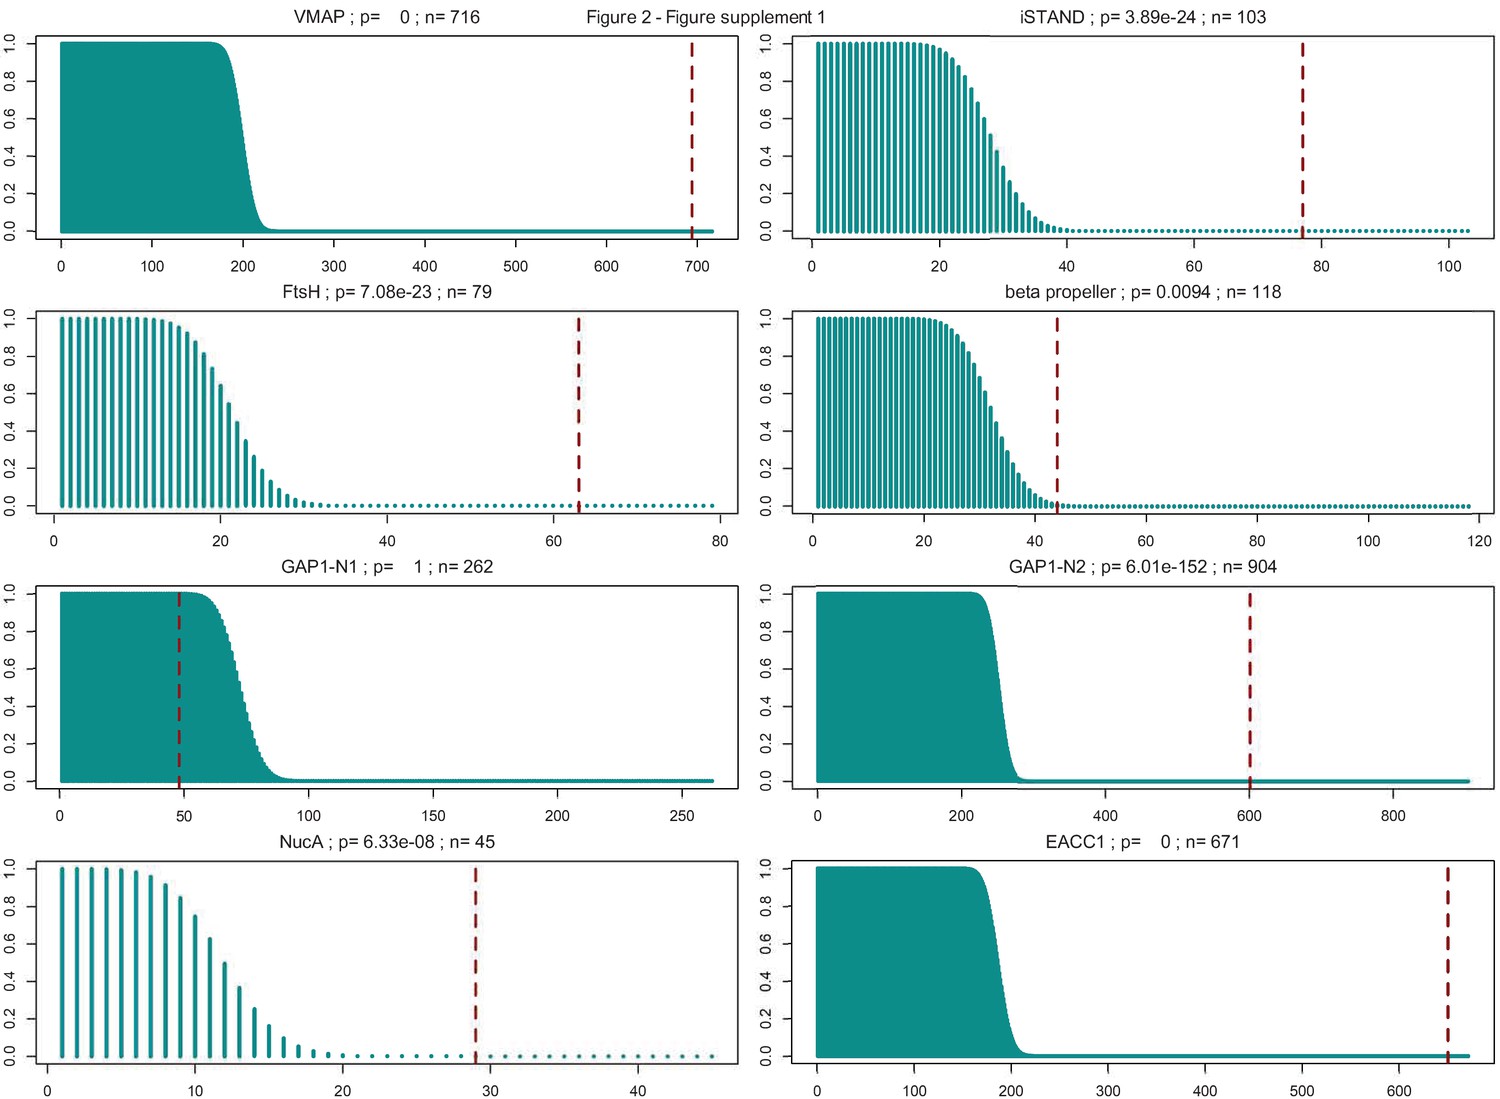
Hypergeometric distributions of the expected and observed number of multicellular prokaryotic organisms in each system type.
System type is labeled above each distribution, with p-value and total number of systems identified (n = sum of multicellular and non-multicellular systems). Dashed vertical red lines are plotted at the number of observed systems found in multicellular organisms.
Figure 3

Diversity of classical ternary systems.
(A) Evolution of the core components of the classical ternary systems across a common set of genomes. Scope of domain architectural diversity for the genomes under consideration are provided below for the vWA and VMAP-C components, linked to their respective trees by numbering (vWA) or color-coding (VMAP-C). (B) Generalized contextual diagram of the core components of the VMAP ternary system. The basic components are shown as nodes connected by arrows based on their gene neighborhood organization. The arrowhead points to the component encoded in the 3’ direction on the genome. Core conserved components are shown as red circles. Example gene neighborhoods are provided, linked to distinct subtypes of the ternary system by background coloring. Poorly-conserved genes appearing in a neighborhood are unlabeled and depicted in white boxes. Accession numbers and organism names provided as labels below each neighborhood.
Figure 4
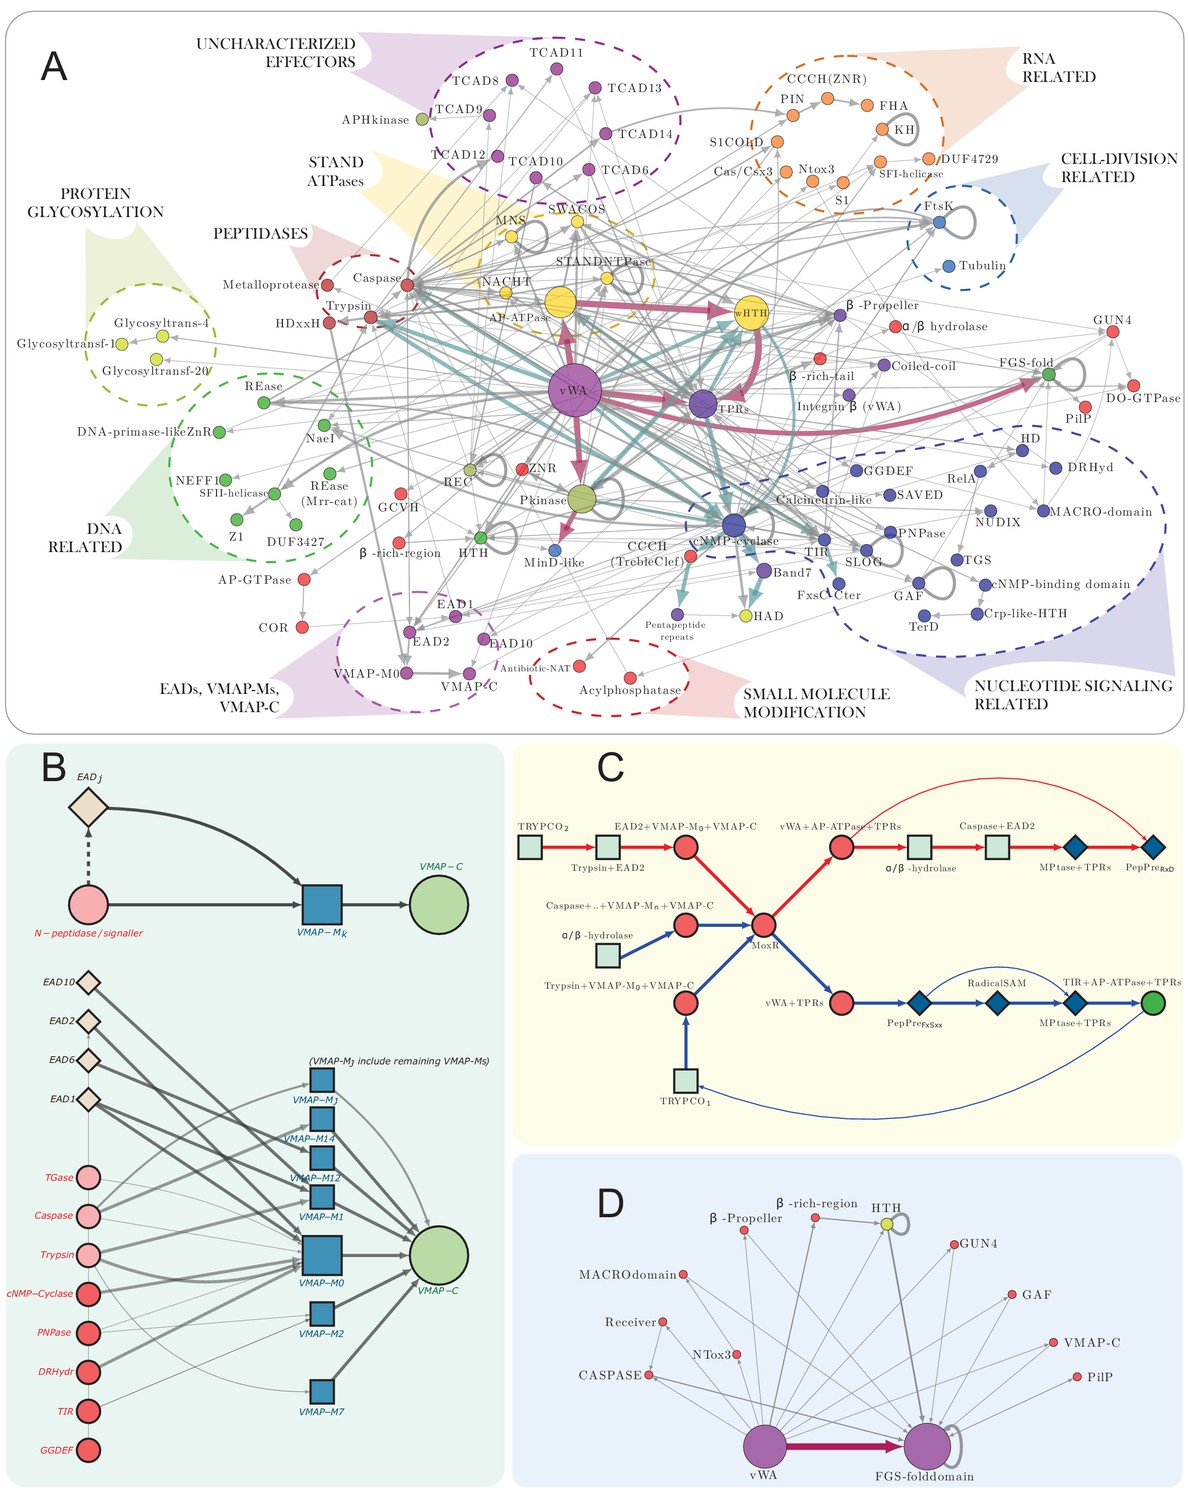
vWA architectural network and generalized classical ternary system diagrams.
(A) vWA domain architecture network of the MoxR-vWA-centric ternary systems. Domains linked in the same polypeptide are connected by arrows with the arrowhead pointing to the C-terminal domain. Node size is scaled based on the relative frequency of occurrence of the domain in the systems and edge thickness is scaled based on the relative frequency of edge occurrence. Edges with >148 occurrences are colored maroon, whereas those with >14 connections are shown in cadet blue, others are shown in grey. Functionally similar domains are identically colored as follows: blue, nucleotide-dependent signaling; purple, adaptor, superstructure-forming, and structural; dark red, peptidase; dark-green, DNA-targeting; light blue, cell division-related; yellow, apoptosis-related; orange, RNA-targeting; light green, macromolecule modification; red, miscellaneous effector. Further these have been grouped together to the extent possible and indicated on the network. (B) Generalized contextual diagram of VMAP architecture, as described in Figure 3B. (C) Detailed contextual diagram of the MoxR-vWA-centric ternary systems, depicting mutual exclusivity of components of peptide-modification accessory systems and the Trypco-trypsin and α/β hydrolase-CASPASE peptidase pairings. See 2B for convention. Arrow colors reflect the distinctness of the contexts. (D) FGS domain architectural subnetwork of the VMAP ternary systems depicting its diverse domain associations.
Figure 5
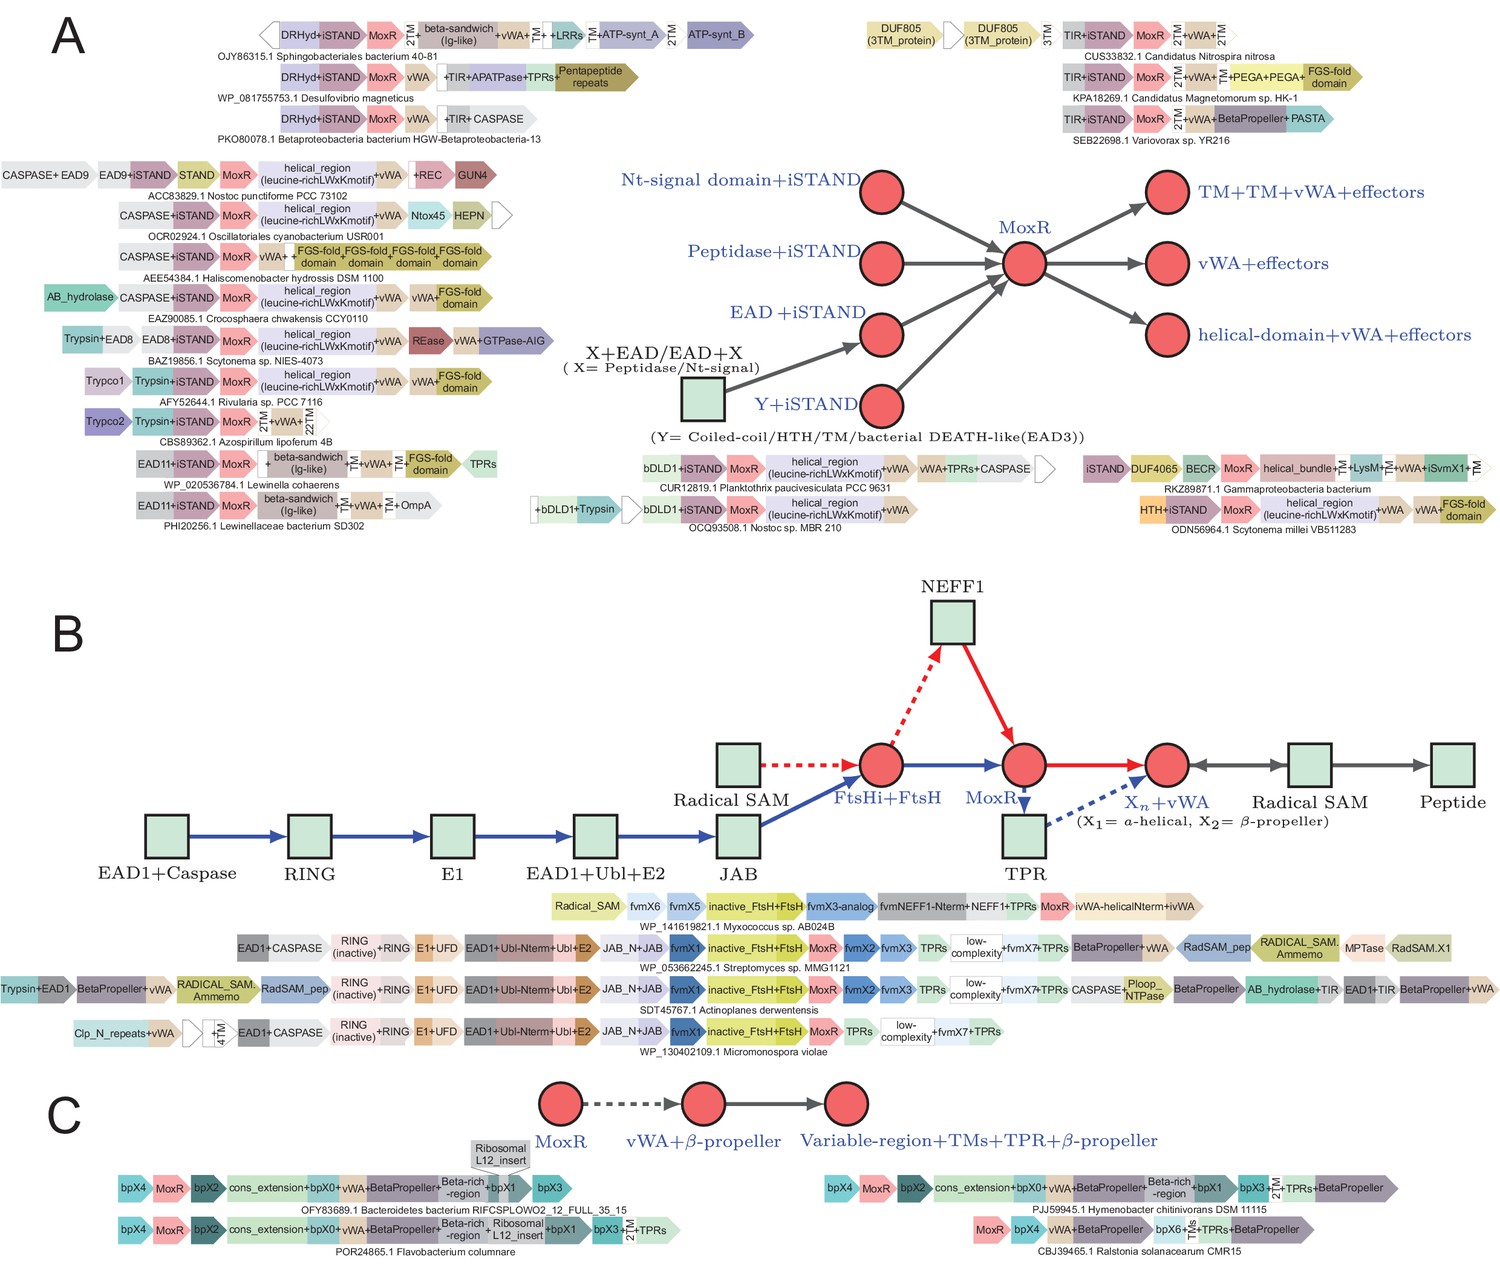
Generalized contextual diagrams and example genome contexts of other described ternary systems.
(A–C) Generalized contextual diagrams for the components of the (A) iSTAND-, (B) FtsH-, and (C) β-propeller-containing systems. Coloring and connectivity as described in previous legends. Dotted lines reflect connections that are not universally present in a contextual theme. Example gene neighborhoods provided for systems as described in legend to Figure 3B.
Figure 6

Generalized contextual diagrams and example genome contexts for the DO-GTPase systems.
(A–B) Generalized contextual diagrams for the components of the DO-GTPase (A) GAP1-N1 and (B) GAP1-N2 systems. Coloring and connectivity as described in previous legends. Arrow colors reflect distinct contextual themes. Black arrows reflect connections present in more than one contextual theme. Example gene neighborhoods provided for systems as described in legend to Figure 3B.
Figure 7
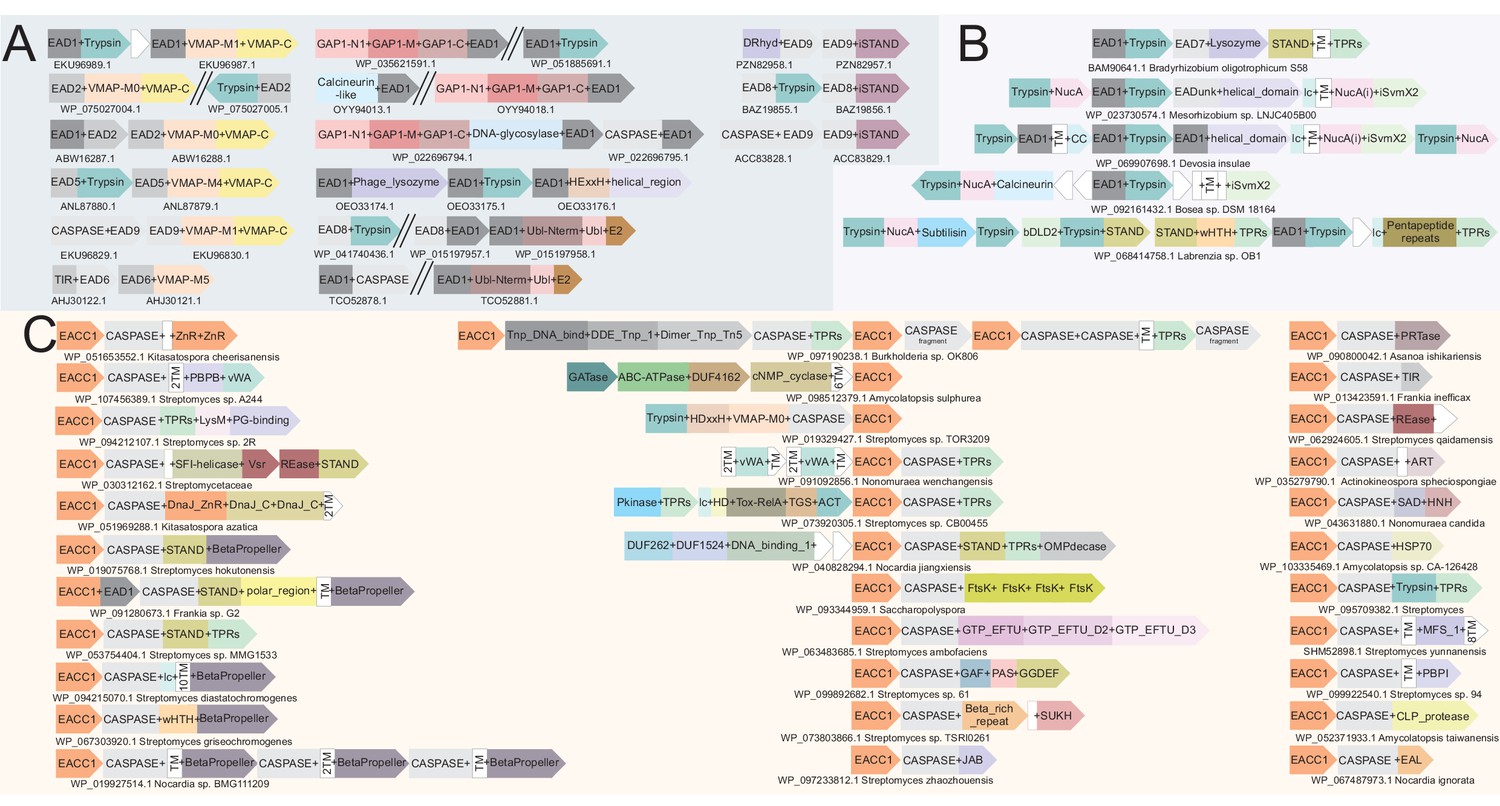
Example gene neighborhoods.
(A) Illustrating the EAD-coupling principle, (B) of the NucA-peptidase system and (C) of the EACC1 two-gene system. Coloring and design as described in Figure 3B. EACC1 domain in (C) is colored in orange across systems, underscoring the conservation of the EACC1 component relative to the diversity of the associated CASPASE domain-fused component.
Figure 8
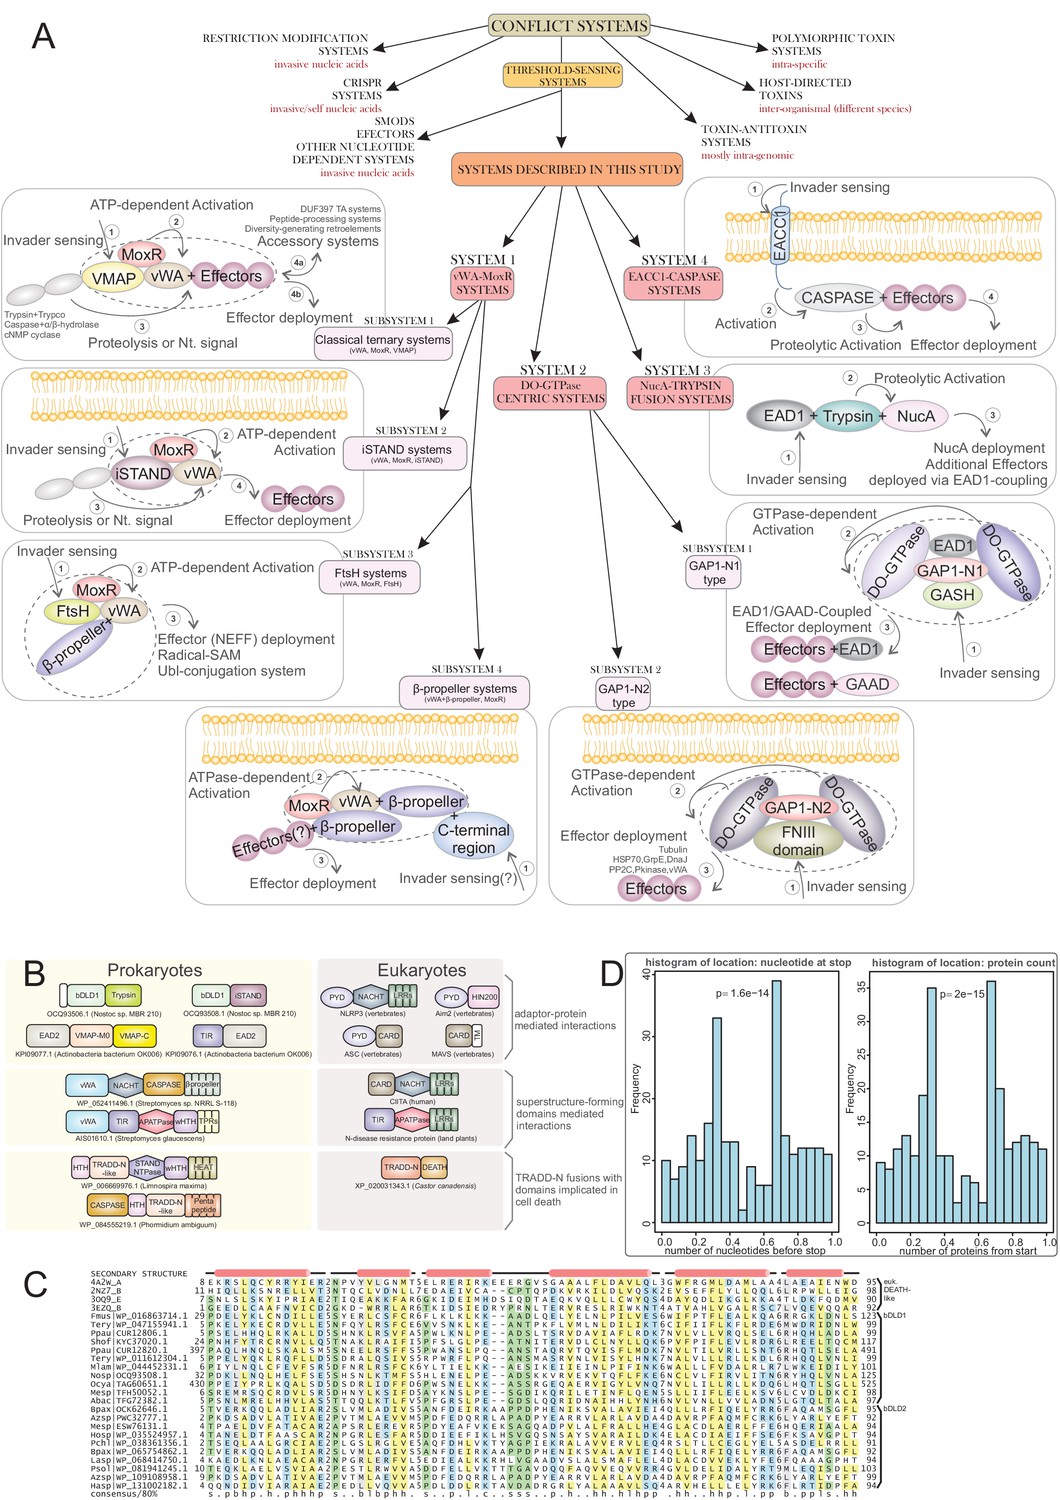
Systems categorization and connections to eukaryotic apoptotic systems.
(A) Schematic representation and categorization of the systems described here placed in the context of other categories of biological conflict system classes. The various components of the systems described in this manuscript are depicted in their respective boxes along with a plausible mechanism of action, involving invader sensing, activation, proteolysis and effector deployment. The ternary core of each sub-system is delineated. (B) Cross-superkingdom comparison of the shared ‘grammar’ and domain content across the systems described herein (left column) and those experimentally-characterized in eukaryotic apoptotic pathways (right column). (C) Multiple sequence alignment of newly-identified bacterial Death-like domain families. Top four sequences are of known animal Death superfamily structures. (D) Histograms situating the VMAP ternary systems in actinobacterial genomes according to location of vWA domain-containing gene by stop nucleotide position relative to entire normalized nucleotide length of the genome (left) and protein ordering relative to normalized total protein count in the genome (right). Displayed p-values result from comparison to distribution expected by random genome distribution, using the χ2 test.
Tables
Table 1
p-Values for association of a given system with multicellular habit.
The total number of organisms with a given system and the number of organisms which score as multicellular are also provided.
| System | total # | multicellular # | P |
|---|---|---|---|
| VMAP | 716 | 694 | 0 |
| iSTAND | 103 | 77 | 3.895e-24 |
| FtsH | 79 | 63 | 7.08e-23 |
| beta propeller | 118 | 44 | 0.0094 |
| GAP1-N1 | 262 | 48 | 0.9998 |
| GAP1-N2 | 904 | 601 | 6.006e-152 |
| NucA | 45 | 29 | 6.331e-08 |
| EACC1 | 671 | 650 | 0 |
Additional files
-
Supplementary file 1
List of multicellular status of all organisms included in analysis of significance of systems overrepresentation in multicellular prokaryotic genomes.
Multicellular flag is defined as either TRUE, FALSE, or NA (not enough information available) (see Materials and methods).
- https://cdn.elifesciences.org/articles/52696/elife-52696-supp1-v2.csv
-
Transparent reporting form
- https://cdn.elifesciences.org/articles/52696/elife-52696-transrepform-v2.docx
Download links
A two-part list of links to download the article, or parts of the article, in various formats.
Downloads (link to download the article as PDF)
Open citations (links to open the citations from this article in various online reference manager services)
Cite this article (links to download the citations from this article in formats compatible with various reference manager tools)
Highly regulated, diversifying NTP-dependent biological conflict systems with implications for the emergence of multicellularity
eLife 9:e52696.
https://doi.org/10.7554/eLife.52696


