A Toll-receptor map underlies structural brain plasticity
- Neurodevelopment Lab, School of Biosciences, University of Birmingham, United Kingdom
- Rudolf Virchow Center for Experimental Biomedicine, University of Würzburg, Germany
- Facultad de Ingeniería, Universidad de Ibagué, Colombia
- Neuroscience, University of Arizona College of Science, United States
Figures
Figure 1 with 1 supplement
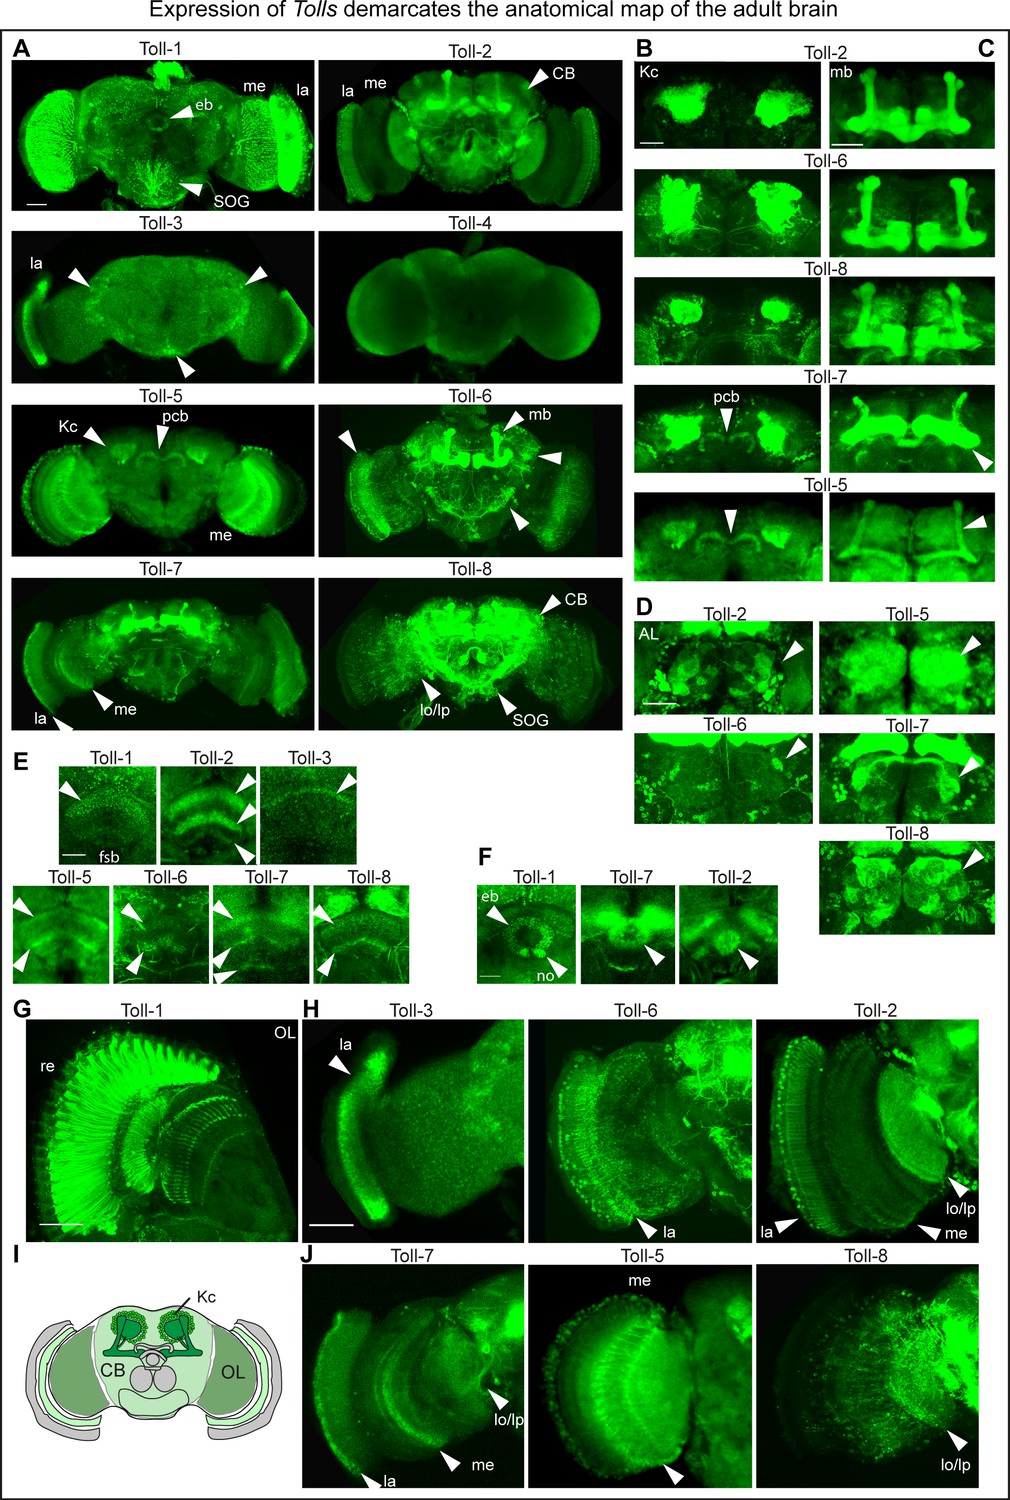
Expression of Tolls demarcates the anatomical map of the adult brain.
(A) Toll receptor expression visualised with: Anti-Toll-1 antibodies, in retinal photoreceptors; CRISPR/Cas9 generated Toll-2pTVGAL4 > FlyBow, throughout the brain; MIMIC-RMCE generated Toll-3GAL4 > tdTomato restricted to the lamina; CRISPR/Cas9 generated Toll-4GAL4 > FlyBow did not reveal any signal; CRISPR/Cas9 generated Toll-5GAL4 > FlyBow was prominent in medulla, Kenyon cells and protocerebral bridge (pb). (Unfortunately, we could not get CRISPR/Cas9 data for Toll-9). MIMIC-RMCE generated Toll-6GAL4 > tdTomato is prominent in lamina, Kenyon cells and central brain interneurons. MIMIC-RMCE generated Toll-7GAL4 > FlyBow was prominent in optic lobe and Kenyon cells. Toll-8GAL4MD806 > tdTomato was prominent in central brain and Kenyon cells. (B–G) Higher magnification views to show signal in: (B) Kenyon cells (KCs); (C) mushroom bodies (mb); (D) antennal lobes (AL); (E) fan shaped body (fsb); (F) ellipsoid body (eb); (G,H,J) optic lobes (OL). (I) Drawing illustrating the brain domains of KCs, central brain (CB) and OLs used for the functional analysis. La: lamina; me: medulla; lo: lobula; lp: lobula plate; no: noduli; pcb: protocerebral bridge. Scale bars: A,E,F,G: 25 μm; B,C,D,H,J: 50 μm. For genotypes and sample sizes see Materials and methods and Supplementary file 2. See Figure 1—figure supplement 1.
Figure 1—figure supplement 1

Most Tolls are expressed in the central nervous system.
Reverse transcription PCR (RT-PCR) carried out to detect transcripts for Tolls in whole embryos, and dissected central nervous systems (CNS) of larvae and pupae, and dissected adult brains. Control is expression from house-keeping gene GAPDH. (+) indicates RT-PCR, and (-) indicates no RT control. Toll-1, 2-, 6,–7 and −8 are abundantly expressed in the CNS, followed by Toll-5, Toll-3 is less abundant and Toll-4 and Toll-9 bands are rather faint. These are not quantitative real time qRT-PCRs.
Figure 2 with 1 supplement
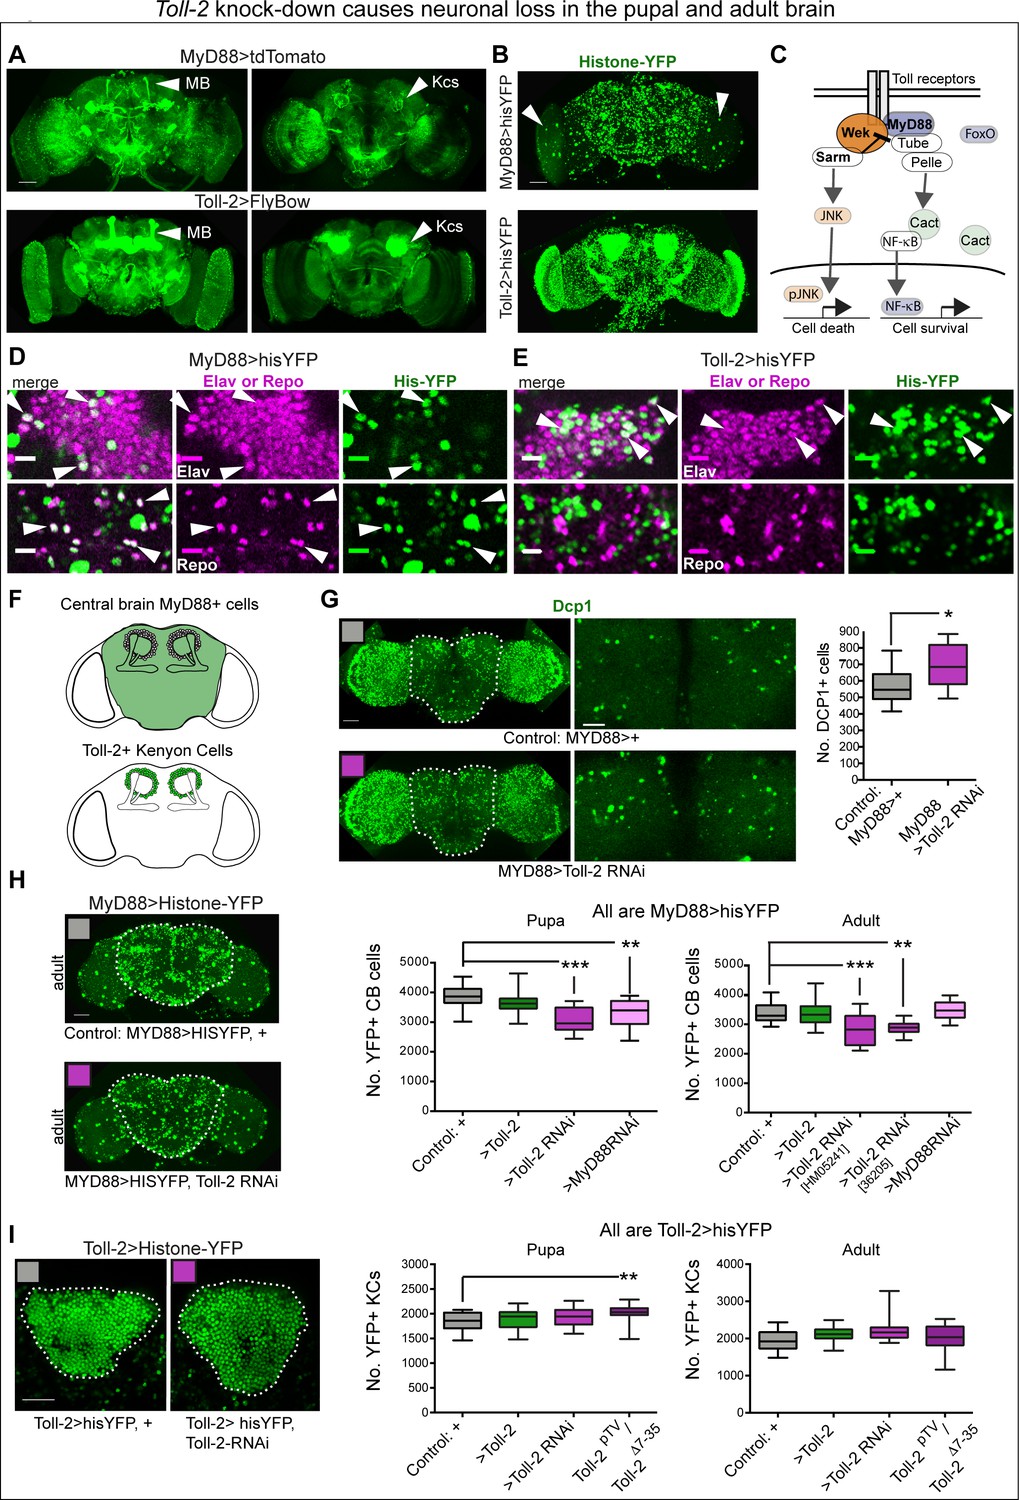
Toll-2 knock-down caused neuronal loss in the pupal and adult brain.
(A,B) Overlapping but distinct expression of Toll-2 and the adaptor MyD88, visualised with MyD88 >tdTomato, Toll-2pTVGAL4 > UASFlyBow, MyD88 >histone YFP and Toll-2pTVGAL4 > UAShistone YFP. Toll-2 is expressed in more Kenyon cells (arrowheads) than MyD88. Note the large MyD88+ cells in the optic lobes (B, arrowhead). (C) Diagram of signalling pathways downstream of Toll receptors regulating cell death and cell survival (adapted from Foldi et al., 2017). (D,E) The pan-neuronal marker anti-Elav co-localises with His-YFP in both MyD88+ and Toll-2+ cells, whereas the pan-glial marker anti-Repo only co-localises with MyD88 >His-YFP+ cells (arrowheads). (F) Drawings showing in green the central brain region of interest (ROI), and Kenyon cells (KCs), used for automatic cell counting with DeadEasy. (G) Toll-2 RNAi knock-down increased the number of anti-Dcp1+ apoptotic cells, in day one pupal central brains (dashed line indicates ROI); cells quantified automatically in the ROI in 3D throughout the stack of images, with DeadEasy software. Left: full projection; right: projection of five optical sections only (5 μm). Quantification in box-plot graph: Student t-test p=0.0295. (H) Toll-2 RNAi knock-down decreased MyD88+ cell number in pupal and adult brains, latter using two independent RNAi lines; MyD88 RNAi knock-down also decreased cell number in the pupal brain (left), but not in the adult brain (right). Dashed lines in (H) indicate central brain ROI used for automatic counting of MyD88 >hisYFP+ cells with DeadEasy Central Brain software. Box-plots: Left: One Way ANOVA p<0.001, and right p<0.0001, post-hoc Dunnett tests. (I) Neither Toll-2 over-expression nor RNAi knock-down altered KC number, in pupal nor adult brains, but Toll-2pTV/Tollp2Δ7-35 mutants had more KCs. Dashed lines in (I) indicate ROI counted automatically with DeadEasy Kenyon Cells software, box-plot graphs on right: Kruskal Wallis ANOVA, both p>0.1. Scale bars: A,B,G left,H: 50 μm; D,E: 10 μm; G right, I: 25 μm. For genotypes, sample sizes and statistical details, see Supplementary file 2. *p<0.05, **p<0.01, ***p<0.001. See Figure 2—figure supplement 1.
Figure 2—figure supplement 1
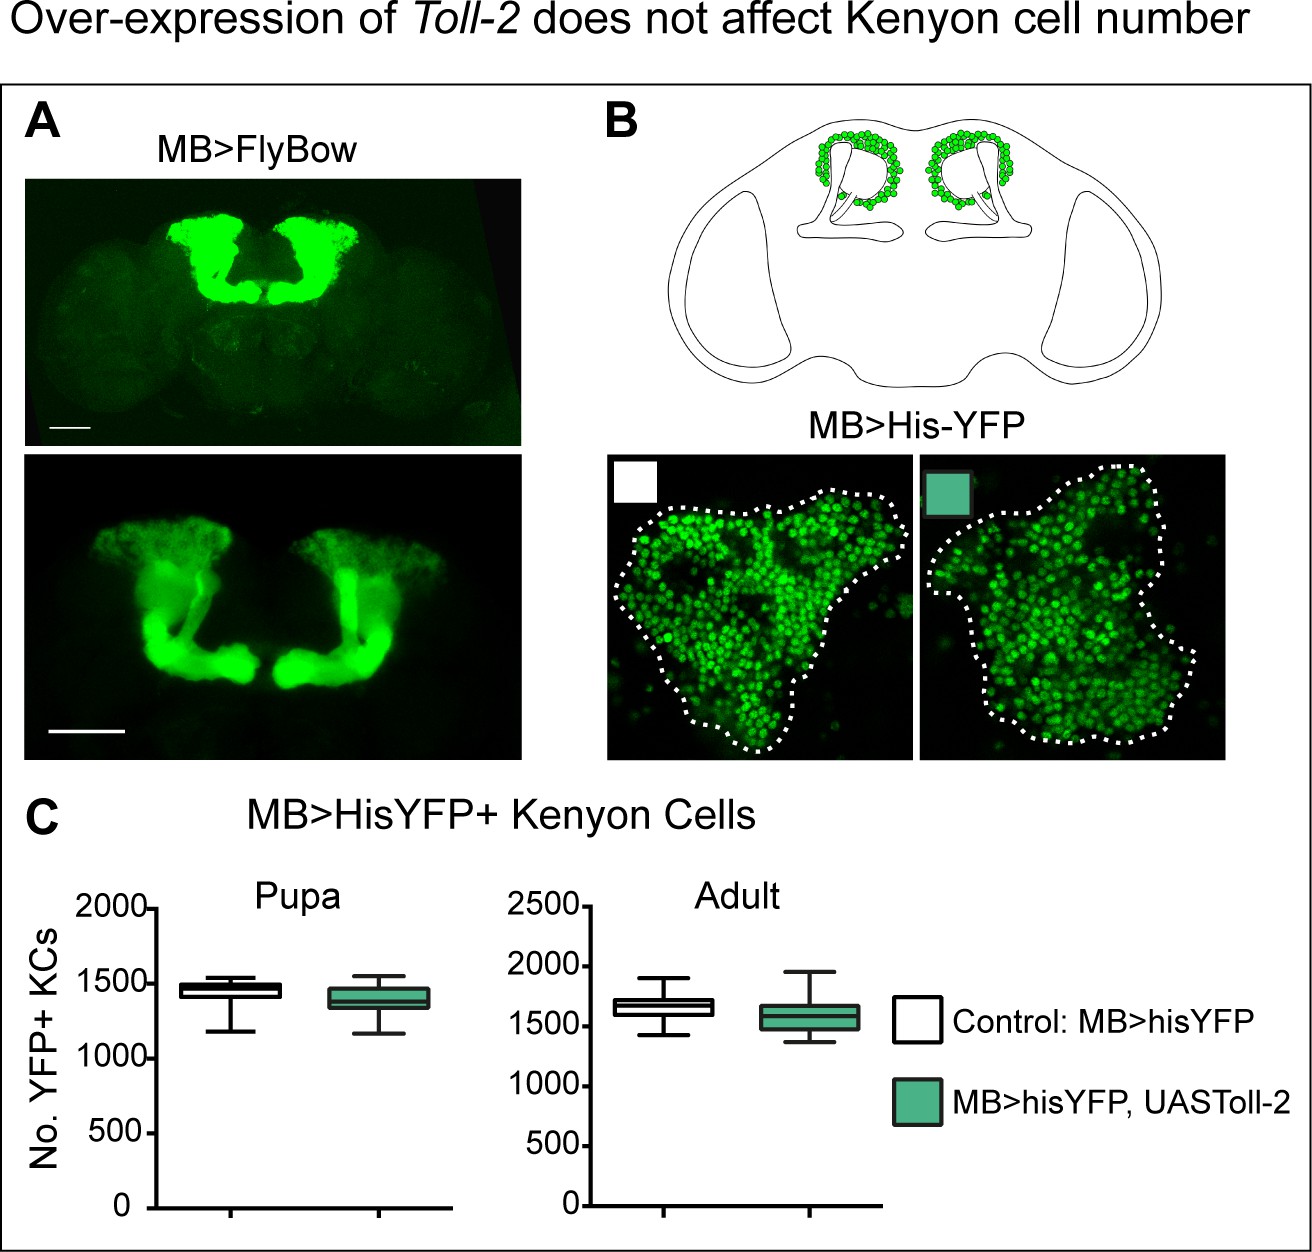
Over-expression of Toll-2 does not affect Kenyon cell number.
(A) The MBGAL4 line drives expression virtually only in Kenyon cells (MB-GAL4 >UASFlyBow). (B) The ROI indicates MBGAL4 >UAS HisYFP cells counted automatically with DeadEasy Kenyon cells software in (C). (C) Over-expression of Toll-2 with MBGAL4 does not alter KC number. For sample sizes, genotypes and statistical analysis details see Supplementary file 2.
Figure 3 with 1 supplement
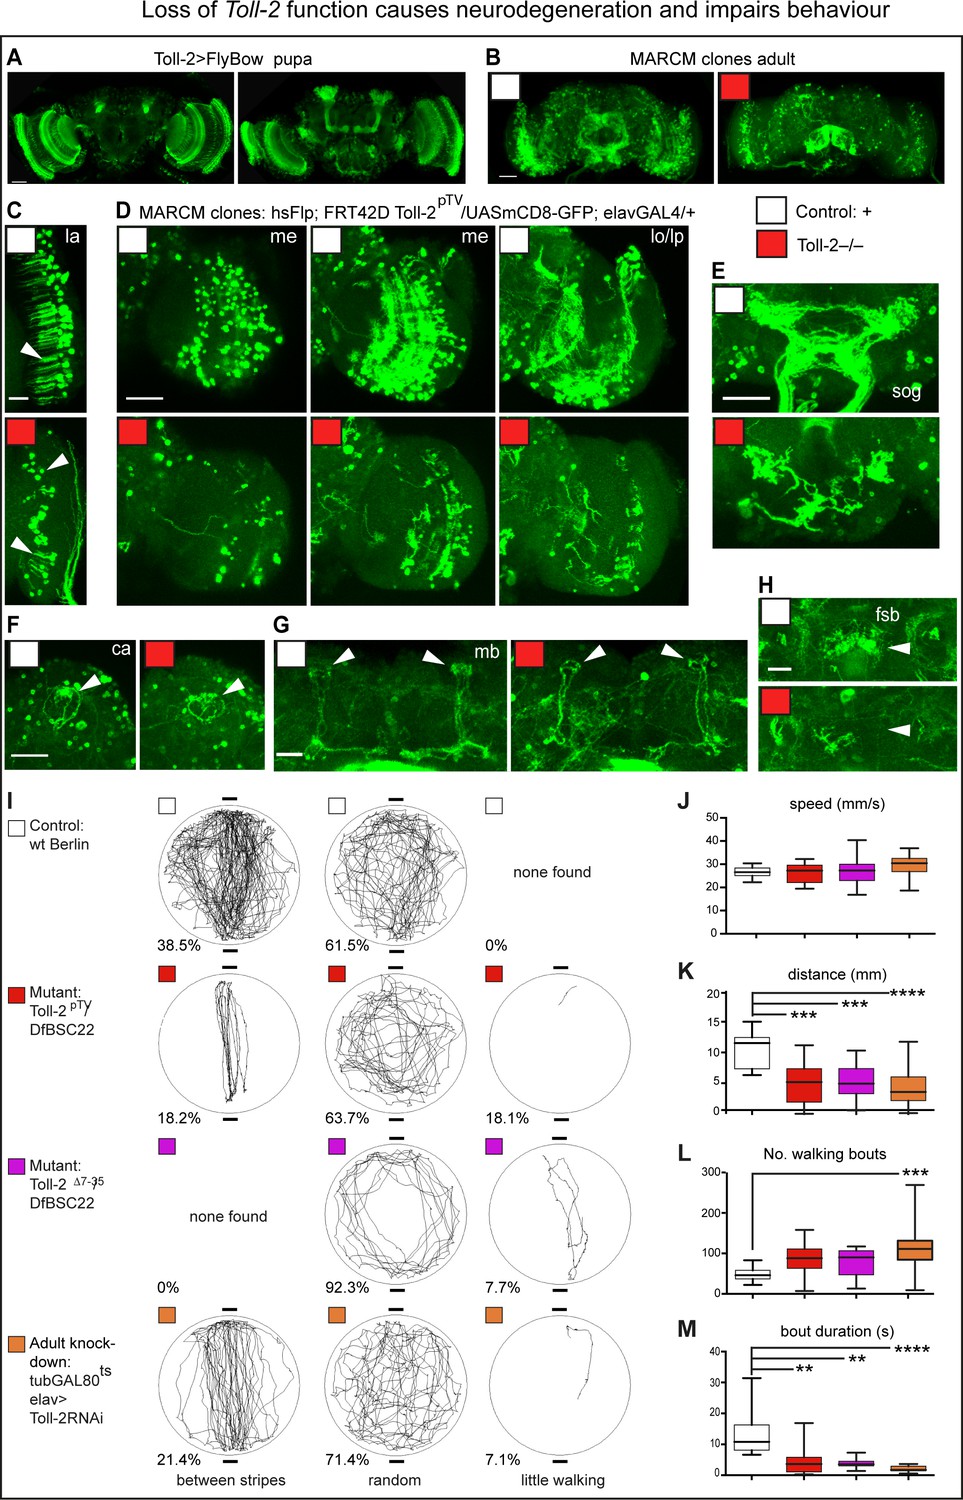
Loss of Toll-2 function caused neurodegeneration and impaired behaviour.
(A) Toll-2 is expressed in pupal brains, most prominently in optic lobes, mushroom bodies and SOG. (B–H) Toll-2pTV mutant MARCM clones - labelled with GFP - induced in pupa cause neuronal loss throughout the adult brain (genotype of clones: elavGAL4, UASmCD8GFP, hsFlp; neo FRT42D Toll-2pTV/neo FRT42D Toll-2pTV). Compare controls with Toll-2 mutant clones in: (B) whole brains; (C) loss of neurons and dendrites (arrow) in lamina (la); (D) neuronal loss, misrouted and/or aberrant axons in optic lobe; (E) loss of sub-esophageal ganglion (SOG) neuropile; (F,G) Calyx (ca) and mushroom bodies (mb) were less affected; (H) loss of fan shaped body (fsb) neuropiles. me: medulla; lo: lobula; lp: lobula plate. (I–M) Buridan arena behavioural assay revealed impaired locomotion with Toll-2pTV loss of function. (I) Representative trajectories of single flies filmed for the same amount of time, walking in a lit-up arena, with two diametrically opposed dark stripes. Phenotypes were divided into three categories – between stripes, random, little walking - and percentages indicate how many flies per genotype showed each phenotype (penetrance); no statistically significant differences were found. (J–M) Automatic measurement of locomotion parameters with purposely written software. Toll-2 mutant flies walked less than controls: they achieved equal speeds as controls, but they had more walking bouts that were brief, and thus walked shorter distances. Box-plots, quantifications: (J, K, L) One Way ANOVA: (K) p<0.0001; (L) p<0.01; (M) Kruskal-Wallis ANOVA p<0.0001; stars indicate post-hoc (J,K,L) Dunnett and (M) Dunn’s test comparisons to fixed controls. Scale bars: A,B,D,E,F: 50 μm; C,G,H: 25 μm. *p<0.05; **p<0.01; ***p<0.001; ****p<0.0001. For genotypes, sample sizes and statistical details, see Supplementary file 2. See Figure 3—figure supplement 1.
Figure 3—figure supplement 1
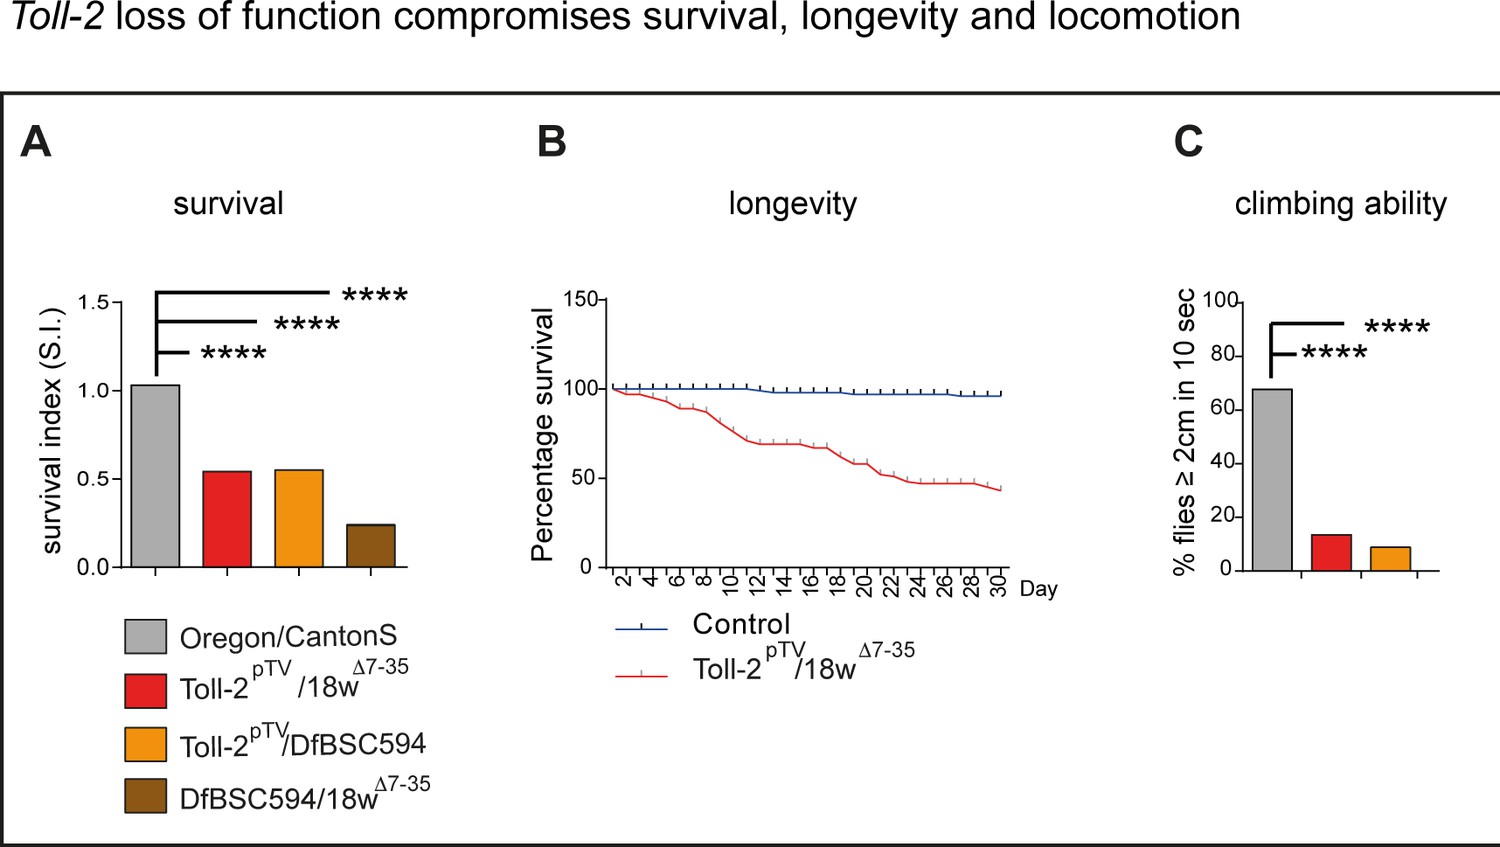
Toll-2 loss of function compromises survival, longevity and locomotion.
(A) Complementation tests show Toll-2pTV is a loss of function allele, as it causes semi-lethality over the known null Toll-2 allele 18wD7-35 and over deficiency Df(2R)BSC594 for the locus, but not as severely as 18wD7-35 in trans-heterozygosis over the deficiency. Chi Square p<0.0001, and post-hoc multiple comparisons Bonferroni correction. (B) Toll-2pTV/18wD7-35 mutants have reduced lifespan, compared to wild-type controls. (C) In the negative geotaxis assay, Toll-2 mutant flies are less able to climb up than wild-type controls. Chi Square p<0.0001, and post-hoc multiple comparisons Bonferroni correction. *p<0.05; **p<0.01; ***p<0.001; ****p<0.0001. For sample sizes, genotypes and statistical analysis details see Supplementary file 2.
Figure 4 with 1 supplement
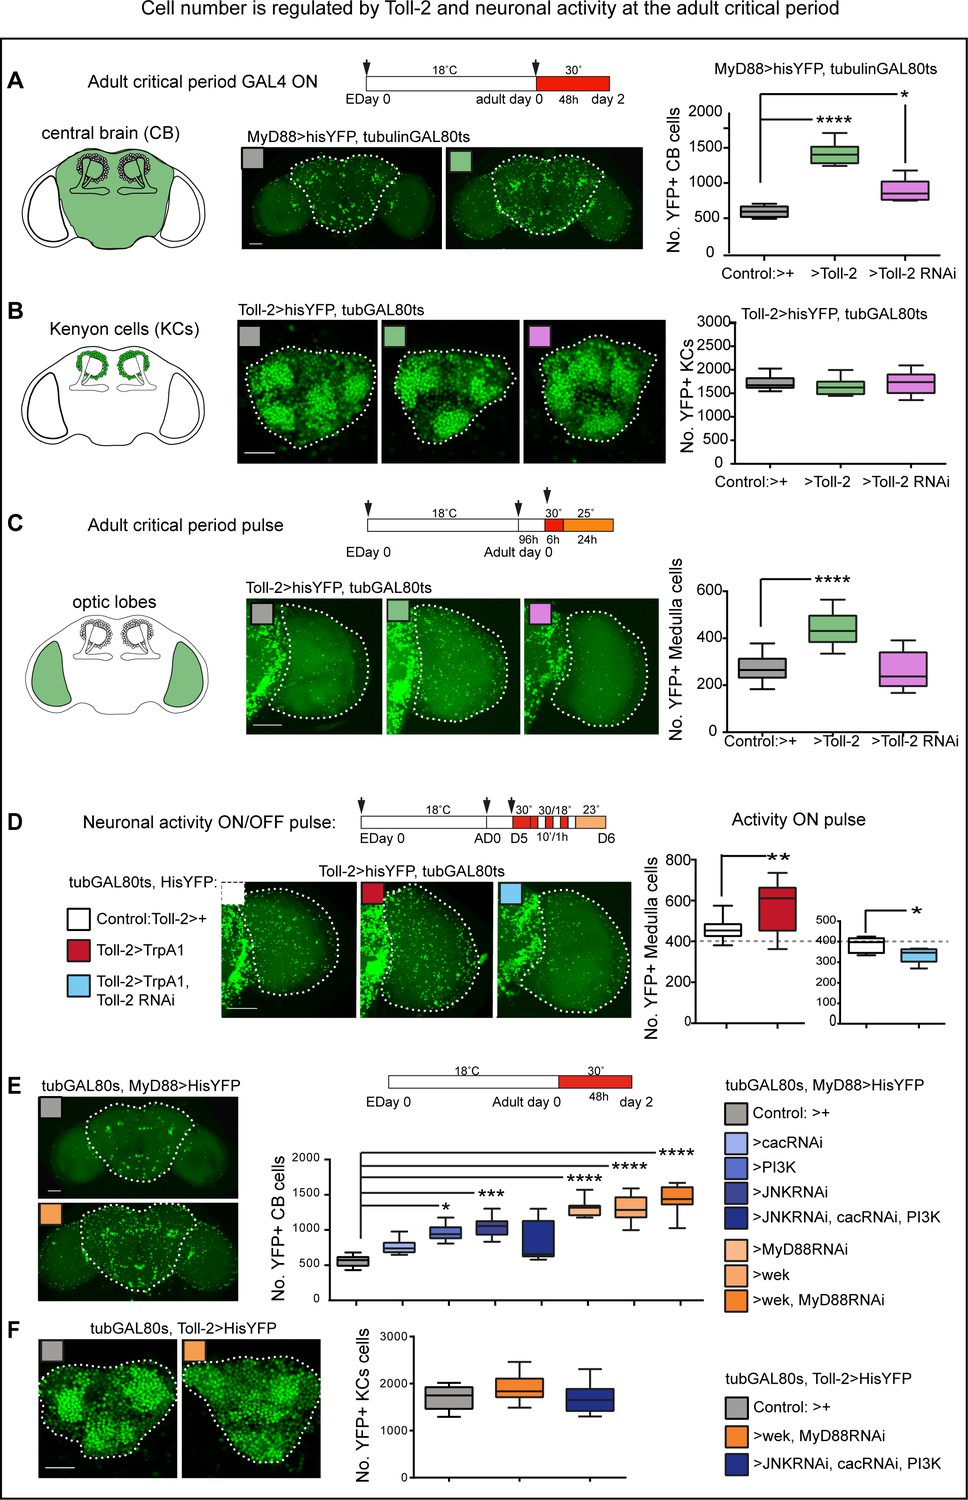
Cell number is regulated by Toll-2 and neuronal activity at the adult critical period.
At adult days 0–2 post-eclosion, within the critical period: (A) Conditional over-expression of Toll-2 increased MyD88 >hisYFP+ cell number in the central brain. Cells were counted automatically in 3D throughout the whole stack with DeadEasy Central Brain, dashed line in all figures indicates ROI quantified. Box-plots, Kruskal-Wallis p<0.0001, post-hoc Dunn test; (B) neither conditional over-expression nor knock-down of Toll-2, altered Toll-2 >hisYFP+ Kenyon cell number, counted automatically with DeadEasy Kenyon Cells, box-plots; (C) conditional over-expression of Toll-2 increased Toll-2 >hisYFP+ cell number in the optic lobe medulla, counted automatically with DeadEasy Optic Lobe. Box-plots, One Way ANOVA p<0.0001, post-hoc Dunnett; (D) pulses of neuronal activation with TrpA1 increased Toll-2 >hisYFP+ cell number in the medulla, and this could be rescued with Toll-2 RNAi knock-down. Box-plots: Left: Un-paired Student t-test, p=0.0058; Right: Un-paired Student t-test, p=0.0225. (E) Knocking-down JNK and cactus and over-expressing activated PI3K (UAS-Dp110CAAX), alone or in combination, in MyD88+ cells with tubGAL80ts, MyD88GAL4 increased cell number in the central brain, consistent with pro-survival signalling downstream of Toll-2. However, over-expressing either wek or MyD88 RNAi knock-down increased cell number in the central brain, and even further in combination, suggesting that Wek also has non-apoptotic functions that antagonise MyD88. Box-plots, Kruskal-Wallis ANOVA p<0.0001, post-hoc Dunn test. (F) By contrast, no statistically significant changes were detected in KCs upon manipulation of any of these downstream effectors, although a mild increase in cell number was observed with UAS-wek, UASMyD88RNAi. Box-plots, One Way ANOVA p=0.0354, post-hoc Dunnett. Dashed lines indicate regions of interest (ROI) for automatic cell counting with DeadEasy. Scale bars: A,C,D,E:50 μm; B,F:25 μm. For genotypes, sample sizes and statistical details, see Supplementary file 2. *p<0.05; **p<0.01; ***p<0.001; ****p<0.0001. See Figure 4—figure supplement 1.
Figure 4—figure supplement 1
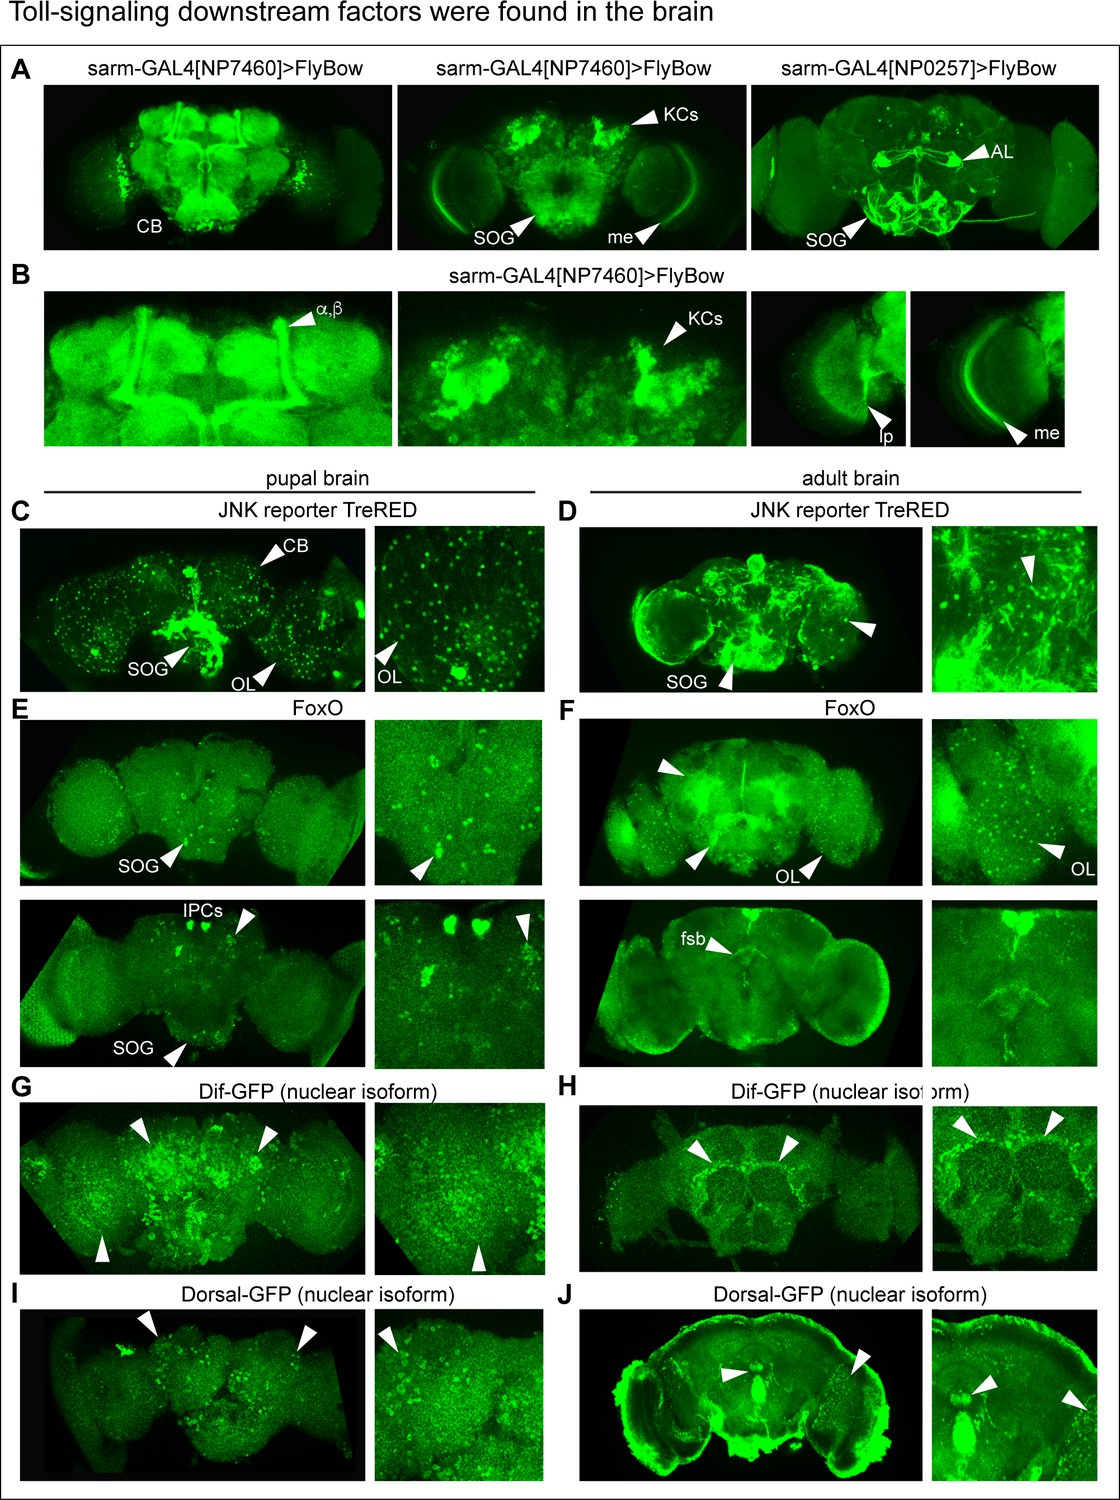
Toll-signalling downstream factors were found in the brain.
(A,B) sarm was expressed in the adult brain: line sarmGAL4NP760 drives expression of four short isoforms, and sarmGAL4NP0257 of the longest isoform, visualised with UAS-FlyBow. Note prominent expression in (arrows): central brain (CB), some Kenyon cells (KCs) and mushroom body projections along the α,β lobes, subesophageal ganglion (SOG), medulla (me) and the lobula and/or lobula plate (lp). (C,D) JNK signalling visualised with the reporter TRE-RED revealed cells throughout the pupal and adult brain; note the large cells in the optic lobes, reminiscent of the large MyD88+ and Toll-2+ cells (arrowheads). (E,F) Anti-Foxo+ cells were observed both in the pupal and adult CB and optic lobes (OL), insulin producing cells (IPCs) and fan shaped body (fsb) (arrows). Note the large cells in the optic lobes, reminiscent of the MyD88+, Toll-2+ and JNK+ cells (arrowheads). (G–J) NF-κB homologues Dif (G,H) and Dorsal (I,J) were visualised with GFP-fusion to the nuclear isoforms. Dif-GFP was abundant in both pupal (G) and adult brains particularly around antennal lobes (H), arrows). Dorsal-GFP was prominent in the pupal brain (I), and in the adult brain it was found in noduli and optic lobes (J), arrows).
Figure 5
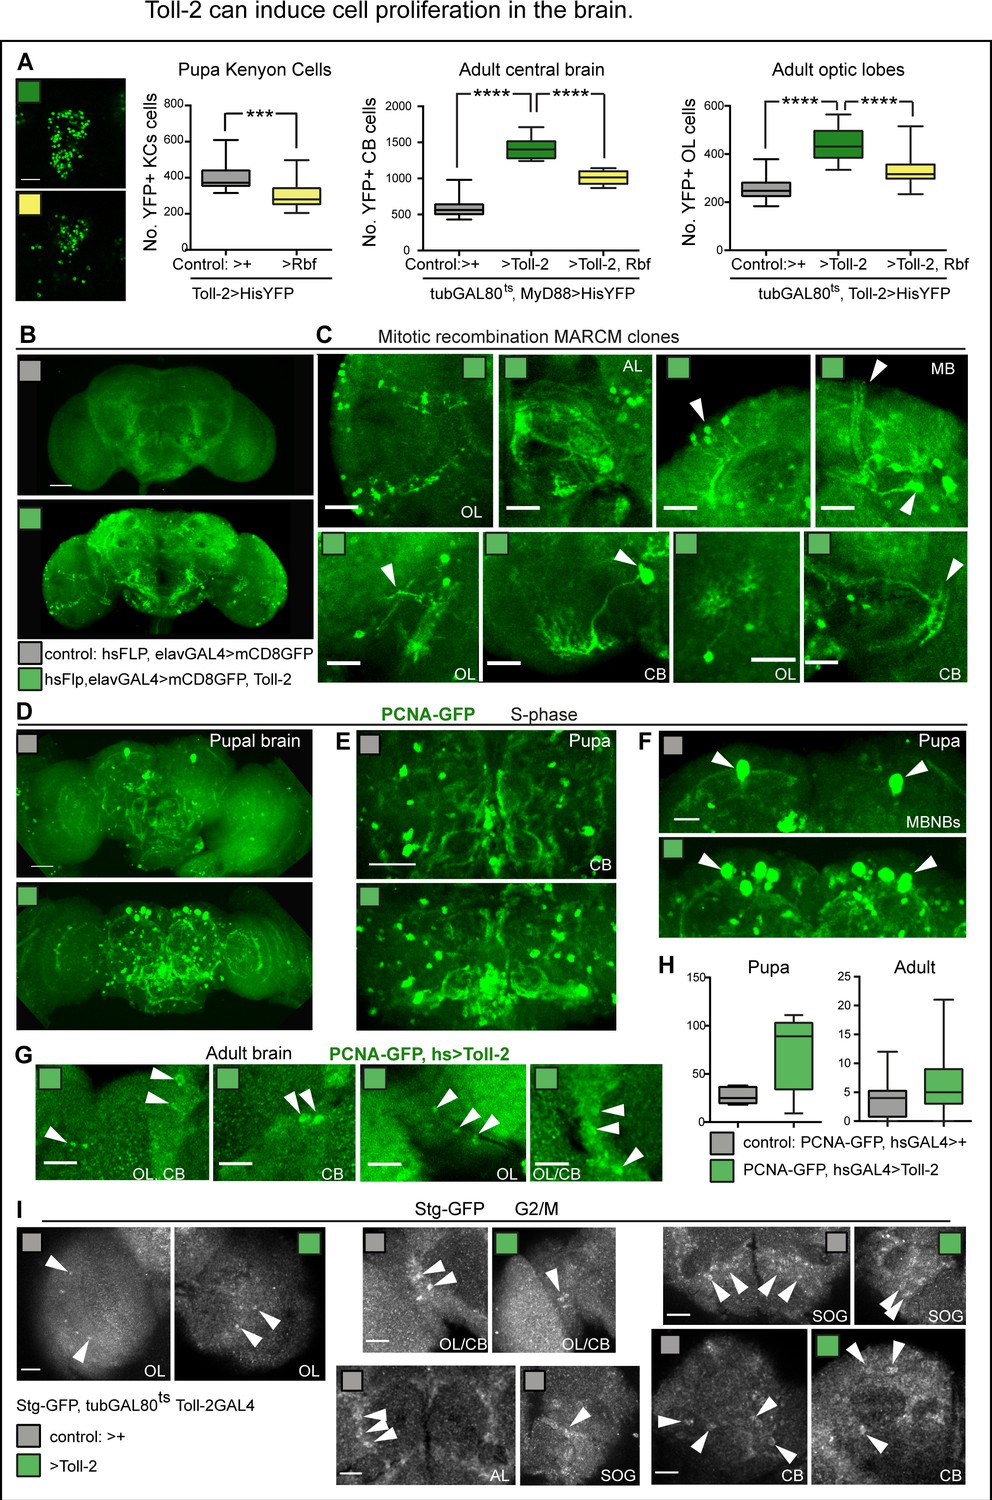
Toll-2 can induce cell proliferation in the brain.
(A) Toll-2 induces G1/S cycling. Over-expression of the G1/S inhibitor Rbf280 in Toll-2+ cells reduced Toll-2 >his-YFP+ KC cell number by day one pupa, compared to controls, meaning that Toll-2+ is required for MB neuroblast divisions. Left box-plot graph: Mann Whitney U test p=0.0004. Middle graph: Conditional over-expression of Rbf280 with tubGAL80ts, MyD88GAL4 at the adult critical period rescued the increase in cell number caused by Toll-2 gain of function, in central brain and optic lobes, meaning that Toll-2 induced cell division. Middle and right box-plot graphs: One Way ANOVA p<0.0001, and post-hoc Bonferroni multiple comparisons corrections. (B,C) Toll-2 induced cell division. Mitotic recombination MARCM clones: no clones were found in control brains (B, n = 17), whereas over-expressing Toll-2 only at the adult critical period resulted in ectopic neurons with differentiated neurites projecting in multiple brain domains (B, C n = 4/17 brains). (D–H) Toll-2 induces G1/S cycling: Conditional over-expression of Toll-2 with hsGAL4 increased the number of cells with the S-phase marker PCNA-GFP in pupal brains, compared to controls, albeit not significantly. (E,F) Note particularly more PCNA-GFP+ cells in central brain and mushroom body neuroblasts. (G) PCNA-GFP+ cells were found in adult control brains, and increased with Toll-2 gain of function. (H) Box-plots, quantification showed increases, albeit not statistically significant. (I) Stg-GFP fusion protein revealed cells in G2/M in both control brains and brains over-expressing Toll-2 (arrowheads). AL: antennal lobe; OL: optic lobe; CB: central brain; SOG: sub-esophageal ganglion. Scale bars: A,B,D,E: 50 μm; C,F,G,I: 25 μm. For sample sizes, genotypes and statistical details, see Supplementary file 2. *p<0.05; ***p<0.001; ****p<0.0001.
Figure 6
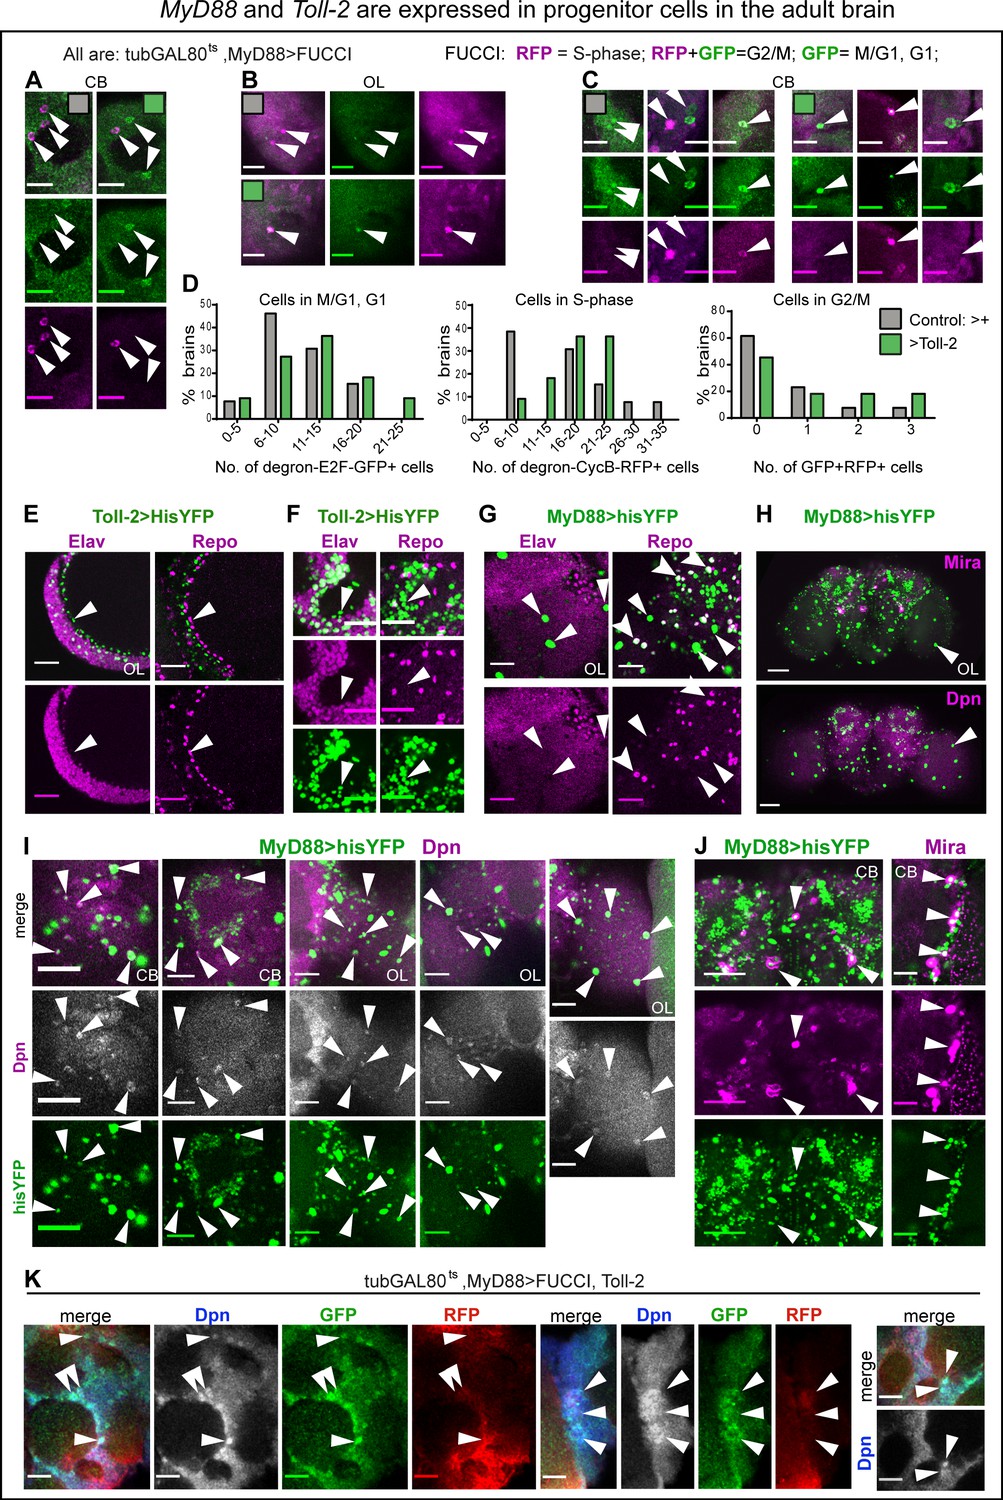
MyD88 and Toll-2 are expressed in progenitor cells in the adult brain.
(A–D, K) FUCCI expressed with tubGAL80ts, MyD88GAL4 revealed cycling cells in the adult brain. Arrows point to GFP— RFP+ cells in S-phase, GFP+RFP— cells in G1, and GFP+RFP+ cells in G2/M. (D) Quantification: histograms showing that Toll-2 over-expression increased the number of cells in G1, S- and G2/M phases of the cell cycle. (E,F) Some Toll-2pTV>hisYFP+ cells in optic lobes (E) and central brain (F) lack pan-neuronal Elav and pan-glial Repo markers (arrows), meaning they are neither neurons nor glia. (G) Some MyD88 >hisYFP+ cells lack both Repo and Elav markers (arrows), meaning they are neither neurons nor glia. Some but not all large MyD88 >hisYFP+ cells in optic lobes are Repo+. (H,I) Co-localisation of MyD88 >hisYFP with the neuroblast marker anti-Dpn, in central brain and optic lobes (arrowheads). Notice the large MyD88+ cells in optic lobes (H,I), many of which are Dpn+ (I, arrowheads). (H,J) Co-localisation of MyD88 >hisYFP with the neuroblast marker anti-Mira in central brain (arrowheads). Mira also seems to label neurons in adult brains. (K) MyD88+ progenitor cells cycle in the adult brain. Co-localisation of tubGAL80ts, MyD88 >FUCCI with anti-Dpn in adult brains over-expressing Toll-2. Some Dpn+ cells over-expressing Toll-2 were GFP+RFP+ meaning they were in G2/M, and most were GFP+RFP— meaning they were in G1, either just exited mitosis or quiescent. For genotypes, sample sizes and statistical details, see Supplementary file 2. ****p<0.0001. Scale bars: A-G, - I,K : 25 μm; H, J, : 50 μm.
Figure 7

Toll-2 regulates Yki in the adult brain.
(A–D) Nuclear translocation of a Yki-GFP fusion protein at the adult brain critical period: (A) there were many cells with nuclear Yki-GFP in the adult brain, particularly upon conditional Tolll-2 over-expression in Toll-2+ cells (tubGAL80ts, Toll-2GAL4 > Toll-2). (B) In the optic lobes, Yki-GFP+ cells resembled the large MyD88+ cells (see Figure 6H). (C) Toll-2 over-expressing brains had more Yki-GFP+ cells (arrows). SOG: sub-esophageal ganglion; CB: central brain. Images show (B) medulla and (C) anterior CB and SOG ROIs used for cell counting. (D) Quantification: histograms showing that Toll-2 over-expression changed the distribution to a bimodal profile in medulla as some brains had fewer Yki-GFP+ cells and some had more, and increased cell number in the SOG and CB, meaning that Toll-2 induced cell cycling and shuttling of Yki-GFP. (E,E’) The increase in MyD88 >hisYFP+ cell number in the central brain caused by Toll-2 over-expression was rescued with yki RNAi knock-down. Box-plots, One Way ANOVA p<0.0001, and post-hoc Bonferroni test. (F) The increase in MyD88 >hisYFP+ cell number in the central brain caused by Toll-2 over-expression was rescued with wek RNAi knock-down. Box-plots, One Way ANOVA p<0.0001, and post-hoc Bonferroni test. (G) Diagram illustrating that Toll-2 can prevent progenitor cycling via MyD88, and activate it via Wek and Yki. Scale bar in (A,B,C,E): 50 μ.*p<0.05, **p<0.01, ***p<0.001, ****p<0.0001. For all genotypes, sample sizes and statistical details, see Supplementary file 2.
Figure 8 with 1 supplement
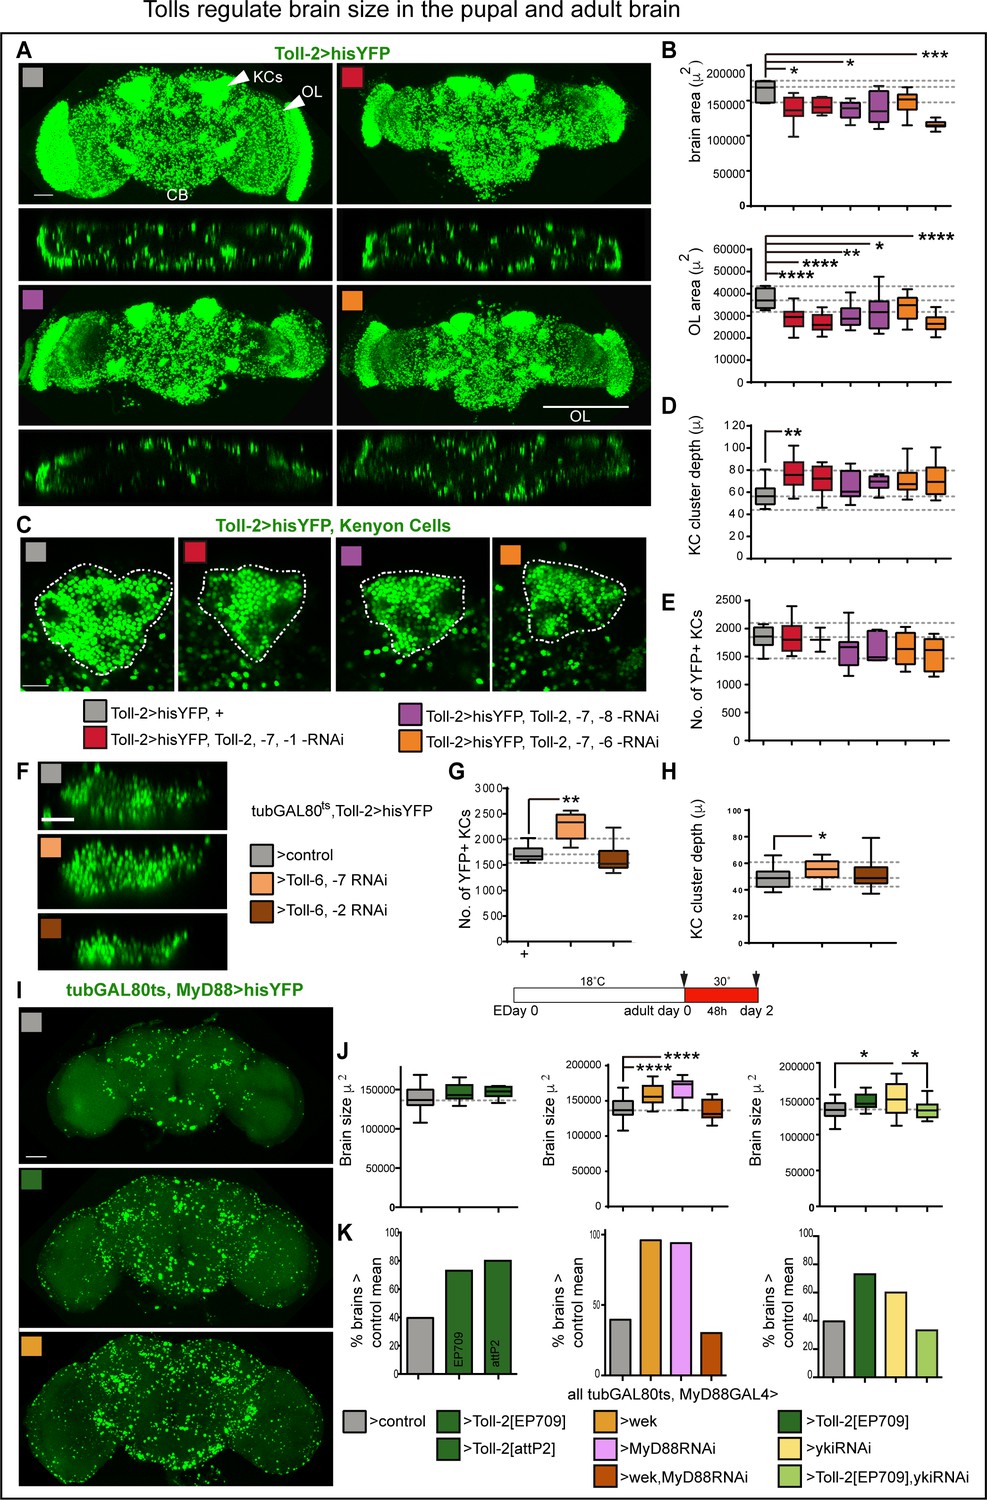
Tolls regulate brain size in the pupal and adult brain.
(A,B) Constant RNAi knock-down of three Tolls with Toll-2GAL4 resulted in smaller brains. Optic lobes were smaller than in controls, and so were central brains (Figure 8—figure supplement 1A). (B) Brain area box-plots: both are One Wat ANOVA p<0.01, post-hoc Dunnett test comparisons to control. (C,D) In the triple Toll RNAi knock-out, Kenyon cell clusters were disorganized, with smaller area (Figure 8—figure supplement 1B) whilst deeper along the A/P axis, and (E) had fewer cells (albeit not significantly). (D) Box-plots, Kruskal-Wallis ANOVA, p=0.0127, post-hoc Dunn. (F–H) Conditional knock-down of two Tolls with tubGAL80ts, Toll-2GAL4 at the adult critical period disorganized Kenyon cell clusters and altered Kenyon cell number: Toll-2,–6 RNAi reduced cell number, whereas Toll-6 ,–7 RNAi increased KC depth and cell number. (G) Box-plots, Kruskal Wallis ANOVA p<0.0001, post-doc Dunn. (H) Box-plots, One Way ANOVA p=0.0567, post-hoc Dunnett. (I–K) Conditional alteration of Toll-2 function with tubGAL80ts, MyD88GAL4 at the adult critical period (day 0–2) increased brain size: (J) Left: over-expression of Toll-2 increased brain size, using two different UAS-Toll-2 lines: EP709 (2nd chromosome) and an insertion into attP2 (3rd chromosome). Middle: both over-expression of wek and MyD88 RNAi increased brain size, but over-expression of both did not, possibly because this genotype can also induce cell death. Right: over-expression of yki-RNAi alone resulted in a variable phenotype, but rescued the increase in brain size caused by Toll-2 over-expression. Box-plots, dashed lines indicate median of controls: left, One Way ANOVA, p=0.0793, not significant; centre, Kruskal Wallis ANOVA p<0.0001, post-hoc Dunn; right, One Way ANOVA p<0.05, post-hoc Tukey. (K) Mean increases in brain size ranged from 5.4% to 20% compared to controls, but most remarkably there was a persistent increase in the percentage of brains larger than the control mean of 138,585μ2 upon MyD88 RNAi knock-down, over-expression of Toll-2 or wek. yki RNAi knockdown fully rescued the Toll-2 gain of function phenotype. Scale bar in (A,I): 50 μ; (C,F): 25 μ.*p<0.05, **p<0.01, ***p<0.001, ****p<0.0001. Two different RNAi lines were used for each Toll. (B,D,E,G,H) Dashed lines indicate median, maximum and minimum values in controls. For genotypes, sample sizes and statistical details, see Supplementary file 2. See Figure 8—figure supplement 1.
Figure 8—figure supplement 1
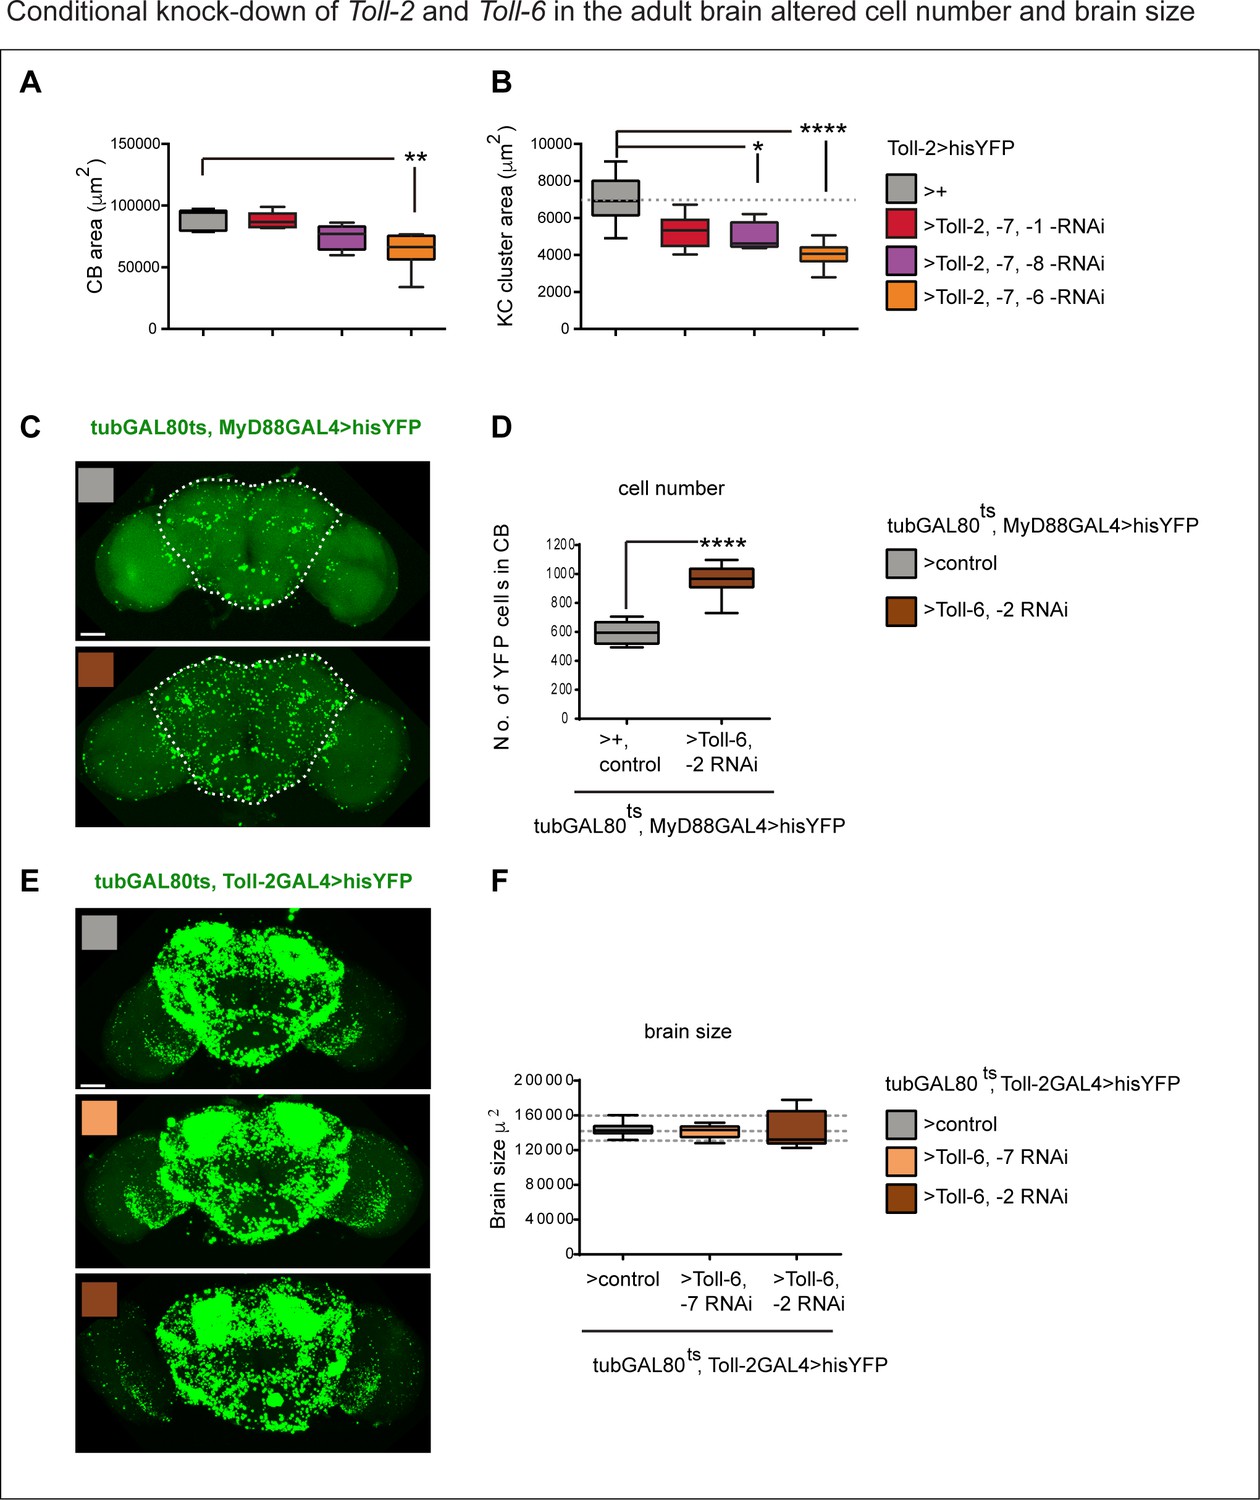
Conditional knock-down of Toll-2 and −6 in the adult brain altered cell number and brain size.
(A) Triple Toll RNAi knock-down with Toll-2GAL4 reduced central brain area, meaning it affects the central brain as well as the optic lobes shown in Figure 8A,B (images shown in Figure 8A). Box-plots, One Way ANOVA p<0.01, post-hoc Dunnett test. (B) Triple Toll RNAi knock-down with Toll-2GAL4 reduced Kenyon Cell cluster area (images shown in Figure 8C). As Toll-2 alone did not affect KCs, this shows that Tolls have redundant functions in KCs. Box-plots, Kruskal Wallis ANOVA p<0.0001, post-hoc Dunn test. (C,D) Conditional double Toll-2, Toll-6 RNAi knock-down with tubGAL80ts, MyD88 >hisYFP increased cell number in the central brain. (D) Box-plots, quantification with DeadEasy Central Brain: Student t-test: p<0.0001. Scale bar: 50μ. (E,F) Knock-down of Toll-6, Toll-7 with tubGAL80ts, Toll-2GAL4 > hisYFP at the adult critical period did not alter brain size, but Toll-2, Toll-6 knockdown did. With Toll-2 >Toll-2,Toll-6 RNAi, most brains were smaller than control brains, but 25% of brains were bigger. This shows loss of function for multiple Tolls in the adult critical period alters brain structure. The variable penetrance indicates complex compensatory interactions between Tolls through their various potential functions. (F) Box-plots, no statistically significant differences. Scale bar: 50μ. ****p<0.0001. For statistical details, see Supplementary file 2.
Figure 9
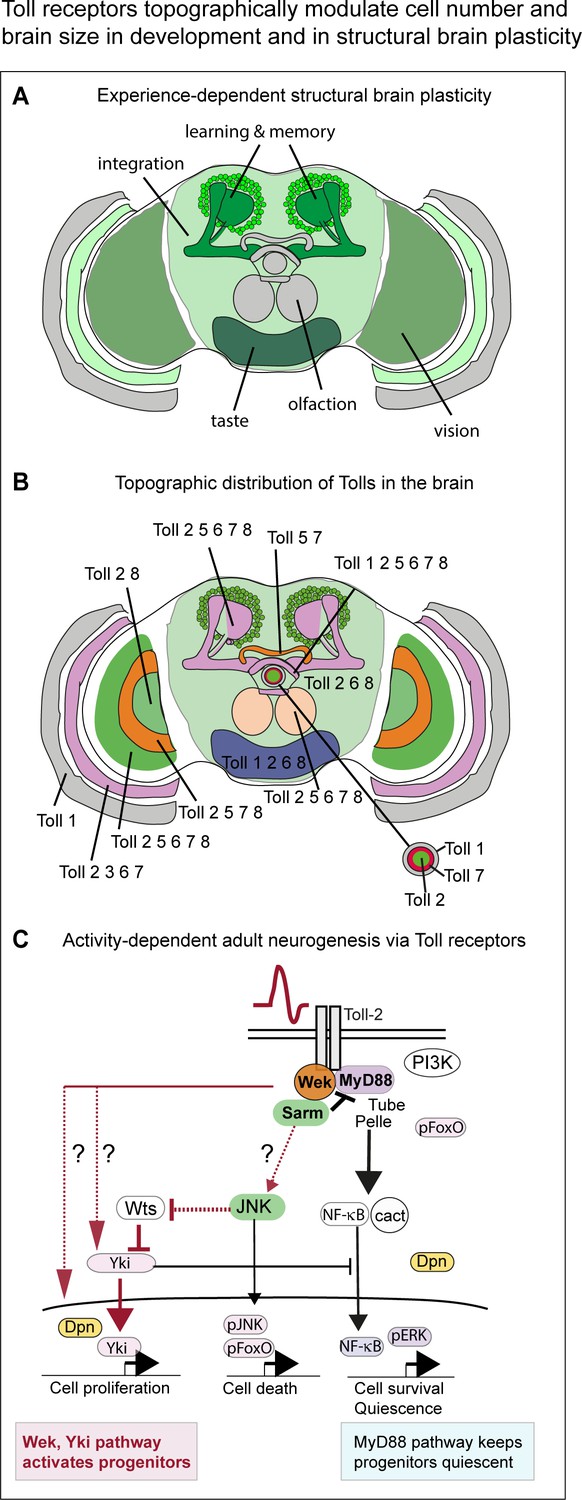
Toll receptors topographically modulate experience-dependent structural brain plasticity.
(A) Experience – that is stimulation through vision - alters the size of multiple brain domains, including optic lobes (for vision), central brain (integration, equivalent to mammalian cortex) and Kenyon cells (learning and memory). (B) Topographic distribution of Tolls in the brain reveals: (1) a map of Toll expression profiles coincident with anatomical brain domains; (2) profiles specific to each Toll; (3) complementary patterns in neuropiles of the visual system and central complex (fan shaped body, ellipsoid body); (4) overlapping distributions in optic lobes, protocerebral bridge, Kenyon cells and mushroom bodies. Each brain module and neuropile expresses a different Toll or combination of Tolls, which can potentially regulate each region differentially in development and in the adult brain. (C) Activity-dependent adult neurogenesis via Toll receptors. Neuronal activation at the adult critical period increased cell number through a Toll-2-dependent mechanism. Toll receptors can signal via MyD88 or Wek in the adult brain. Via MyD88, they maintain adult progenitor cells quiescent, and thus repress cell proliferation. Via Wek, they promote progenitor cell cycling and proliferation, which also requires Yki. How Wek relates to Yki has not been solved (question marks indicate conceivable alternatives). Conditional over-expression of wek restricted to the adult critical period increases brain size. Thus, Tolls can promote cell proliferation in the adult brain through a novel mechanism involving Wek and Yki, that antagonizes the function of MyD88 in promoting quiescence.
Additional files
-
Supplementary file 1
Key Resources Table.
- https://cdn.elifesciences.org/articles/52743/elife-52743-supp1-v2.docx
-
Supplementary file 2
Genotypes, samples size and statistical analysis.
All details of the quantitative analyses including: genotypes, sample sizes, statistical tests carried out: normality tests, parametric and non-parametric tests for two or more samples, test results and p-value for whole data sets, and multiple comparison post-hoc correction tests and their p-values.
- https://cdn.elifesciences.org/articles/52743/elife-52743-supp2-v2.xlsx
-
Supplementary file 3
List of primers.
Primers used for all cloning and RT-PCR experiments.
- https://cdn.elifesciences.org/articles/52743/elife-52743-supp3-v2.docx
-
Transparent reporting form
- https://cdn.elifesciences.org/articles/52743/elife-52743-transrepform-v2.docx
Download links
A two-part list of links to download the article, or parts of the article, in various formats.
Downloads (link to download the article as PDF)
Open citations (links to open the citations from this article in various online reference manager services)
Cite this article (links to download the citations from this article in formats compatible with various reference manager tools)
A Toll-receptor map underlies structural brain plasticity
eLife 9:e52743.
https://doi.org/10.7554/eLife.52743


