Phrenic-specific transcriptional programs shape respiratory motor output
- Case Western Reserve University School of Medicine, United States
- Max Delbrück Center for Molecular Medicine in the Helmholtz Association (MDC), Germany
- Centre de Recherche sur le Cancer de l'Université Laval, Centre de recherche du CHU de Québec-Université Laval (Oncology), Canada
Figures
Figure 1 with 2 supplements
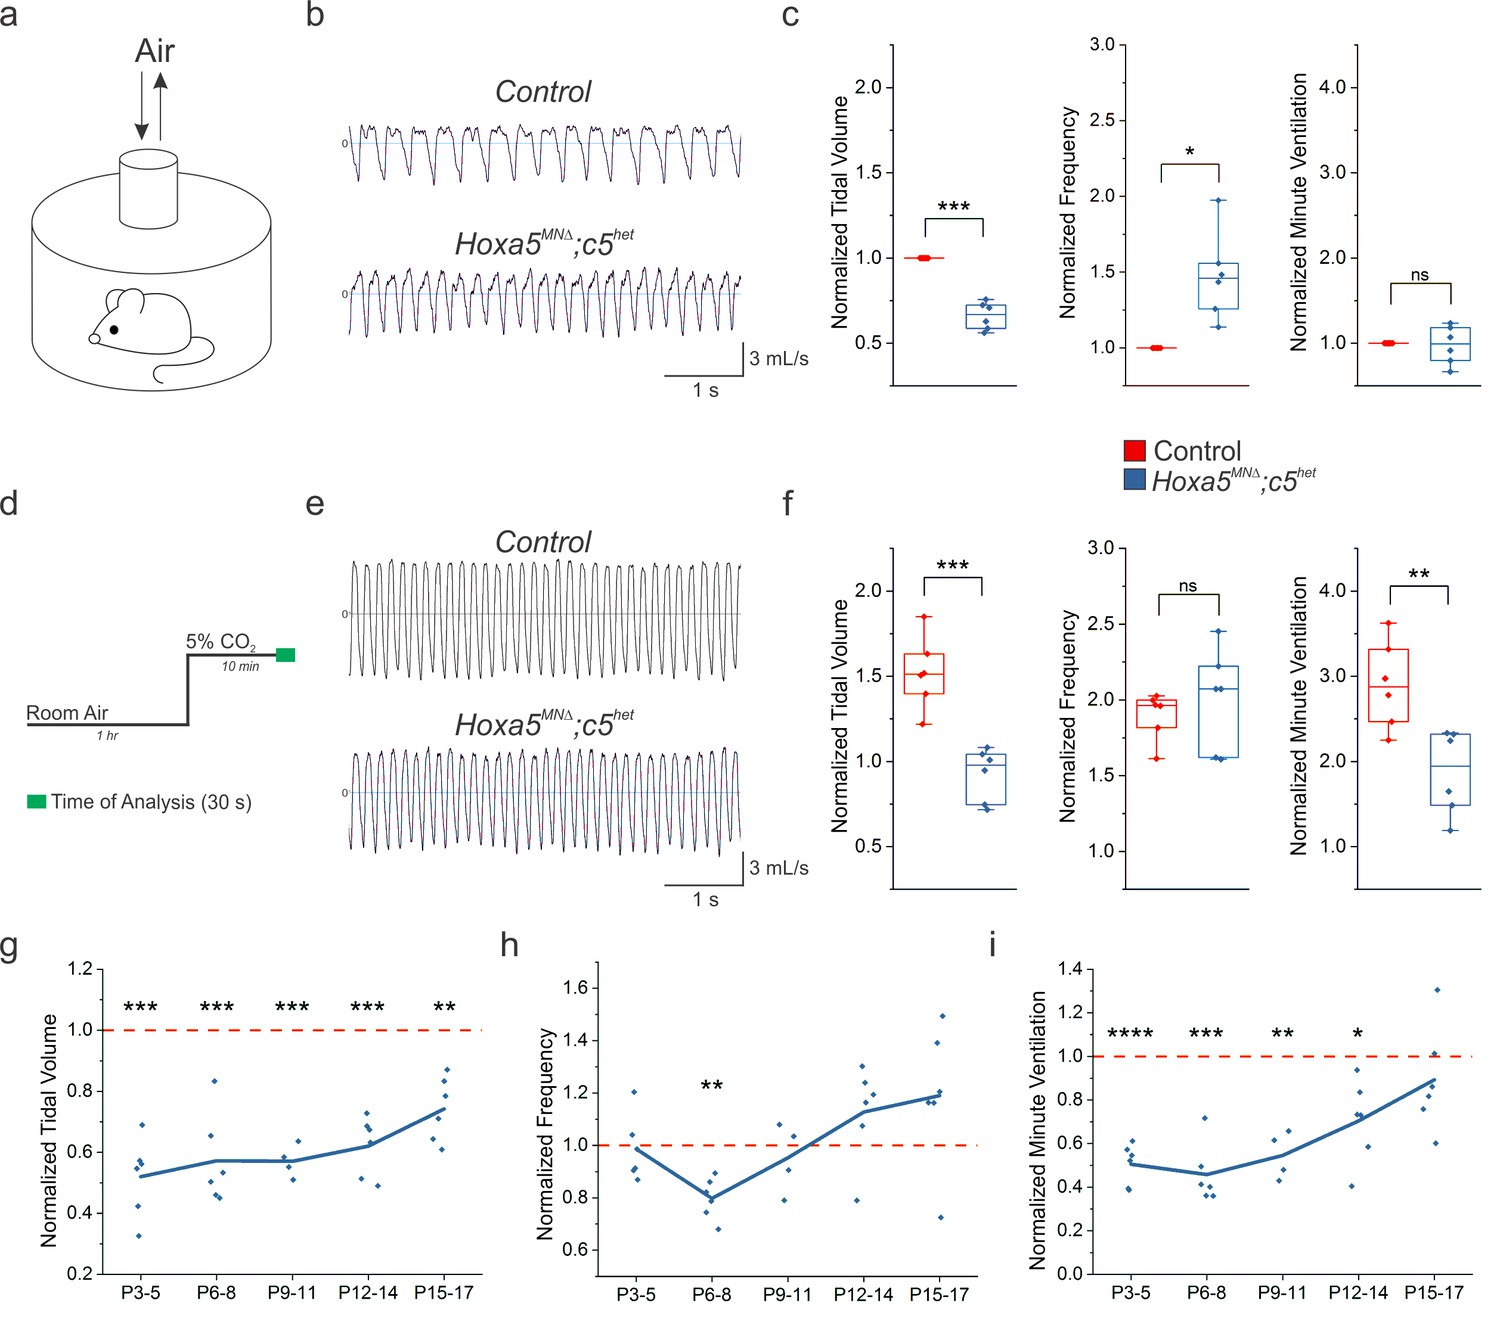
Hox5 genes are required for proper respiratory behavior throughout life.
(a) Experimental setup for unrestrained whole body plethysmography experiments. (b) Example respiratory traces in room air from adult (P80) control and Hoxa5MNΔ; c5het mice. (c) Hoxa5MNΔ; c5het mice breathe shallow (decreased tidal volume), fast (increased frequency) breaths in room air, but maintain overall ventilation (n = 6 for each genotype). (d) Time course for 5% CO2 exposure experiments. (e) Example respiratory traces in 5% CO2 from adult (P80) control and Hoxa5MNΔ; c5het mice. (f) Control mice increase the depth and frequency of breathing in response to 5% CO2, but in Hoxa5MNΔ; c5het mice the tidal volume increase is blunted and overall ventilation is decreased. (g–i) Temporal analysis of neonatal respiration. Tidal volume in room air is decreased at all neonatal ages (P3–P17) in Hoxa5MNΔ; c5het mice, but the compensatory increase in frequency does not develop until approximately P16. Therefore, Hoxa5MNΔ; c5het mice have severe respiratory insufficiency even in room air for the first two weeks of life (n = 4 for each genotype at P9-11, all other timepoints n = 6). See also Figure 1—figure supplements 1 and 2.
Figure 1—figure supplement 1
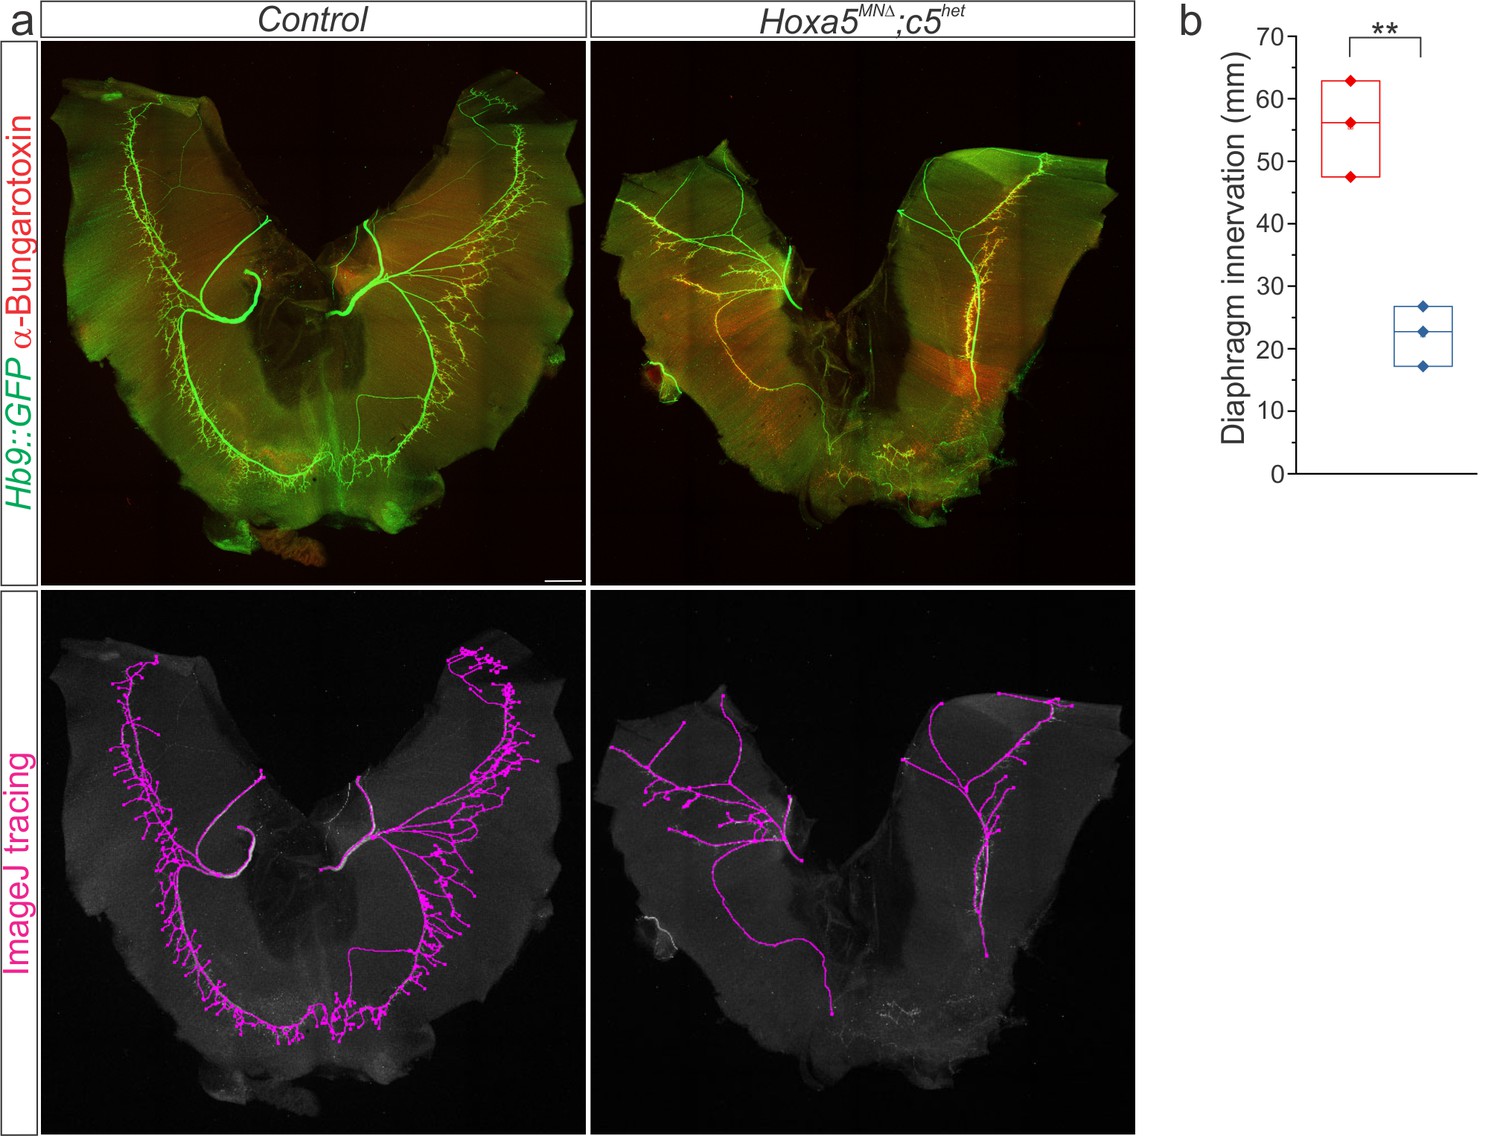
Hox5 genes control diaphragm innervation.
(a) Hoxa5MNΔ; c5het mice display a 60% loss of diaphragm motor innervation at e18.5 but survive to adulthood. Motor axons are labelled in green (Hb9::GFP) and neuromuscular junctions in red (α-bungarotoxin). Phrenic projections were traced and quantified in ImageJ. (b) Quantification of diaphragm innervation in Hoxa5MNΔ; c5het mice. Scale bar = 250 μm.
Figure 1—figure supplement 2
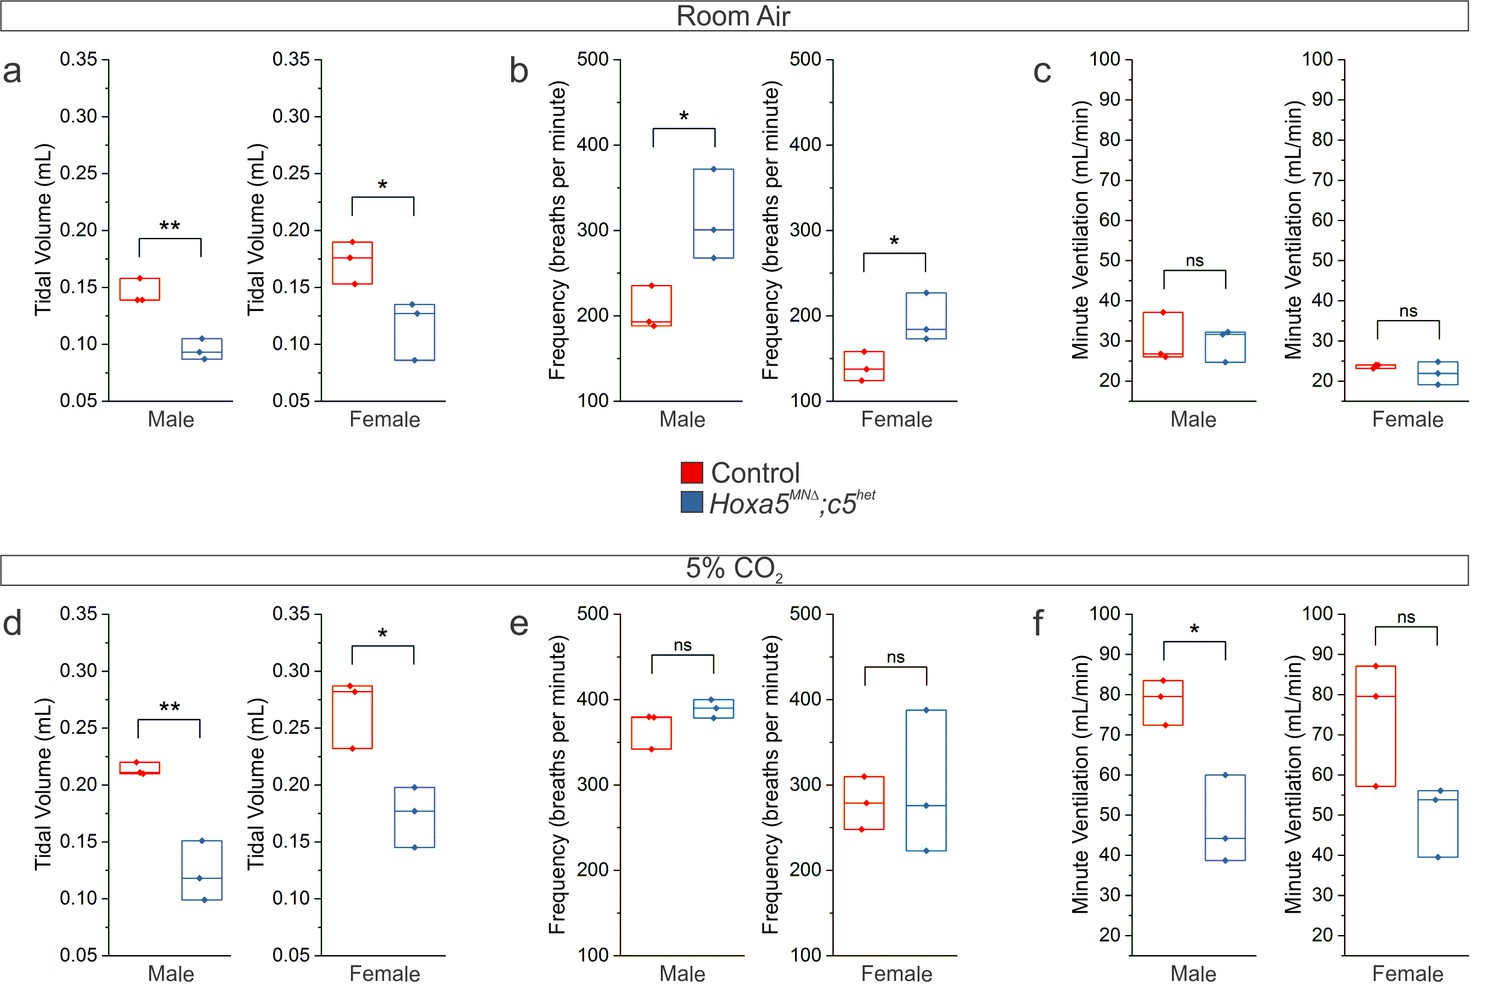
Respiratory insufficiency in both female and male Hoxa5MNΔ; c5het mice.
(a-c) Raw plethysmography data in room air show decreased tidal volume and a compensatory increase in frequency in adult (P80) male and female Hoxa5MNΔ; c5het mice. (d–f) Raw plethysmography data during a 5% CO2 hypercapnic challenge show a blunted increase in tidal volume in adult (P80) male and female Hoxa5MNΔ; c5het mice, resulting in an overall decrease in ventilation.
Figure 2 with 2 supplements
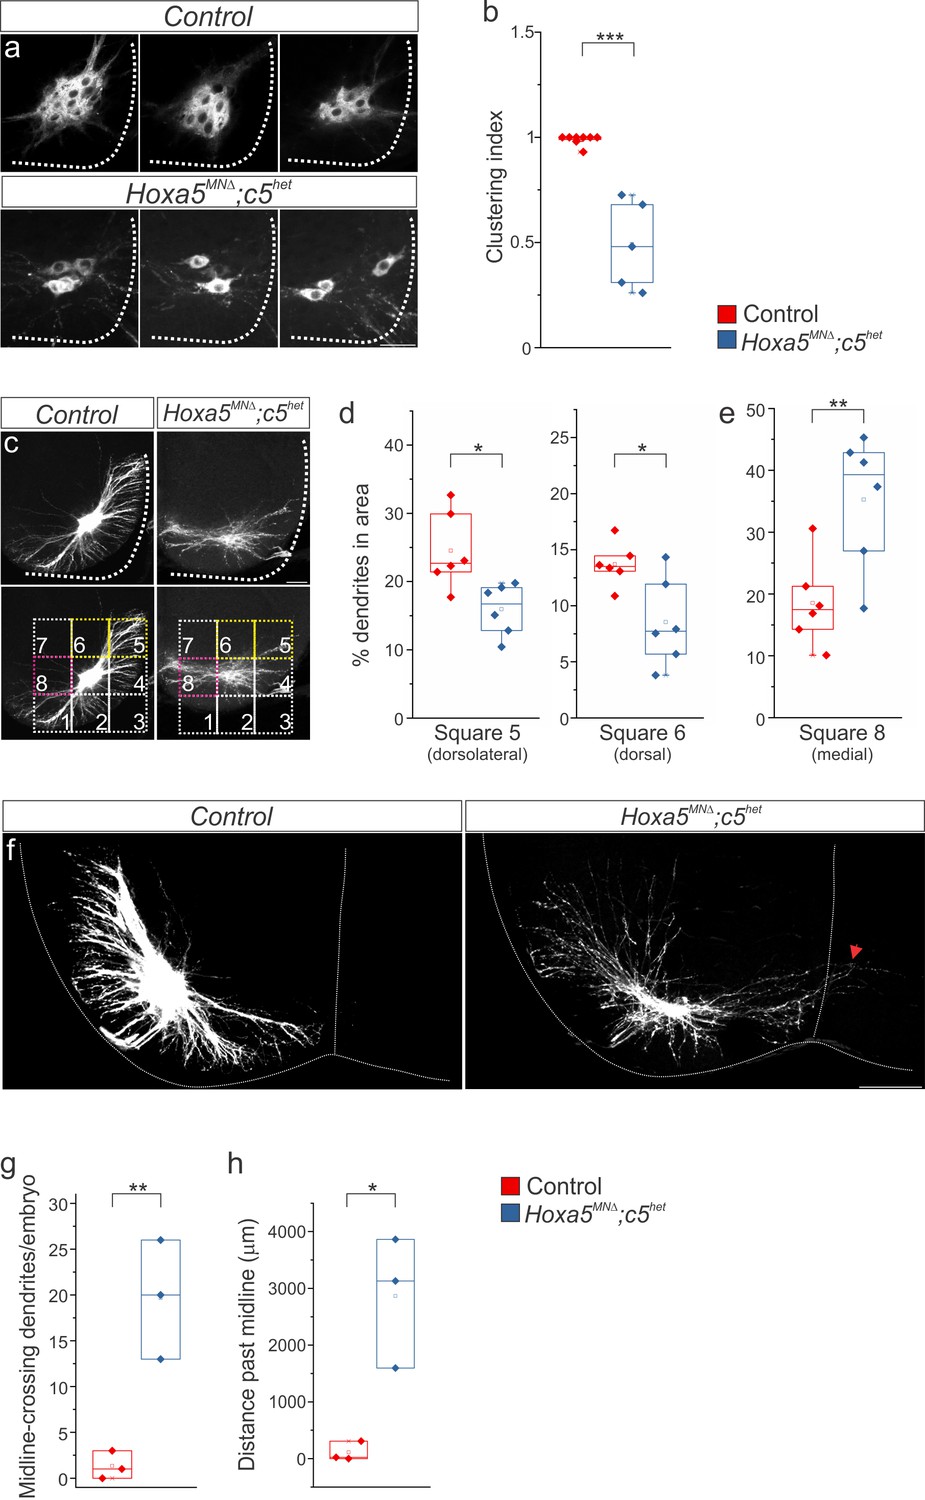
Hox5 genes dictate phrenic MN organization and dendritic topography.
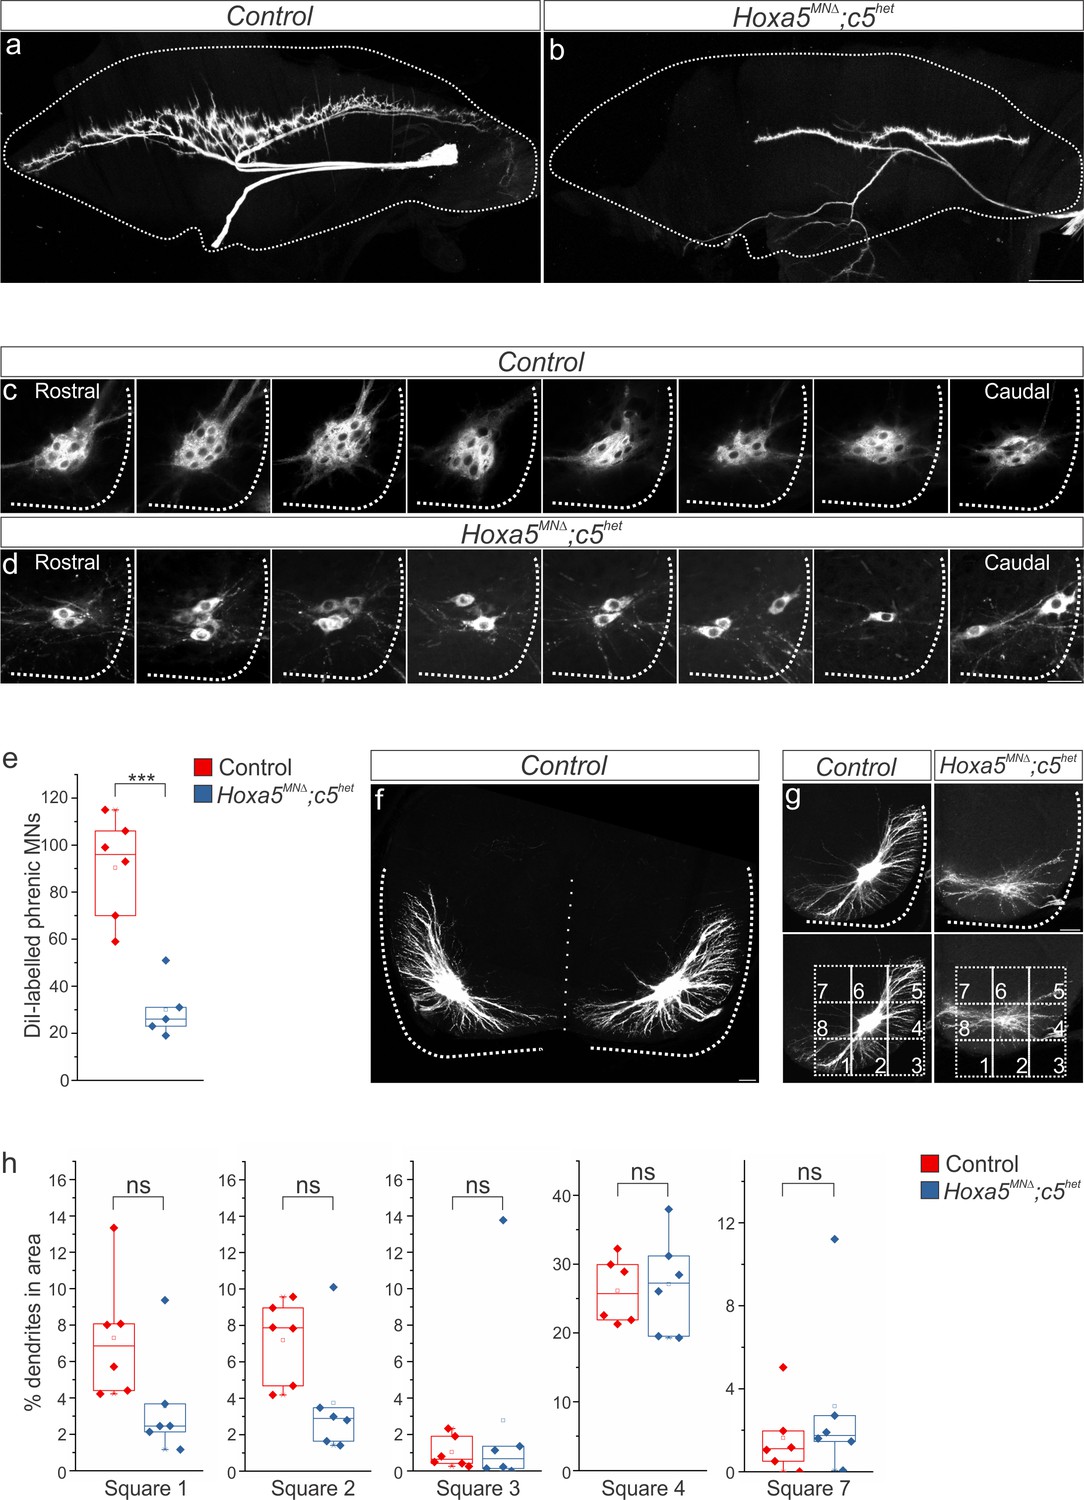
diI injections into the phrenic nerve show loss of PMC clustering (a–b) and changes in dendritic orientation (c–e) in Hoxa5MNΔ; c5het mice at e18.5. (c) A numbered grid was superimposed on PMC neurons to measure changes in dendritic orientation (see also Materials and methods). (d–e) Quantification of dendritic orientation. (d) Loss of dorsolateral dendrites (squares 5+6, yellow in c) in Hoxa5MNΔ; c5het mice. (e) Increase in the percentage of dendrites projecting towards the midline (square 8, pink in c) in Hoxa5MNΔ; c5het mice. (f–h) Phrenic dendrites in Hoxa5MNΔ; c5het mice cross the midline more frequently (g) and for longer distances (h) than in control mice. Scale bar = 50 μm in a, 100 μm in c, f. See also Figure 2—figure supplements 1 and 2.
Figure 2—figure supplement 1
Hox5 genes dictate phrenic MN organization.
(a-d) diI injections into the phrenic nerve label both phrenic projections at the diaphragm (a–b) and cell bodies in the cervical spinal cord (c–d). (c–d) Retrogradely-labeled phrenic MNs in Hoxa5MNΔ; c5het mice appear disorganized and lose their clustering at e18.5. Although there is significant phrenic MN loss, it is distributed equally along rostrocaudal levels of the spinal cord. All labeled phrenic MNs from a single control (c) and Hoxa5MNΔ; c5het (d) embryo are shown in a rostral to caudal direction. (e) Quantification of diI-labeled phrenic MNs. (f) Phrenic dendrites rarely cross the midline in control animals. (g) A numbered grid was superimposed on PMC neurons to measure changes in dendritic orientation (see also Materials and methods). (h) Quantification of dendritic orientation. There are no significant changes in the percentage of dendrites projecting in the ventral (squares 1–3), lateral (square 4) or dorsomedial (square 7) directions. Scale bar = 500 μm in b, 50 μm in d, f, 100 μm in g.
Figure 2—figure supplement 2

Hox5 genes control PMC position and clustering.
(a-b) Hoxa5MNΔ; c5het mice display 50% loss of phrenic MNs at e12.5. Phrenic MNs (yellow) express both the MN-specific transcription factor Isl1/2 (red) and the PMC-specific marker, Scip (green). (c–d) Decrease in PMC clustering in Hoxa5MNΔ; c5het mice at e12.5. Clustering index represents the density of PMC neurons found within a certain area (1000 μm2, see experimental procedures). (e–f) Deletion of the pro-apoptotic gene Bax, both in control and in Hox5MNΔ (Hox5MNΔ; Bax-/-) mice, equalizes phrenic MN numbers, enabling us to analyze the role of Hox5 genes in PMC organization independently of their role in PMC survival. (g–h) Decrease in PMC clustering in Hox5MNΔ; Bax-/- mice at e12.5. Scale bar = 50 μm.
Figure 3 with 1 supplement
Hox5-regulated MN transcriptome.
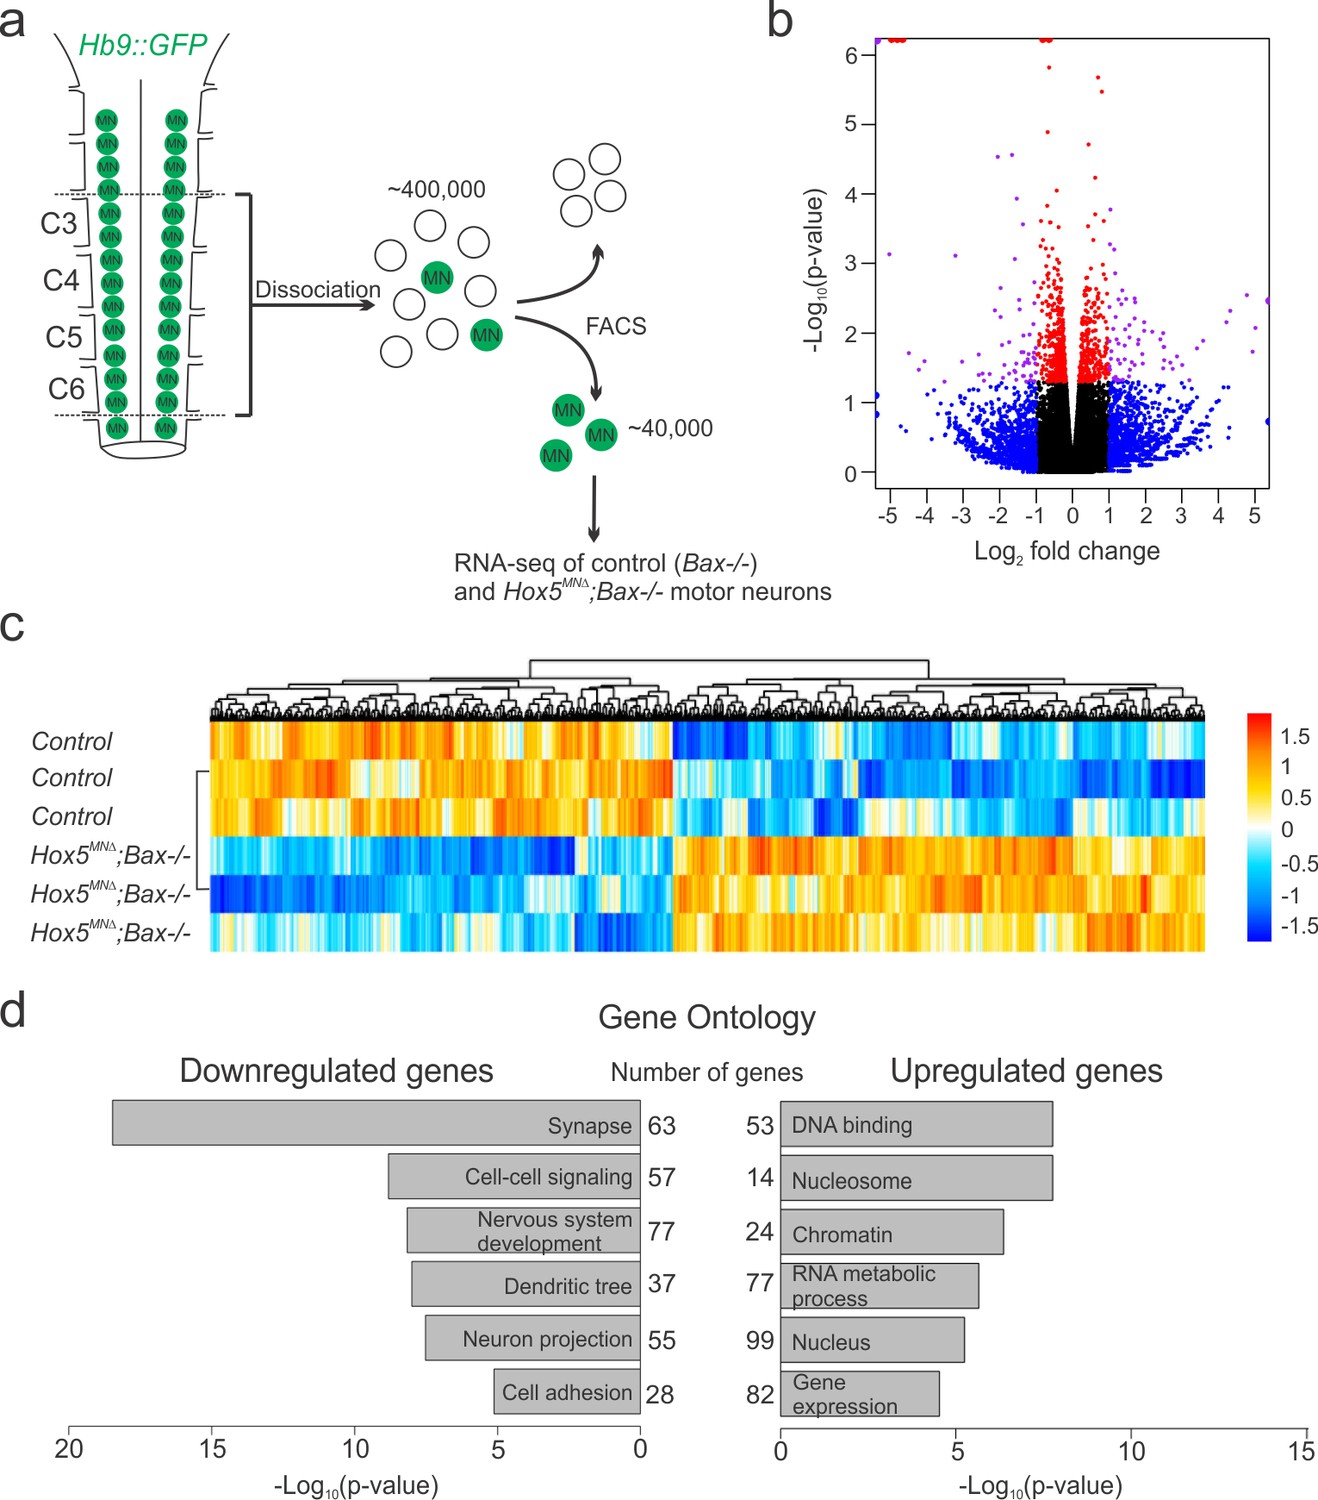
(a) Experimental design for RNA-seq experiments. MNs were FAC-sorted from control and Hox5MNΔ; Bax-/- mice in an Hb9::GFP background at e12.5. (b–c) Volcano plot (b) and heat map (c) showing differential gene expression between control and Hox5MNΔ; Bax-/- mice. (d) Gene ontology analysis reveals a number of genes involved in nervous system development, including cell adhesion molecules, are downregulated in Hox5MNΔ; Bax-/- mice. See also Figure 3—figure supplement 1.
Figure 3—figure supplement 1
Hox5-regulated cell adhesion molecules.
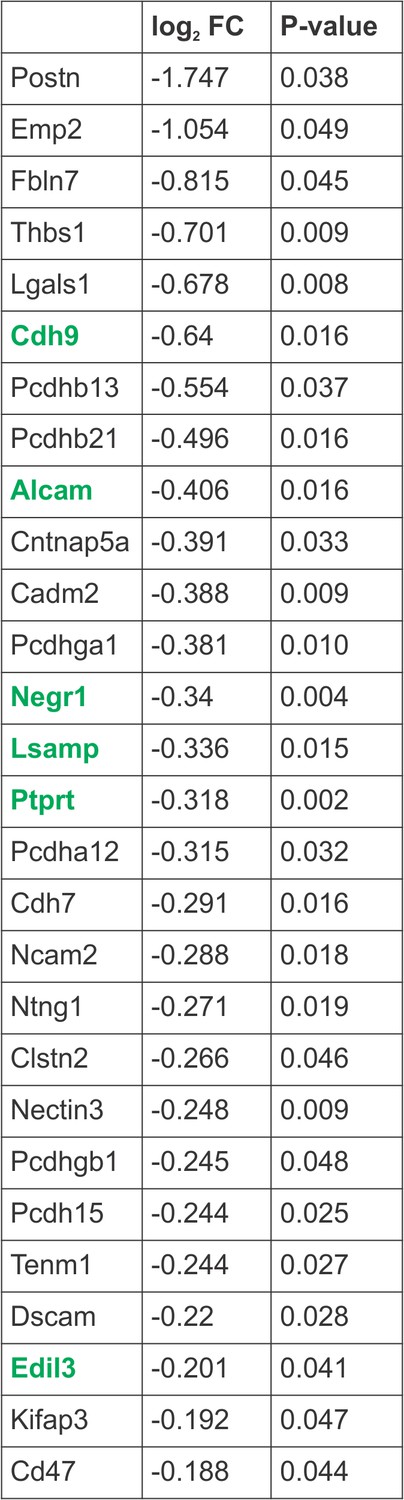
Cell adhesion molecules (CAMs) downregulated in the absence of Hox5 genes, as identified by RNA-seq. Highlighted CAMs were validated to be PMC-specific and regulated by Hox5 proteins by in situ hybridization.
Figure 4 with 1 supplement
A Hox5-dependent PMC-specific cell adhesion molecule code.
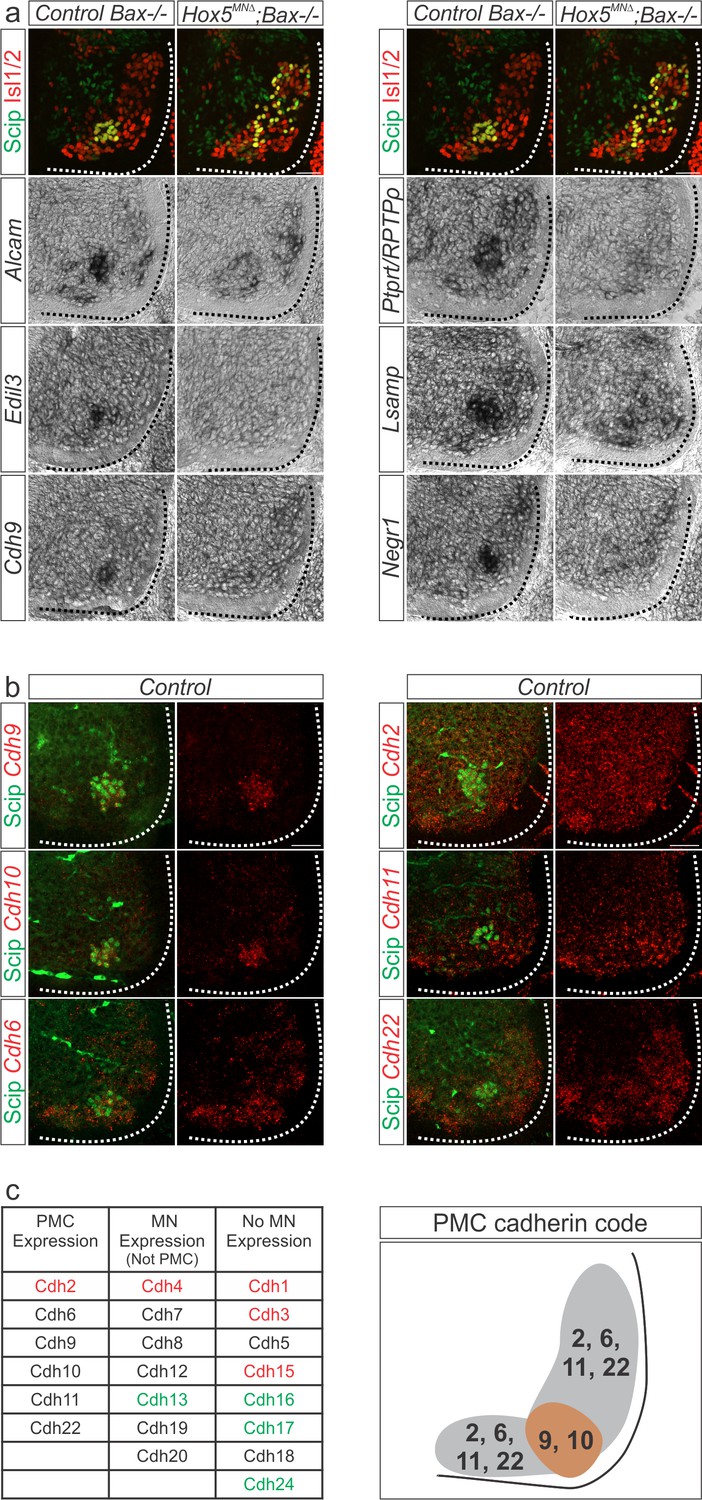
(a) Validation of Hox5-regulated cell adhesion molecules by in situ hybridization at e12.5. (b) Cadherin expression in the PMC at e13.5. Fluorescence in situ hybridization for the indicated cadherin (red) was combined with antibody staining for the phrenic-specific transcription factor Scip (green). (c) Comprehensive analysis of cadherin expression in the cervical/brachial spinal cord at e13.5. Type I cadherins are indicated in red, type II in black and atypical cadherins in green. PMC neurons can be defined by the combinatorial expression of cadherin 9 and 10 that are restricted to the PMC at cervical levels and cadherin 2, 6, 11 and 22 that are broadly expressed in MNs. Scale bar = 50 μm. See also Figure 4—figure supplement 1.
Figure 4—figure supplement 1
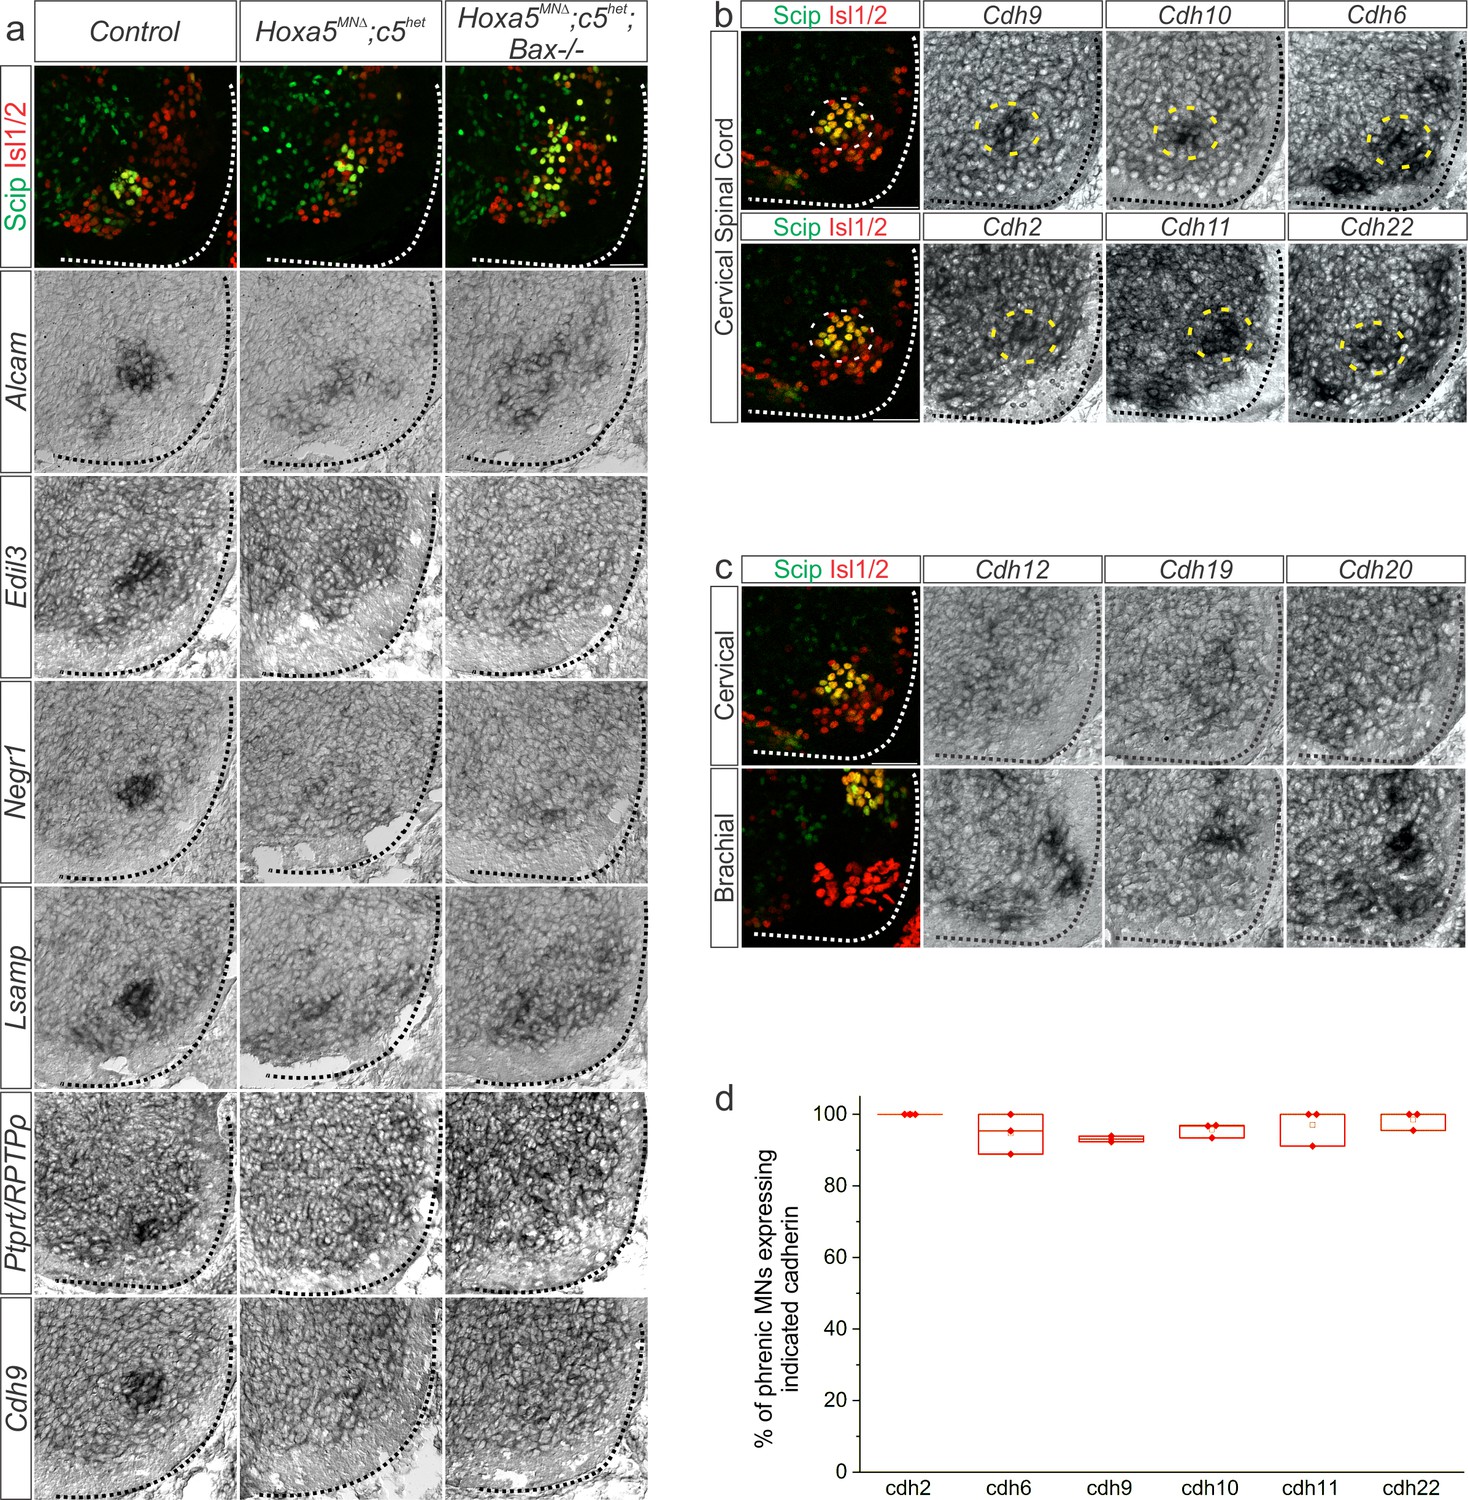
A Hox5-dependent PMC-specific cell adhesion molecule code.
(a) Validation of Hox5-regulated cell adhesion molecules by in situ hybridization in e12.5 Hoxa5MNΔ; c5het mice. Hoxa5MNΔ; c5het; Bax-/- mice were used to confirm downregulation was not due to a loss of phrenic MNs. (b) Cadherin expression in the PMC (dotted circle) at e13.5 by in situ hybridization. (c) Examples of cadherins expressed in MNs, but not PMC, at e13.5. (d) Quantification of the percentage of phrenic MNs that express PMC-enriched cadherins, as determined by fluorescence in situ hybridization combined with Scip immunofluorescence. Scale bar = 50 μm.
Figure 5 with 1 supplement
β- and γ-catenin inactivation leads to phrenic cell body and dendrite disorganization.
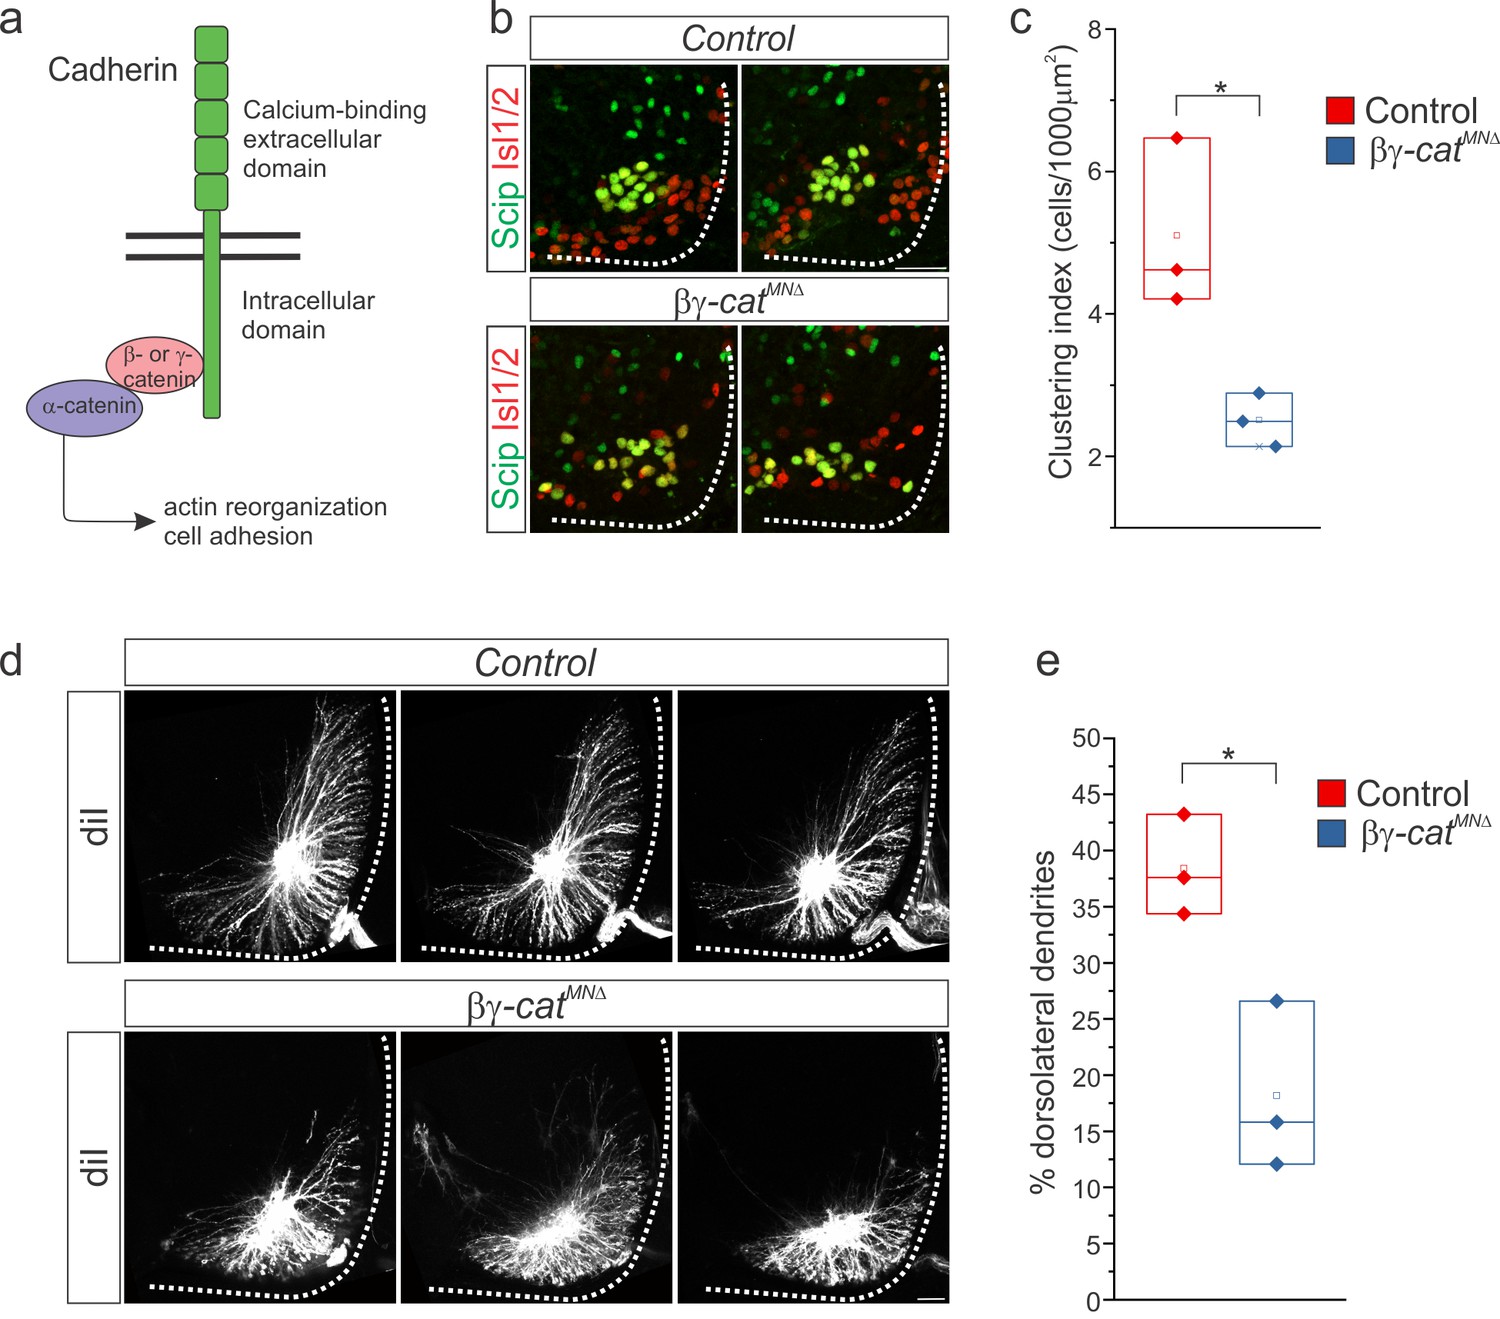
(a) Inactivation of β- and γ-catenin in MNs as a strategy to investigate the role of cadherins in PMC organization. (b–c) PMC disorganization and loss of clustering in βγ-catMNΔ mice at e13.5. (d–e) Loss of dorsolateral dendrites in βγ-catMNΔ mice at e14.5. Images in b and d show the PMC of the same embryo at different rostrocaudal levels, in a rostral to caudal order. Scale bar = 50 μm. See also Figure 5—figure supplement 1.
Figure 5—figure supplement 1

β- and γ-catenin inactivation leads to phrenic cell body and dendrite disorganization.
(a) Inactivation of β- and γ-catenin alone or in combination does not impair diaphragm innervation. (b) Reduction in phrenic MN numbers in βγ-catMN∆ mice, but not β-catMN∆ or γ-catMN∆ mice, at e13.5. (c) Normal PMC clustering in β-catMN∆ and γ-catMN∆ mice at e13.5. (d) Defects in migration of a subset of PMC neurons in βγ-catMN∆ mice at e13.5. Arrows point to Scip+ MNs stuck near the midline. (e) Normal dendritic orientation in β-catMN∆ and γ-catMN∆ mice at e14.5. Scale bar = 200 μm in a, 50 μm in c-e.
Figure 6 with 2 supplements
Hox5 genes shape the pattern of phrenic motor neuron activity.
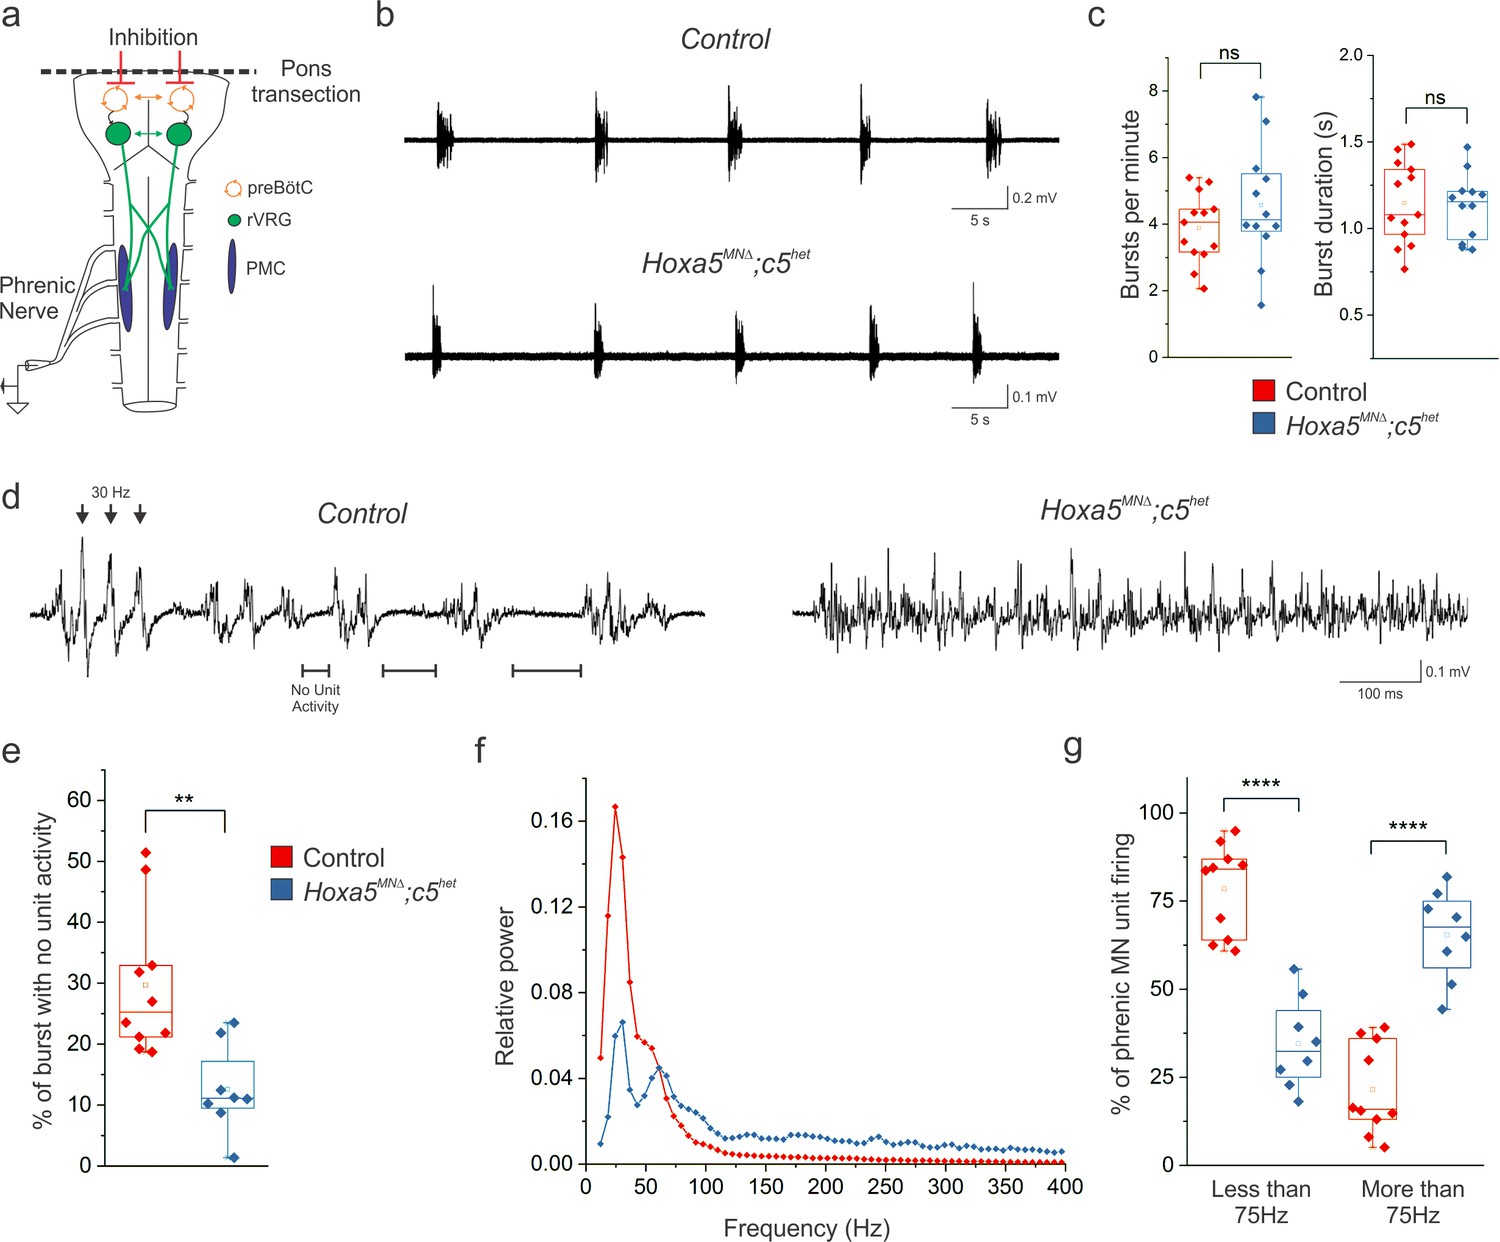
(a) Schematic of brainstem-spinal cord preparation, which displays fictive inspiration after removal of the pons. Suction electrode recordings were made from the phrenic nerve in the thoracic cavity at P4. (b–c) Respiratory burst frequency and burst duration are unaffected in Hoxa5MNΔ; c5het mice. While there is an increase in the variability of burst frequency in Hoxa5MNΔ; c5het mice, it is not statistically significant (n = 13 control, 12 Hoxa5MNΔ; c5het). (d) Phrenic firing pattern within inspiratory bursts is dramatically altered in Hoxa5MNΔ; c5het mice. In control mice, bursts are composed of periods of activity interspersed with silent periods with no unit activity (see horizontal lines). Populations of phrenic MNs fire in a pattern with a periodicity of about 30 Hz, where simultaneous firing of units generates large amplitude synchronous compound action potentials (see arrowheads). Phrenic MN firing lacks silent periods and is no longer constrained to certain frequencies in Hoxa5MNΔ; c5het mice. (e) The percentage of time during inspiratory bursts with no unit activity is decreased in Hoxa5MNΔ; c5het mice. (f) Power spectra showing that control mice have a prominent peak at 30 Hz with little activity above 75 Hz. Hoxa5MNΔ; c5het mice have a decreased 30 Hz peak and broadly increased activity above 75 Hz. For relative power definition, see Materials and methods. (g) Percentage of PMC unit firing above and below 75 Hz in control and Hoxa5MNΔ; c5het mice (n = 10 control, 8 Hoxa5MNΔ; c5het for e-g). See also Figure 6—figure supplements 1 and 2.
Figure 6—figure supplement 1
Hox5 genes shape PMC activity independently of MN survival.
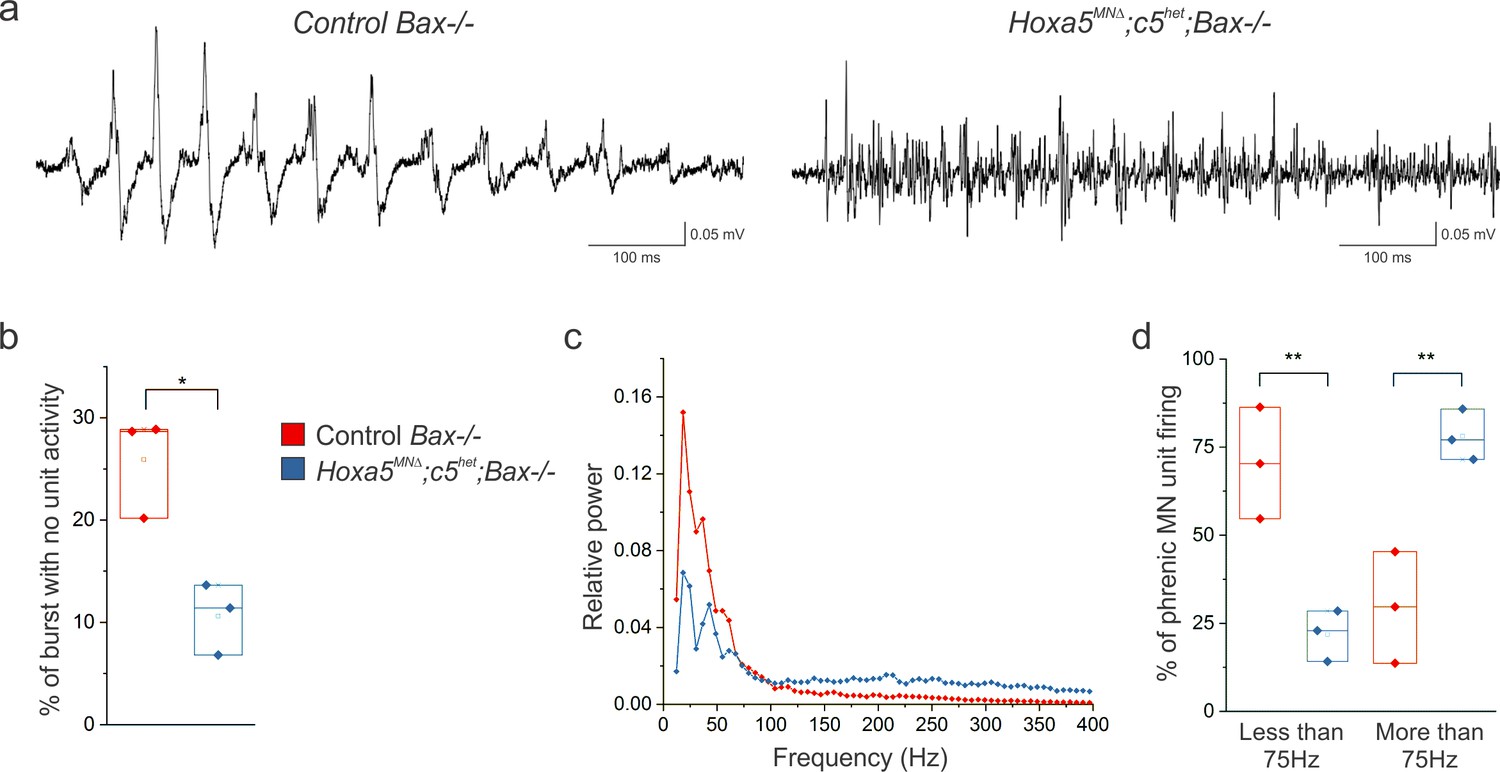
(a) The altered pattern of PMC activity seen in Hoxa5MNΔ; c5het mice is recapitulated in Hoxa5MNΔ; c5het; Bax-/- mice at P4, indicating that the change in firing is not due to the reduction in phrenic MN number. (b) The percentage of time during inspiratory bursts with no unit activity is decreased in Hoxa5MNΔ; c5het; Bax-/- mice. (c) Power spectra showing a decrease in the prominent peaks seen in control mice in Hoxa5MNΔ; c5het; Bax-/- mice, with an associated broad increase in high frequency activity. (d) Percentage of PMC unit firing above and below 75 Hz in control Bax-/- and Hoxa5MNΔ; c5het; Bax-/- mice.
Figure 6—figure supplement 2

Hox5 genes establish the pattern of phrenic MN firing prior to birth.
(a) The altered pattern of PMC activity observed in Hoxa5MNΔ; c5het mice at P4 is already present at P0, indicating that Hox5 genes act to establish patterns of phrenic MN firing prior to birth. (b) The percentage of time during inspiratory bursts with no unit activity is decreased in P0 Hoxa5MNΔ; c5het mice. (c) Power spectra showing a decrease in the prominent peaks seen in control mice in P0 Hoxa5MNΔ; c5het mice, with an associated broad increase in high frequency activity. (d) Percentage of PMC unit firing above and below 75 Hz in control and Hoxa5MNΔ; c5het mice at P0.
Figure 7 with 1 supplement
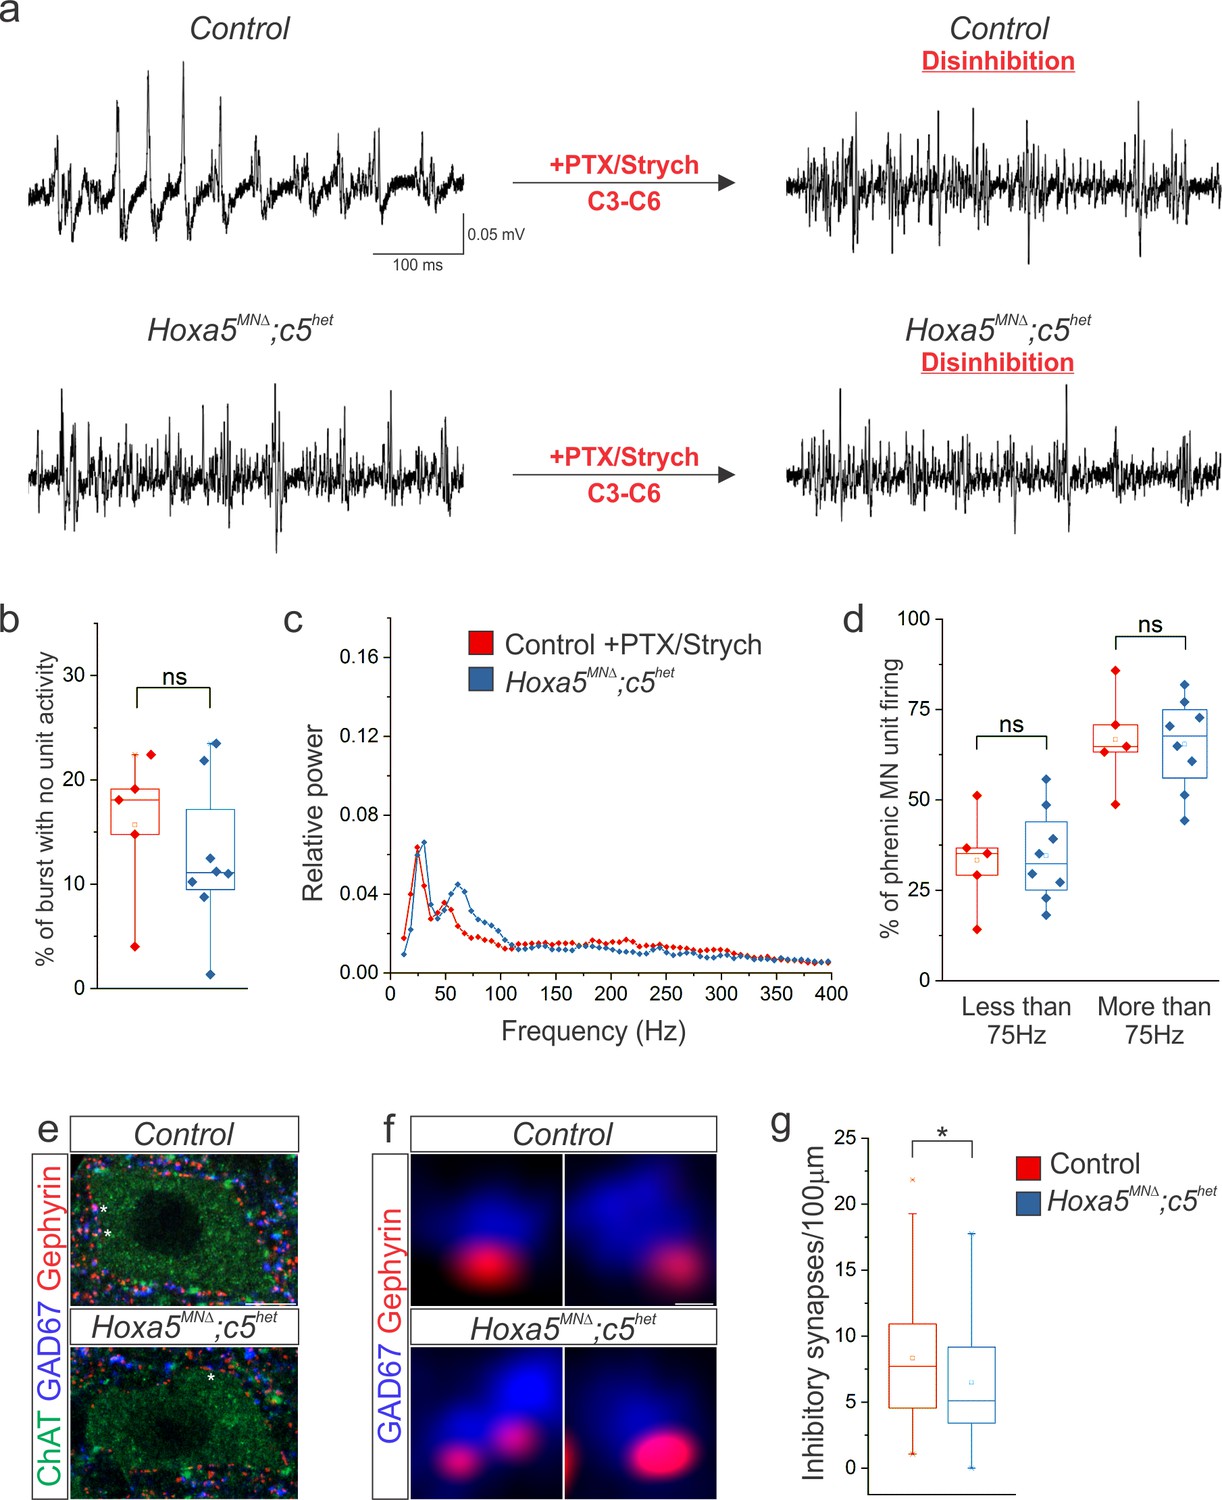
Hox5-dependent PMC inhibition patterns PMC activity.
(a) Disinhibition via local microinjection of picrotoxin (GABAA receptor antagonist) and strychnine (glycine receptor antagonist) into the ventral spinal cord at C3-C6, the location of the PMC, converts the highly patterned firing of phrenic MNs in control mice to the more continuous firing observed in Hoxa5MNΔ; c5het mice. (b) The percentage of time during inspiratory bursts with no unit activity is equivalent in both control +PTX/Strych and Hoxa5MNΔ; c5het mice, and is considerably reduced from control mice (Figure 6). (c–d) Power spectra and the percentage of phrenic MN unit firing above and below 75 Hz are equivalent in control +PTX/Strych and Hoxa5MNΔ; c5het mice. For relative power definition, see Materials and methods (n = 5 control +PTX/Strych, 8 Hoxa5MNΔ; c5het for b-d). (e) The number of perisomatic inhibitory synapses on phrenic MNs, identified by the apposition of GAD67 and gephyrin, is reduced in P10 Hoxa5MNΔ; c5het mice. A single phrenic MN cell body is shown and representative inhibitory synapses are labelled with stars. Choline Acetyltransferase (ChAT) staining was used to identify the cell body membrane. (f) Examples of inhibitory perisomatic synapses showing apposition of GAD67 and gephyrin. (g) Quantification of the reduction in perisomatic inhibitory synapses in Hoxa5MNΔ; c5het mice (n = 86 phrenic MNs from 2 control mice, 78 phrenic MNs from 2 Hoxa5MNΔ; c5het mice). Scale bar = 10 μm in e, 0.25 μm in f. See also Figure 7—figure supplement 1.
Figure 7—figure supplement 1

Hox5 genes control PMC topography and connectivity.
In control animals, phrenic MNs form a cluster in the cervical, ventral spinal cord and project their dendrites in a stereotypical ventromedial and dorsolateral orientation. This PMC topography is dictated by Hox5 transcription factors through the regulation of a PMC-specific molecular program, including a subset of cadherins. In the absence of Hox5 genes, both phrenic MN topography and molecular identity are eroded, resulting in the selective loss of PMC inhibitory inputs and changes in the pattern of phrenic motor output.
Tables
Key resources table
| Reagent type (species) or resource | Designation | Source or reference | Identifiers | Additional information |
|---|---|---|---|---|
| Gene (M. musculus) | Hoxa5 | MGI:96177 | ||
| Gene (M. musculus) | Hoxc5 | MGI:96196 | ||
| Gene (M. musculus) | Alcam | MGI:1313266 | ||
| Gene (M. musculus) | Edil3 | MGI:1329025 | ||
| Gene (M. musculus) | Ptprt | MGI:1321152 | ||
| Gene (M. musculus) | Lsamp | MGI:1261760 | ||
| Gene (M. musculus) | Negr1 | MGI:2444846 | ||
| Gene (M. musculus) | Cdh2 | MGI:88355 | ||
| Gene (M. musculus) | Cdh6 | MGI:107435 | ||
| Gene (M. musculus) | Cdh9 | MGI:107433 | ||
| Gene (M. musculus) | Cdh10 | MGI:107436 | ||
| Gene (M. musculus) | Cdh11 | MGI:99217 | ||
| Gene (M. musculus) | Cdh22 | MGI:1341843 | ||
| Genetic reagent (M. musculus) | Hoxa5 flox | PMID: 17417799 | MGI:3723622 | |
| Genetic reagent (M. musculus) | Hoxc5-/- | PMID: 17626057 | MGI:3526151 | |
| Genetic reagent (M. musculus) | Olig2::Cre | PMID: 18046410 | MGI:3774124 | |
| Genetic reagent (M. musculus) | Hb9::GFP | PMID: 12176325 | MGI:3056906; RRID:IMSR_JAX:005029 | |
| Genetic reagent (M. musculus) | Bax-/- | PMID: 7569956 | MGI:1857429; RRID:IMSR_JAX:002994 | |
| Genetic reagent (M. musculus) | β-catenin flox | PMID: 11262227 | MGI:2148567; RRID:IMSR_JAX:004152 | |
| Genetic reagent (M. musculus) | γ-catenin flox | PMID: 22036570 | MGI:5305426 | |
| Genetic reagent (M. musculus) | γ-catenin-/- | PMID: 8858175 | MGI:1861958; RRID:IMSR_JAX:003334 | |
| Antibody | anti-scip (goat polyclonal) | Santa Cruz Biotechnology | RRID:AB_2268536 | (1:5000) |
| Antibody | anti-islet1/2 (mouse monoclonal) | DSHB; PMID: 7528105 | RRID:AB_2314683 | (1:1000) |
| Antibody | anti-neurofilament (rabbit polyclonal) | Synaptic Systems | RRID:AB_887743 | (1:1000) |
| Antibody | anti-synaptophysin (rabbit monoclonal) | Thermo Fisher | RRID:AB_10983675 | (1:250) |
| Antibody | anti-GFP (rabbit polyclonal) | Invitrogen | RRID:AB_221570 | (1:1000) |
| Antibody | anti-ChAT (goat polyclonal) | Millipore | RRID:AB_2079751 | (1:200) |
| Antibody | anti-GAD67 (mouse monoclonal) | Millipore | RRID:AB_2278725 | (1:500) |
| Antibody | anti-gephyrin (mouse monoclonal) | Synaptic Systems | RRID:AB_2232546 | (1:3000) |
| Commercial assay or kit | TSA Amplification Kit | Perkin Elmer | Cat. No. NEL753001KT | |
| Commercial assay or kit | Arcturus Picopure RNA Isolation Kit | Applied Biosystems | Cat. No. KIT0204 | |
| Commercial assay or kit | Stranded RNA-seq Kit with Riboerase | Kapa Biosystems | Cat. No. KK8483 | |
| Chemical compound, drug | Picrotoxin | Tocris Bioscience | Cat. No. 1128 | 1.25 mM |
| Chemical compound, drug | Strychnine hydrochloride | Sigma | Cat. No. S8753 | 1.25 mM |
| Chemical compound, drug | α-bungarotoxin, Alexa Fluor 555 conjugate | Invitrogen | RRID:AB_2617152 | (1:1000) |
| Chemical compound, drug | diI | Invitrogen | Cat. No. D3911 | |
| Software, algorithm | FASTQC | http://www.bioinformatics.babraham.ac.uk/projects/fastqc/ | RRID:SCR_014583 | |
| Software, algorithm | Trim Galore | http://www.bioinformatics.babraham.ac.uk/projects/trim_galore/ | RRID:SCR_011847 | |
| Software, algorithm | Tophat v2.1.0 | PMID: 23618408 | RRID:SCR_013035 | |
| Software, algorithm | htseq-count | PMID: 25260700 | RRID:SCR_011867 | |
| Software, algorithm | R v3.6.1 | http://www.r-project.org/ | RRID:SCR_001905 | |
| Software, algorithm | pClamp 10 | Molecular Devices | RRID:SCR_011323 | |
| Software, algorithm | Spike2 | Cambridge Electronic Design | RRID:SCR_000903 |
Additional files
-
Supplementary file 1
In situ hybridization probes.
Supplementary Table 1. PCR primers for in situ hybridization. Supplementary Table 2. Specificity of in situ probes for PMC cadherins. To ascertain the specificity for the designed in situ probes to its intended target (given the degree of similarity between members of the cadherin family), we ran each full length probe through BLAST (https://blast.ncbi.nlm.nih.gov/) against the refseq_rna database for M. musculus and checked for cross-reactivity with other cadherins. BLAST outputs a ‘max alignment score’ parameter, which awards points for base matches while penalizing base mismatches, gaps, etc. While all on target alignment scores are high (>1400, dependent on probe length), off target scores are low (<35% of the max alignment score of the intended target).
- https://cdn.elifesciences.org/articles/52859/elife-52859-supp1-v2.docx
-
Transparent reporting form
- https://cdn.elifesciences.org/articles/52859/elife-52859-transrepform-v2.docx
Download links
A two-part list of links to download the article, or parts of the article, in various formats.
Downloads (link to download the article as PDF)
Open citations (links to open the citations from this article in various online reference manager services)
Cite this article (links to download the citations from this article in formats compatible with various reference manager tools)
Phrenic-specific transcriptional programs shape respiratory motor output
eLife 9:e52859.
https://doi.org/10.7554/eLife.52859


