From behavior to circuit modeling of light-seeking navigation in zebrafish larvae
- Sorbonne Université, CNRS, Institut de Biologie Paris-Seine (IBPS), Laboratoire Jean Perrin (LJP), France
- Université Paris Sciences et Lettres, France
- Laboratoire de Physique de l’Ecole Normale Supérieure, CNRS UMR 8023 & PSL Research, France
- Institut de Biologie de l’Ecole Normale Supérieure, CNRS, INSERM, UMR 8197 & PSL Research, France
Figures
Figure 1
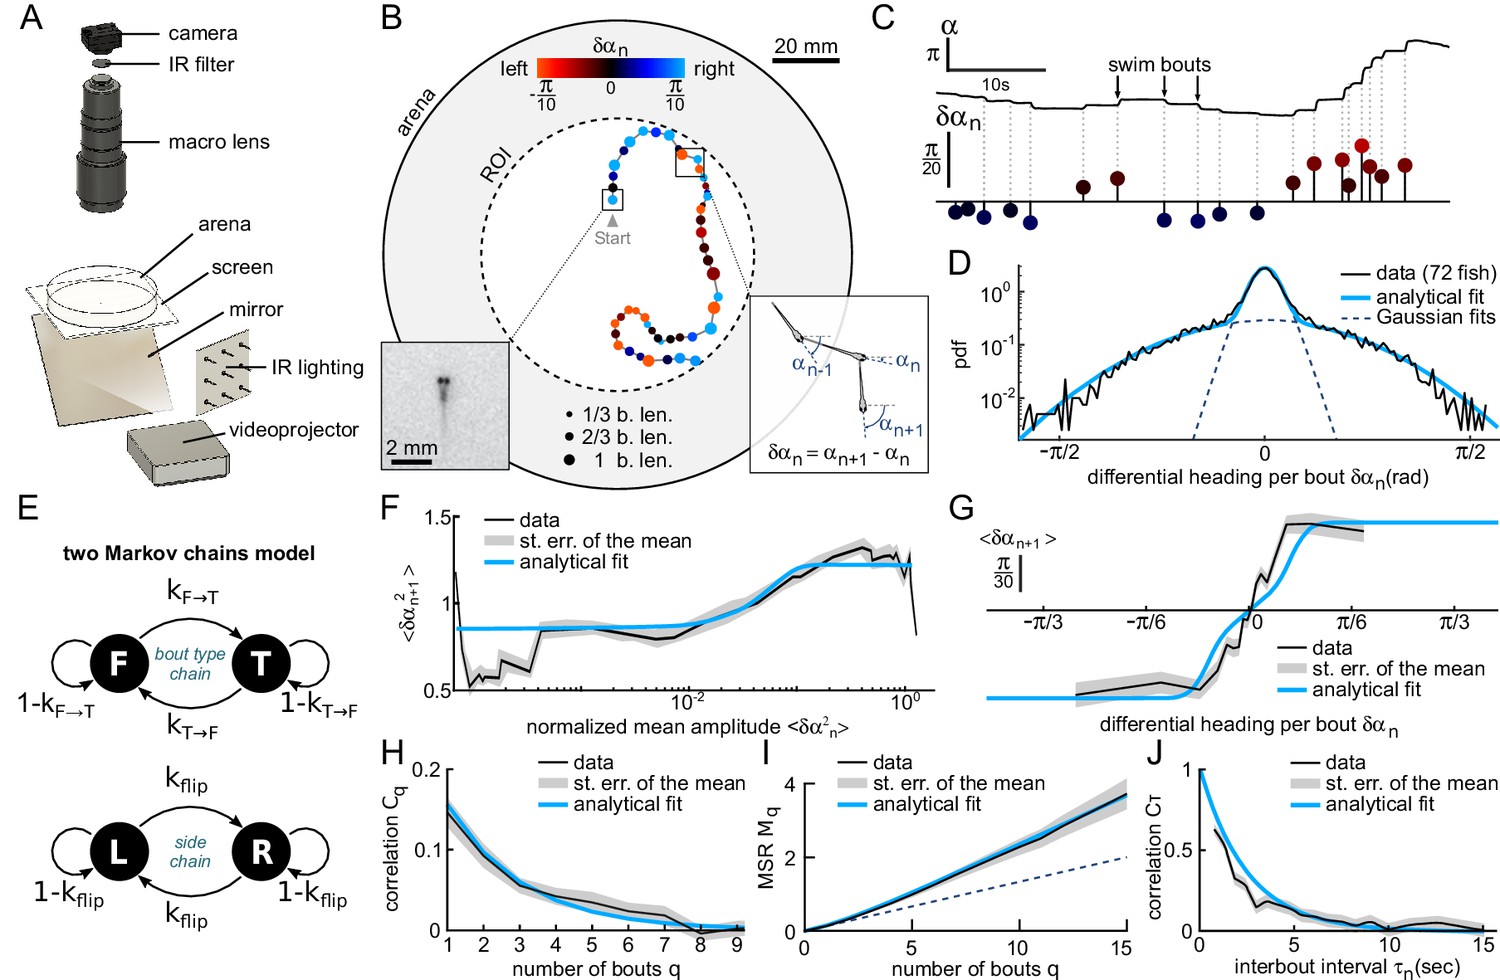
Kinematics of spontaneous navigation.
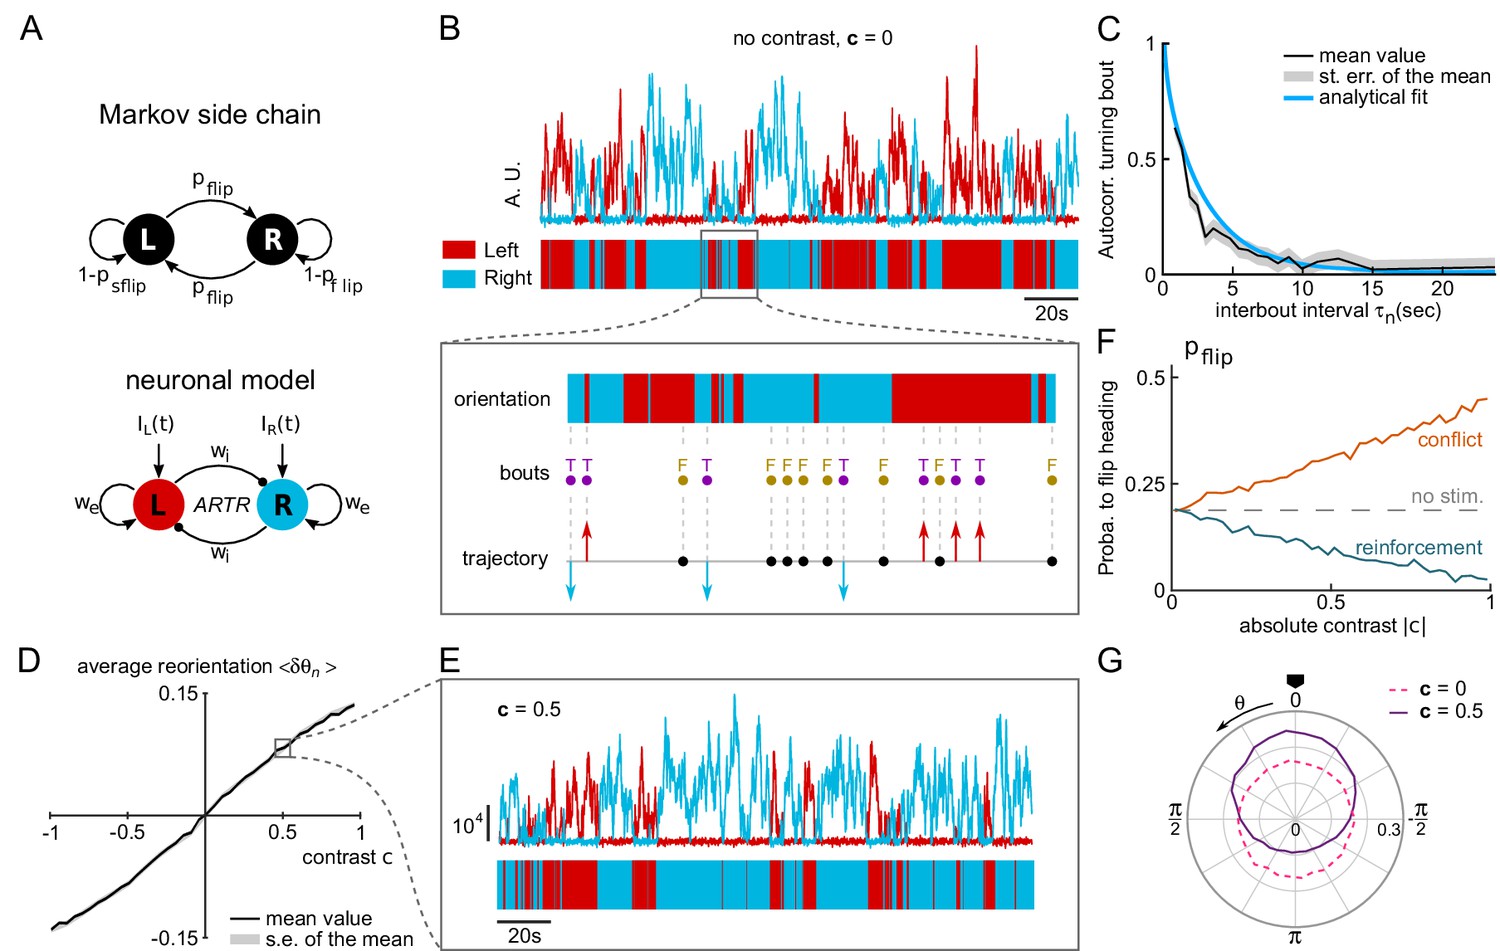
fish, bouts, mean of 7 trajectories per fish. (A) Experimental setup: real-time monitoring of the larva’s position and orientation using IR illumination, enables closed-loop visual stimulation using a video projector. (B) Typical trajectory of a 6 days old larva in the region of interest (ROI) of the arena under constant, uniform illumination. Each point indicates the fish position at the onset of a swim bout. Dots’ size and color encode the bout distance and bout reorientation angle, respectively. Insets: blow-up of an example frame (left) and definition of the reorientation angle at bout index (right). b.len: body length. (C) Time-sequence of the fish body orientation (top). Swim bouts elicit rapid re-orientations. The angular dynamics can thus be represented as a series of discrete reorientation events of various amplitudes (color code as in (B)). (D) Experimental (dark) and analytical (blue) distributions (pdf: probability density function) of reorientations . The two normal distributions used in the fit with Equation A1, weighted by and , are also displayed in dashed blue lines. (E) Two independent Markov chains model for spontaneous navigation: the bout type chain controls the forward scoot () versus turning () state, with transitions rates and . The side chain controls the transitions between left () and right () headings when the animal is in the turning state, with transition rate . (F) Mean squared reorientation amplitude of bout as a function of the squared amplitude of bout (grey), and its associated analytical fit (blue, Appendix From behavior to circuit modeling of light-seeking navigation in zebrafish larvae Equation A5). (G) Average reorientation of bout as a function of the reorientation at bout (grey), and its associated analytical fit (blue, Equation A11). (H) Correlation in reorientation angles as a function of the number of bouts (grey) and associated fit (blue, Equation A14). (I) Mean square reorientation (MSR) as a function of the number of bouts, and associated fit (blue, Equation A17). The dotted line is the linear extrapolation of the first two data points and corresponds to the diffusive process expected for a memory-less random walk (no correlation in bout orientation). (J) Orientation correlation of turning bouts (thresholded at 0.22rad) as a function of the time elapsed between those bouts. The blue line is the exponential fit. Data from this and the following figures are available at Karpenko (2019a) (copy archived at https://github.com/elifesciences-publications/programs_closed-loop_phototaxis).
Figure 2 with 2 supplements
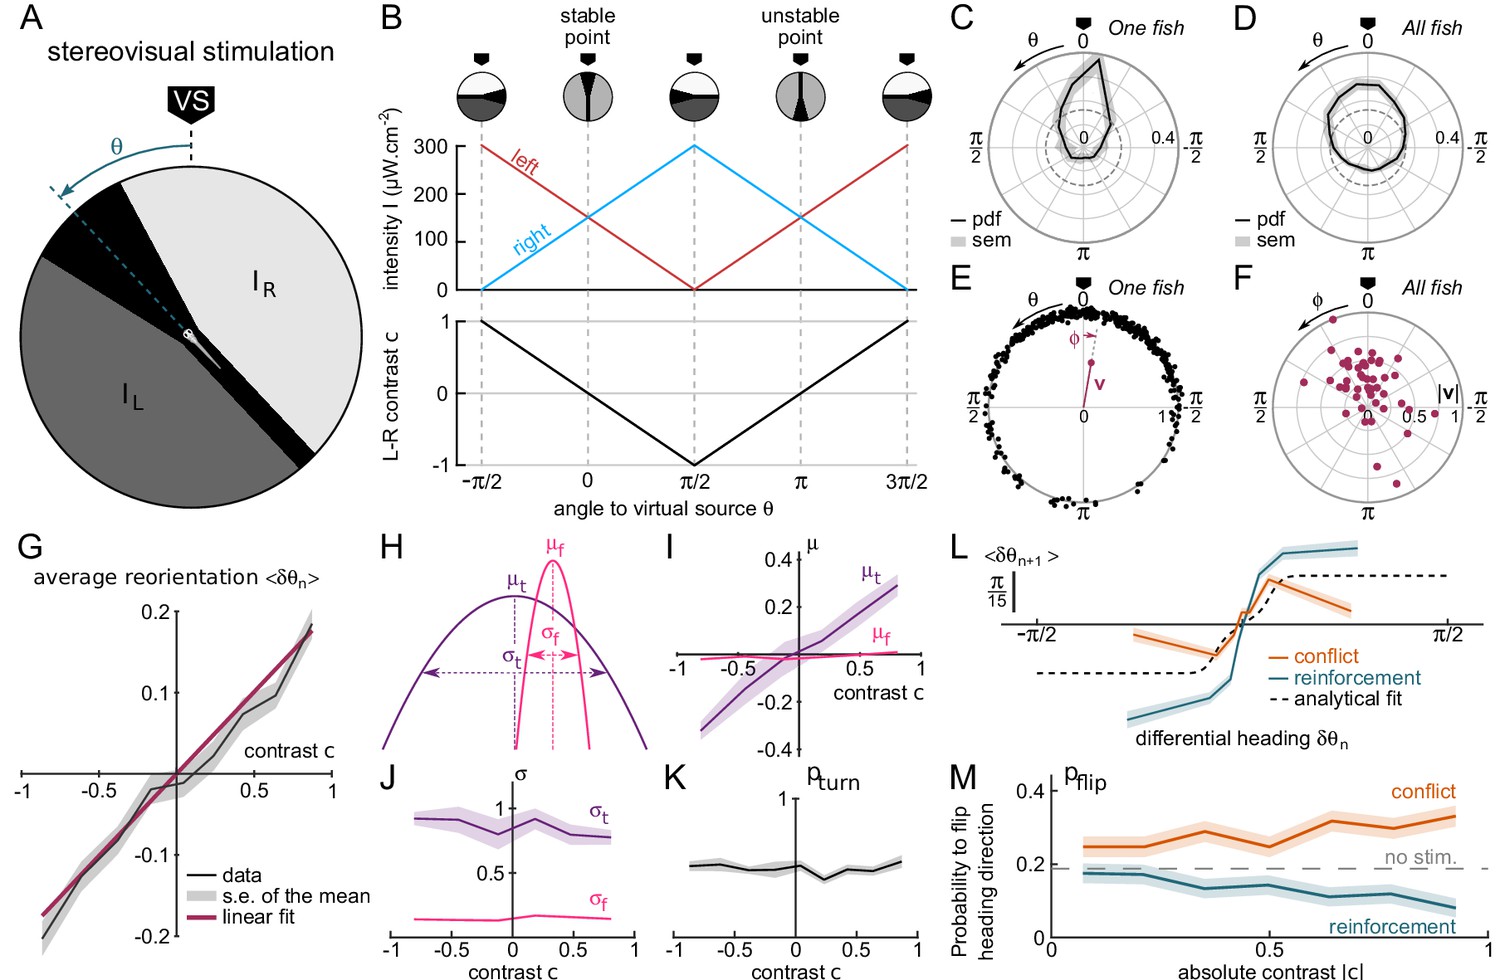
Contrast-driven phototaxis as a biased random walk.
fish, 18, 322 bouts, mean of 13 trajectories per fish. All statistical analyses are performed on the first 17 bouts, the first one excluded, for each assay. VS : virtual source. (A) Stimulus pattern delivered to the larva. The orientation relative to the virtual source is noted . (B) Left and right intensities (top panel) and contrast (bottom panel) as a function of . The virtual light source is defined by a null contrast () and corresponds to a stable point (). (C) Probability density function (pdf) of orientations relative to the virtual light source for one fish during 20 trials, bouts 2 to 17 (n = 320 bouts). (D) Probability density function (pdf) of orientations for all tested fish (). Significantly biased toward the virtual source (V-test for non-uniformity with specified mean 0, ) (E) Definition of the mean resultant vector v for one fish. The points represent the angular positions of the fish relative to the source. The vector v is defined as . The mean angle to the source is (F) Resultant vectors v for individual fish. (G) Mean reorientation per bout as a function of contrast for all fish. Error bars represent the standard error of the mean. Red line is the linear fit with slope 0.2 rad. (H) Illustration of the shift in turning distribution () induced by a negative contrast. (I) Means, (J) standard deviations and (K) relative weight of the turning distribution as a function of the contrast. For each value of the contrast, these quantities were extracted by double-Gaussian fitting of the bout angles. The error bars represent the 99% confidence interval from the fit. (L) Average reorientation at bout as a function of the reorientation at bout in reinforcing (contrast and previous bout orientation are consistent) or conflicting (contrast and previous bout orientation are in conflict) situations. The dashed line is the analytical prediction in the absence of stimulation. (M) Probability of switching direction as a function of the contrast, in situations of conflict or reinforcement.
Figure 2—figure supplement 1
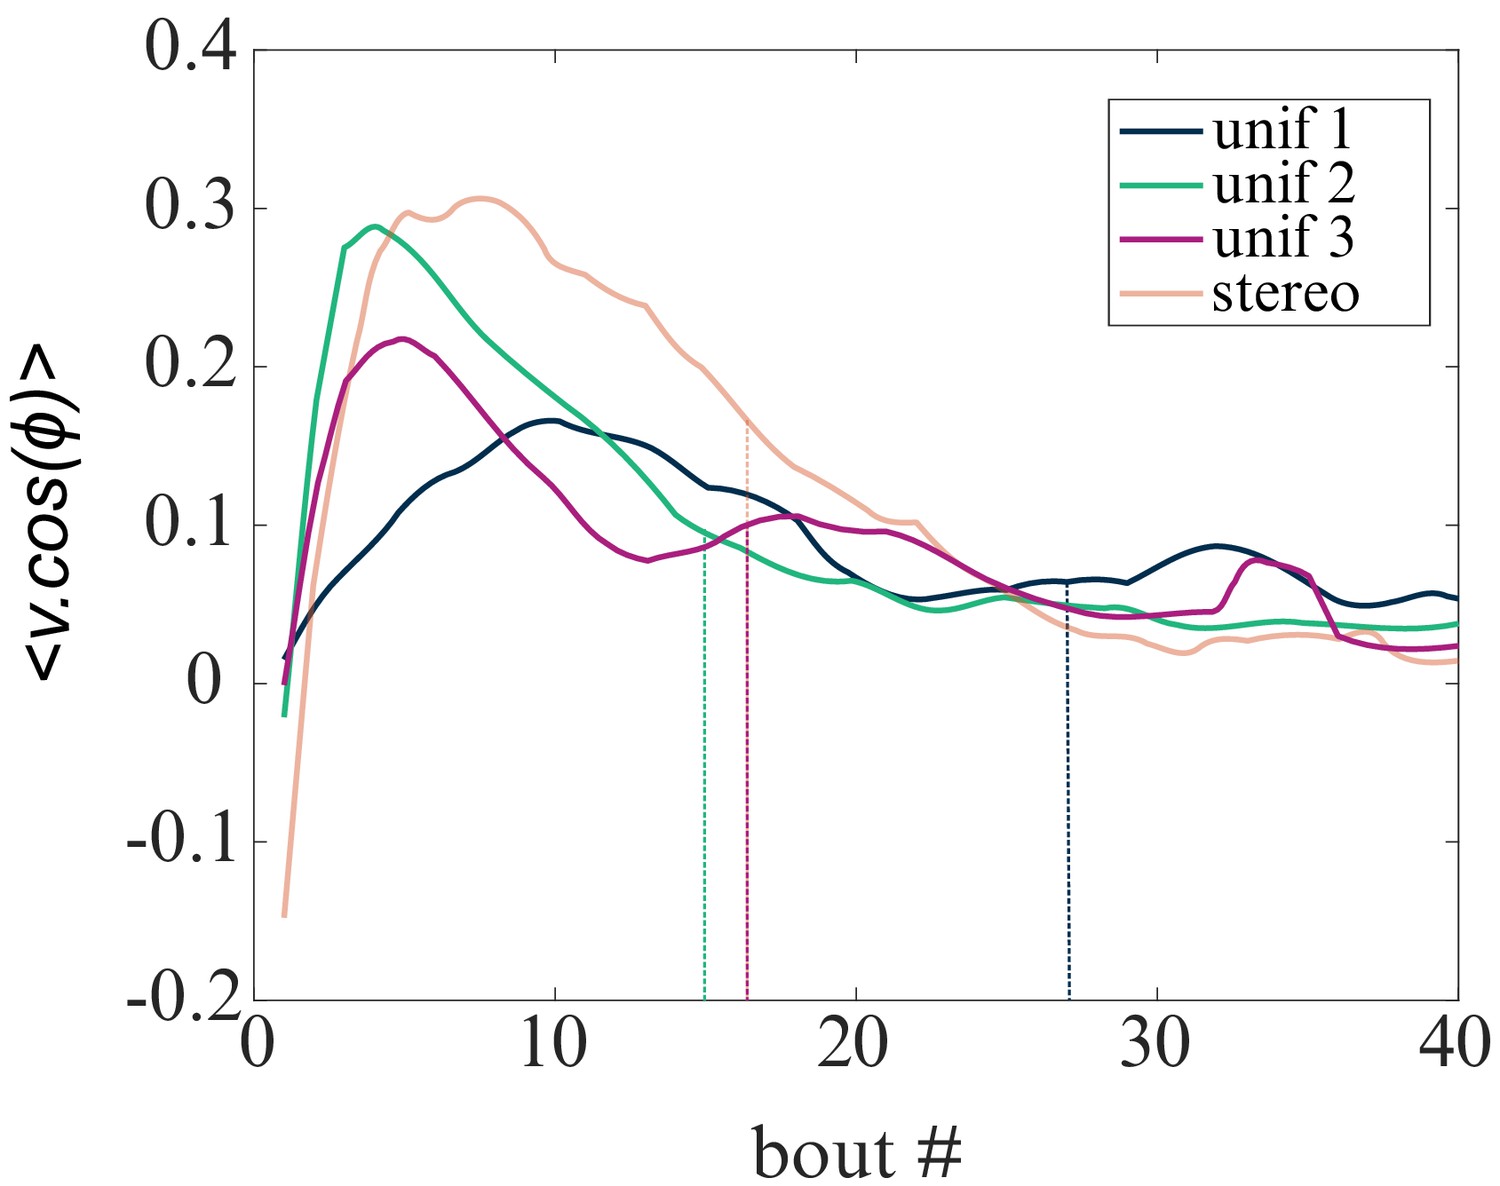
Evolution of the mean resultant vector projected on the direction of the virtual light source with the bout index.
Evolution of the mean resultant vector projected on the direction of the virtual light source with the bout index for the four tested phototactic modalities (uniform illumination : (p1–p3) and stereo-visual contrast). The vertical lines indicate the median number of bouts per sequence in each modality.
Figure 2—figure supplement 2
Evolution of contrast-driven bias slope with the bout index.
Slope of , representing the bias towards the brighter side, at different bout index.
Figure 3 with 2 supplements
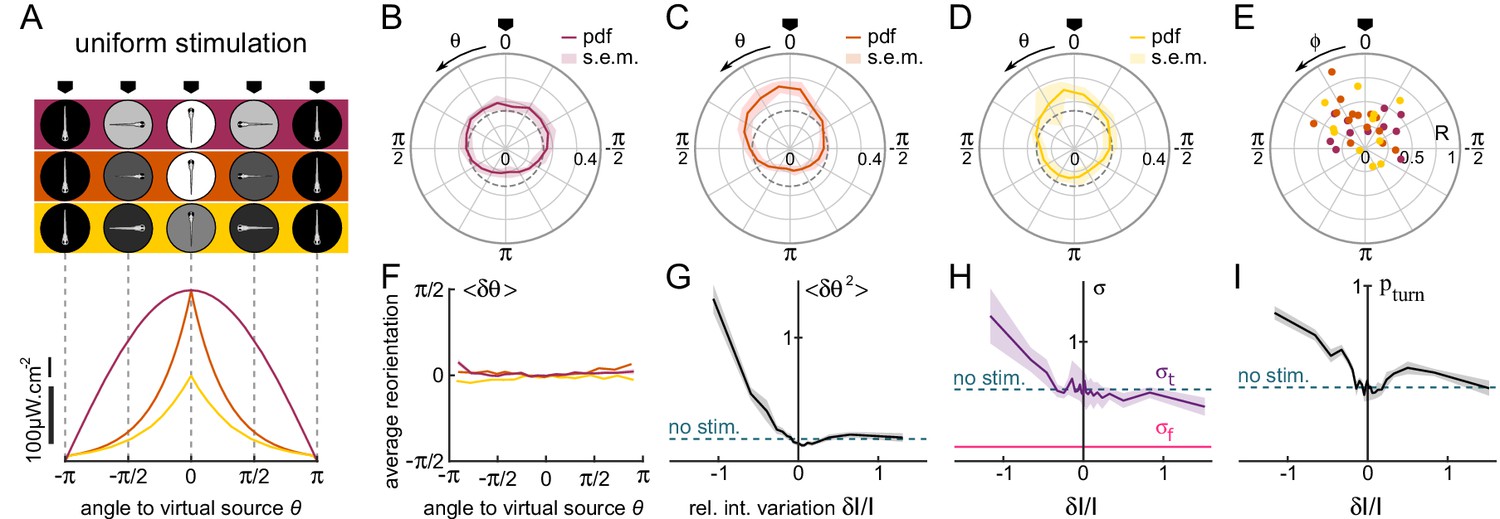
Orientational phototaxis driven by modulation of the global illumination.
fish, bouts, mean of 23 trajectories per fish. (A) Top panel : Angle-dependent intensity profiles delivered to the larva. The virtual light source is located at , defined as the point of maximum intensity. The profiles are sinusoidal (uniform 1, purple) or exponentially shaped (uniform 2 and 3 orange and yellow, respectively). All statistics were computed using bout index two to the median number of bouts per sequence (resp. 27, 17 and 15 for the three profiles). (B–D) PDF of the fish orientations for the three profiles. All three distributions are significantly biased towards the virtual source (V-test for non-uniformity of circular data with specified mean , respectively , and ).(E) Resultant vector v for all individual fish. (F) Mean reorientation per bout of all fish as a function of for the three profiles. No significant bias towards the source () is observed. (G) Variance of the reorientation angles as a function of the relative change in intensity experienced at the previous bout . Error bars are standard error of the mean. (H) Standard deviation of turning bouts as a function of . The standard deviation of forward scouts was set at , and was then estimated using a double-Gaussian fitting of the bout angles. Error bars are the 99% confidence interval from fit. (I) Probability of triggering a turning bout as a function of . Error bars are the 99% confidence interval from the fit.
Figure 3—figure supplement 1
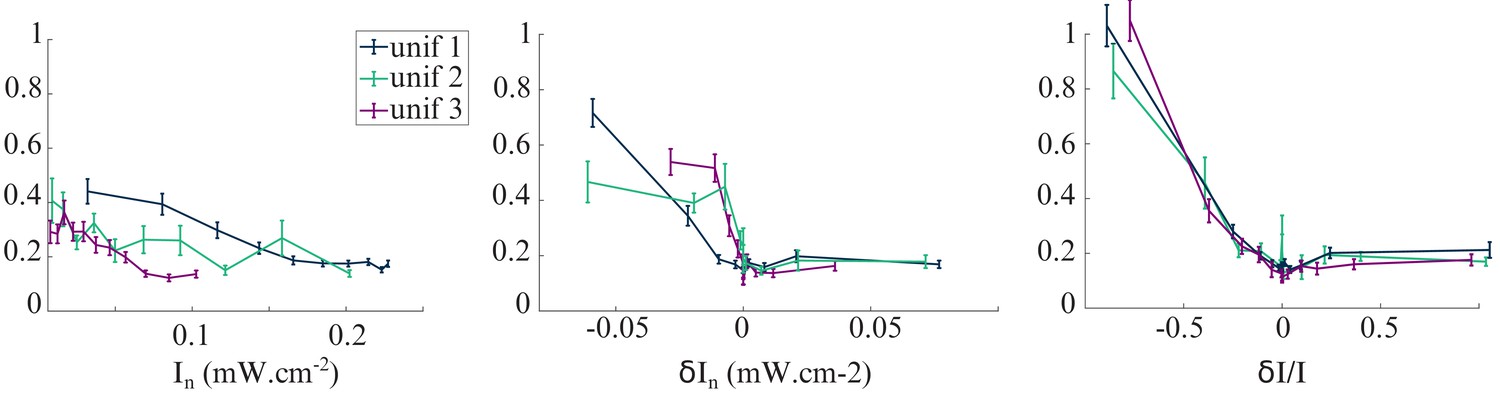
Variance of as a function of three different illumination parameters.
Testing klinotaxis with spatially uniform illumination (orientational profiles unif 1–3). Change in variance of at bout n for two different parameters : absolute intensity , absolute change in intensity and relative change in intensity .
Figure 3—figure supplement 2
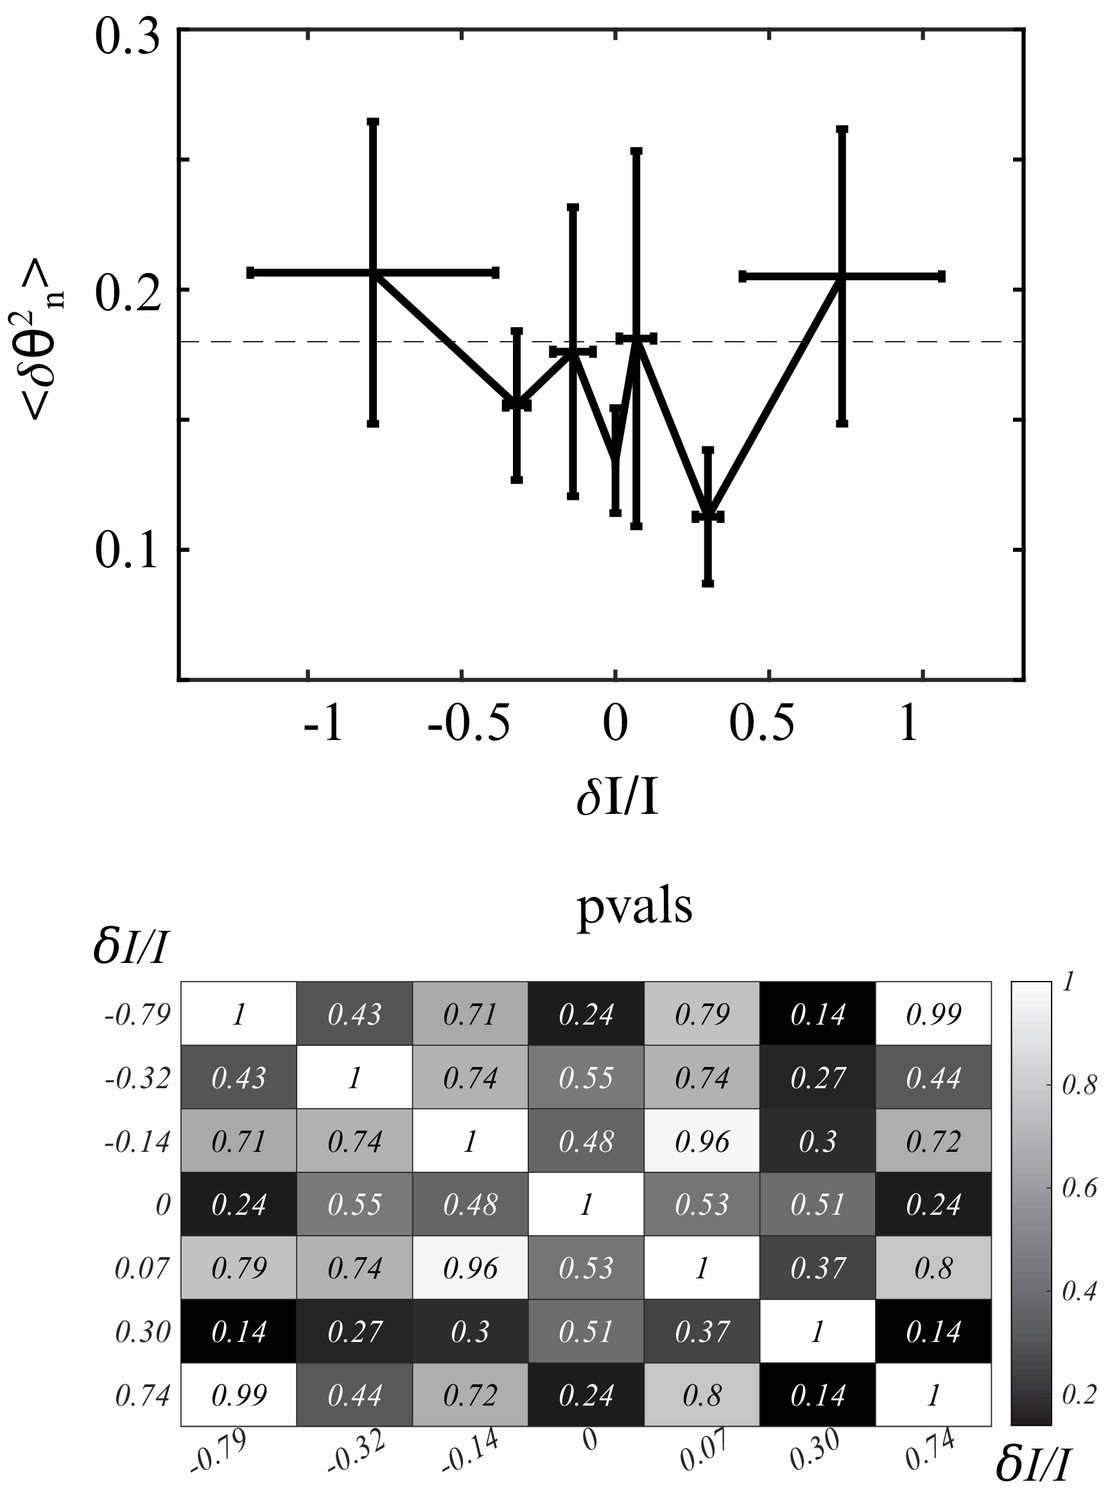
Control for retinal origin of klinotaxis.
Upper figure : Testing klinotaxis with spatially uniform illumination (orientational profile p2). N=12 enucleated zebrafish larvae. No significant change in variance of upon decrease of relative difference of intensity. Neutral conditions of control larvae represented with gray dashes. Lower figure : of two-sample t-tests of the distributions of in the different bins. None of the bins has a significantly different mean value from another.
Figure 4 with 1 supplement
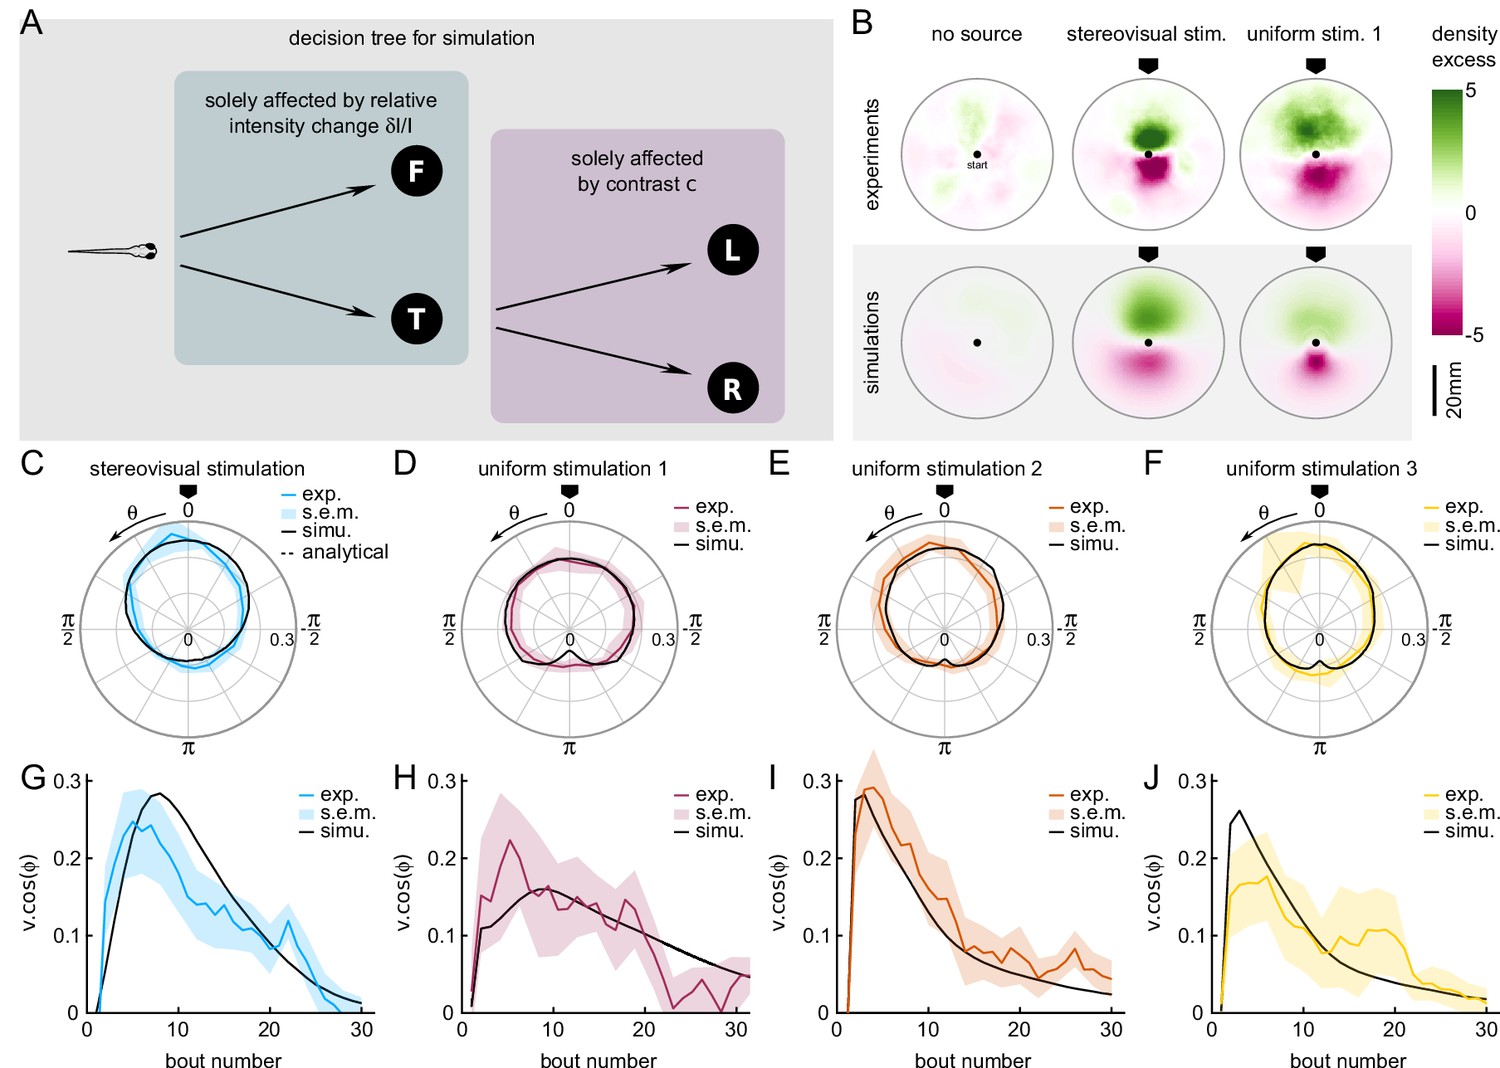
A Markov-chain model of phototaxis captures the observed orientational distribution.
(A) Decision tree for simulation: selection of forward scoots vs turning bouts are governed by the relative intensity change at the previous bout. If a turning bout is triggered, the selection of left-right orientation is biased by the stereovisual contrast. (B) 2D density profiles computed from all experimental and simulated trajectories for the three different paradigms (no stimulation, lateralized illumination and uniform illumination). The color encodes the excess or deficit of density with respect to the radially-averaged density without any stimulation. (C–F) Experimental (color) and simulation (solid line) probability density distributions of orientations for the four phototactic configurations (stereo-visual stimulation, uniform stimulation with angular profiles 1 to 3). (G–J) Evolution of the projection of the resultant vector onto the direction of the light source as a function of the bout number for the experiment (color) and simulation (solid line). Error bar : standard error of the mean.
Figure 4—figure supplement 1
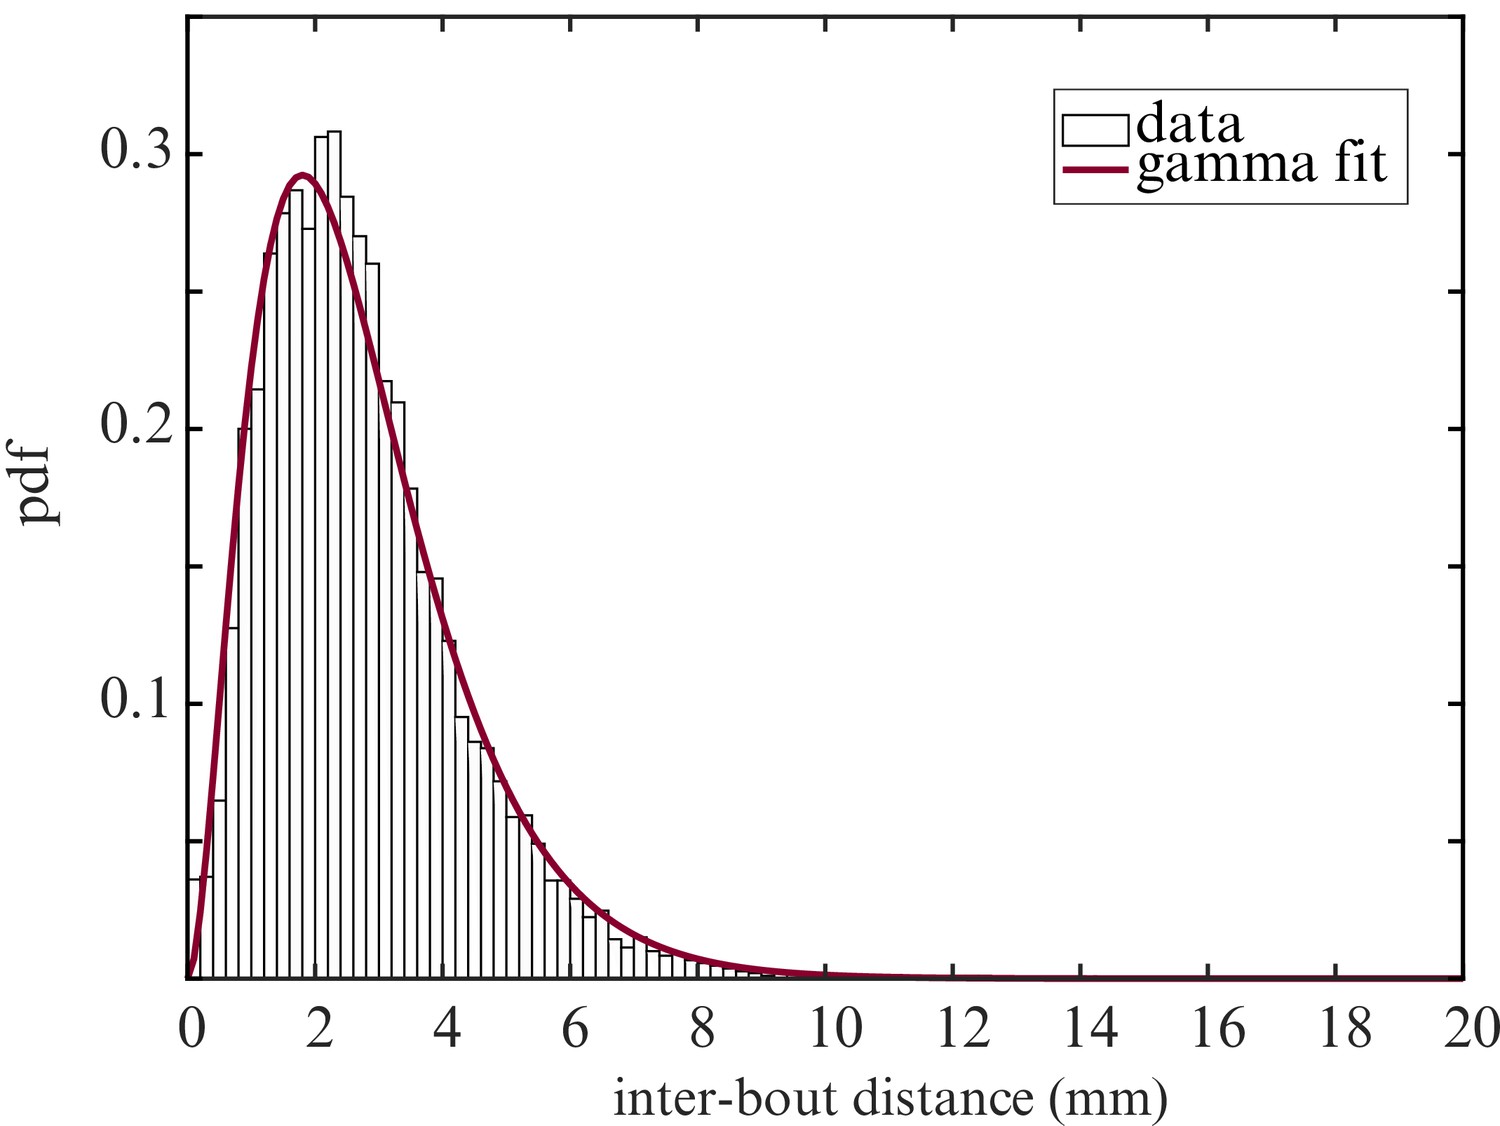
Inter-bout distance distribution.
Probability distribution function of the distance between two successive bouts. Fit : gamma distribution.
Figure 5 with 2 supplements
A neuronal model of turning bout selection captures spontaneous and contrast-driven navigation.
(A) Scheme of the Markov-chain model of the orientation selection, and corresponding neuronal model of the ARTR. The latter consists of two units whose relative activation controls the orientation of bouts. Persistent and self-alternating dynamics result from the recurrent excitation () and reciprocal inhibition () between each unit. They further receive input currents proportional to the illumination of the ipsilateral eye. (B) Top: example traces of the simulated activity of the left (red) and right (blue) modules in the absence visual stimulation (AU : arbitrary units). These continuous dynamics control the alternation between right and left orientational states. Close-up: forward and turning bouts are triggered independently with a statistics drawn from the behavioral recordings. The orientational state governs the orientation of the turning bouts. (C) Orientation correlation of turning bouts (thresholded at 0.22 rad) as a function of the inter-bout interval . Result from the neuronal model is in blue, experimental data are in black. (D) Mean reorientation as a function of the contrast . (E) Example traces of the simulated activity for a constant contrast . (F) Probability of flipping orientation as a function of the imposed contrast in situations of conflict or reinforcement (neuronal model). (G) Probability distribution function of for 10 simulated phototactic trajectories with a linear dependence of average reorientation on contrast. Each trajectory lasted 50,000 s. The dotted line is the orientational distribution in the absence of visual stimulation.
Figure 5—figure supplement 1
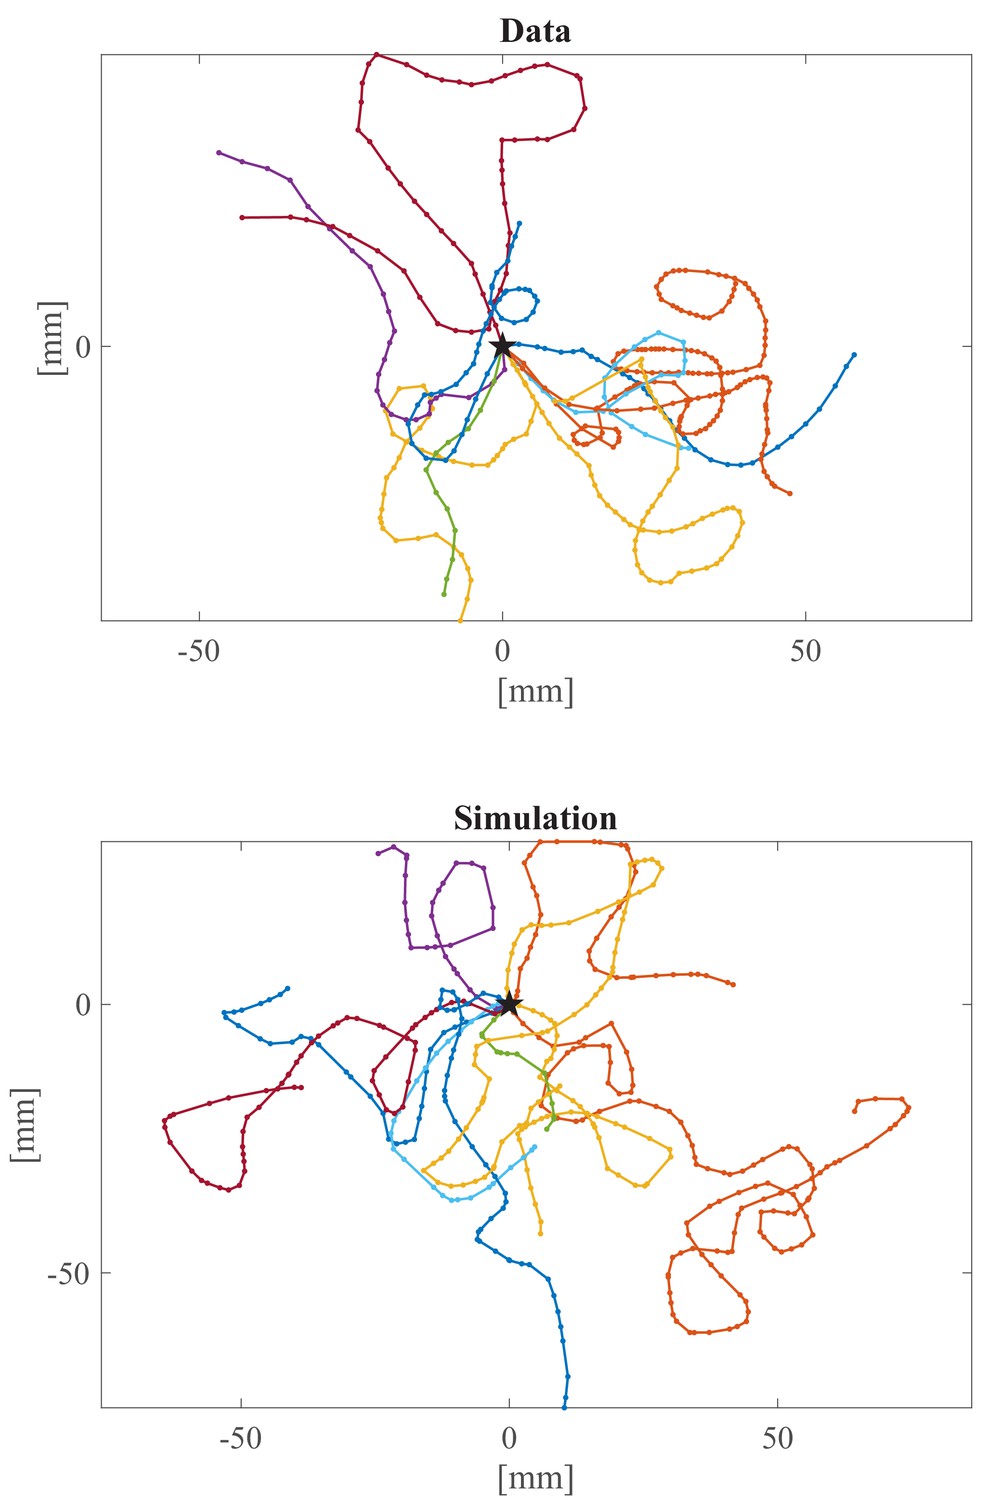
Comparison of experimental and simulated trajectories.
Examples of experimental and simulated (neuronal model) trajectories. The black star indicates the initial position of each trajectory. Each dot corresponds to one swim bout.
Figure 5—figure supplement 2
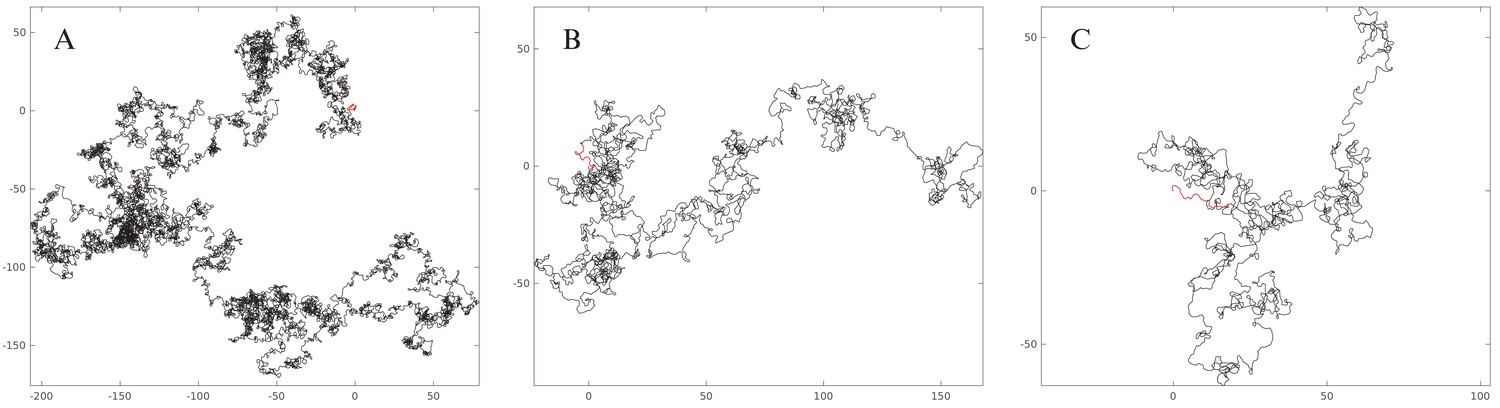
Simulated trajectories with different inter-bout intervals .
Examples of simulated trajectories with different inter-bout intervals displaying different fractal dimensions . Units : mm. (A) s, . (B) s, (C) s, . Red segments represent the onset of a sequence.
Additional files
Download links
A two-part list of links to download the article, or parts of the article, in various formats.
Downloads (link to download the article as PDF)
Open citations (links to open the citations from this article in various online reference manager services)
Cite this article (links to download the citations from this article in formats compatible with various reference manager tools)
From behavior to circuit modeling of light-seeking navigation in zebrafish larvae
eLife 9:e52882.
https://doi.org/10.7554/eLife.52882


