Structural basis for COMPASS recognition of an H2B-ubiquitinated nucleosome
- Johns Hopkins University School of Medicine, United States
Figures
Figure 1 with 4 supplements
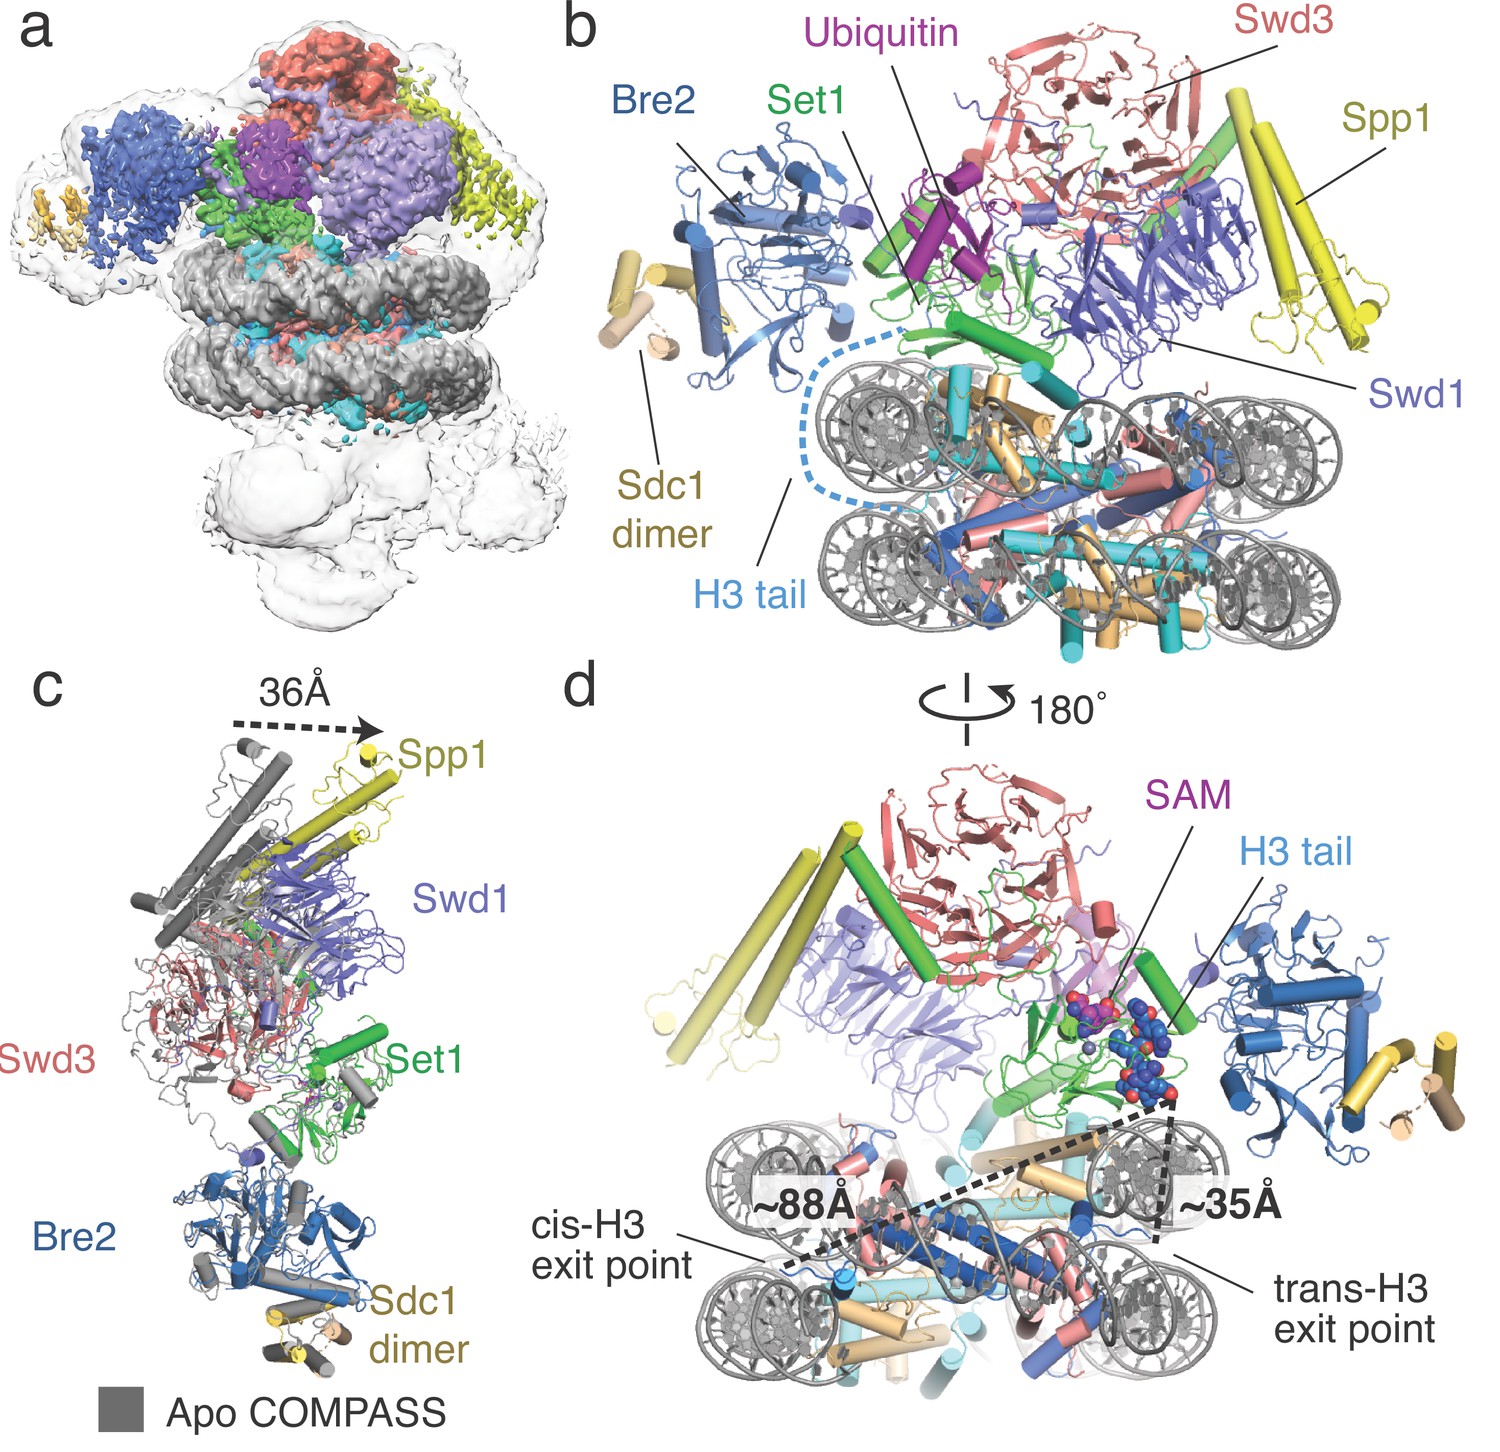
Architecture of the COMPASS H2B-Ub nucleosome complex.
(a) Cryo-EM structure of the COMPASS-nucleosome complex. The unsharpened EM density showing two COMPASS molecules bound to the nucleosome is depicted as a semitransparent surface. The sharpened EM density of the complex is depicted as an opaque surface and colored according to the different subunits of the complex. (b) The model of the COMPASS-nucleosome complex is shown and colored as in panel a. The unstructured histone H3 tail residues between the H3 exit point in the nucleosome and the Set1 active site are depicted as a blue dashed line. (c) Large-scale structural motions of COMPASS from the nucleosome-free state to the nucleosome-bound state. Free COMPASS (PDB: 6BX3) is colored gray and nucleosome-bound COMPASS is colored according to panel b. The largest motion in the structural transition at the end of Spp1 is shown as a black dashed arrow. (d) The COMPASS-nucleosome structure viewed from the dyad axis. The distances between the cis-H3 and trans-H3 subunits and the H3 residues in the Set1 active site are shown as dashed black lines.
Figure 1—figure supplement 1
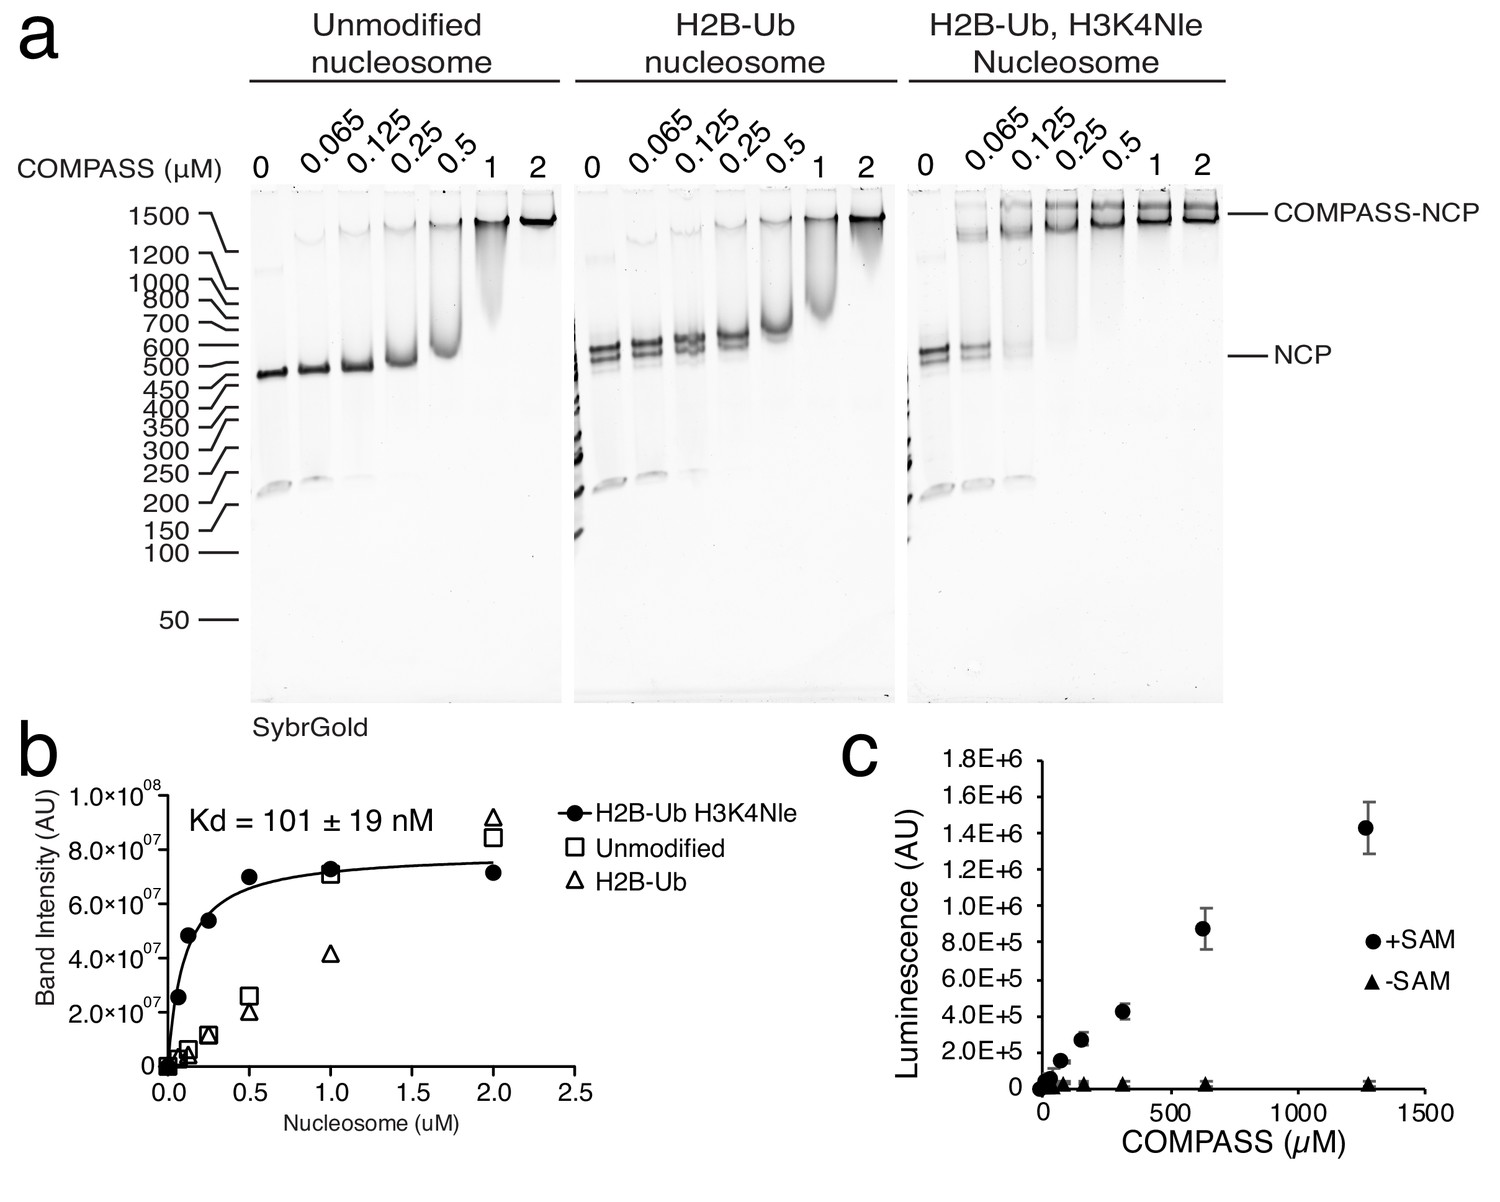
Analysis of COMPASS activty and binding to the nucleosome.
(a) Electrophoretic mobility shift assay (EMSA) showing COMPASS binding to different Nucleosome (NCP) variants. (b) Quantification of the EMSA shown in panel a. The binding interaction between COMPASS and the H2B-Ub, H3K4Nle nucleosome is fit to single site binding equation. (c) Activity of COMPASS toward an isolated H3 peptide with and without SAM in the reaction.
Figure 1—figure supplement 2
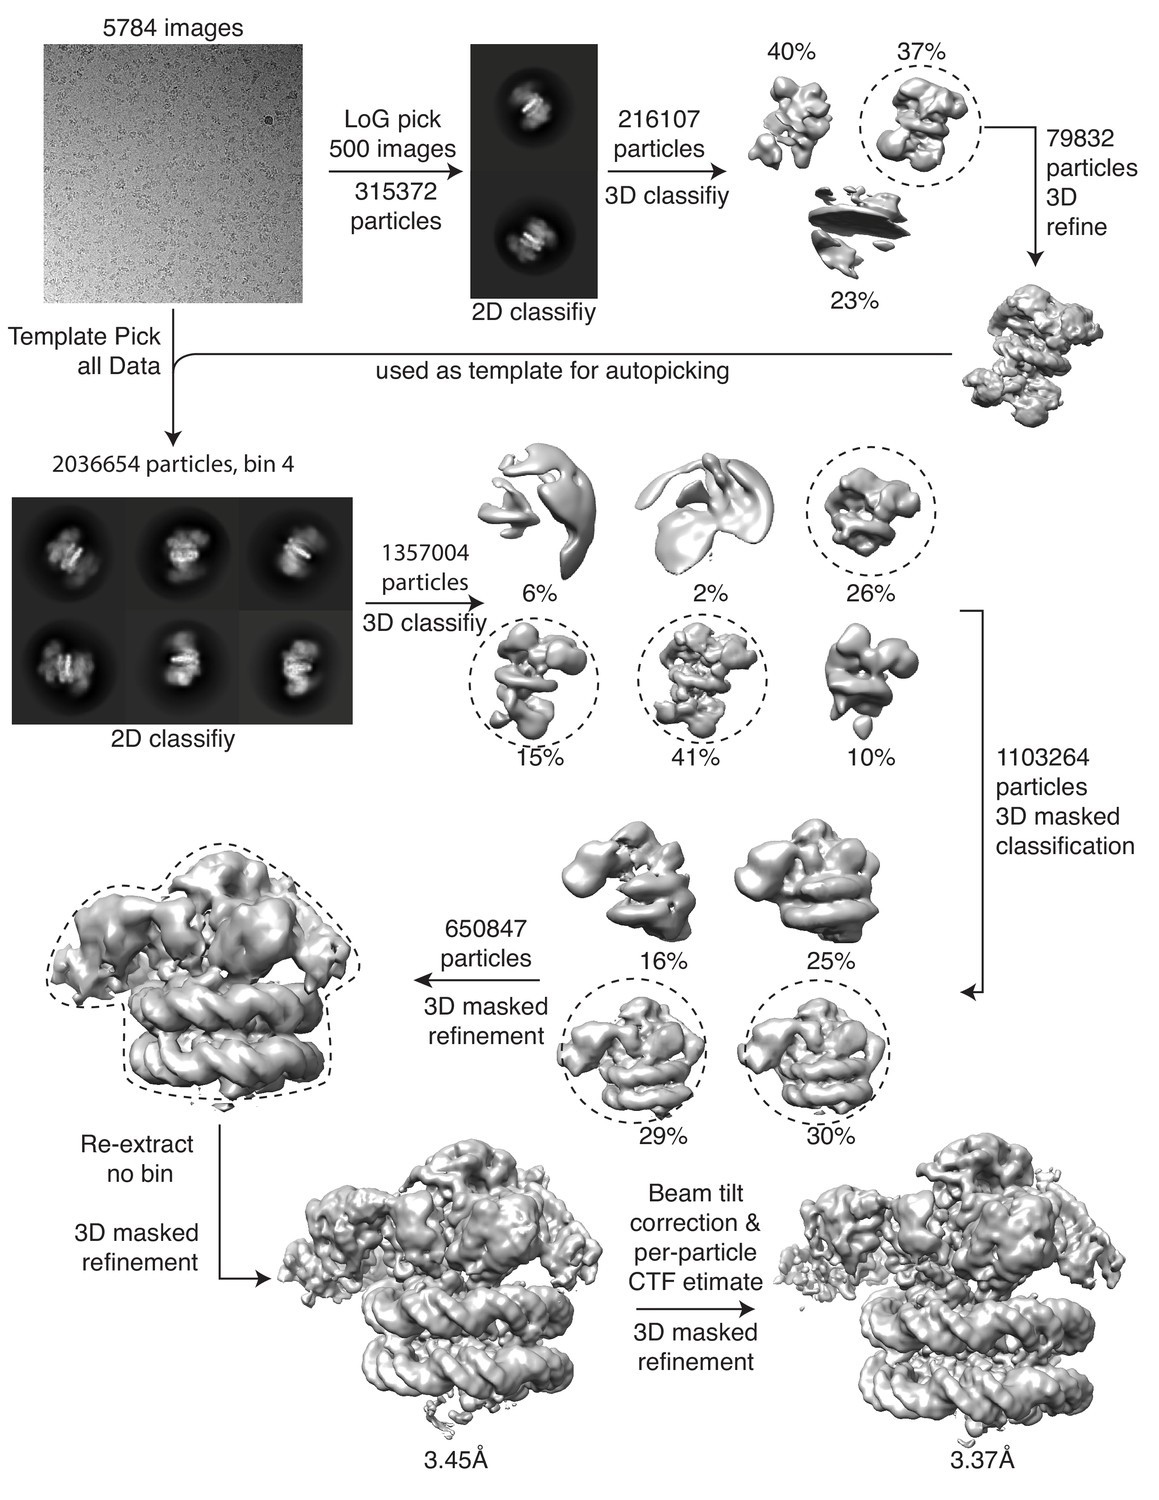
Cryo-EM processing pipeline.
Figure 1—figure supplement 3
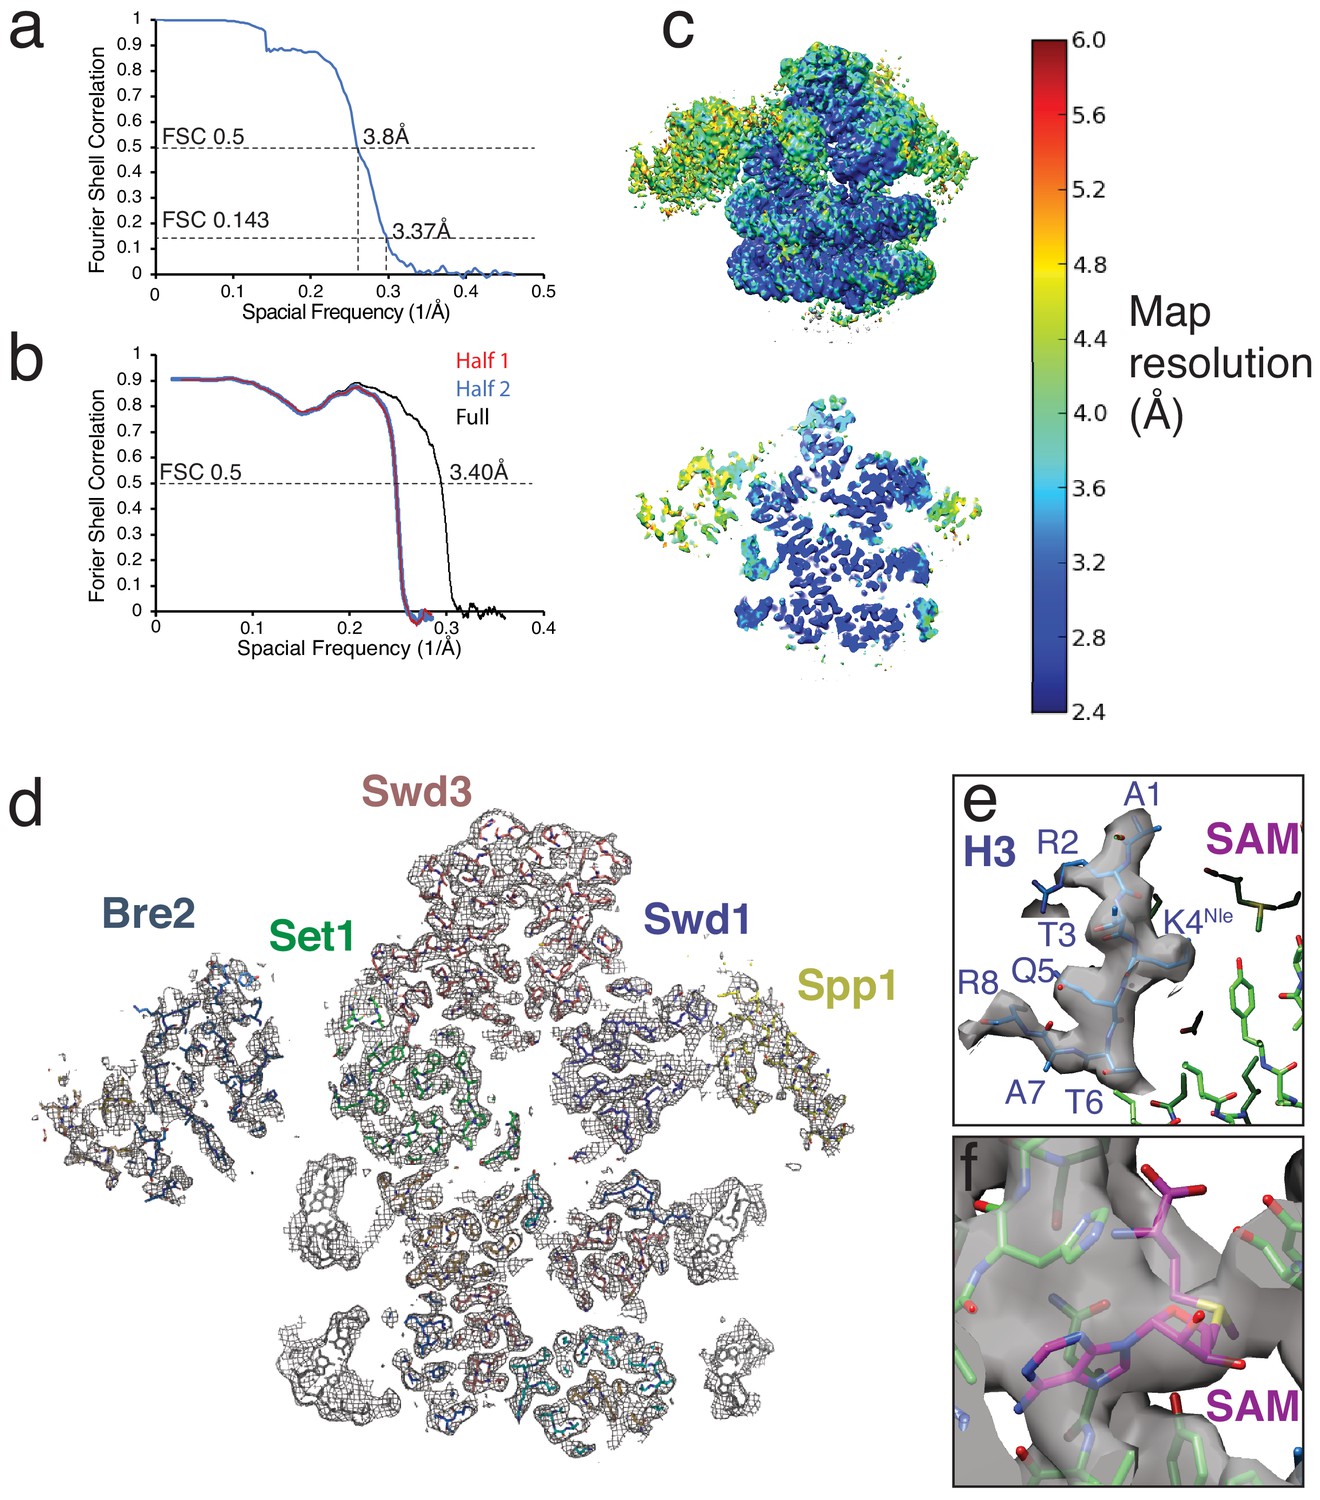
Cryo-EM map and model validation and example density.
(a) Fourier Shell Correlation (FSC) for the COMPASS-nucleosome structure. (b) Model-Map FSC curves calculated from the refined atomic coordinates and the full-map used for refinement (Full) and the half-maps used for validation (Half 1 and Half 2). (c) Local map resolution estimates calculated from ResMap (Kucukelbir et al., 2014) and colored according to local resolution. Top left, full sharpened map. Bottom left, a slice through the center of the map. (d) A vertical slice through the structure of COMPASS bound to the H2B-Ub nucleosome. All chains in the atomic model are shown as sticks and the EM density is shown as a gray mesh. (e) Example EM density around the H3 tail in the Set1 active site. (f) Example EM density for the SAM cofactor.
Figure 1—figure supplement 4
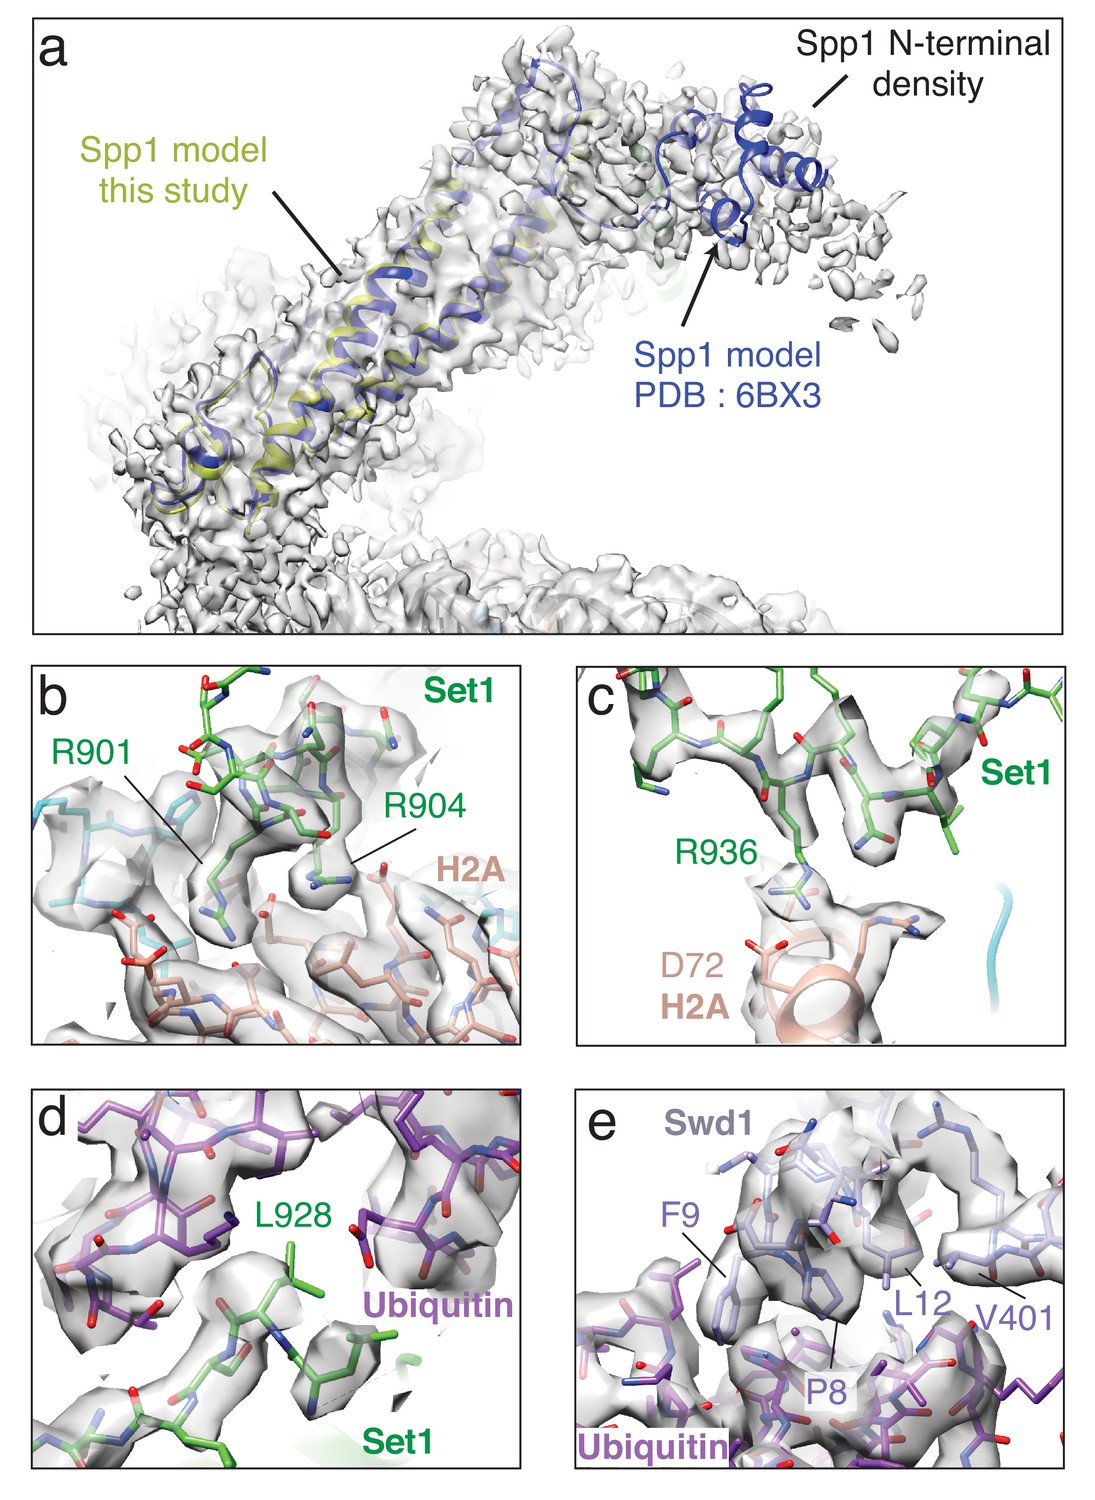
Detailed views of EM density in the structure.
In all panels the sharpened EM density is shown as a semi-transparent gray surface. (a) Superimposition of Spp1 from PDB: 6BX3 and Spp1 from this study. The fragmented EM density at the end of Spp1 corresponds N-terminal part of Spp1. (b) Detailed view of the contact between the Set1 RxxxRR helix and the H2A acidic patch. (c) Detailed view of the interaction between Set1 R936 and H2A D72. (d) Detailed view of the interaction between Set1 L928 and the Ubiquitin I36 patch. (e) Detailed view of the contact between Swd1 and the Ubiquitin I44 patch.
Figure 2
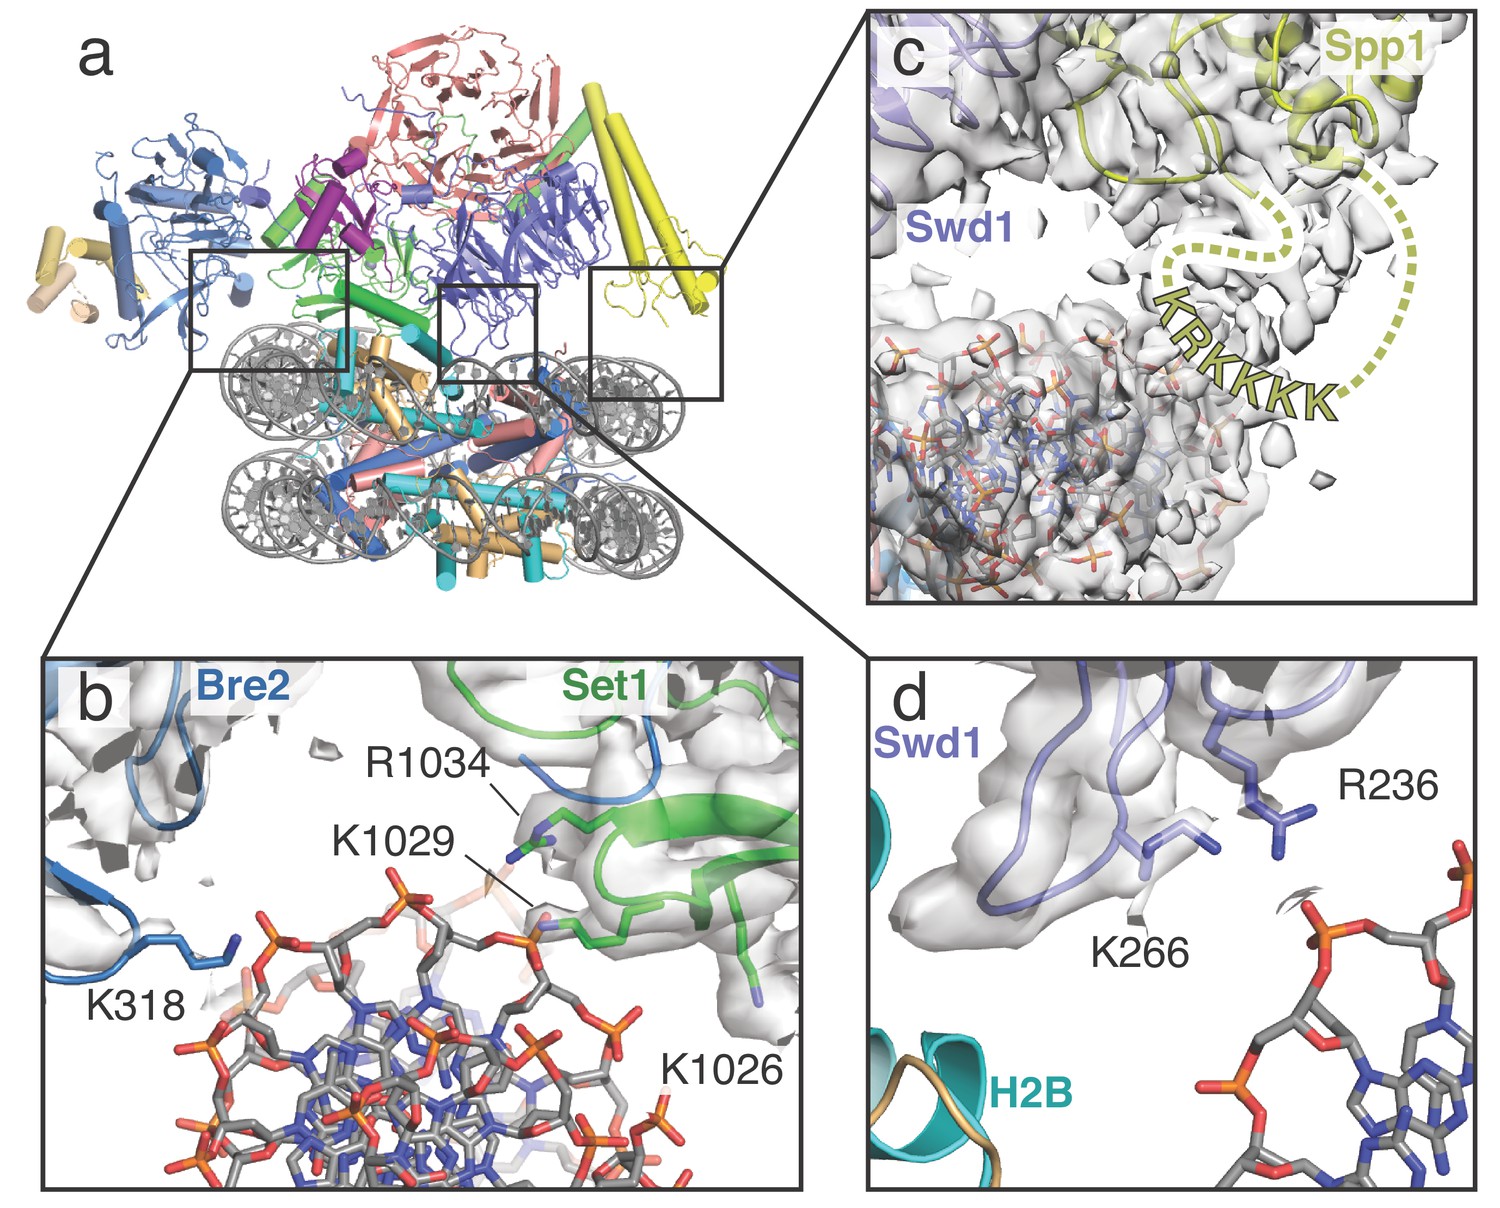
COMPASS makes multiple contacts with nucleosome DNA.
(a) Model of the COMPASS-nucleosome structure shown in cartoon representation and colored as in Figure 1. (b–d) Detailed views of COMPASS interactions with nucleosomal DNA. In all views the experimental EM density is shown as a semi-transparent gray surface. (b) DNA contact between Set1 and Bre2. Potential DNA-interacting COMPASS residues are shown in stick representation. (c) Contact between a flexible loop in Spp1 and the nucleosomal DNA. The unmodeled loop of Spp1 is depicted as a yellow dashed line and the positively charged, putative DNA-interacting residues in the loop are shown as yellow letters. (d) Interaction between Swd1 and the nucleosome DNA. Swd1 residues that contact DNA are shown in stick representation.
Figure 3 with 1 supplement
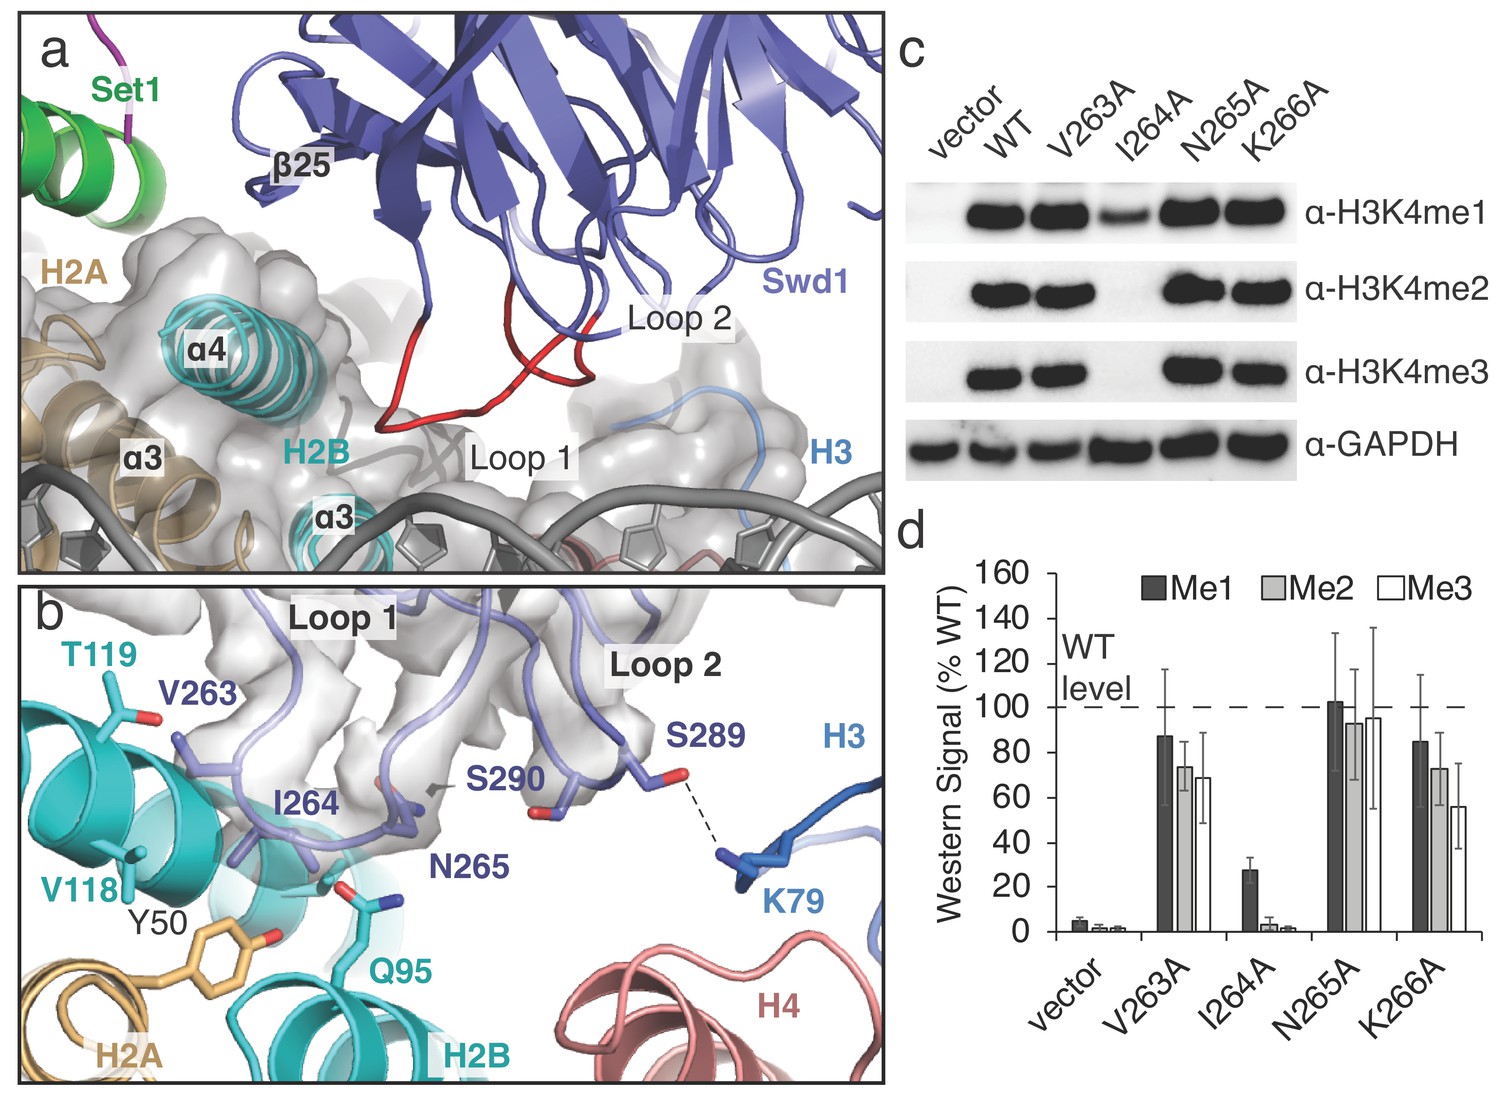
A conserved loop in Swd1 contacts the histone core.
(a) Close up view of the contact between Swd1 and the histone core. Swd1 is shown as a blue cartoon and the two loops that contact the histone core are colored red. (b) Detailed view of the specific contacts made between Loop 1 and Loop 2 of Swd1 and the histone core. Potential hydrogen bonds are shown as black dashed lines and the sharpened EM density is shown as a transparent gray surface. (c) Western blot analysis of H3K4 methylation states in swd1Δ yeast strains transformed with plasmids containing the indicated swd1 variants. (d) Quantification of the western blots from panel c. Error bars are the standard deviation of the data (n = 4).
-
Figure 3—source data 1
Western blot quantification for Swd1 Loop 1 mutants.
- https://cdn.elifesciences.org/articles/53199/elife-53199-fig3-data1-v2.xlsx
Figure 3—figure supplement 1
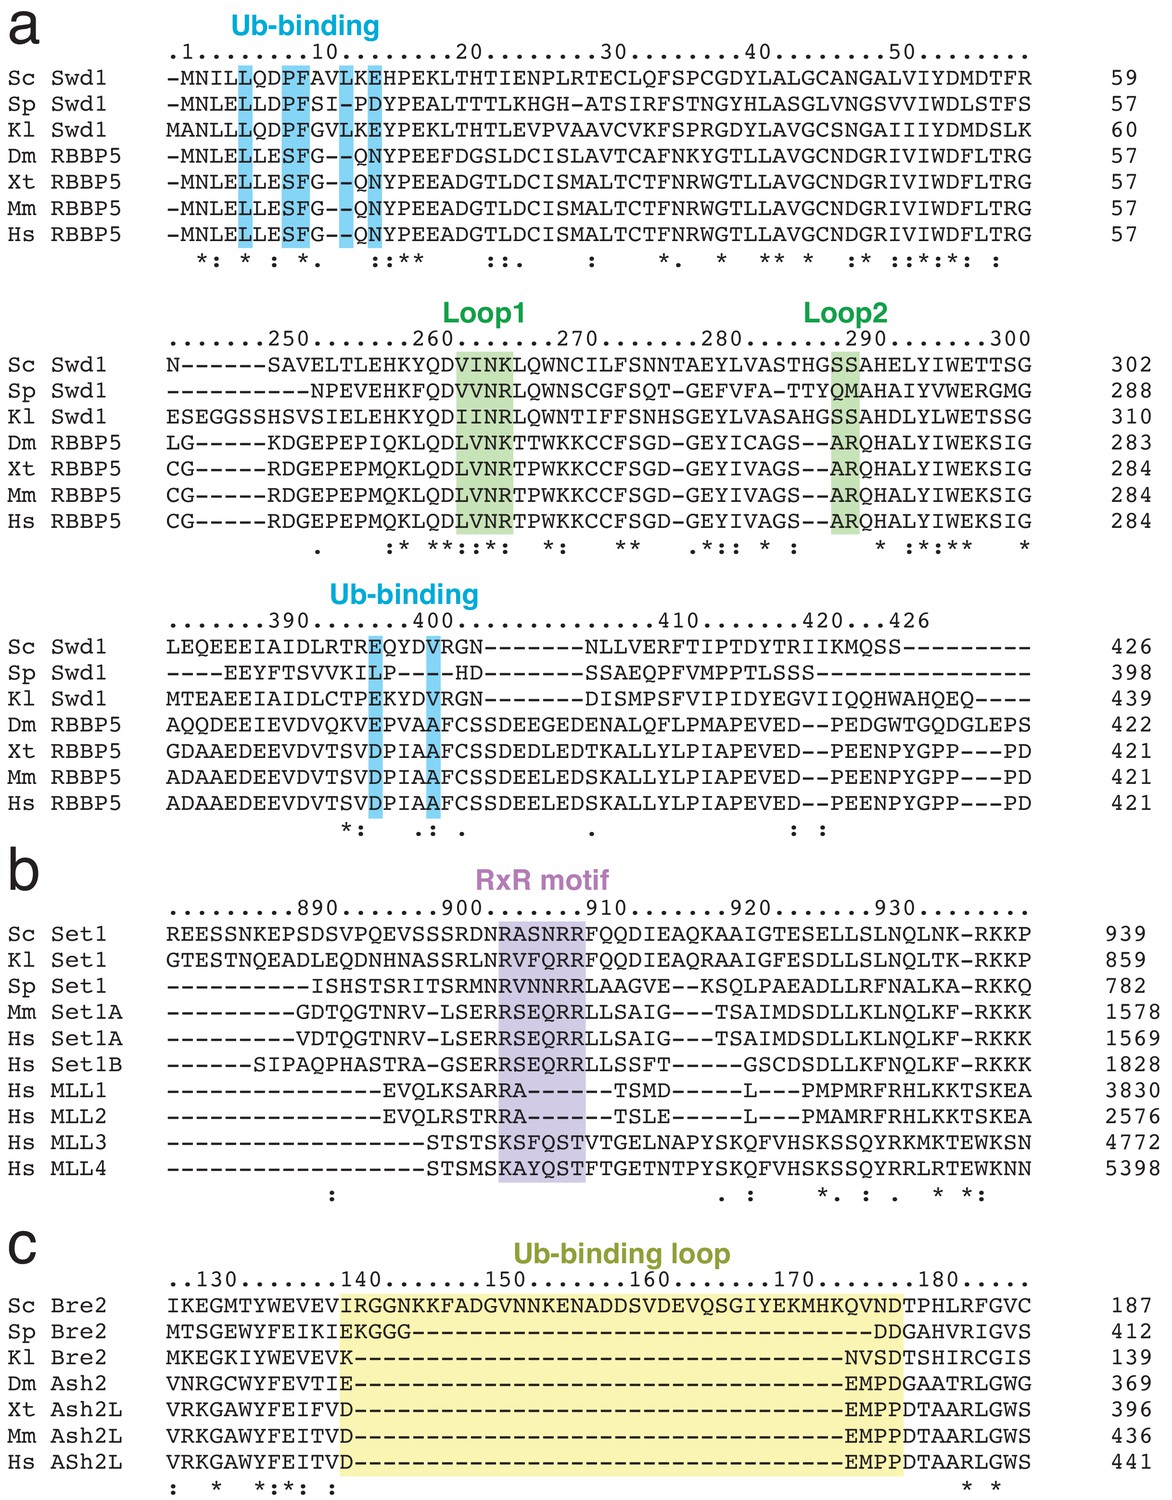
Multiple sequence alignments of Swd1, Set1 and Bre2.
(a–c) Multiple sequence alignments were generated using the Clustle Omega software (Sievers et al., 2011). Species names are abbreviated (Sc = Saccharomyces cerevisiae, Sp = Schizosaccharomyces pombe, Kl = Kluyveromyces lactis, Dm = Drosophila melanogaster, Xt = Xenopus tropicalis, Mm = Mus musculus, Hs = Homo sapiens). Important features from the COMPASS structure are highlighted. (a) Multiple sequence alignment of Swd1 and its homologs. (b) Multiple sequence alignment of Set1 and its homologs. (c) Multiple sequence alignment of Bre2 and its homologs.
Figure 4

The RxxxRR helix binds to the H2A/H2B acidic patch.
(a) The COMPASS-nucleosome structure with COMPASS subunits surrounded by semi-transparent colored surfaces. The RxxxRR helix passes underneath the H2B-linked ubiquitin and is shown in cartoon representation. (b) Cutaway view of the COMPASS nucleosome structure showing the RxxxRR helix passing between COMPASS and the nucleosome. (c) Sharpened EM density surrounding the RxxxRR helix, which is shown in stick representation. (d–e) End-on view (d) and side view (e) of the RxxxRR helix. Contacting residues between the RxxxRR helix and the H2A/H2B acidic patch are shown in stick representation. (f) Detailed view of the section of Set1 that undergoes a conformational change. The corresponding part of Set1 in the isolated COMPASS structure (PBD: 6BX3, Apo) is colored yellow and shown as a cartoon. The Set1 residues that make contacts with the histone core and Ubiquitin are shown in stick representation and colored green. (g) Western blot analysis of H3K4 methylation states in set1Δ yeast strains transformed with plasmids containing the indicated set1 variants. (h) Quantification of the western blots from panel g. Error bars are the standard deviation of the data (n = 3).
-
Figure 4—source data 1
Western blot quantification for Set1 RxxxRR helix mutants.
- https://cdn.elifesciences.org/articles/53199/elife-53199-fig4-data1-v2.xlsx
Figure 5

H2B-Ubiquitin recognition by different methyltransferases.
(a–c) Structures of H2B-ubiquitin activated methyltransferases bound to the H2B-Ub nucleosome. The structures are encompassed by a semitransparent gray surface, except for ubiquitin which is colored purple and depicted as a cartoon. Surface representations of the bound ubiquitin are shown on the right with the buried surface area colored red. The locations of the I44 and I36 patches are indicated with colored yellow and blue lines, respectively. (a) Structure of COMPASS bound the H2B-Ub nucleosome. (b) Structure of the MLL1 core complex bound to the H2B-Ub nucleosome (PDB: 6KIU). (c) Structure of Dot1L bound to the H2B-Ub nucleosome (PDB: 6NJ9). (d) Superimposition of the structures from a–c but only showing the ubiquitin to compare the relative positions of the H2B-linked Ubiquitin. H2B K120 is shown as spheres and colored blue.
Figure 6 with 1 supplement

Structural basis for COMPASS recognition of H2B-ub.
(a) Model of the COMPASS H2B-Ub nucleosome complex. The unsharpened EM density is shown as a semi-transparent gray surface. The connecting density between Bre2 and ubiquitin is shown. (b) Detailed view of the interactions made between Ubiquitin and Swd1 and Set1. Ubiquitin is enclosed in a semi-transparent pink surface and the interfacial residues are shown in stick representation. (c–d) Conformational changes in Swd1 that occur upon ubiquitin binding. The nucleosome-free (apo) structure of COMPASS is shown in gray (PDB: 6BX3). (c) Restructuring of the Swd1 C-terminal extension. (d) Restructuring of the Swd1 N-terminal extension. (e) Detailed view of Swd1 F9 interaction with ubiquitin. The sharpened EM density around Swd1 is shown as a semi-transparent gray surface and the EM density around ubiquitin is shown as a semi-transparent pink surface. (f) Detailed view of the interaction between Set1 L928 and ubiquitin. The sharpened EM density around Set1 is shown as a semi-transparent gray surface. (g) Western blot analysis of H3K4 methylation states in swd1Δ yeast strains transformed with plasmids containing the indicated swd1 variants. (h) Quantification of the western blots from panel g. Error bars are the standard deviation of the data (n = 4).
-
Figure 6—source data 1
Western blot quantification for Swd1 Ubiquitin-binding mutants.
- https://cdn.elifesciences.org/articles/53199/elife-53199-fig6-data1-v2.xlsx
Figure 6—figure supplement 1
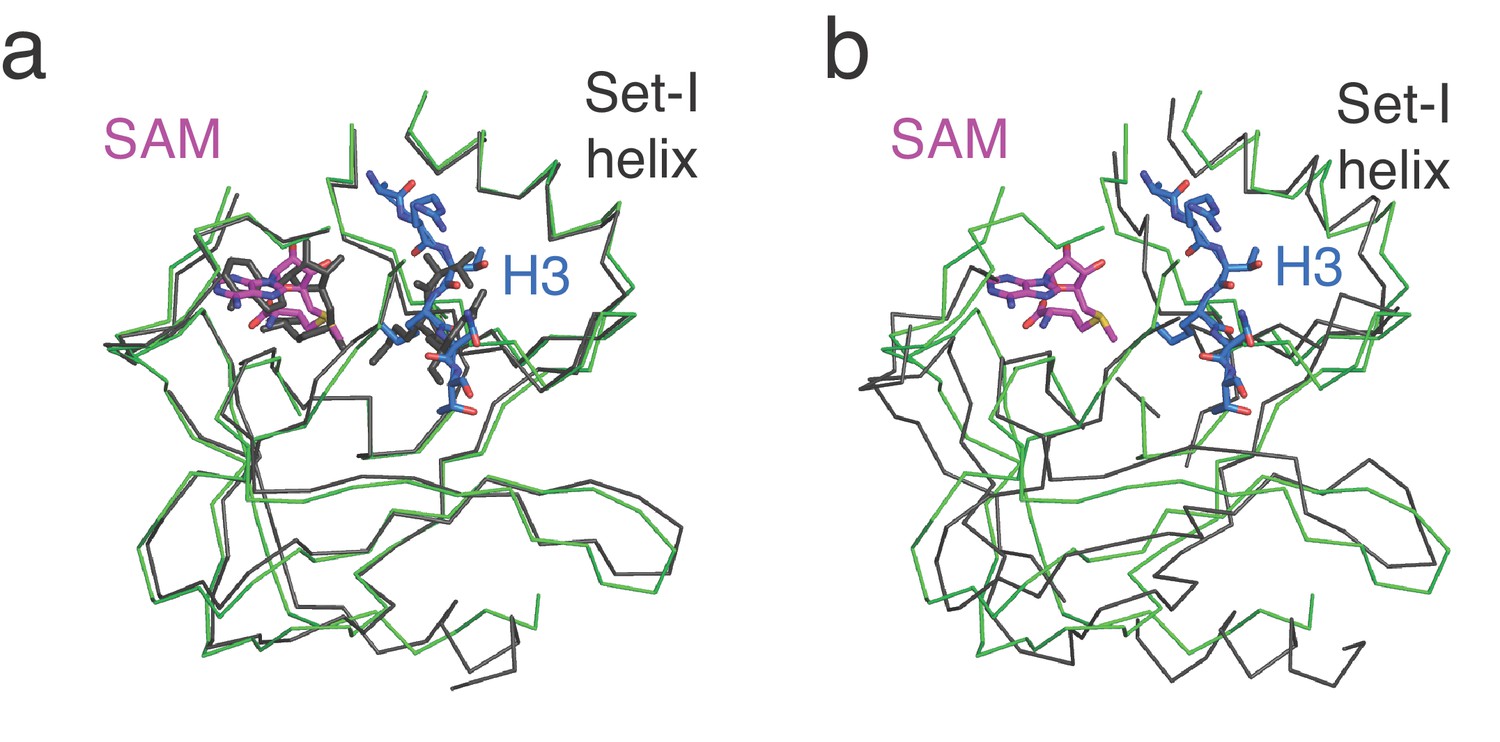
Comparison of Set1 catalytic domains from COMPASS in different states.
(a) Superimposition of the H2B-Ub nucleosome bound Set1 catalytic domain from S. cerevisiae (green) with the substrate bound, K. lactis Set1 catalytic domain from isolated COMPASS (PDB: 6CHG). (b) Superimposition of the H2B-Ub nucleosome bound Set1 catalytic domain from S. cerevisiae (green) with the substrate-free S. cerevisiae Set1 catalytic domain from isolated COMPASS (PDB: 6BX3).
Tables
Table 1
Cryo-EM data collection, refinement and validation statistics
| Complex between COMPASS and the H2B-Ub nucleosome (EMDB-21157) (PDB 6VEN) | |
|---|---|
| Data collection and processing | |
| Magnification | 81,000 |
| Voltage (kV) | 300 |
| Electron exposure (e–/Å2) | 50 |
| Defocus range (μm) | −1.0 to −2.5 |
| Pixel size (Å) | 1.08 |
| Symmetry imposed | C1 |
| Initial particle images (no.) | 2,036,654 |
| Final particle images (no.) | 179,588 |
| Map resolution (Å) FSC threshold | 3.37 (0.143) |
| Map resolution range (Å) | 999–3.37 |
| Refinement | |
| Initial model used (PDB code) | PDB: 6NJ9, 6BX3, 6CHG |
| Model resolution (Å) FSC threshold | 3.40 (0.5) |
| Model resolution range (Å) | 47.6 to 3.40 |
| Map sharpening B factor (Å2) | −122.6 |
| Model composition Non-hydrogen atoms Protein residues Ligands | 24,032 2271 2 |
| B factors (Å2) Protein Ligand | 102.57 113.31 |
| R.m.s. deviations Bond lengths (Å) Bond angles (°) | 0.004 0.696 |
| Validation MolProbity score Clashscore Poor rotamers (%) | 1.92 9.79 0.05 |
| Ramachandran plot Favored (%) Allowed (%) Disallowed (%) | 94.01 5.99 0.0 |
Key resources table
| Reagent type (species) or resource | Designation | Source or reference | Identifiers | Additional information |
|---|---|---|---|---|
| Strain, strain background (Saccharomyces cerevisiae) | Yeast strain BY4741 | (Baker Brachmann et al., 1998) | ||
| Antibody | Anti-Histone H3 (mono-methyl K4) polyclonal | Abcam | Abcam Cat# ab8895, RRID:AB_306847 | WB (1:500) |
| Antibody | Anti-Histone H3 (di-methyl K4) polyclonal | Abcam | Abcam Cat# ab7766, RRID:AB_2560996 | WB (1:500) |
| Antibody | Anti-Histone H3 (tri-methyl K4) polyclonal | Abcam | Abcam Cat# ab8580, RRID:AB_306649 | WB (1:500) |
| Antibody | Anti-GAPDH monoclonal | Abcam | Abcam Cat# ab125247, RRID:AB_11129118 | WB (1:2000) |
| Recombinant DNA reagent | pEW106 | This Study | pQE-81L: H3 K4M | |
| Recombinant DNA reagent | pEW66 | This Study | COMPASS expression plasmid pBIG1a containing Bre2, Swd1, Swd2, Sdc1 and Sgh1 | |
| Recombinant DNA reagent | pEW107 | This Study | COMPASS expression plasmid pBIG1b containing 6xHis-3xFLAG-Set1(762–1080), Swd3 and twin-strep-Spp1. | |
| Recombinant DNA reagent | pEW108 | This Study | COMPASS expression plasmid pBIG1ab containing all COMPASS subunits. | |
| Recombinant DNA reagent | WT Set1 | This Study | pEW111 pRS415: WT Set1 | |
| Recombinant DNA reagent | WT Swd1 | This Study | pEW113 pRS415: WT Swd1 | |
| Recombinant DNA reagent | Set1(R936A) | This Study | pEW118 pRS415: Set1(R936A) | |
| Recombinant DNA reagent | Set1(R936E) | This Study | pEW120 pRS415: Set1(R936E) | |
| Recombinant DNA reagent | Set1(R901A) | This Study | pEW123 pRS415: Set1(R901A) | |
| Recombinant DNA reagent | Set1(R904A) | This Study | pEW124 pRS415: Set1(R904A) | |
| Recombinant DNA reagent | Set1(R908A) | This Study | pEW125 pRS415: Set1(R908A) | |
| Recombinant DNA reagent | Set1(R909A) | This Study | pEW126 pRS415: Set1(R909A) | |
| Recombinant DNA reagent | Set1(R901A, R904A, R908A, R909A) | This Study | pEW127 pRS415: Set1(R901A, R904A, R908A, R909A) | |
| Recombinant DNA reagent | Set1(R901E) | This Study | pEW128 pRS415: Set1(R901E) | |
| Recombinant DNA reagent | Set1(R904E) | This Study | pEW129 pRS415: Set1(R904E) | |
| Recombinant DNA reagent | Set1(R908E) | This Study | pEW130 pRS415: Set1(R908E) | |
| Recombinant DNA reagent | Set1(R909E) | This Study | pEW131 pRS415: Set1(R909E) | |
| Recombinant DNA reagent | Set1(R901E, R904E, R908E, R909E) | This Study | pEW132 pRS415: Set1(R901E, R904E, R908E, R909E) | |
| Recombinant DNA reagent | Swd1(L12A) | This Study | pEW139 pRS415: Swd1(L12A) | |
| Recombinant DNA reagent | Swd1(E14R) | This Study | pEW140 pRS415: Swd1(E14R) | |
| Recombinant DNA reagent | Swd1(E14A) | This Study | pEW141 pRS415: Swd1(E14A) | |
| Recombinant DNA reagent | Swd1(F9A, L12A, E14A) | This Study | pEW142 pRS415: Swd1(F9A, L12A, E14A) | |
| Recombinant DNA reagent | Swd1(E397R) | This Study | pEW144 pRS415: Swd1(E397R) | |
| Recombinant DNA reagent | Swd1(V263A) | This Study | pEW145 pRS415: Swd1(V263A) | |
| Recombinant DNA reagent | Swd1(I264A) | This Study | pEW146 pRS415: Swd1(I264A) | |
| Recombinant DNA reagent | Swd1(N265A) | This Study | pEW147 pRS415: Swd1(N265A) | |
| Recombinant DNA reagent | Swd1(K266A) | This Study | pEW148 pRS415: Swd1(K266A) | |
| Commercial assay or kit | MTase-Glo | Promega | V7601 |
Additional files
Download links
A two-part list of links to download the article, or parts of the article, in various formats.
Downloads (link to download the article as PDF)
Open citations (links to open the citations from this article in various online reference manager services)
Cite this article (links to download the citations from this article in formats compatible with various reference manager tools)
Structural basis for COMPASS recognition of an H2B-ubiquitinated nucleosome
eLife 9:e53199.
https://doi.org/10.7554/eLife.53199


