Identification of a super-functional Tfh-like subpopulation in murine lupus by pattern perception
- German Rheumatism Research Center (DRFZ), A Leibniz Institute, Germany
- University of Potsdam, Germany
- Charité, Campus Mitte, Germany
Figures
Figure 1
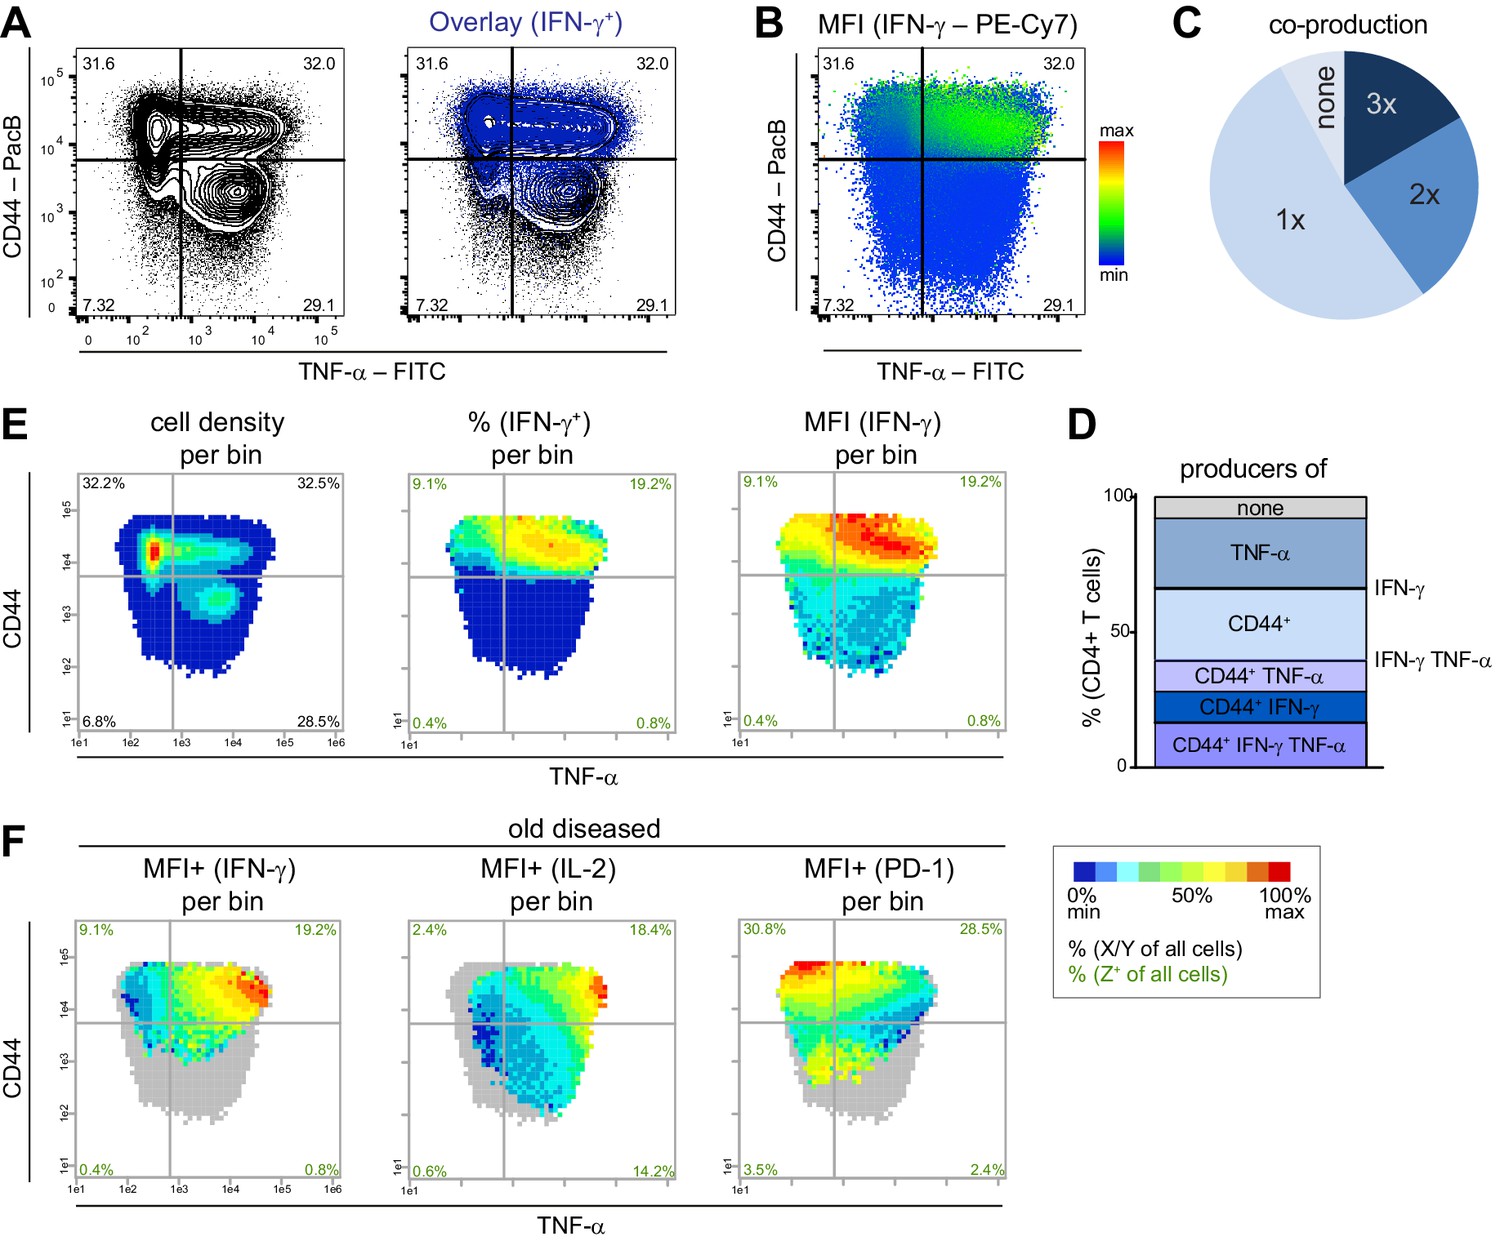
PRI allows the visualization of the combinatorial protein expression.
Flow cytometry data from stimulated (PMA/ionomycin) splenic T cells from NZBxW mice were analyzed either conventionally or by bin plots. (A) Overlay of IFN-γ+ cells on all T cells. (B) FlowJo‘s color maps showing MFI of IFN-γ. (C, D) Frequencies of the co-production of TNF-α, CD44+ and IFN-γ are depicted as categories (C) and as individual combinations (D). (E) For bin plots, the x-y-plane of TNF-α and CD44 is divided into small, equally sized bins (asinh = 0.2). If a bin contains the minimum number of cells (10), a statistical feature is calculated such as cell density (left), frequency (middle) or MFI (right) of IFN-γ. The scale of the feature is represented as a pseudo-color code. (F) Relative mean expression level per bin (MFI+) of IFN-γ only in IFN-γ producing cells (left), of IL-2 in IL-2+ (middle) and PD-1 in PD-1+ cells (right). Grey bins contain less than 10 Z+ cells. Data represent one old diseased mouse (A–F). (E, F) Cell frequencies per quadrant are calculated from the number of cells per sample (black) and number of Z+ cells per sample (green). Data represent three independent experiments with (C, E) n = 4 mice per group.
-
Figure 1—source data 1
Figure 1C,D: Frequencies of double and single producers.
- https://cdn.elifesciences.org/articles/53226/elife-53226-fig1-data1-v2.xlsx
Figure 2 with 3 supplements
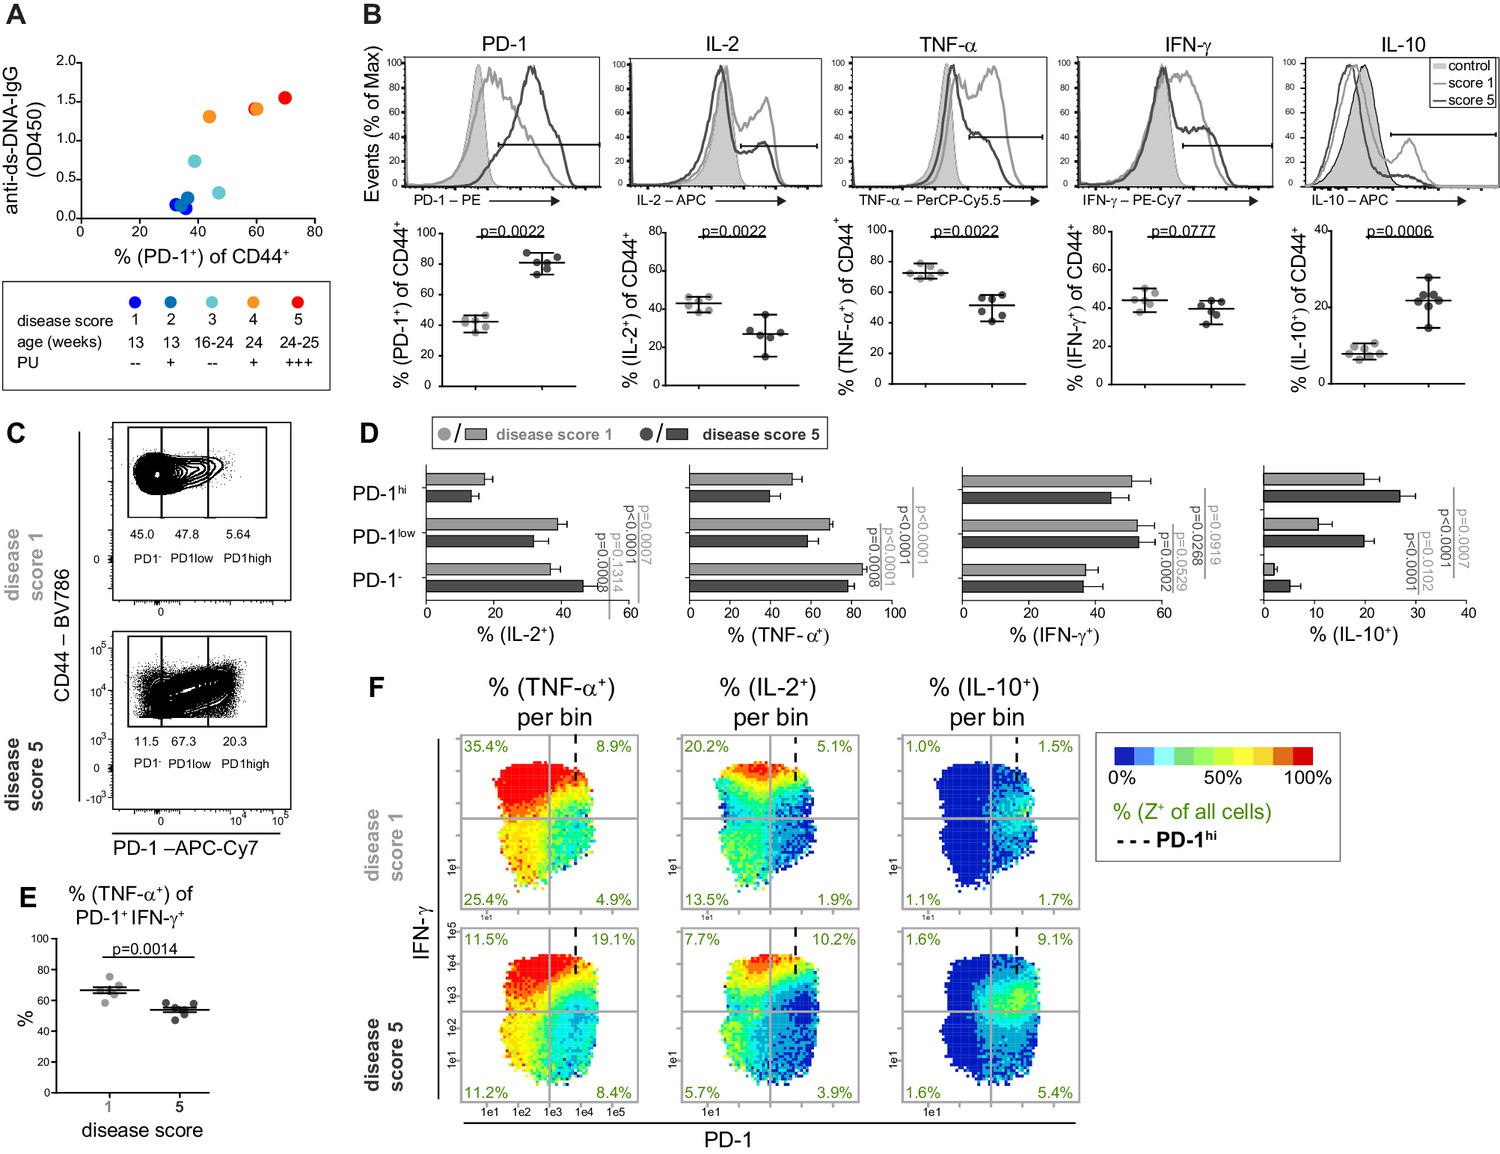
The cytokine co-expression is altered in PD-1+ T cells in young and old mice.
(A) Disease status of NZBxW mice was scored according to their age and proteinuria (PU). The disease score was correlated with the frequencies of PD-1+ T cells and serum levels of anti-ds-DNA-IgG antibodies. (B) Disease-associated changes of the protein expression shown by histogram overlays (top) and statistical analyses (bottom). (C) Representative gating scheme of PD-1-, PD-1low and PD-1hi subpopulations in CD4+ CD44+ T cells from mice of disease score 1 and 5, respectively. (D) Statistical analyses of the frequencies of IL-2, TNF-α, IFN-γ and IL-10 producers in PD-1 subpopulations from mice with disease score of 1 (light grey) and 5 (dark grey). (E) Frequencies of TNF-α + cells of the PD-1+ IFN-γ+ subpopulation in disease score 1 and 5. (F) Representative bin plots of disease score 1 and 5 with PD-1 (x-axis), IFN-γ (y-axis) displaying the frequencies of TNF-α, IL-2 and IL-10, respectively, per bin. Cut-off for PD-1hi cells is marked with dashed lines. Data represent two independent experiments with (A), n = 2 mice for each score, (B– F) n = 6–7 mice per group. Samples were compared using the Mann Whitney test (B), a repeated measure two-way ANOVA with Geisser-Greenhouse correction and Dunnett‘s multiple comparison test (D) and a two-sided unpaired t-test (E). Data are presented as the mean ± SEM.
-
Figure 2—source data 1
Figure 2A: Serum levels of anti-ds-DNA-IgG vs. PD-1 frequency.
- https://cdn.elifesciences.org/articles/53226/elife-53226-fig2-data1-v2.xlsx
-
Figure 2—source data 2
Figure 2B: Frequencies of protein expression of mice in disease score 1 and 5, respectively.
Data represent two independent experiments with n = 6 or seven mice per group.
- https://cdn.elifesciences.org/articles/53226/elife-53226-fig2-data2-v2.xlsx
-
Figure 2—source data 3
Figure 2D: Frequencies of IL-2, TNF-α, IFN-γ and IL-10 producers in PD-1 subpopulations of mice in disease score 1 and 5, respectively.
Data represent two independent experiments with n = 7 mice per group.
- https://cdn.elifesciences.org/articles/53226/elife-53226-fig2-data3-v2.xlsx
-
Figure 2—source data 4
Figure 2E: Frequencies of TNF-α cells of the PD-1+ IFN-γ+ subpopulation in mice of disease score 1 and 5, respectively.
Data represent two independent experiments with n = 5 mice per group.
- https://cdn.elifesciences.org/articles/53226/elife-53226-fig2-data4-v2.xlsx
Figure 2—figure supplement 1
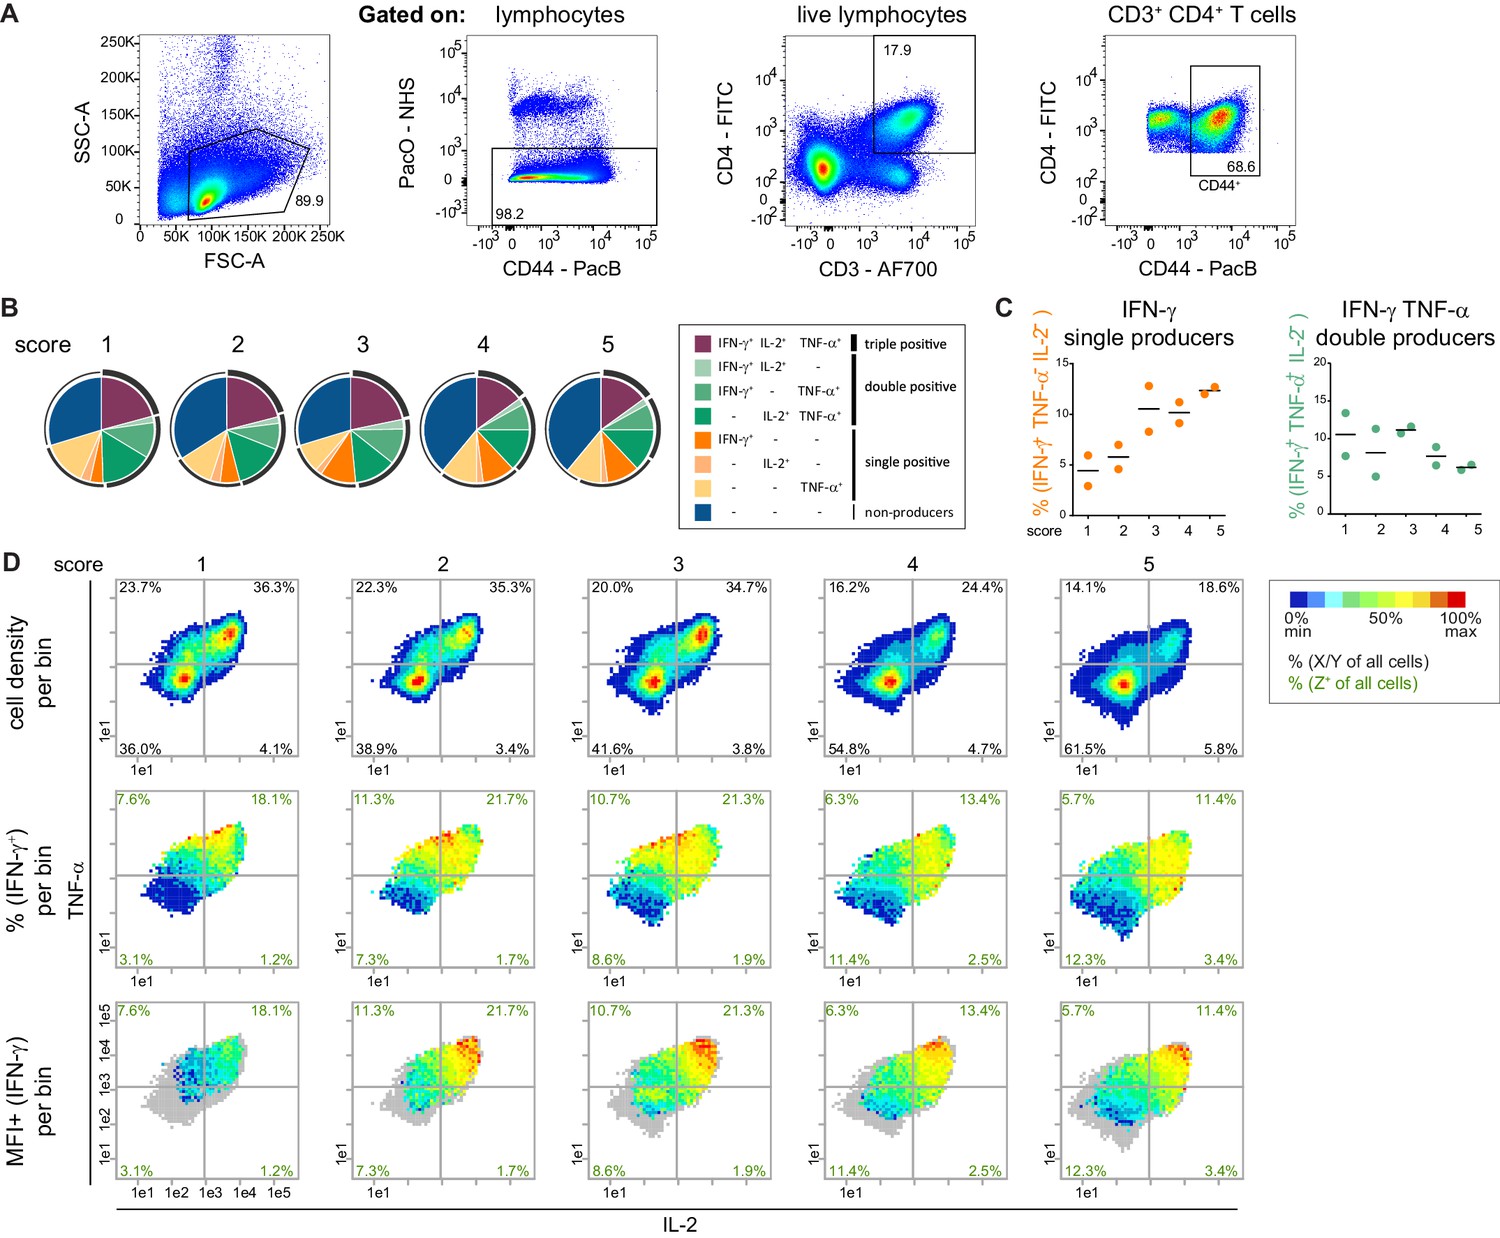
The combinatorics of the co-expression of IFN-γ, TNF-α and IL-2 in CD44+ T cells is altered with disease progression.
(A) Gating strategy to identify CD44+ CD4+ T cells. (B–D) Quantification of cytokine co-expression in disease stages by pie charts (B), bar plots (C) and bin plots (D). Bin plots visualize density (top row), frequency of IFN-γ producers (middle row) and expression level of IFN-γ (MFI+, bottom row). (D) To compare IFN-γ expression levels, a common scaling was used to depict the MFI+ (IFN-γ) for all disease scores (1–5) together. Cell frequencies per quadrant are calculated on the number of cells per sample (black) and number of Z+ cells per sample (green). Grey bins contain less than 10 Z+ cells. Data represent one experiment with PMA/ionomycin stimulated splenic T cells: (B–D), n = 2 mice per group. Data are presented as mean in (C).
-
Figure 2—figure supplement 1—source data 1
Figure 2—figure supplement 1B: Frequencies of boolean combinations of the co-expression of cytokines in mice of disease score 1 to 5.
Data represent one experiment with PMA/ionomycin stimulated splenic T cells: n = 2 mice per group.
- https://cdn.elifesciences.org/articles/53226/elife-53226-fig2-figsupp1-data1-v2.xlsx
Figure 2—figure supplement 2
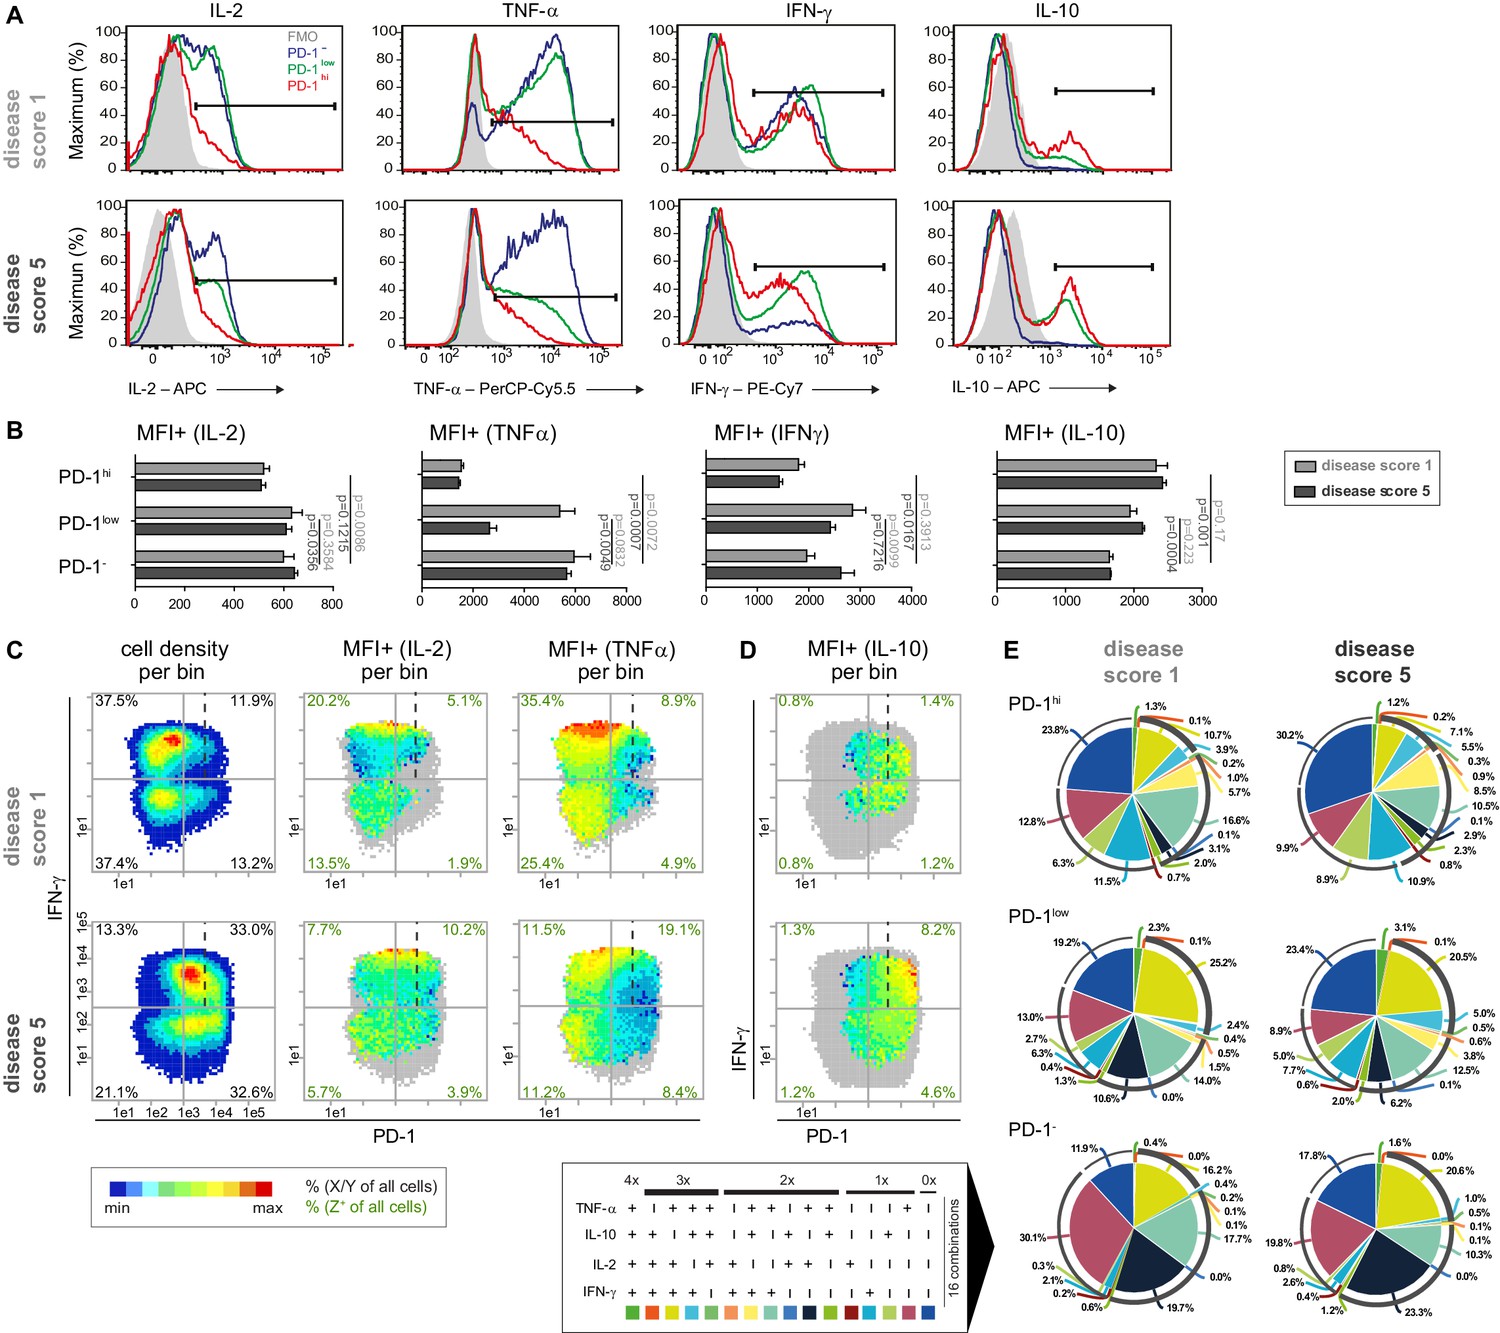
PD-1+ T cells exhibit differential cytokine expression levels compared to PD-1- T cells in young and old diseased mice.
(A) Representative histogram overlays for disease score 1 (top) and 5 (bottom) showing the cytokine expression in the PD-1 subgroups. Controls are colored in grey. (B) Barplots with mean fluorescence intensities (MFI) of IL-2, TNF-α, IFN-γ and IL-10 per PD-1 subpopulation in disease score 1 and 5. (C, D) Bin pots for CD44+ T cells of disease score 1 (top) and 5 (bottom) with PD-1 (x-axis), IFN-γ (y-axis) show cell density and MFI+ of TNF-α, IL-2 (C) and IL-10 producing cells (D). (D) To analyze IL-10 expression level, files of four samples were concatenated for both disease scores. The MFI range in (C, D) was normalized between the two scores, but determined individually for each cytokine. PD-1hi cut-off is marked with dashed lines. Cell frequencies per quadrant are calculated on the number of cells per sample (black) and number of Z+ cells per sample (green). Grey bins contain less than 10 Z+ cells. (E) Pie charts representing the boolean combinations of the co-expression of IL-2, TNF-α, IFN-γ and IL-10 in PD-1 subpopulations in disease score 1 and 5, respectively. Data represent two independent experiments with (A, C), n = 6 mice per group, (B), n = 4 mice per group, and (E), n = 7 mice per group. (B) Samples were compared using a repeated measure two-way ANOVA with Geisser-Greenhouse correction and Dunnett‘s multiple comparison test. Data are presented as the mean ± s.e.m.
-
Figure 2—figure supplement 2—source data 1
Figure 2—figure supplement 2B: Mean fluorescence intensity in PD-1 subpopulations of mice in disease score 1 and 5, respectively.
Data represent two independent experiments with n = 4 mice per group.
- https://cdn.elifesciences.org/articles/53226/elife-53226-fig2-figsupp2-data1-v2.xlsx
-
Figure 2—figure supplement 2—source data 2
Figure 2—figure supplement 2E: Frequencies of boolean combinations of the co-expression of IL-2, TNF-α, IFN-γ and IL-10 in PD-1 subpopulations in disease score 1 and 5, respectively.
Data represent two independent experiments with n = 7 mice per group.
- https://cdn.elifesciences.org/articles/53226/elife-53226-fig2-figsupp2-data2-v2.xlsx
Figure 2—figure supplement 3
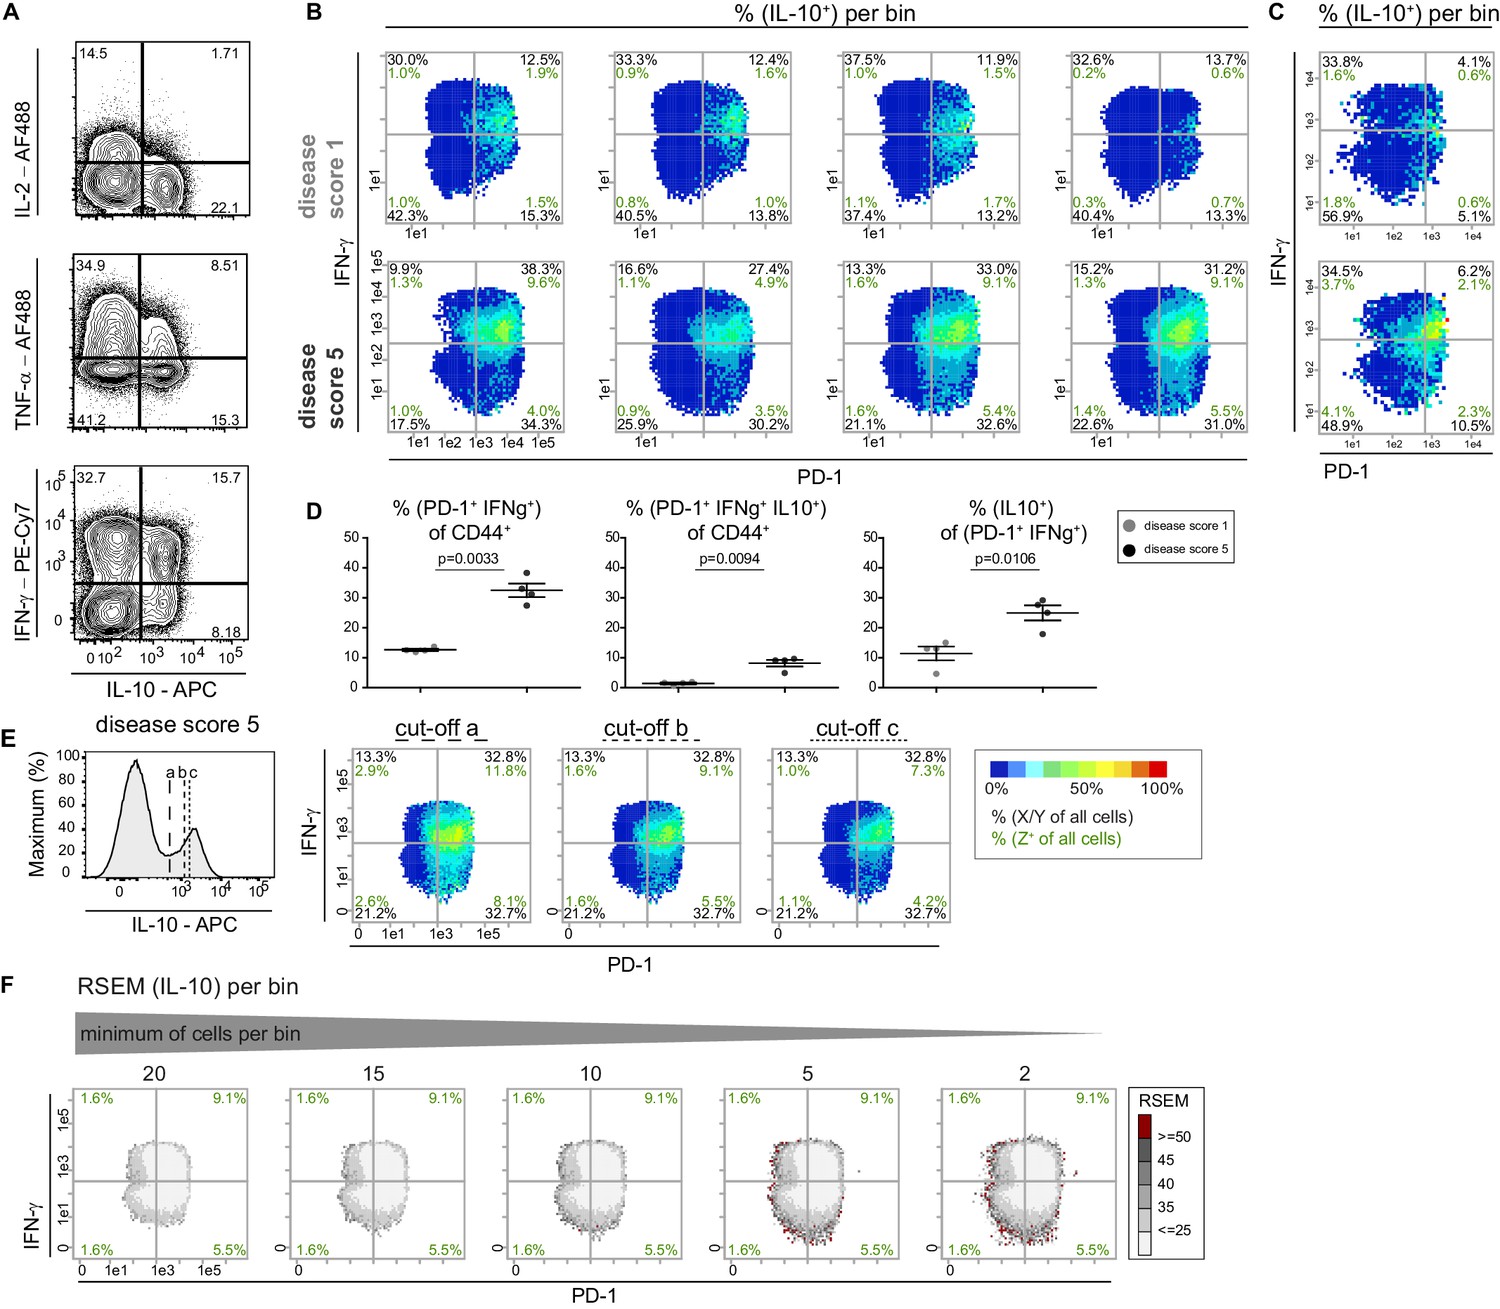
Bin plot patterns are reproducible and statistically robust.
(A) Representative contour plots for the co-production of IL-10 with other cytokines by PMA/ionomycin stimulated T cells of diseased mice. (B–C) Comparison of the IL-10 cell expression patterns of four individual (B) and three concatenated (C) mice (different experiments) of each score (score 1, top row; score 5, bottom row). Cell frequencies per quadrant are calculated on the number of cells per sample (black) and number of Z+ cells per sample (green). (D) Statistical analysis of the frequencies shown in the upper right quadrant in the bin plots from (B). (E) Different cut-off values for IL-10 were used (histogram, left) to create the respective bin patterns for IL-10 (right). (F) Different settings of minimum of cells per bin were used to visualize the relative standard error of the mean (RSEM) of the IL-10 signal per bin. Samples in (D) were compared using two-sided unpaired t-test with Welch-correction. Data are presented as the mean ± s.e.m.
-
Figure 2—figure supplement 3—source data 1
Figure 2—figure supplement 3D: Frequencies shown in the upper right quadrant in the bin plots of mice in disease score 1 and 5, respectively.
Data represent two independent experiments with n = 4 mice per group. Samples were compared using an unpaired two-tailed t-test.
- https://cdn.elifesciences.org/articles/53226/elife-53226-fig2-figsupp3-data1-v2.xlsx
Figure 3 with 1 supplement
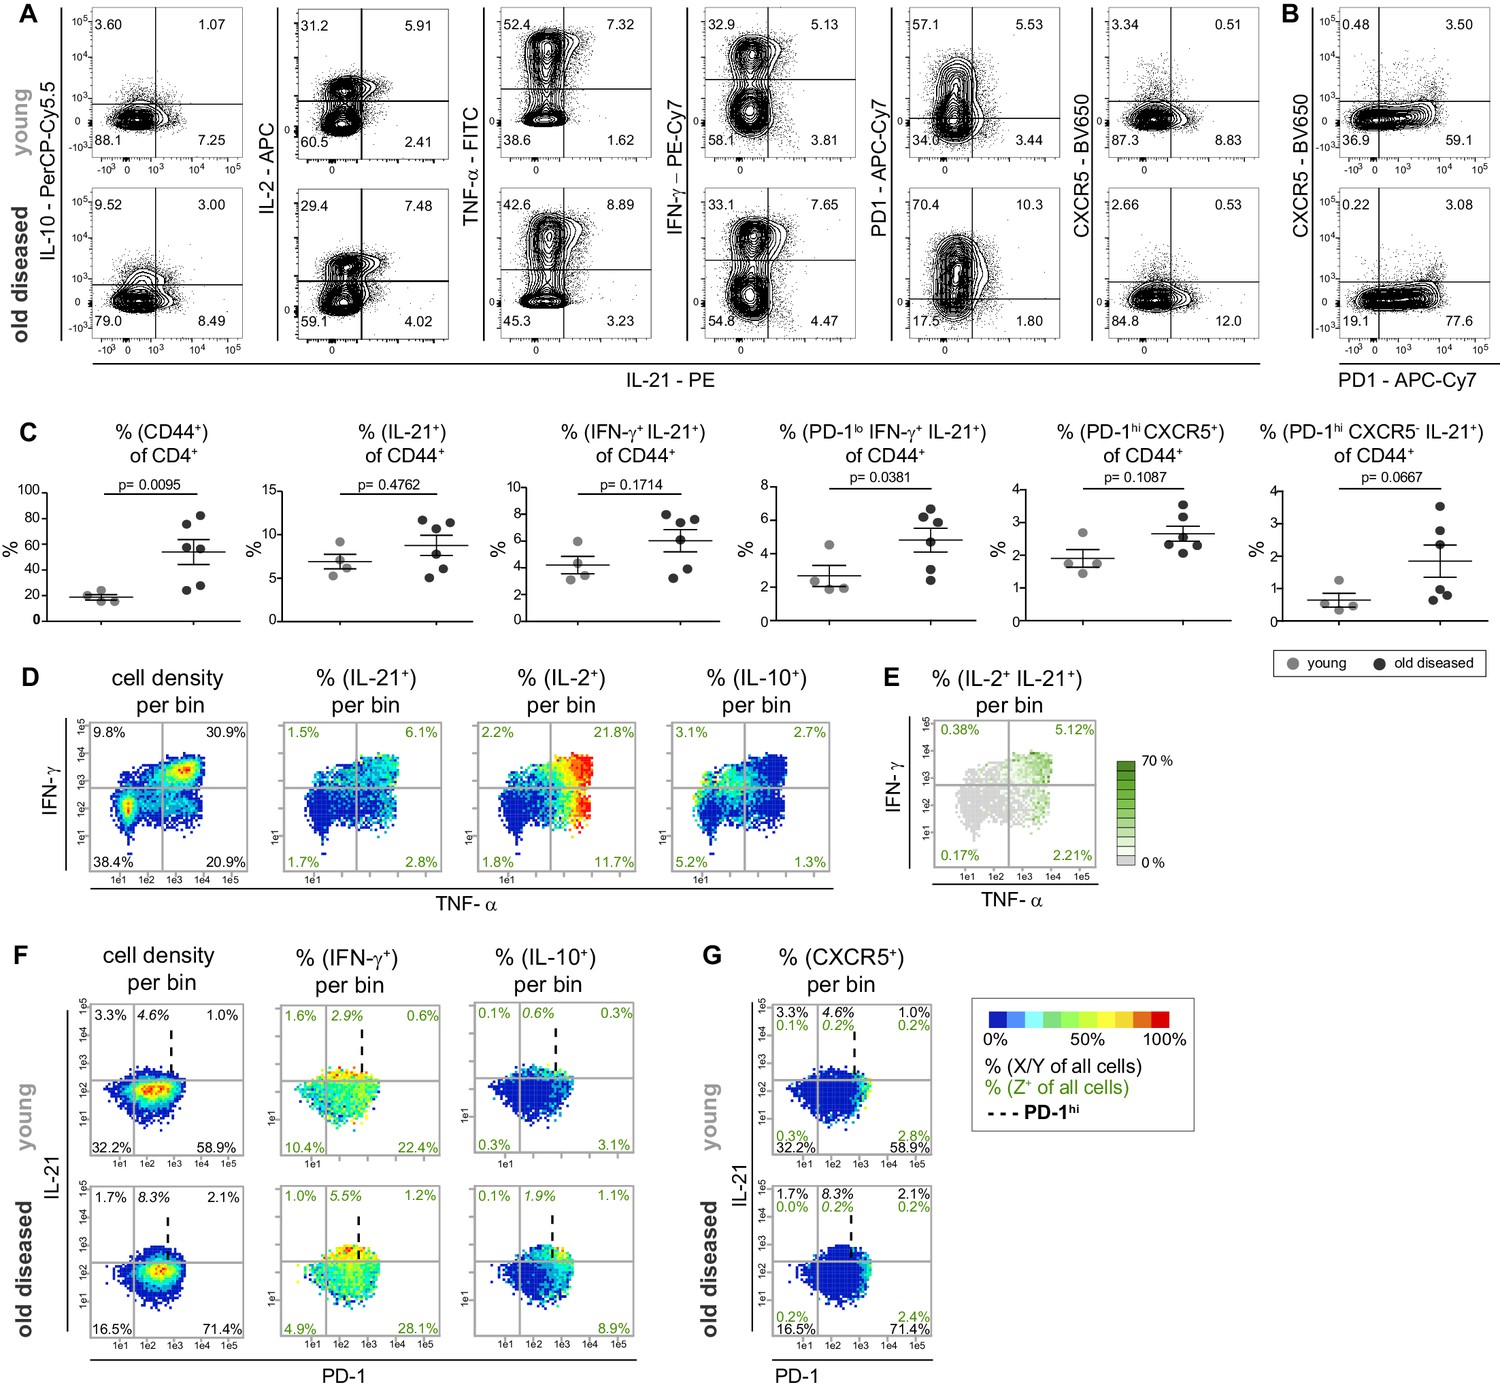
Most IL-21 producers in the NZBxW model strongly co-express Th1 cytokines but no CXCR5.
(A) Co-production of IL-21 with cytokines and the Tfh markers PD-1 and CXCR5 in concatenated CD4+ CD44+ cells from young and old diseased mice. (B) Tfh cells were identified based on their high expression of PD-1 and CXCR5 positivity. (C) Statistical analyses of IL-21+ subpopulations extracted from FlowJo. (D, E) Cytokine co-production is analyzed by bin plots showing the frequencies of IL-21+, IL-2+, IL-10+ (D) and IL-2+ IL-21+ cells (E). Green numbers indicate the frequency of IL-2+ IL-21+ double producers relative to all cells per quadrant (E). (F, G) Bin plots of concatenated samples of young and old diseased mice with PD-1 (x-axis), IFN-γ (y-axis) displaying the cell density and frequencies of IFN-γ+ and IL-10+ (F) and CXCR5 (G), respectively, per bin. Percentages written in italic letters represent the population size of PD-1low IL-21+ IFN-γ+ cells. Data are representative of three independent experiments (A–B). (C) Pooled data from two experiments involving n = 4 (young) and n = 6 (old) mice per group. Samples were compared using Mann-Whitney-U-test. Data are presented as the mean ± s.e.m. (D–G) The samples were concatenated from n = 3 young and old mice of the same experiment. Cut-off for PD-1hi cells is marked with dashed lines. (E) If a bin contains the minimum number of cells (5), the frequency of the third marker is shown in pseudo-colors. Cell frequencies per quadrant are calculated on the number of cells per sample (black) and number of Z+ cells per sample (green).
-
Figure 3—source data 1
Figure 3C: Proportion of different CD4+CD44+ T cell subsets in young score 1-diseased mice versus old score 5-diseased mice.
Data from two pooled experiments involving n = 1–5 mice per group.
- https://cdn.elifesciences.org/articles/53226/elife-53226-fig3-data1-v2.xlsx
Figure 3—figure supplement 1

The majority of IL-21 is produced by non-Tfh cells.
(A) Co-production of IFN-γ, IL-2, IL-10, IL-21 and TNF-α was analyzed by a pie chart. (B, C) PRI-based statistical analysis of marker co-expression in young and old mice. (D) Bin plots of PD-1 (x-axis) vs. CXCR5 (y-axis) with heatmap of frequency (top) and expression level (bottom) per bin of Tfh and B cell interaction proteins. Cell frequencies per quadrant are calculated on the number of cells per sample (black) and number of Z+ cells per sample (green). Grey bins contain less than 10 Z+ cells. (D) Data represent two experiments with n = 6 mice in total. (B, C) Samples were compared using the unpaired two-tailed t-test. Data are presented as the mean ± s.e.m.
-
Figure 3—figure supplement 1—source data 1
Figure 3—figure supplement 1A: Raw data to determine the frequencies of boolean combinations of coexpression of five cytokines.
- https://cdn.elifesciences.org/articles/53226/elife-53226-fig3-figsupp1-data1-v2.xlsx
-
Figure 3—figure supplement 1—source data 2
Figure 3—figure supplement 1B, C: Frequencies from IL-21+ subpopulations extracted from PRI bin plots.
Data as in Figure 3—source data 1.
- https://cdn.elifesciences.org/articles/53226/elife-53226-fig3-figsupp1-data2-v2.xlsx
Figure 4 with 1 supplement
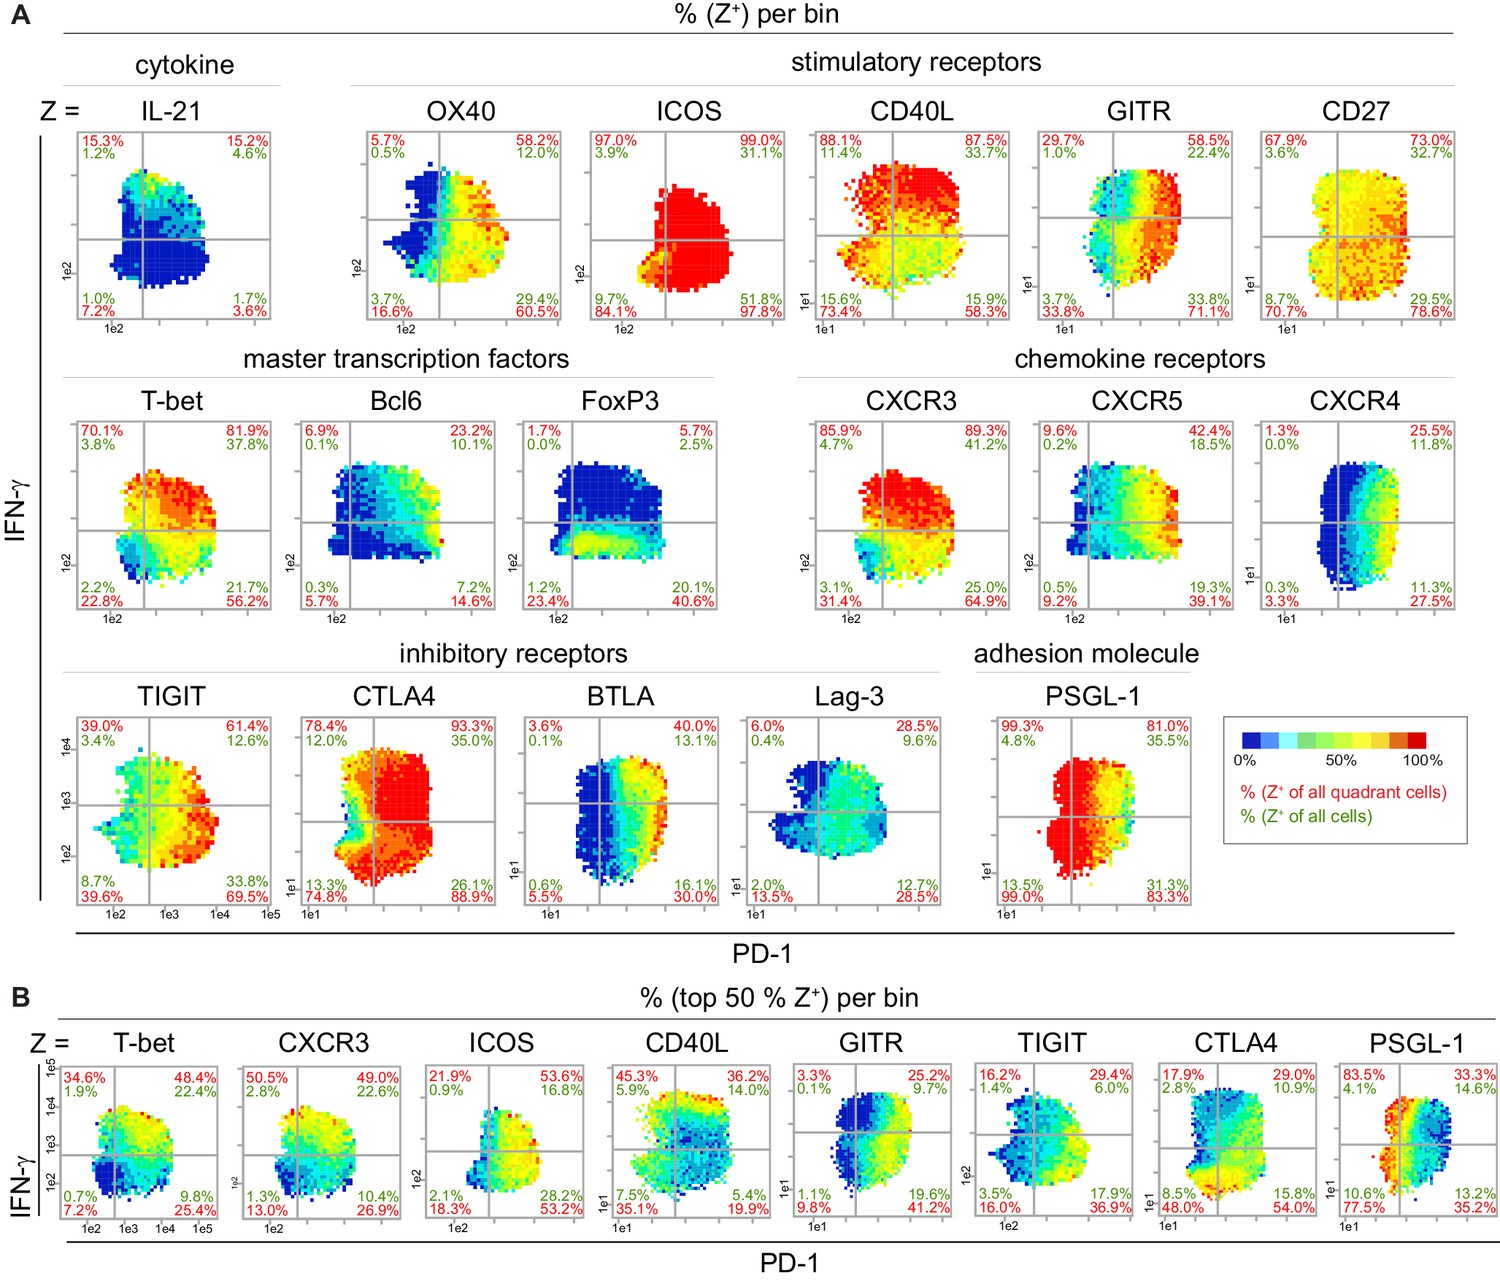
Super-functional T cells exhibit Th1 characteristics and are CD40Lhi ICOS+.
(A) Bin plots visualize the co-expression of PD-1 and IFN-γ with various proteins in stimulated (PMA/ionomycin) splenic T cells of old mice. (B) Distribution of the top 50% Z+ cells of selected markers from (A). If a bin contains the minimum number of cells (10), the frequency of the third marker is shown in pseudo-colors. Cell frequencies per quadrant are calculated on the number of Z+ cells in the quadrant (red) and number of Z+ cells per sample (green). Data are representative for at least two independent experiments with n ≥ 3 mice.
Figure 4—figure supplement 1
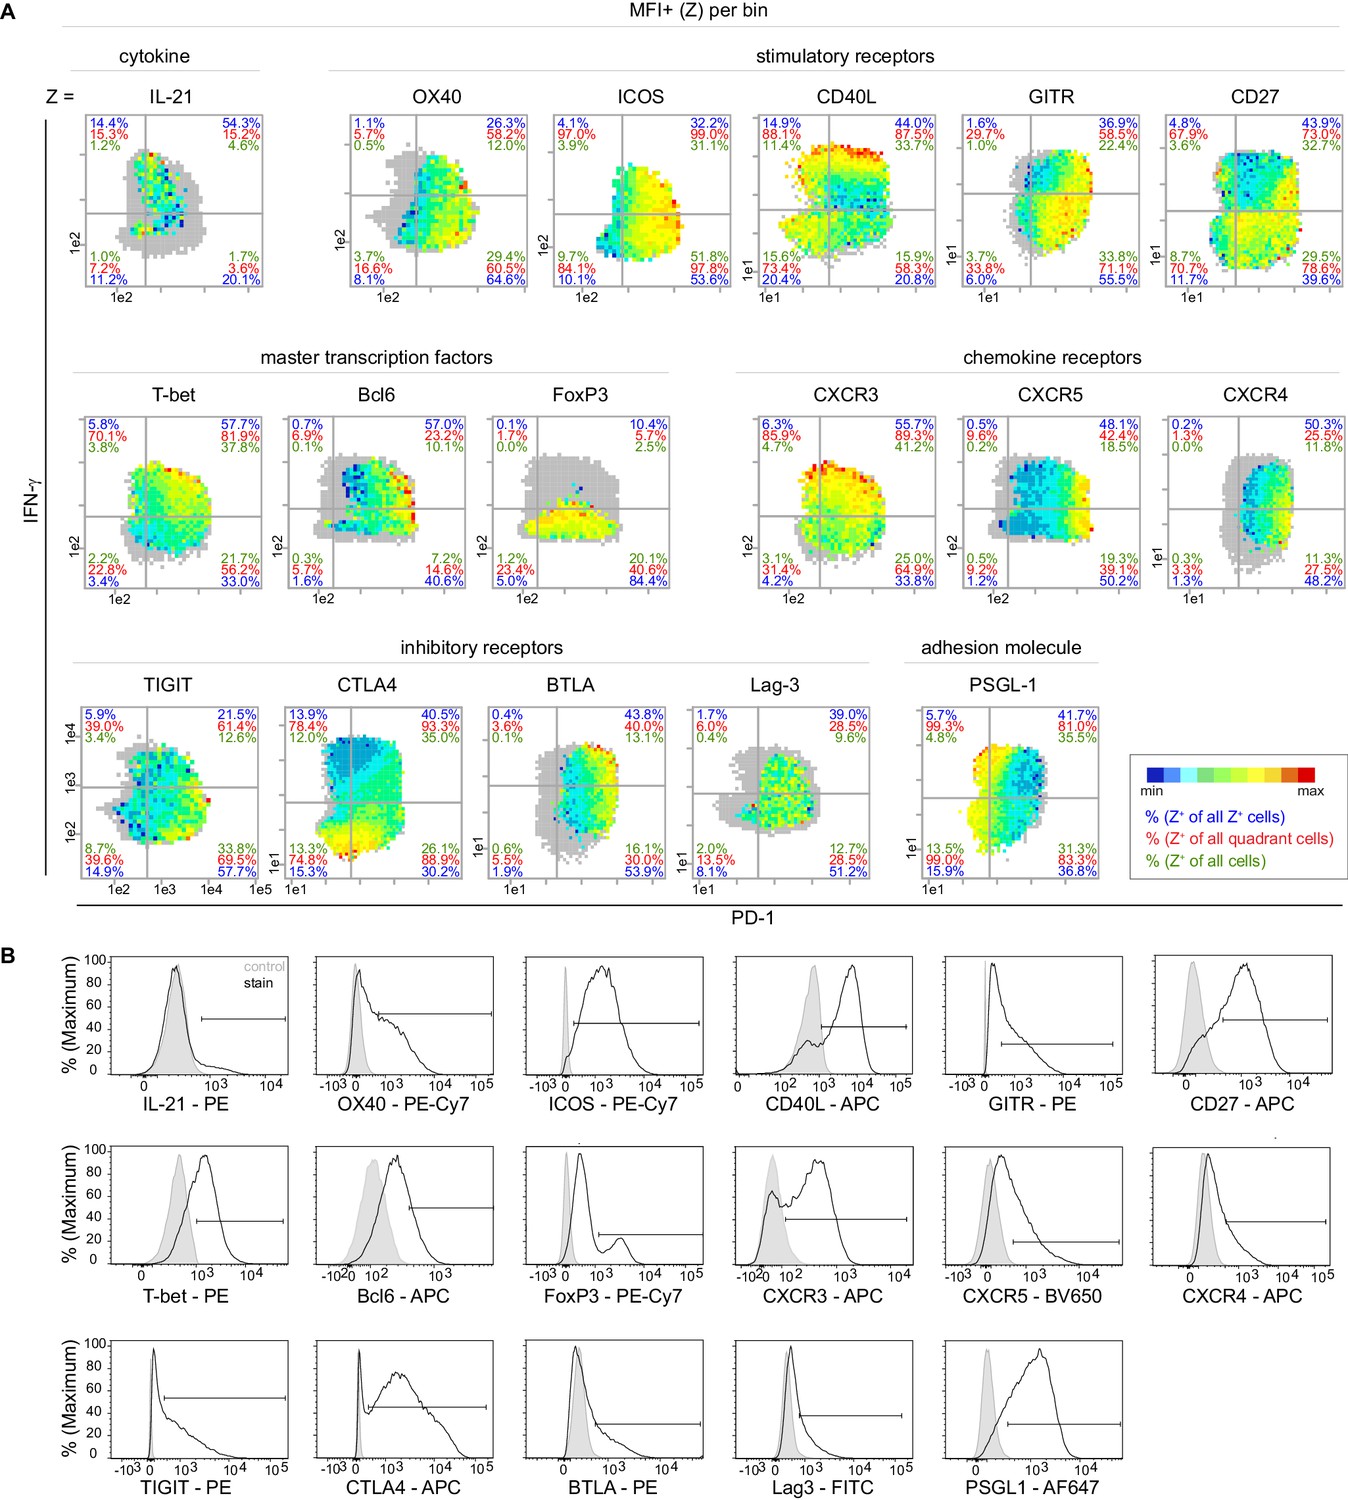
Super-functional T cells are CD40Lhi ICOS+.
(A) Bin plots visualize the relative expression level of parameter Z (MFI+) per bin of PMA/ionomycin stimulated splenic T cells. Grey bins contain less than 10 Z+ cells. (B) Histograms as example stainings for Z parameters. Data are representative for at least two independent experiments with n ≥ 3 mice.
Figure 5
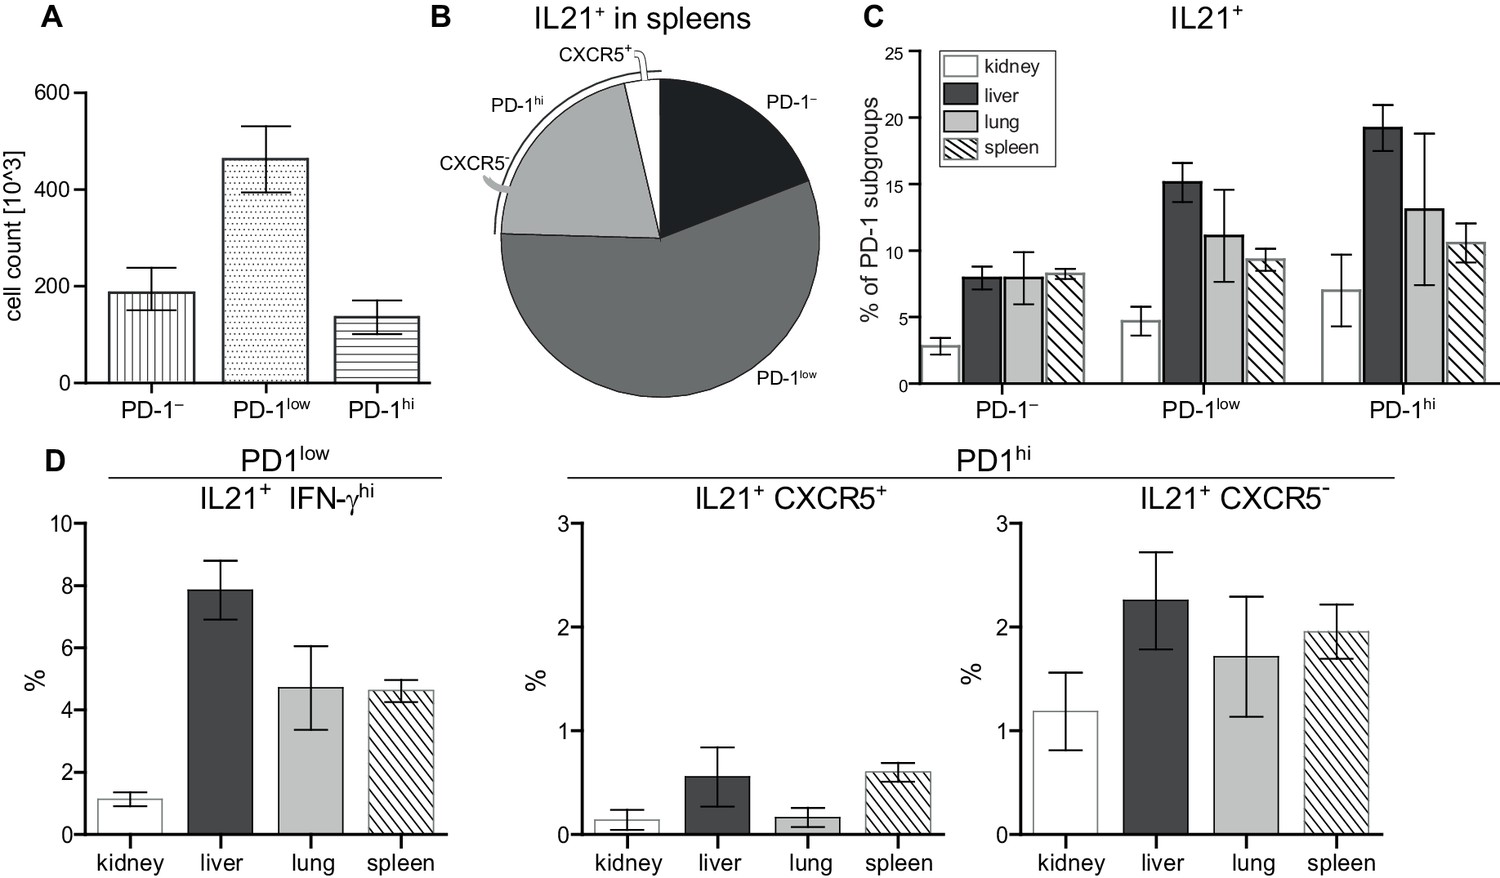
Super-functional T cells in peripheral organs exceed extrafollicular T cells and Tph cells in terms of frequency.
(A) Absolute numbers of PD-1 subsets in spleens. (B) Frequency of IL-21 producers in spleens. (C, D) Frequency of IL-21 producers in terms of localization and in terms of PD-1 subset. Data represent two independent experiments with n = 4 mice per organ. Data are presented as the mean ± s.e.m.
-
Figure 5—source data 1
Figure 5A: Frequencies of PD-1 subpopulation.
Data represent two independent experiments with n = 4 mice per organ.
- https://cdn.elifesciences.org/articles/53226/elife-53226-fig5-data1-v2.xlsx
-
Figure 5—source data 2
Figure 5B: Frequencies of IL-21 producers in spleens.
Data represent two independent experiments with n = 4 mice per organ.
- https://cdn.elifesciences.org/articles/53226/elife-53226-fig5-data2-v2.xlsx
-
Figure 5—source data 3
Figure 5C: Frequencies of IL-21 producers in terms of localization and in terms of PD-1 subset.
Data represent two independent experiments with n = 4 mice per organ.
- https://cdn.elifesciences.org/articles/53226/elife-53226-fig5-data3-v2.xlsx
-
Figure 5—source data 4
Figure 5D: Frequencies of IL-21 producers in terms of localization and in terms of PD-1 subset.
Data represent two independent experiments with n = 4 mice per organ.
- https://cdn.elifesciences.org/articles/53226/elife-53226-fig5-data4-v2.xlsx
Figure 6 with 1 supplement
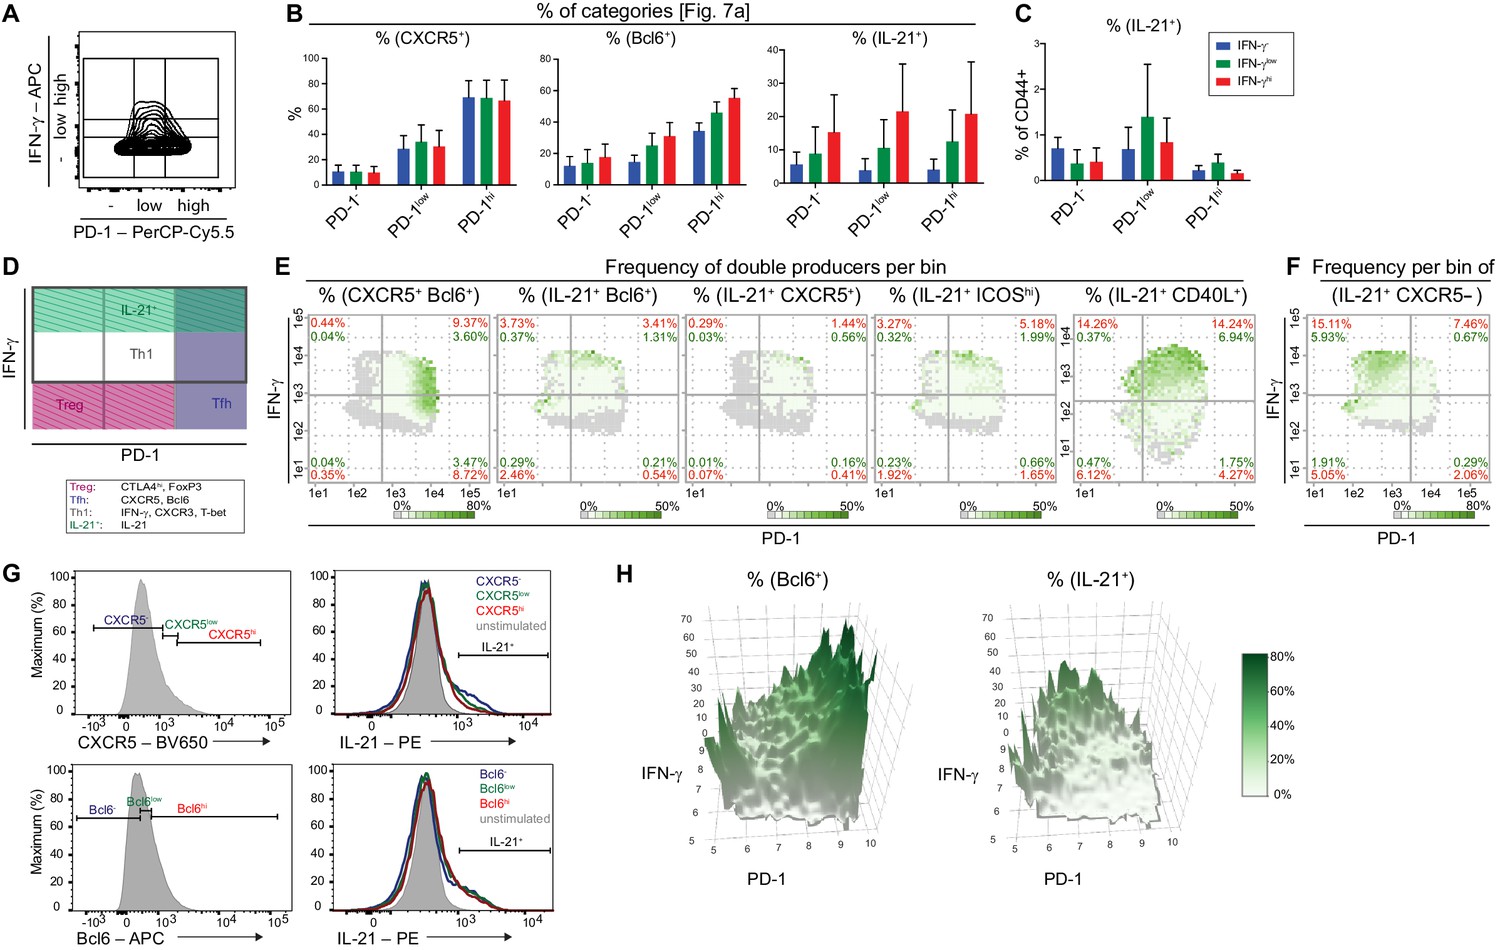
Comparison of Tfh and Tfh-like cell subpopulations by bin patterns.
(A) Subdivision of Tmem cells into nine categories based on their PD-1 and IFN-γ expression (compare to D). (B) Barplots depicting the frequencies of CXCR5, Bcl6 and IL-21 producers in respective subpopulations. (C) Frequency of the IL-21 producers of each subpopulation relative to CD44+ cells. (D) Areas with highest probability for Treg, Tfh, Th1 and IL-21+ cells. (E) Representative bin plots of the frequencies of double producers for CXCR5/Bcl6, IL21/Bcl6, IL21/CXCR5, IL21/ICOShi, IL21/CD40L in splenic T cells of old diseased mice. (F) Representative bin plot of the frequency of IL21 producing, but CXCR5 non-producing cells in splenic T cells of old diseased mice. (G) T cells were sub-divided according to their CXCR5 and Bcl6 expression levels into negative (-), low and high (hi) expressors (left). Their IL-21 production was investigated by histogram overlays (right). (H) 3D heatmap showing frequencies of Bcl6 (left) and IL21 producers (right) with PD-1 (x-axis) and IFN-γ (y-axis). All data represent three independent experiments with (B, C), n = 3–9 mice and (E–G), 3–11 mice. E-F, Frequencies of ‘double’ producers are calculated per quadrant (red) and per all CD44+ cells (green). Grey bins contain less than 10 Z+ cells. Data are presented as the mean ± s.e.m.
-
Figure 6—source data 1
Figure 6B: Frequencies of CXCR5, Bcl6 and IL-21 producers in respective subpopulations.
Data represent three independent experiments with n = 3–9 mice.
- https://cdn.elifesciences.org/articles/53226/elife-53226-fig6-data1-v2.xlsx
-
Figure 6—source data 2
Figure 6C: Frequencies of IL-21 of CD44+ producers in respective subpopulations.
Data represent three independent experiments with n = 3–9 mice.
- https://cdn.elifesciences.org/articles/53226/elife-53226-fig6-data2-v2.xlsx
Figure 6—figure supplement 1
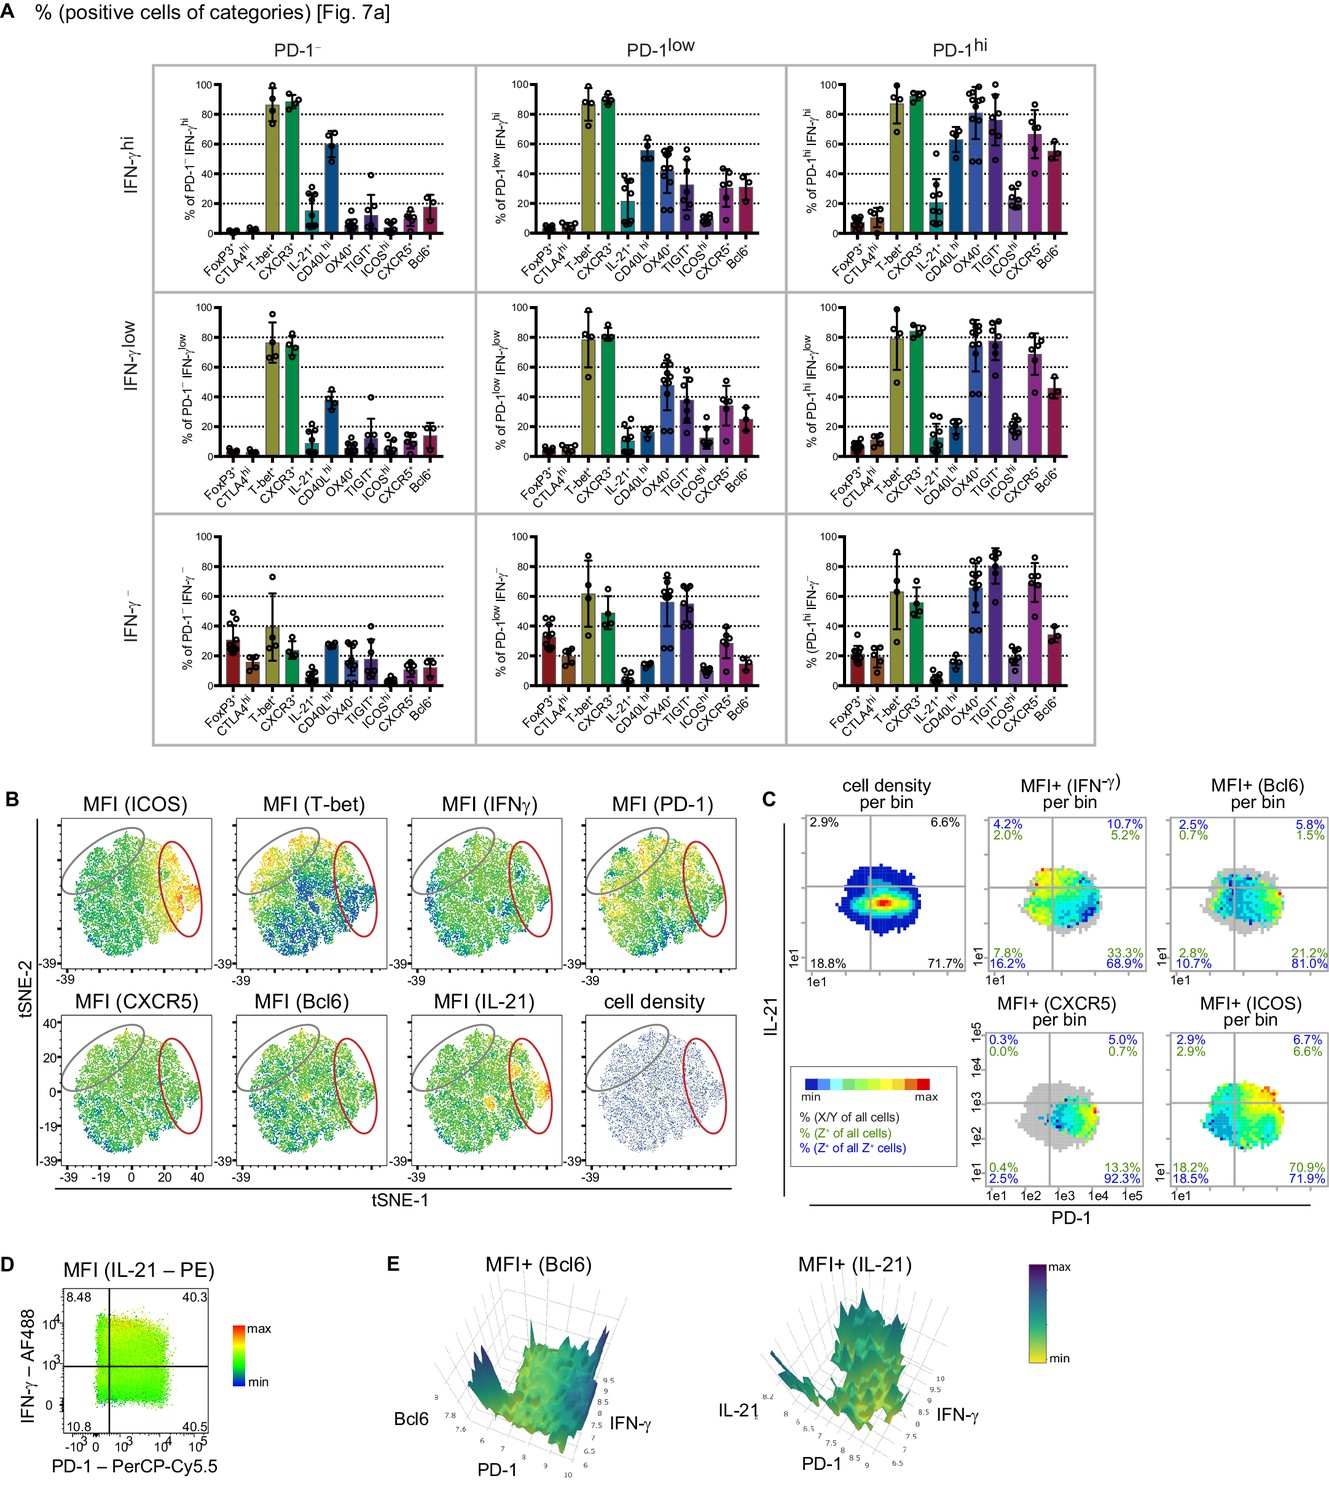
PRI results can be confirmed with viSNE and conventional analysis.
(A) Bar plots of subpopulation frequencies sub-divided into regions as described in Figure 6 (A, D). (B) viSNE plots displaying cell density and MFI of different markers. Grey circles mark the PD-1hi area and red circles the IFN-γhi area. (C) Bin plots displaying PD-1 (x-axis) and IL-21 (y-axis) with cell density and MFI+ of IFN-γ, Bcl6, CXCR5 and ICOS. Cell frequencies per quadrant are calculated on the number of cells per sample (black), number of Z+ cells per sample (green), and number of Z+ cells per quadrant to all Z+ cells (blue). Grey bins contain less than 10 Z+ cells. (D) FlowJo color map with PD-1 (x-axis), IFN-γ (y-axis) and MFI of IL-21 (Z parameter). (E) 3D heatmap plots showing MFI+ of Bcl6 (left) and IL-21 (right) as relief on PD-1 (x-axis) and IFN-γ (y-axis). Data are representative for at least two independent experiments with old diseased mice with (A) n = 3–11 mice and (B–E) n ≥ 3 mice. A, Data are presented as the mean ± s.e.m.
-
Figure 6—figure supplement 1—source data 1
Figure 6—figure supplement 1A: Frequencies of protein expressions sub-divided into regions.
Data represent three independent experiments with n = 3–11 mice.
- https://cdn.elifesciences.org/articles/53226/elife-53226-fig6-figsupp1-data1-v2.xlsx
Figure 7 with 2 supplements
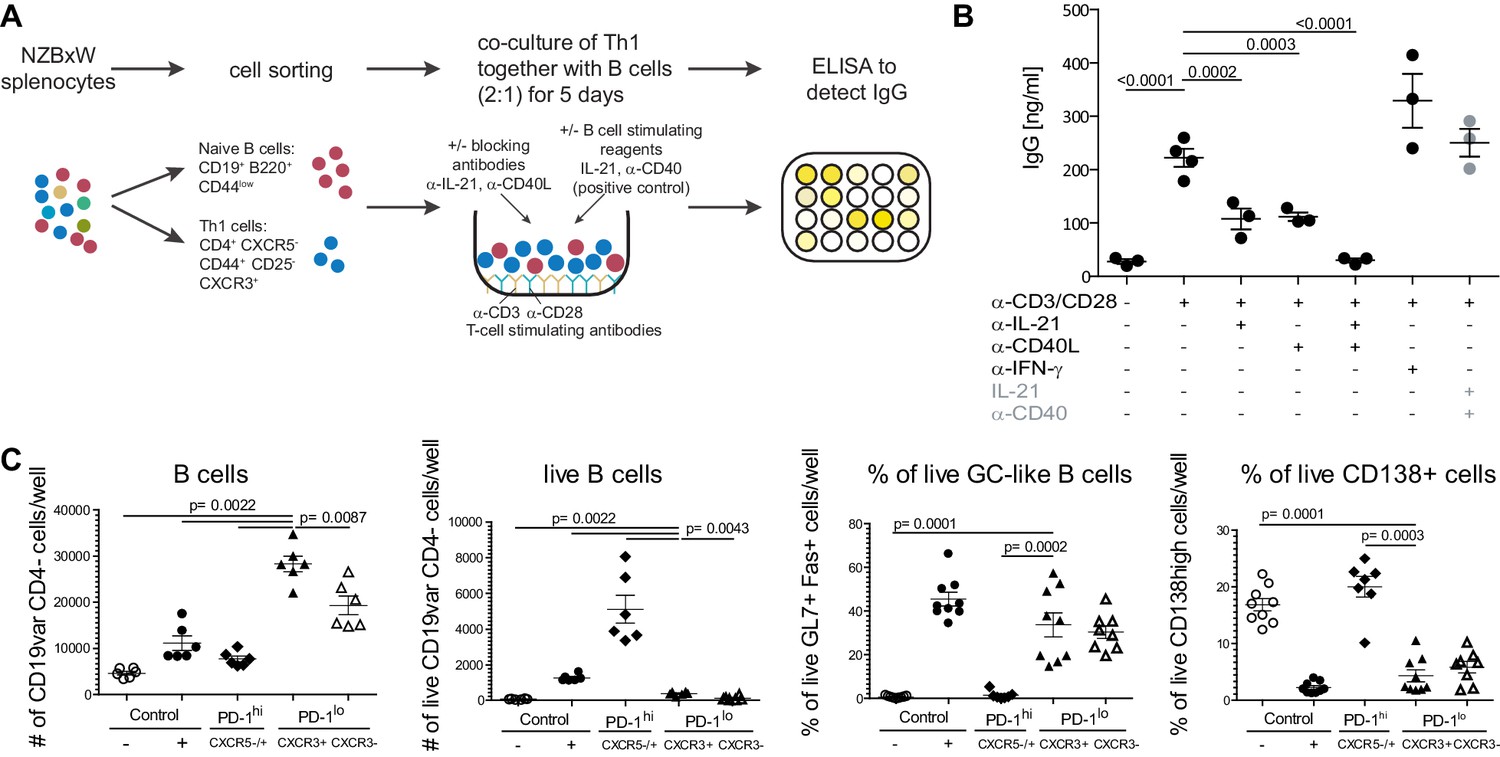
Super-functional T cells provide help for IgG production in co-cultures with B cells and expand B cells with activated GL7+ Fas+Germinal Center-like phenotype.
(A) Splenocytes were FACS-sorted for naïve B cells (CD19+ B220+ CD44low) and Th1 cells (CD4+ CXCR5- CD44+ CD25- CXCR3+). Both fractions were co-cultured for 5 days in presence or absence of antibodies against B cell activating cytokines. T cells were stimulated with agonistic antibodies against CD3 and CD28. As positive control, B cells were stimulated with IL-21 and an agonistic anti-CD40 antibody. IgG in the supernatant was detected by an ELISA. (B) ELISA results. One representative experiment of three is shown. Statistical analysis was performed by one-way ANOVA with Dunnett’s multiple comparison test. (C) Total CD19+ B220+ B cells were co-cultured for 5 days either alone (negative control, -), or with IL-21 + anti-CD40 antibody (positive control, +), CXCR3+ PD-1lo Tsh (PD-1lo CXCR3+), CXCR3- PD-1lo CD4 T cells (PD-1lo CXCR3-), or PD-1hi CXCR5+/- cells (PD-1hi) FACS-sorted from pooled splenocytes of 2-year-old C57Bl/6 mice. At day 5, viable B cells were identified and percentage of activated Germinal Center (GC)-like B cells was determined by co-expression of GL7 and Fas, antibody-producing plasma cells (PC) by expression of CD138. Data on B cell count and viability are representative of one out of two experiments involving six replicates per condition. Data on GL7+ Fas+ GC-like B cells and CD138+ antibody-producing cells are pooled data from two independent experiments involving 1–7 replicates. Statistical significance of differences between CXCR3+ PD-1lo Tsh co-cultures and other conditions were assessed by Mann Whitney test.
-
Figure 7—source data 1
Figure 7B: Frequencies of IgG concentrations in co-cultures with different antibody settings.
Data represent one of three independent experiments with n = 3–4 mice.
- https://cdn.elifesciences.org/articles/53226/elife-53226-fig7-data1-v2.xlsx
-
Figure 7—source data 2
Figure 7C: Cells per well and frequencies of GC-like and CD138+ cells in co-cultures with different T cell subsets.
Data on B cell count and viability are representative of one out of two experiments involving six replicates per condition. Data on GL7+ Fas+ GC-like B cells and CD138+ antibody-producing cells are pooled data from two independent experiments involving 1–7 replicates.
- https://cdn.elifesciences.org/articles/53226/elife-53226-fig7-data2-v2.xlsx
Figure 7—figure supplement 1
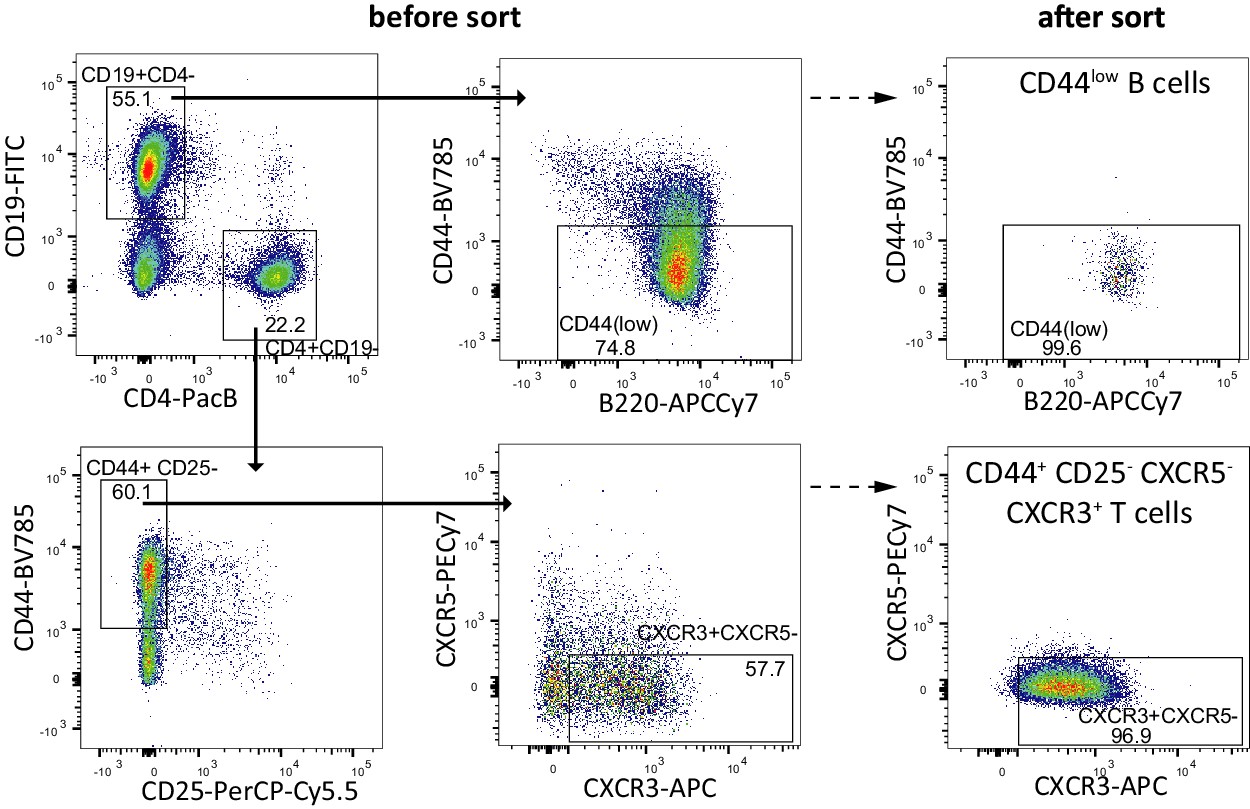
Sorting strategy and purity control of naive B cells and Th1 cells.
FACS sorting scheme for naive B cells (CD19+ CD44low and Th1 cells (CD4+ CXCR5- CD44+ CD25- CXCR3+). Fractions before (left) and after sort (right) are shown.
Figure 7—figure supplement 2
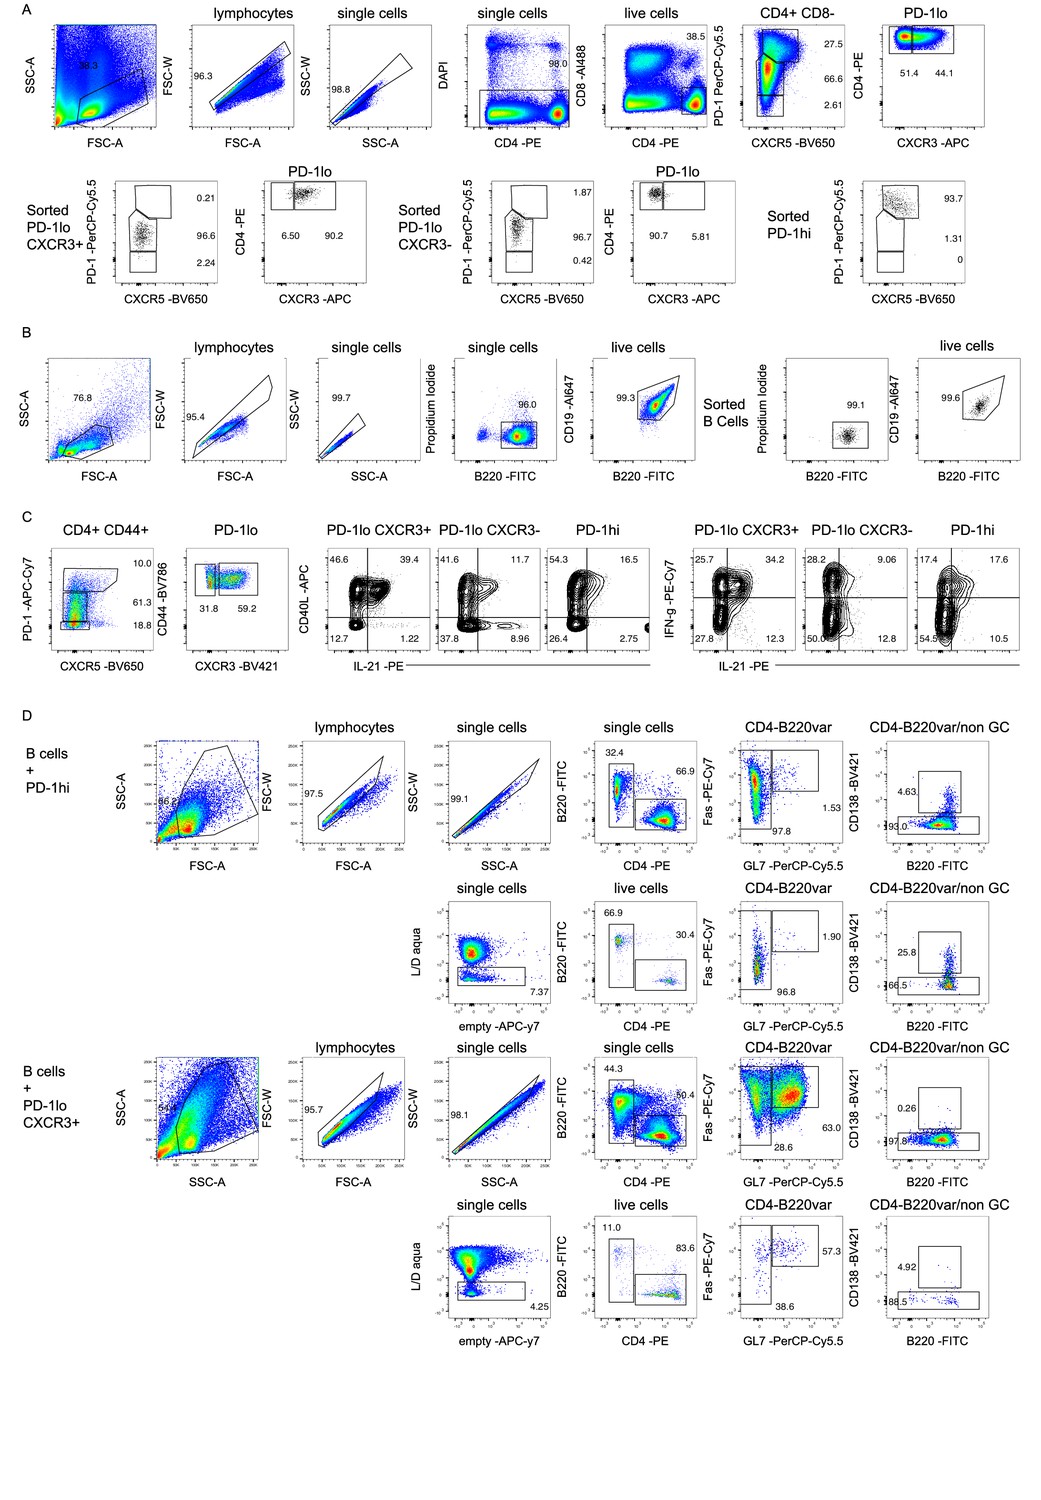
Functional comparison of CXCR3+ PD-1lo Tsh, CXCR3- PD-1lo CD4+ T cells and PD-1hi cells in B and T cell co-cultures.
(A) Gating strategy used to sort CXCR3+ PD-1lo Tsh, CXCR3- PD-1lo CD4+ T cells and PD-1hi CXCR5+/-. Upper row (pseudo-color plots) shows pre-sorted cells prepared from pooled splenocytes of two-years old C57Bl/6 mice. Lower row (black dot plots) shows purity and phenotype of the sorted populations. (B) Gating strategy to sort B220+ CD19+ B cells. Pseudo-color plots on the left-hand side show pre-sorted cells prepared from pooled splenocytes of 2-year-old C57Bl/6 mice and enriched for B cells by negative magnetic cell sort on Miltenyi column. Black dot plots on the right-hand side show B220+ CD19+ B cells purity after FACS-sort. (C) PMA/ionomycin-stimulated pre-sorted cells from pooled splenocytes of two-years old C57Bl/6 mice were assessed for CD40L, IL-21, and IFN-γ production. Pseudo-color plots show gating strategy for identification of CD4 T cell subsets and contour plots show cytokine production by the assessed populations. (D) Analysis of 5 days co-cultures by flow cytometry. Representative plots from co-culture wells with B cells and PD-1hi cells (upper plots) and B cells and CXCR3+ PD-1lo Tsh cells (lower plots) are shown. Data are representative of two independent experiments. Legends for figure source data.
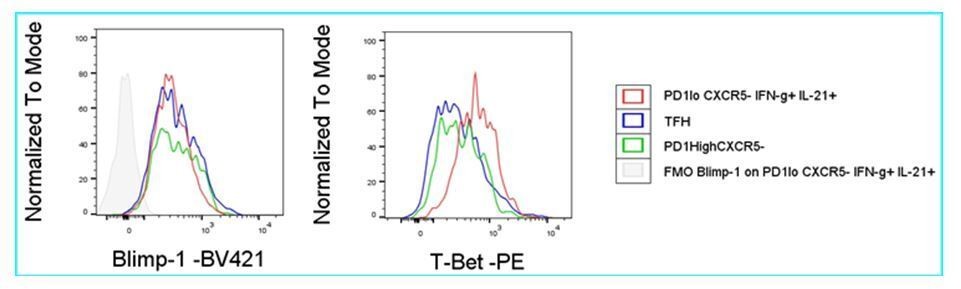
Author response image 1
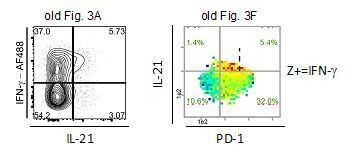
Author response image 2
Additional files
-
Source code 1
A notebook to show step by step how to create the bin plots (in HTML).
- https://cdn.elifesciences.org/articles/53226/elife-53226-code1-v2.zip
-
Source code 2
A notebook how to create bin functions (in R).
- https://cdn.elifesciences.org/articles/53226/elife-53226-code2-v2.zip
-
Supplementary file 1
Key resources table.
- https://cdn.elifesciences.org/articles/53226/elife-53226-supp1-v2.docx
-
Transparent reporting form
- https://cdn.elifesciences.org/articles/53226/elife-53226-transrepform-v2.docx
Download links
A two-part list of links to download the article, or parts of the article, in various formats.
Downloads (link to download the article as PDF)
Open citations (links to open the citations from this article in various online reference manager services)
Cite this article (links to download the citations from this article in formats compatible with various reference manager tools)
Identification of a super-functional Tfh-like subpopulation in murine lupus by pattern perception
eLife 9:e53226.
https://doi.org/10.7554/eLife.53226


