Activated αIIbβ3 on platelets mediates flow-dependent NETosis via SLC44A2
- Centre for Haematology, Department of Immunology and Inflammation, Imperial College London, United Kingdom
- Centre for Inflammatory Disease, Department of Immunology and Inflammation, Imperial College London, United Kingdom
- Department of Haematology, University of Cambridge, Cambridge Biomedical Campus, United Kingdom
- National Health Service Blood and Transplant, Cambridge Biomedical Campus, United Kingdom
- National Institute for Health Research BioResource, Rare Diseases, Cambridge University Hospitals, United Kingdom
- British Heart Foundation Centre of Excellence, Cambridge Biomedical Campus, United Kingdom
Figures
Figure 1 with 2 supplements
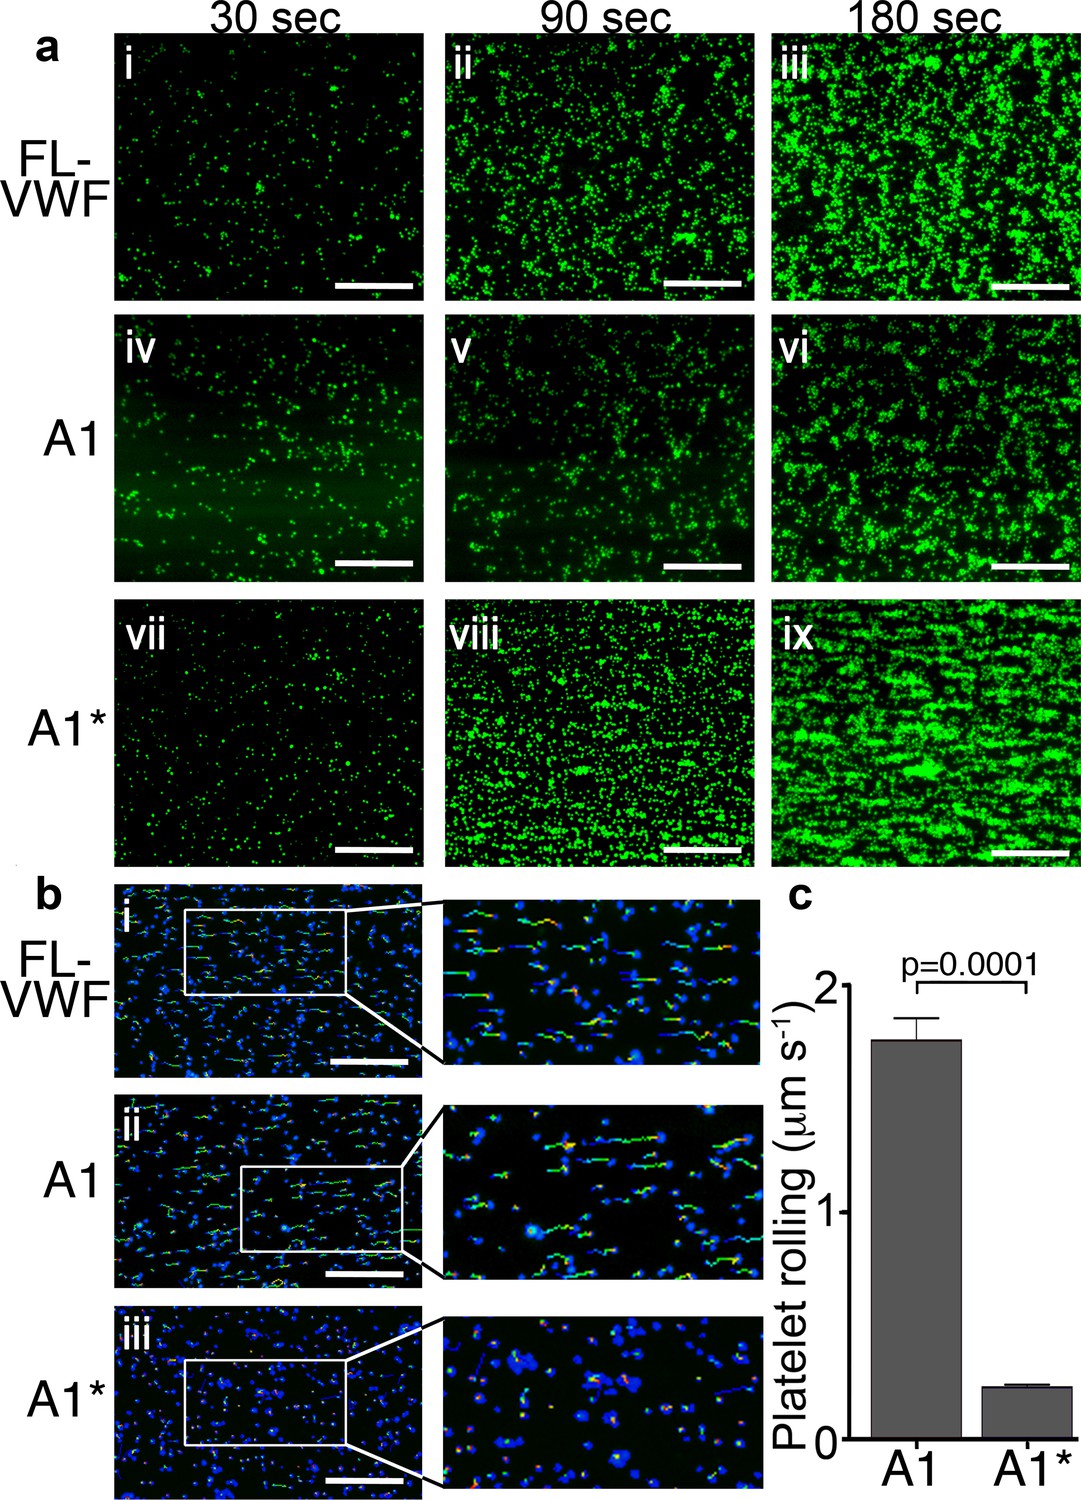
Platelet rolling and attachment to VWF under flow.
(a) Vena8 microchannels were coated with either full-length VWF (FL-VWF; i-iii), VWF A1 (iv-vi) or A1* (vii-ix). Whole blood labeled with DiOC6 was perfused at 1000 s−1. Representative images (n = 3) of platelets (green) after 30, 90 and 180 s are shown. Scale; 50 μm (see also Video 1). (b) Experiments performed as in a), bound platelets (blue) were tracked (depicted by multi-colored lines) representing distance travelled in the first 30 s of flow. Scale bar; 50 μm. (c) Platelet rolling velocity on channels coated with A1 and A1*. Data plotted are median ±95% CI. n = 3562 platelets from 3 different experiments (A1) and n = 4047 platelets from 3 different experiments (A1*). Data were analyzed using the Mann-Whitney test.
-
Figure 1—source data 1
Platelet rolling source data.
- https://cdn.elifesciences.org/articles/53353/elife-53353-fig1-data1-v2.xlsx
Figure 1—figure supplement 1
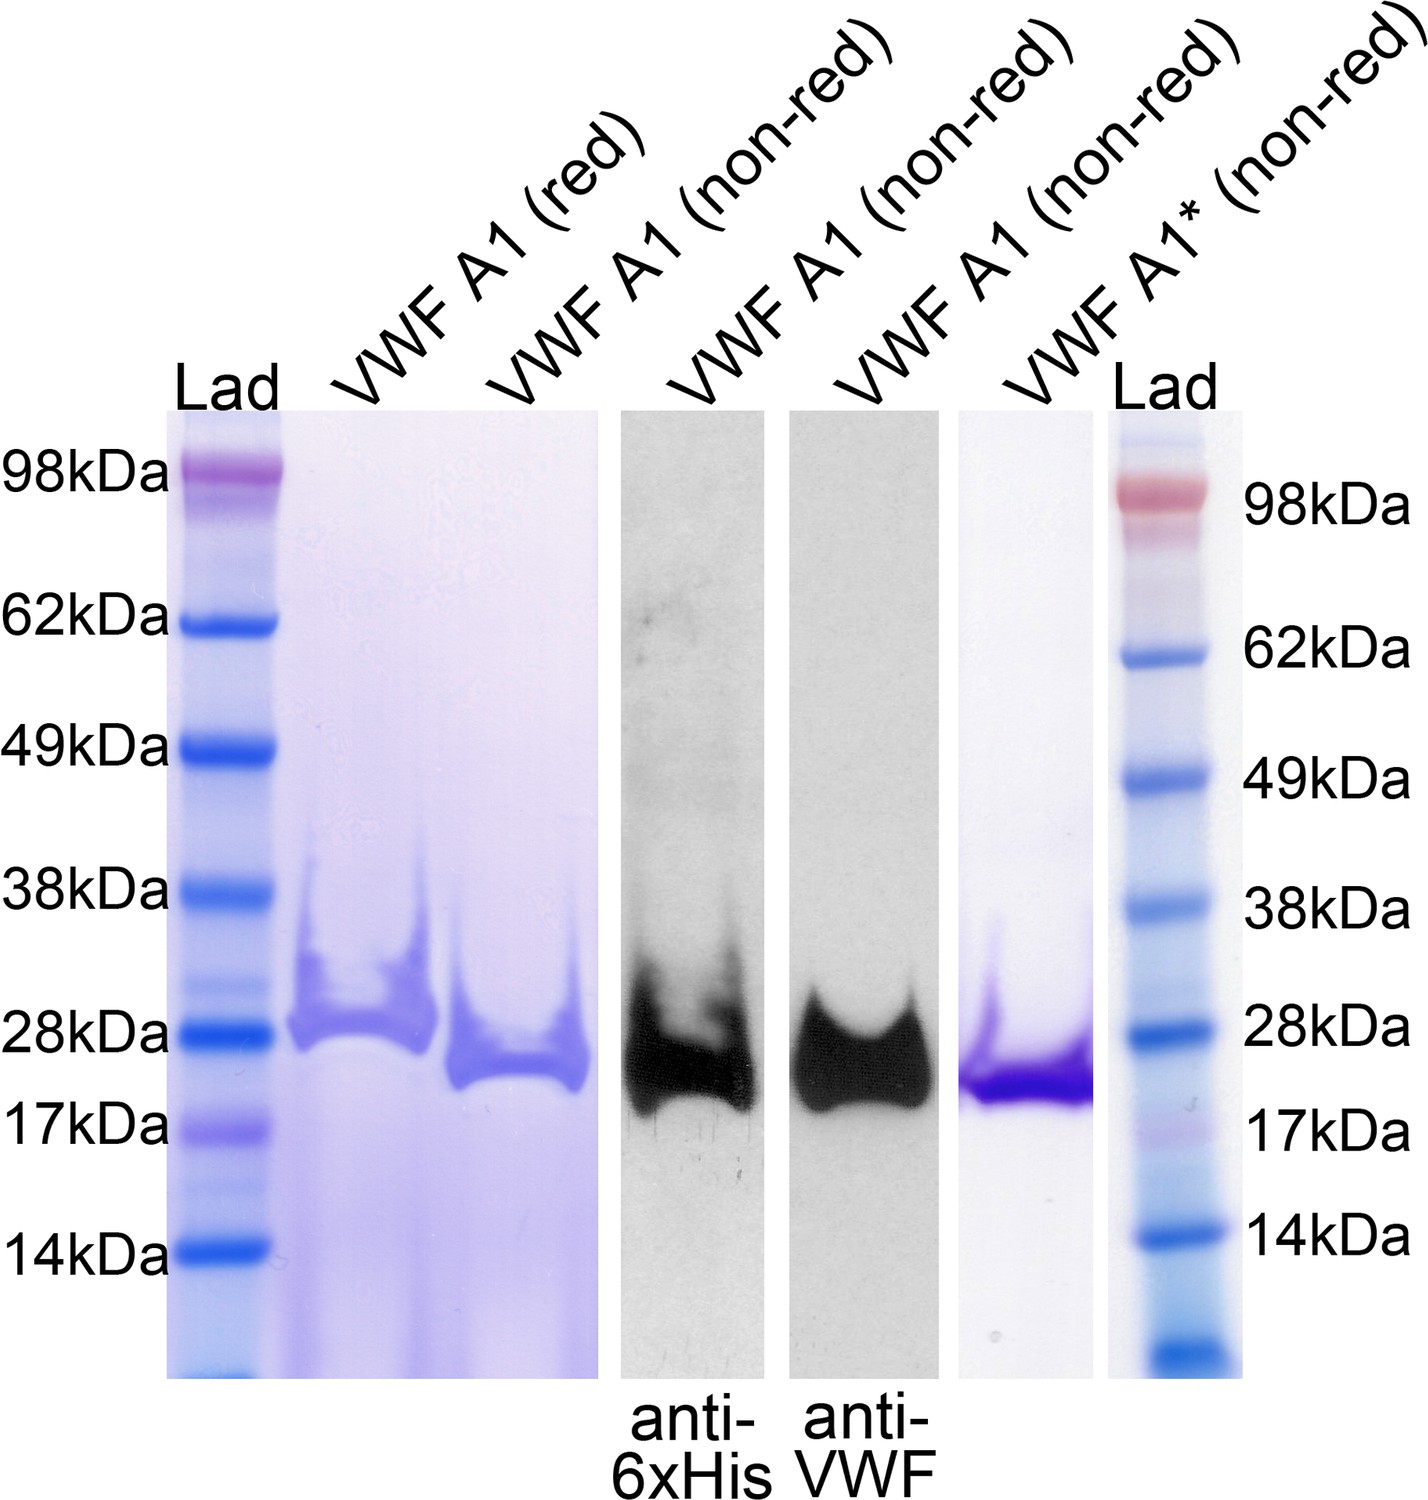
Analysis of purified recombinant VWF A1 and VWF A1*.
VWF A1 domain with a C-terminal V5 and 6xHis tag was expressed in S2 insect cells and purified to homogeneity. Purified A1 was analyzed by SDS-PAGE and Coomassie staining under reducing and non-reducing conditions, and also by Western blotting of VWF A1 using anti-6xHis and anti-VWF antibodies. A Coomassie stain of purified VWF A1* is also shown.
-
Figure 1—figure supplement 1—source data 1
Analysis of purified recombinant VWF A1 and VWF A1* source data.
- https://cdn.elifesciences.org/articles/53353/elife-53353-fig1-figsupp1-data1-v2.xlsx
Figure 1—figure supplement 2
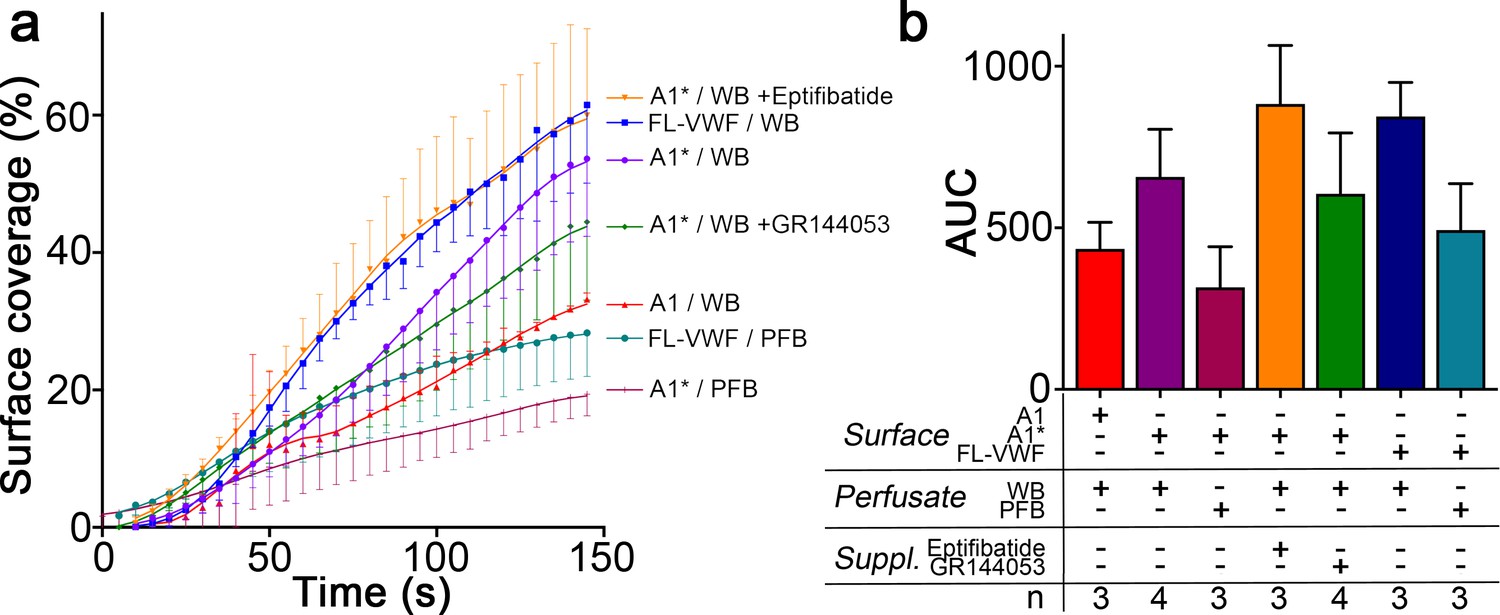
Platelet coverage on VWF A1, A1* and VWF surfaces.
(a) Graph showing the surface coverage over time of microchannels coated with FL-VWF, VWF A1 or VWF A1* by platelets in either whole blood (WB) or plasma-free blood (PFB) at a shear rate of 1000 s−1 (b) Graph of the area under the curve (AUC) ± SD of conditions analyzed in A) Surface coverage rates were similar on all surfaces.
-
Figure 1—figure supplement 2—source data 1
Platelet coverage source data.
- https://cdn.elifesciences.org/articles/53353/elife-53353-fig1-figsupp2-data1-v2.xlsx
Figure 2 with 1 supplement
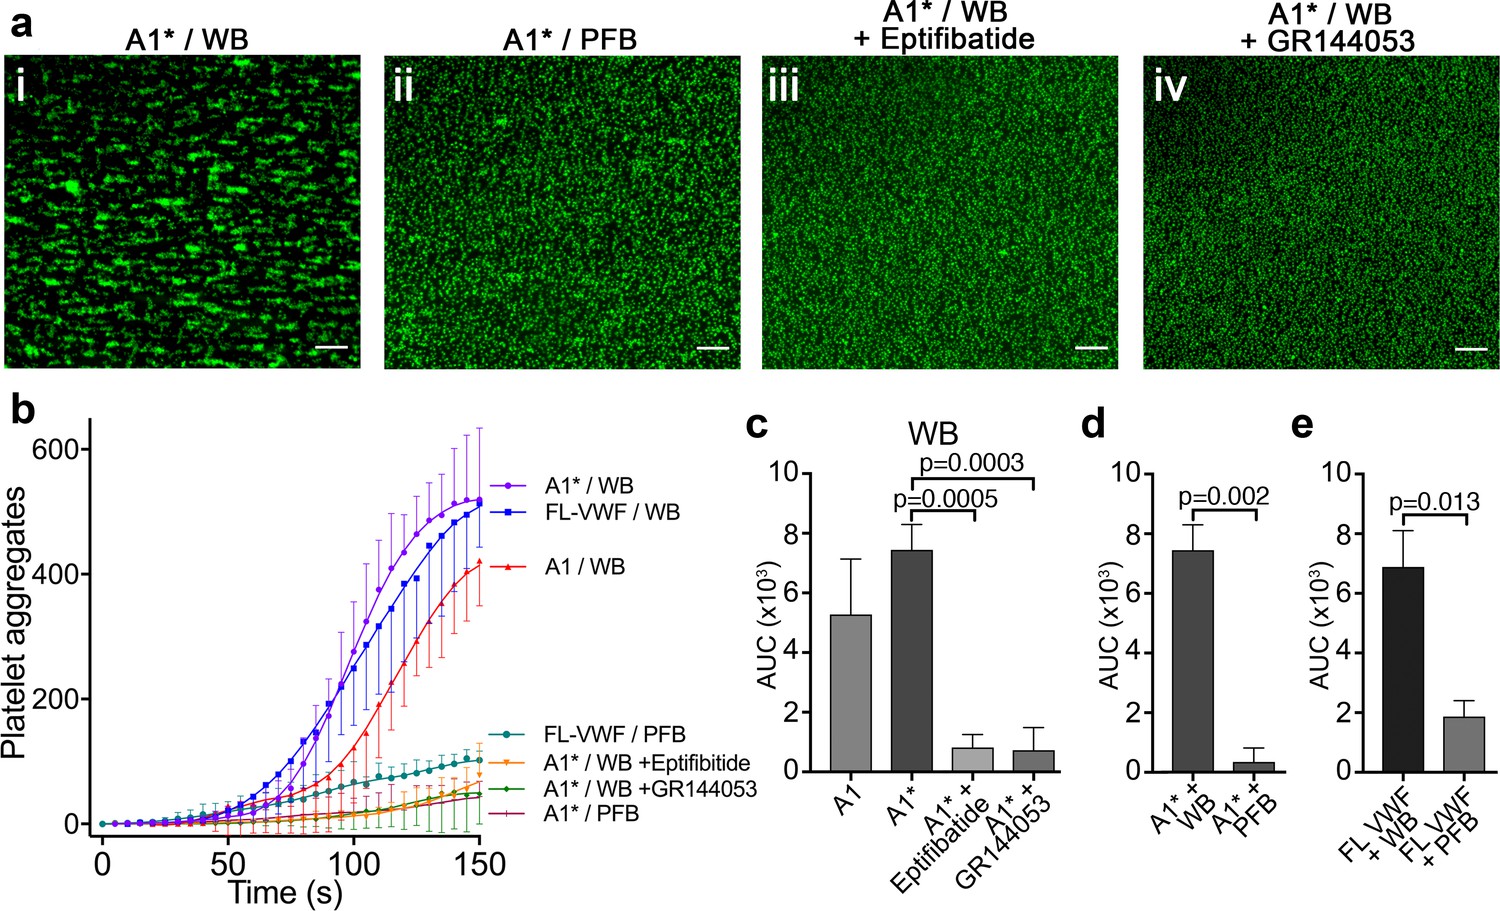
Platelet binding to VWF under flow induces αIIbβ3-dependent aggregation.
(a) Vena8 microchannels were coated with A1* via its 6xHis tag. (i) Whole blood (WB) or ii) plasma-free blood (PFB), iii) WB containing eptifibatide or iv) WB containing GR144053 were perfused through channels at 1000 s−1. Representative images acquired after 3 min. Scale bar; 50 μm. (b) Graph measuring platelet aggregation over time in WB perfused through channels coated with A1 (red, n = 3), A1* (purple, n = 4) and FL-VWF (blue, n = 3), WB pre-incubated with eptifibatide (orange, n = 3) or GR144053 (green, n = 4) over channels coated with A1* and PFB over channels coated with A1* (magenta, n = 3) or FL-VWF (teal, n = 3). Data plotted are mean ± SD. (c–e) Bar charts comparing area under the curve (AUC) of the data presented in b). (c) WB perfused over A1 or A1* with or without eptifibatide or GR144053. (d) WB or PFB perfused over A1*. (e) WB or PFB perfused over FL VWF. Data presented are mean ± SD, n = 3 or 4 as indicated in b). Data were analyzed using the Mann-Whitney test.
-
Figure 2—source data 1
Platelet aggregation source data.
- https://cdn.elifesciences.org/articles/53353/elife-53353-fig2-data1-v2.xlsx
Figure 2—figure supplement 1
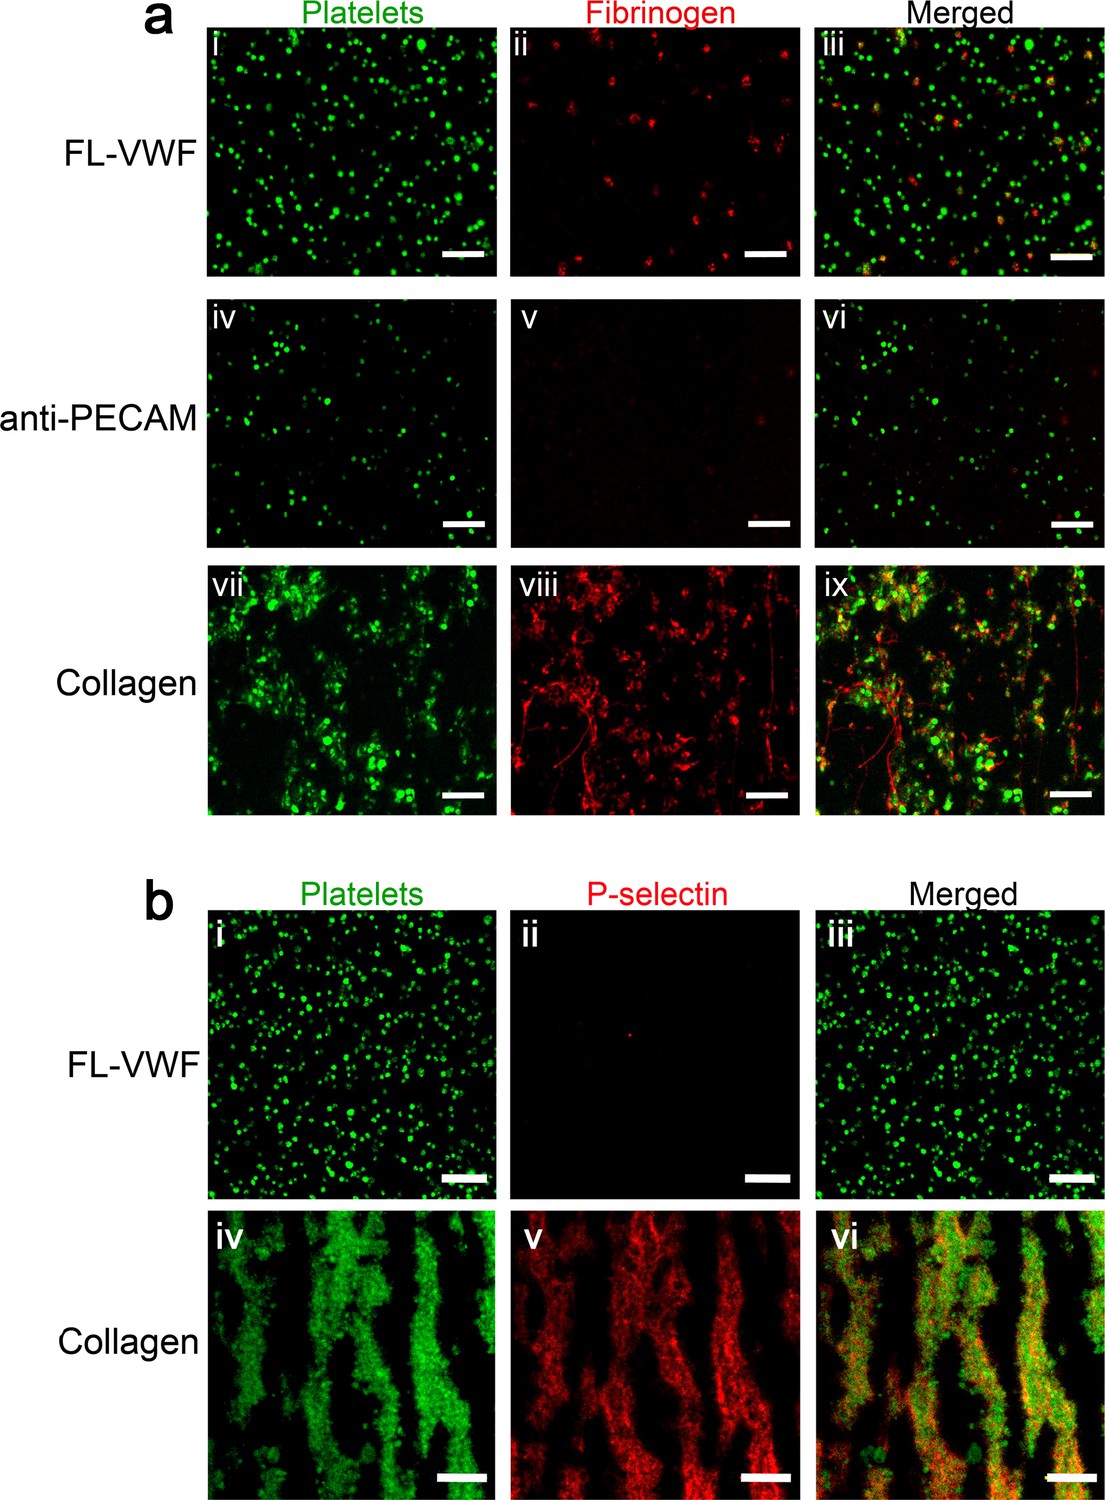
Platelets binding to VWF under flow are ‘primed’ leading to activation of αIIbβ3, but minimal presentation of P-selectin.
(a) Representative images (n = 3) depicting platelets (DiOC6, green) captured from plasma-free blood at 1000 s−1 for 3.5 min onto microchannel surfaces coated with either FL-VWF (i-iii), anti-PECAM (iv-vi) or collagen (vii-ix). Plasma-free blood was supplemented with fibrinogen-Alexa647 (red). Merged images show fluorescent fibrinogen attached to the platelets captured by FL-VWF and collagen, but not by platelets captured by anti-PECAM. (b) Representative images (n = 3) depicting platelets (DiOC6, green) captured from whole blood at 1000 s−1 for 3.5 min onto microchannel surfaces coated with either FL-VWF (i-iii) or collagen (iv-vi). Blood was supplemented with anti-P-selectin-APC (red). Merged images show the presence of P-selectin on the surface of platelets captured by collagen, but very little/no P-selectin on platelets captured FL-VWF. Scale bar = 20 μm.
Figure 3 with 1 supplement
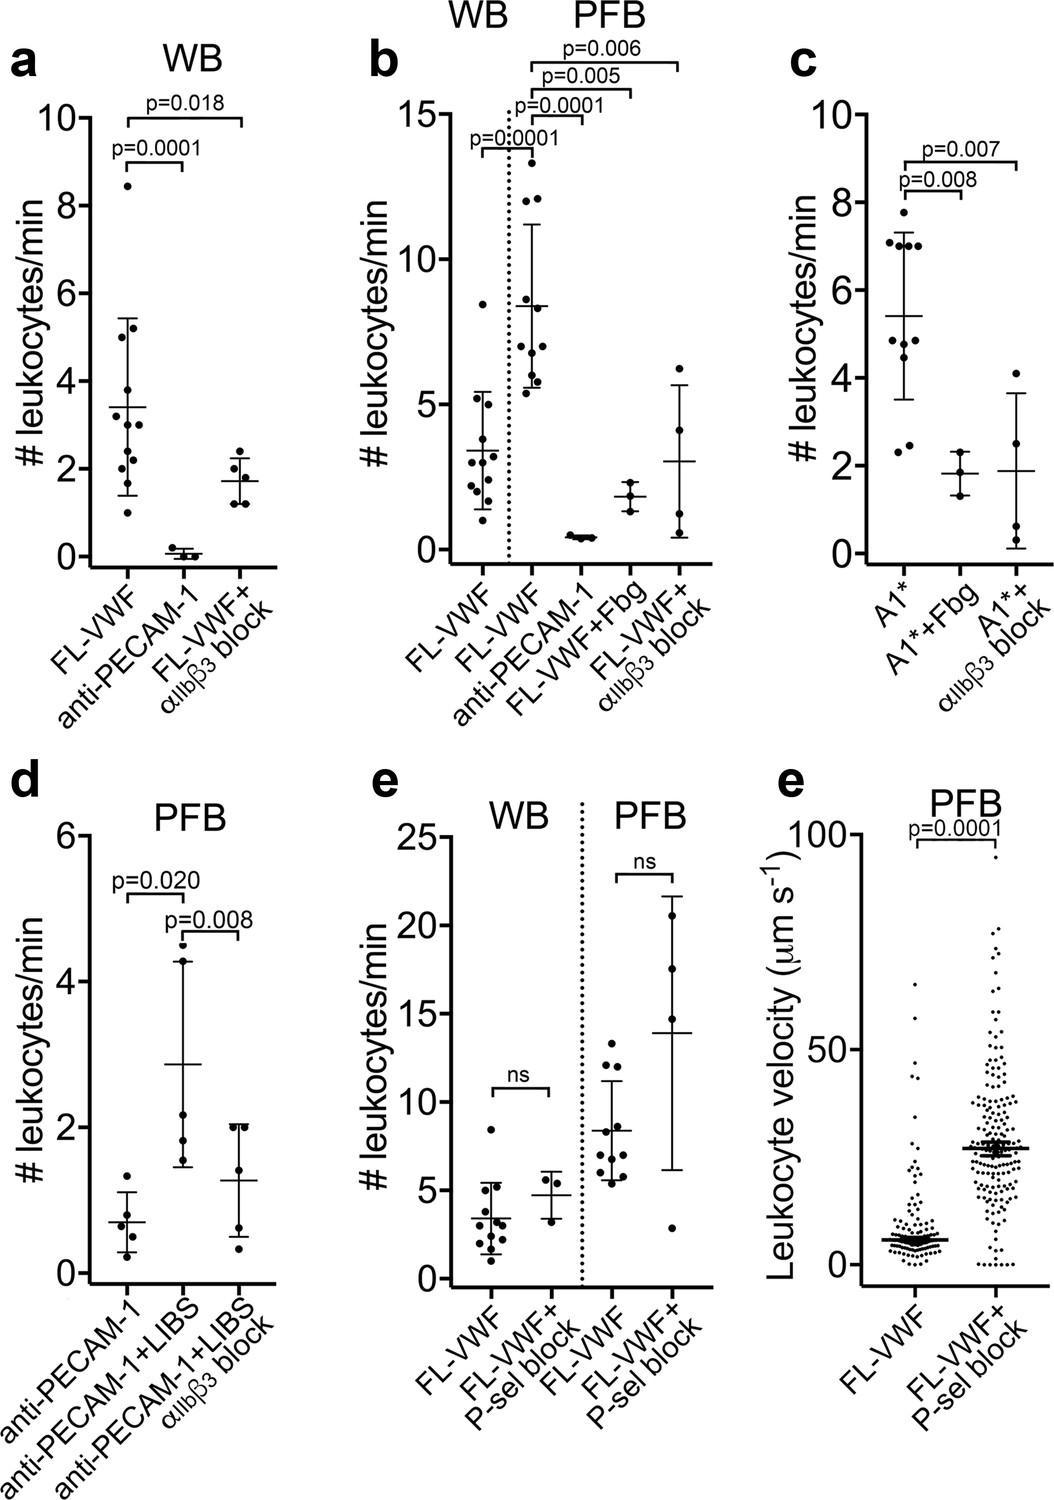
Leukocytes bind to VWF-bound platelets under flow (see also Video 3).
(a) Graph of the number of leukocytes/minute in WB interacting with platelets bound to FL-VWF in the absence (n = 12) or presence of eptifibatide/GR144053 (n = 5) or binding to platelets bound to anti-PECAM-1 antibody (n = 3). (b) Graph of the number of leukocytes/minute in WB or PFB interacting with platelets bound to FL-VWF in the absence (n = 12) or presence of 1.3 mg/ml fibrinogen (n = 3) or eptifibatide/GR144053 (n = 4), or binding to platelets bound to anti-PECAM-1 antibody (n = 3). (c) Graph of the number of leukocytes/minute in PFB interacting with platelets bound to A1* in the absence (n = 11) or presence of fibrinogen (n = 3) or eptifibatide/GR144053 (n = 4). (d) Graph of the number of leukocytes/minute in PFB interacting with platelets bound to anti-PECAM-1 antibody in the absence (n = 5) or presence of LIBS/anti-β3 activating antibody (n = 5)±GR144053 (n = 5). (e) Graph of the number of leukocytes/minute in WB or PFB, as shown, interacting with platelets bound to FL-VWF in the absence or presence of a blocking anti-P-selectin antibody. (f) Graph of leukocyte rolling velocity on platelets bound to FL-VWF in PFB in the absence or presence of a blocking anti-P-selectin antibody. Data shown are individual leukocyte rolling velocities (n=121 and 178, respectively) for three separate experiments. In all graphs, data plotted are mean ± SD. Data were analyzed using unpaired, two-tailed Student’s t test; ns not significant.
-
Figure 3—source data 1
Leukocytes bind to VWF-bound platelets source data.
- https://cdn.elifesciences.org/articles/53353/elife-53353-fig3-data1-v2.xlsx
Figure 3—figure supplement 1
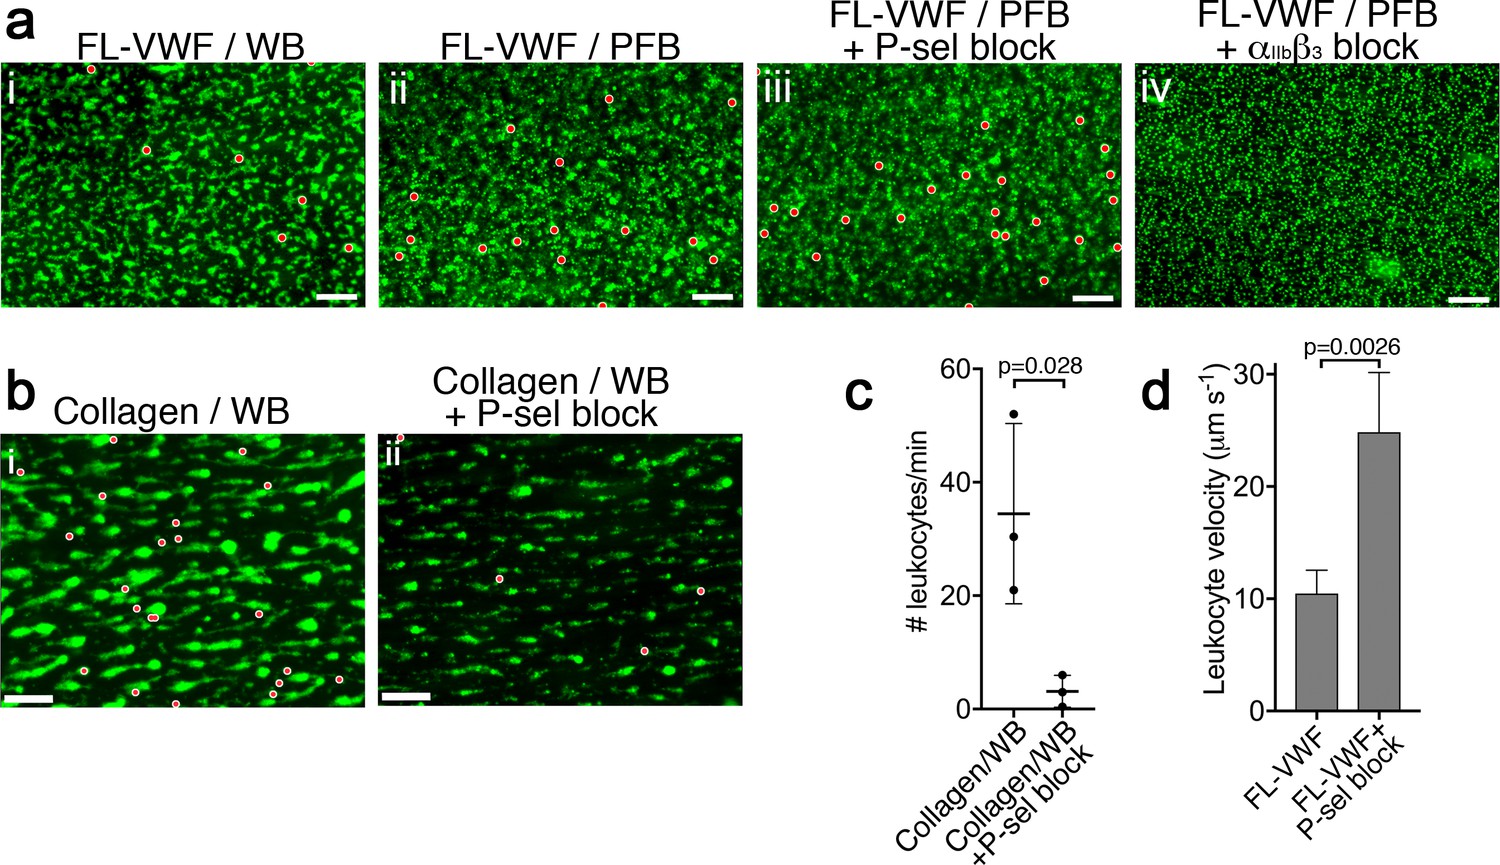
Antibody-mediated blockade of P-selectin diminishes leukocyte binding to collagen bound platelets.
(a) Vena8 microchannels were coated with FL-VWF. (i) Whole blood (WB), ii) plasma-free blood (PFB), iii) WB containing anti-P-selectin blocking antibody, or iv) WB containing eptifibatide were perfused through channels at 1000 s−1 for 3.5 min. Thereafter, the shear rate was reduced to 50 s−1 for 5 min. Platelets and leukocytes were labeled with DiOC6, platelets are shown in green, leukocytes have been pseudo-colored red to aid visualization. Scale bar; 50 μm (see also Video 3). (b) Whole blood (WB), labeled with DiOC6 was perfused over collagen microchannels at 1000 s−1 for 3.5 min. Thereafter, the shear rate was reduced to 50 s−1 to monitor leukocyte interactions. (i) Representative image (n = 3) shown after 5 min platelets (green) and leukocytes (pseudo-colored red). (ii) as in (i) except WB was supplemented with a blocking anti-P-selectin antibody (AK-4 clone. Scale bar = 50 μm. (c) The mean number of leukocytes binding per minute ± SD was calculated for each channel. There was a significant reduction in the number of leukocytes binding to collagen-bound platelets in the presence of P-selectin blocker, although leukocyte binding was not completely inhibited, suggesting that not all binding to collagen-activated platelets is P-selectin-dependent. (d) Graph of leukocyte rolling velocity on platelets bound to FL-VWF in WB in the absence or presence of a blocking anti-P-selectin antibody. Data shown are the means of individual leukocyte rolling velocities for three separate experiments. Unpaired, two-tailed Student’s t test.
-
Figure 3—figure supplement 1—source data 1
P-selectin blocking source data.
- https://cdn.elifesciences.org/articles/53353/elife-53353-fig3-figsupp1-data1-v2.xlsx
Figure 4
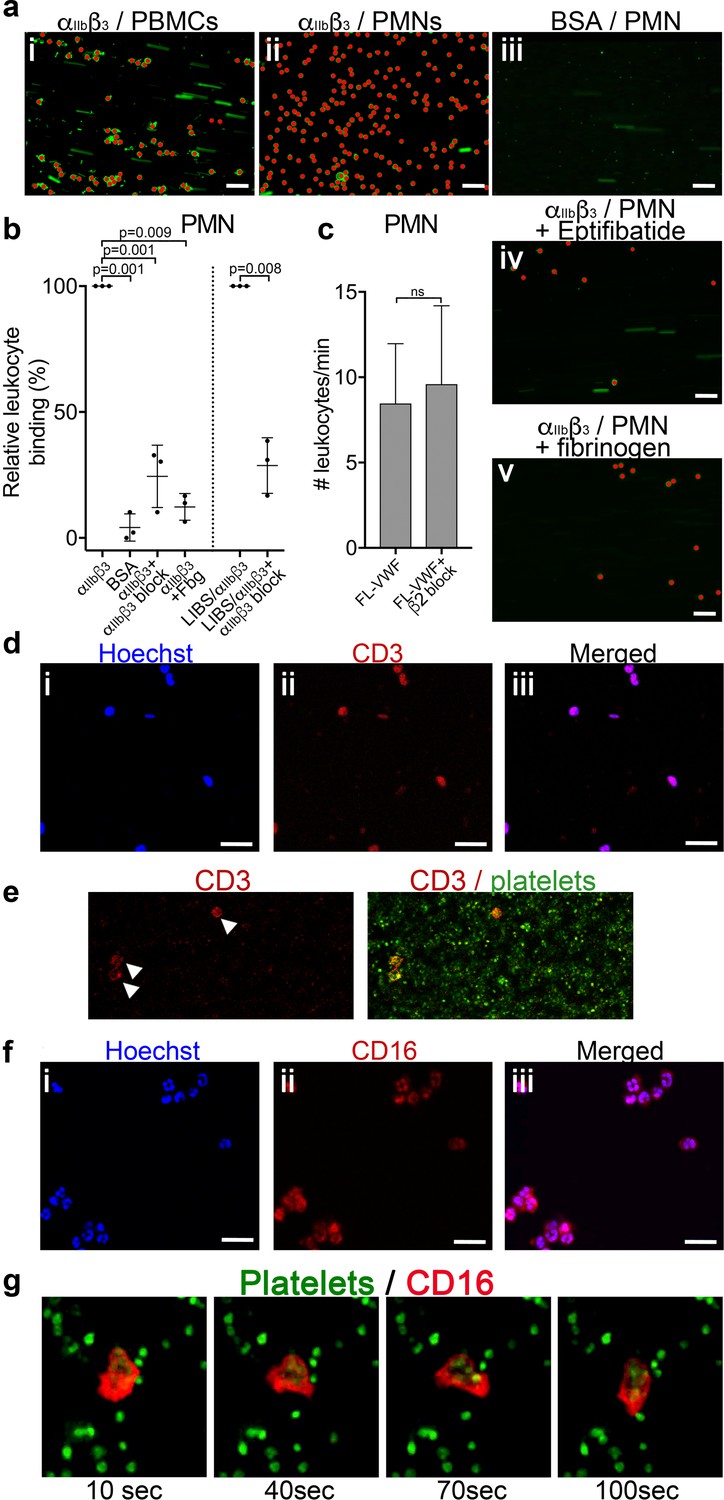
Leukocytes bind to activated αIIbβ3 under flow.
(a) Purified αIIbβ3 or BSA, as noted, were covalently coupled to microchannel surfaces by amine coupling. αIIbβ3 was activated using Mn2+ and Ca2+ in all buffers. PBMCs (i) or PMNs (ii-v) labeled with DiOC6 were perfused through channels at 50 s−1 in the presence and absence of eptifibatide (iv) or 1.3 mg/ml purified fibrinogen (v). Bound leukocytes (as opposed to flowing) are pseudo-colored red to aid visualization and to distinguish from leukocytes in transit. Scale bar; 50 μm. (b) Graphical representation of relative leukocyte binding to activated αIIbβ3 in the presence and absence of eptifibatide or 1.3 mg/ml purified fibrinogen, or to BSA after 15 min of PMN perfusion (n = 3), or to αIIbβ3 captured and activated by LIBS/anti-β3 activating antibody in the absence and presence of GR144053 (n = 3). Data plotted are mean ± SD. Data were analyzed using unpaired, two-tailed Student’s t test. (c) Graph of the number of leukocytes/minute in PFB interacting with platelets bound to FL-VWF in the absence (n = 12) or presence of a blocking anti-β2 integrin polyclonal antibody (n = 5) capable of blocking both LFA-1 or Mac-1 on leukocytes. (d) PBMCs stained with Hoechst dye (i - blue), anti-CD3 (ii - red) and merged (iii). Representative of n = 4. Scale bar; 20 μm. (e) PFB stained with DiOC6 was perfused over FL-VWF at 1000 s−1 followed by 50 s−1. T-cells labeled with anti-CD3 (red - arrows) were seen to attach to ‘primed’ platelets f) PMNs stained with Hoechst dye (i - blue), anti-CD16 (ii - red) and merged (iii). Representative of n = 4. Scale bar; 20 μm (see also Video 4). (g) Images depicting a neutrophil stained with anti-CD16 (red) ‘scanning’ the ‘primed’ platelets stained with DiOC6 (green). Images shown were taken 10, 40, 70 and 100 s after neutrophil attachment note the movement of the neutrophil shown - see also Video 4.
-
Figure 4—source data 1
Leukocytes bind to activated αIIbβ3 source data.
- https://cdn.elifesciences.org/articles/53353/elife-53353-fig4-data1-v2.xlsx
Figure 5
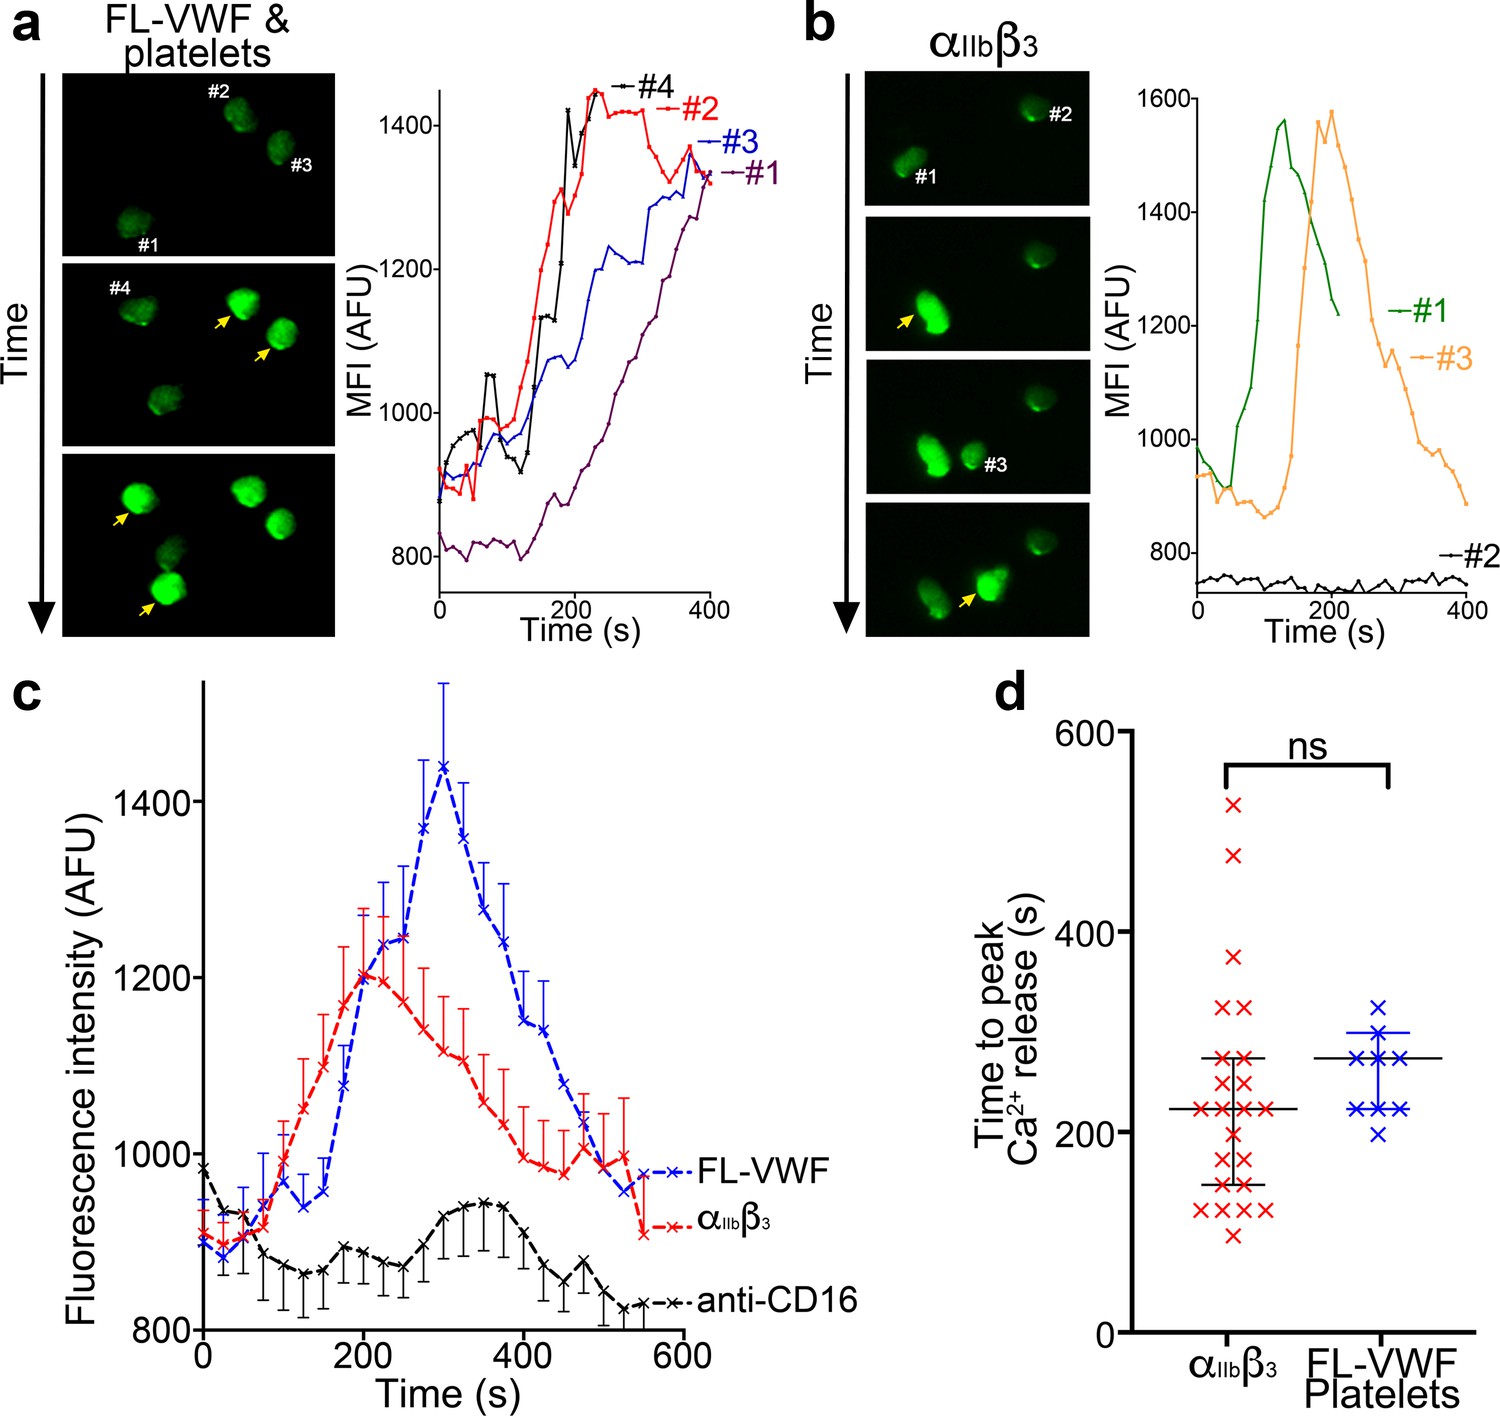
Binding to αIIbβ3 induces intracellular Ca2+ release in neutrophils.
(a) Representative images of neutrophils pre-loaded with Fluo-4 AM bound to VWF-‘primed’ platelets captured (Video 5). Neutrophils are numbered #1-#4. The yellow arrow highlights a frame in which the fluorescence has increased in the attached neutrophil. For each neutrophil shown, intracellular Ca2+ release is quantified by measurement of cellular mean fluorescent intensity (MFI) over time. (b) As in A) except neutrophils were perfused over activated αIIbβ3. MFI increased for neutrophils #1 and #3, but not for neutrophil #2. (c) Graph depicting the change in MFI as a function of time after neutrophil attachment to microchannels coated with activated αIIbβ3 (n = 24 neutrophils from three different experiments), VWF-‘primed’ platelets (n = 9 neutrophils from one experiment) or anti-CD16 (n = 13 neutrophils from two different experiments). Data plotted are mean ± SEM. (d) Dot plot presenting the time between neutrophil attachment and maximum MFI of neutrophils binding to purified αIIbβ3 (red), or VWF-‘primed’ platelets (blue). Data plotted are median ±95% confidence interval. Data were analyzed using the Mann-Whitney test.
-
Figure 5—source data 1
Ca2+ release in neutrophils source data.
- https://cdn.elifesciences.org/articles/53353/elife-53353-fig5-data1-v2.xlsx
Figure 6
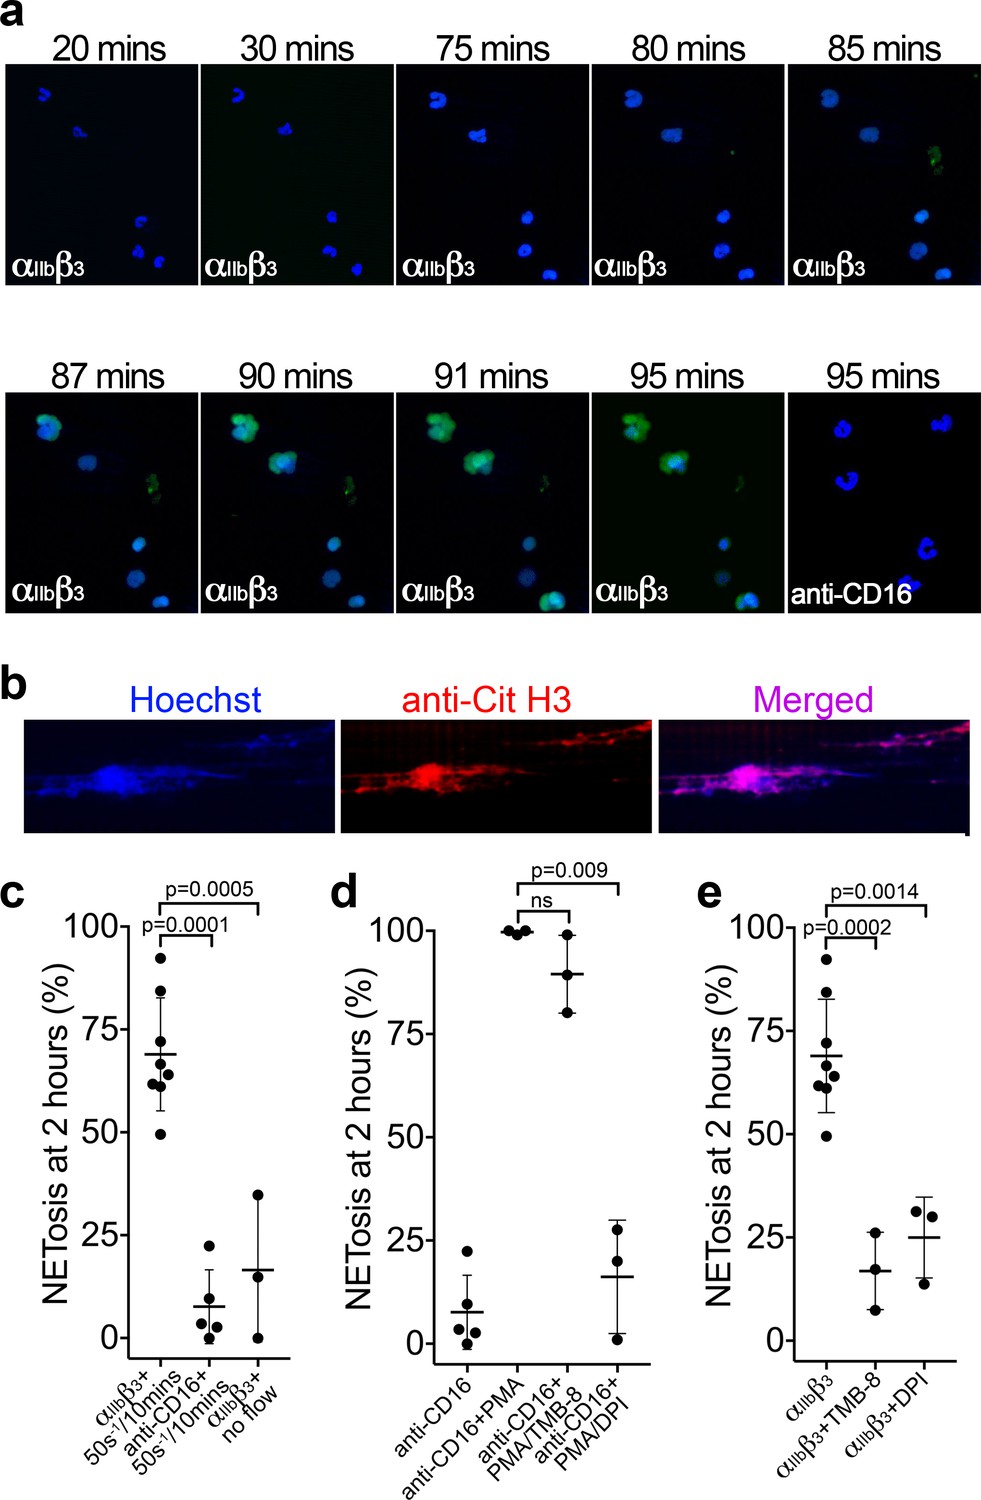
Binding of neutrophils to αIIbβ3 under flow induces NETosis.
(a) Isolated PMNs labeled with Hoechst (blue) and cell-impermeable Sytox Green were perfused over αIIbβ3-coated microchannels, or anti-CD16, (-ve ctrl) at 50 s−1 for 10 min and then monitored under static conditions. Representative composite images after 20, 30, 75, 80, 85, 87, 90, 91 and 95 min of attachment. Neutrophils bound to αIIbβ3 exhibited nuclear decondensation and increased cell permeability that precedes NETosis after about 85 min, Sytox Green staining appears, indicative of DNA becoming extracellular (see Video 6). Neutrophils bound to surfaces using an anti-CD16 antibody did not exhibit signs of NETosis or did so very rarely. (b) Immunostaining of neutrophils bound to αIIbβ3 after 90 mins as in a). Hoechst (blue), citrullinated H3 (red) and merged images are shown. (c) Graph showing the mean % of neutrophils ± SD in the entire microchannel that formed NETs after 2 hr of attachment on αIIbβ3 (n = 8) or anti-CD16 (n = 5), captured in the presence of flow (50 s−1/10 min), or captured on αIIbβ3 under static/no flow conditions (n = 3). (d) Graph showing the mean % of neutrophils ± SD in the entire microchannel that formed NETs after 2 hr of attachment on anti-CD16 antibody in the presence of flow (50 s−1/10 min) (n = 5) in the presence of PMA (n = 3), PMA and TMB-8 (n = 3) or PMA and DPI (n = 3). (e) Graph showing the mean % of neutrophils ± SD in the entire microchannel that formed NETs after 2 hr of attachment on αIIbβ3 in the presence of flow (50 s−1/10 min) (n = 8) and in the presence of TMB-8 (n = 3) or DPI (n = 3), as noted. Data were analyzed using unpaired, two-tailed Student’s t test; ns not significant.
-
Figure 6—source data 1
NETosis source data.
- https://cdn.elifesciences.org/articles/53353/elife-53353-fig6-data1-v2.xlsx
Figure 7 with 1 supplement
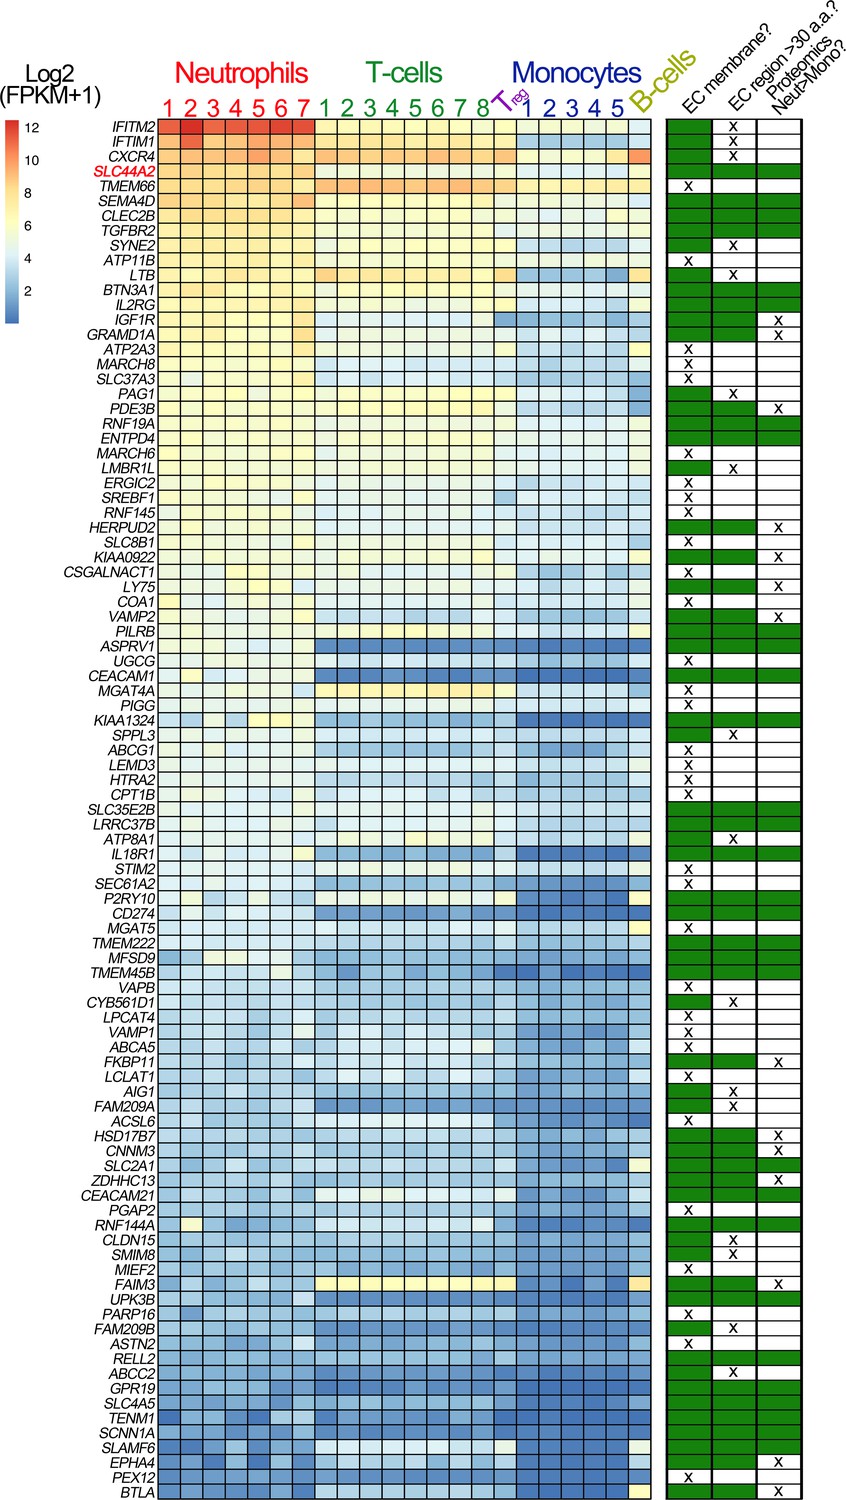
Transcriptomic profiling of human leukocytes.
RNA sequencing data from different leukocytes were obtained from the BLUEPRINT consortium (Grassi et al., 2019). Differential gene expression analyses were performed: mature neutrophils (n = 7) vs monocytes (n = 5) and CD4-positive/αβ T cells (n = 8) vs monocytes (n = 5). Regulatory T cells (Treg, n = 1) and native B cells (n = 1), are included in the heatmap, for comparison but were not used in differential gene expression analysis due to the low number of biological replicates. We first selected genes that were expressed significantly higher in neutrophils than in monocytes, and also those that were significantly higher in CD4-positive/αβ T cells than in monocytes. Their intersection identified 750 genes (598 of which protein coding). From these 598 genes, we selected the 93 genes that contained the Uniprot annotation of ‘INTRAMEMBRANE DOMAIN’ or ‘TRANSMEM DOMAIN’. The effective log2(FPKM+1) data are presented in the heatmap of the 93 genes, with the rows ordered according to the mean neutrophil expression levels. Next to the heatmap is a table highlighting the subsequent selection criteria used to further narrow the search for candidate receptors for αIIbβ3. The first round of selection involved discarding those transmembrane proteins that are not present on the extracellular membrane, or primarily associated with intracellular membranes. The second selection criterion was to discard those proteins that had extracellular regions of <30 amino acids that might be less likely capable of mediating specific ligand binding. Finally, analysis of proteomic data from the ImmProt (http://immprot.org) resource was used to verify higher levels of protein of each selected gene in neutrophils than in monocytes.
Figure 7—figure supplement 1
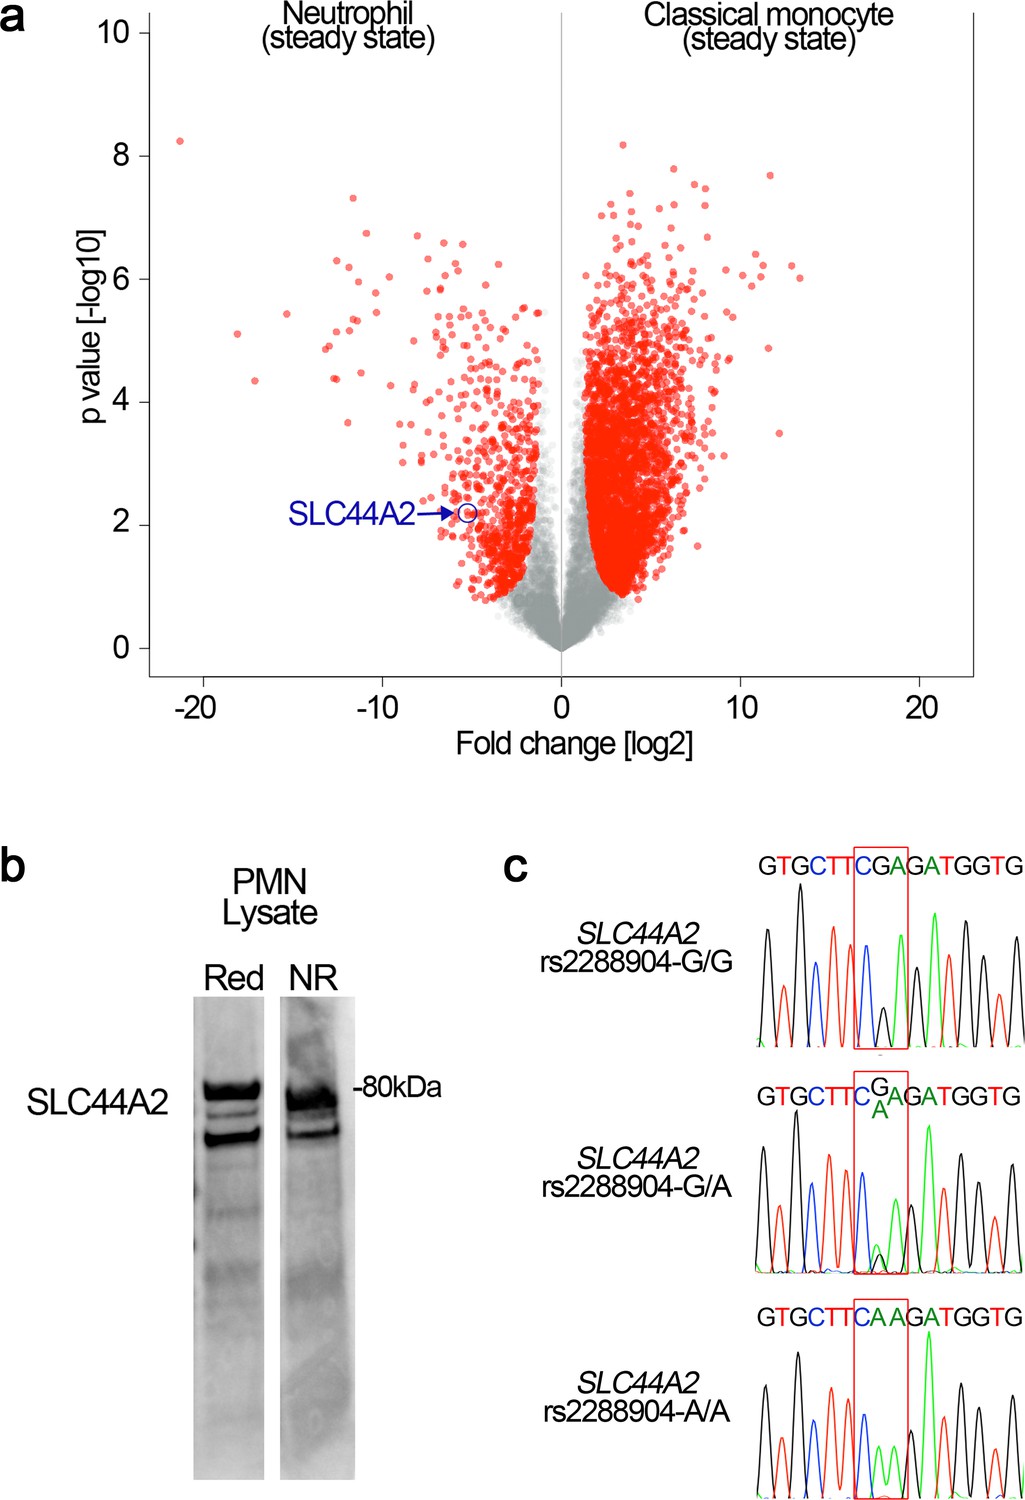
SLC44A2 expression in neutrophils and SLC44A2 genotype analysis.
(a) Preferential expression of SLC44A2 in neutrophils over monocytes was ascertained through analysis of proteomic data from ImmProt (http://immprot.org), which is based on high-resolution mass-spectrometry proteomics performed on human hematopoietic cell populations in either steady or activated states. A pair-wise comparison between neutrophils (steady-state) and classical monocytes (steady state) is displayed as a volcano plot. Protein expression levels were compared using two-tailed Student’s t-test with Welch’s correction (S0 = 1, FDR < 5%), and proteins with a significantly different expression level are shown in red on the plot. The point corresponding to SLC4A2 is highlighted revealing preferential expression in neutrophils. All 30 candidate genes identified in Figure 8 were analyzed through this comparative approach to examine preferential protein levels in neutrophils above monocytes. (b) Isolated neutrophil lysates were analyzed by Western blotting under reducing and non-reducing conditions using anti-SLC4A2 #2 antibody. In both lanes, two bands corresponding to glycosylated (~80 kDa) and nascent, non-glycosylated SLC44A2 are detected. (c) Healthy volunteers were genotyped to identify individuals homozygous for the protective rs2288904-A/A SNP in SLC44A2. Representative chromatograms for individuals with rs2288904-G/G, rs2288904-G/A, rs2288904-A/A genotypes are shown.
-
Figure 7—figure supplement 1—source data 1
SLC44A2 Western blot source data.
- https://cdn.elifesciences.org/articles/53353/elife-53353-fig7-figsupp1-data1-v2.xlsx
Figure 8
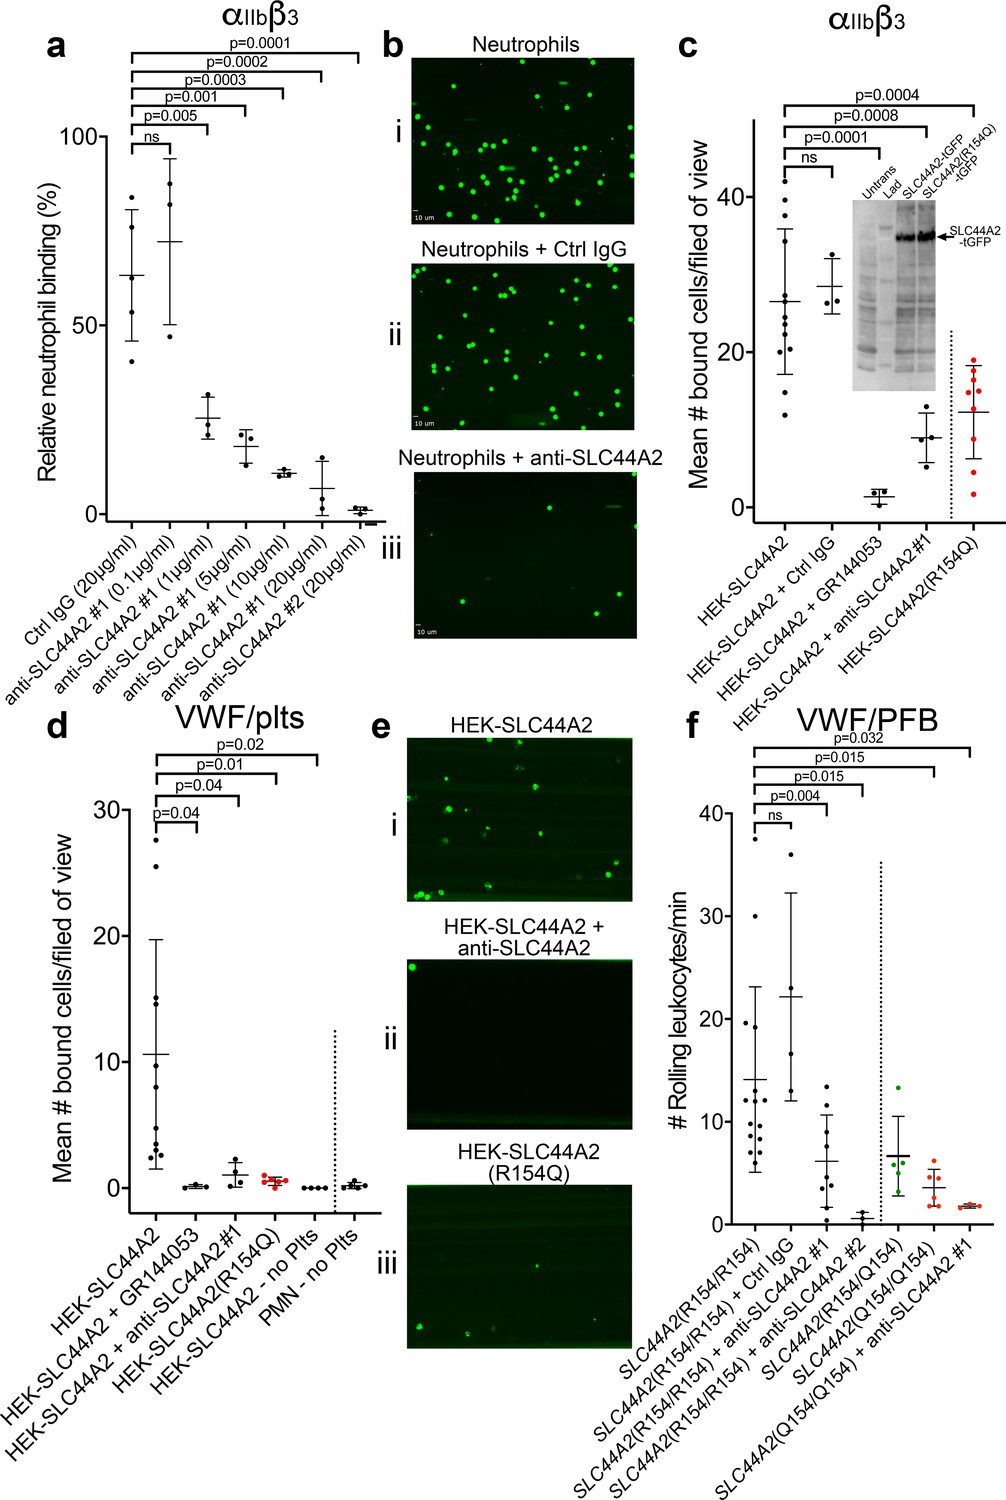
SLC44A2 binds activated αIIbβ3.
(a) Graphical representation of relative neutrophil binding after 15 min of leukocyte perfusion at 50 s−1 to activated αIIbβ3 captured and activated by LIBS2/anti-β3 activating antibody in the presence and absence of increasing concentrations of anti-SLC44A2#1 or #2 antibodies. Data plotted are mean ± SD. Data were analyzed using One-Way ANOVA with multiple comparisons. (b) Representative micrographs of neutrophils bound to activated αIIbβ3 i) in the absence of antibody, ii) in the presence of control IgG and iii) in the presence of anti-SLC44A2#1. (c) Graphical representation of the number of HEK293T cells transfected with either SLC44A2-tGFP or SLC44A2(R154Q)-tGFP (shown in red) expression vectors binding to activated αIIbβ3 (captured and activated by LIBS2/anti-β3 activating antibody) after 10 min flow at 25 s−1. Experiments were performed in the presence and absence of either GR144053 or anti-SLC44A2#1 antibody. Data presented are the mean number of bound cells per field of view. Data were analyzed using one-way ANOVA with multiple comparisons. Inset shows a western blot of untransfected HEK293T cells, or HEK293T cells transfected with either SLC44A2-tGFP or SLC44A2(R154Q)-tGFP and detected using an anti-tGFP mAb. Only tGFP (26 kDa) fused to SLC44A2 (70 kDa) was detected in transfected cells; tGFP was uniformly associated with SLC44A2 and the SLC44A2(R154Q) variant (d) Graphical representation of the number of HEK293T cells transfected with either SLC44A2-tGFP or SLC44A2(R154Q)-tGFP (shown in red) expression vectors interacting with VWF-‘primed’ platelets. Plasma-free blood was first perfused at 1000 s−1 for 3.5 mins to capture and ‘prime’ the platelets, and transfected HEK293T cells were subsequently perfused at 25 s−1 for 10 min, in the presence and absence of GR144053 or anti-SLC44A2#1 antibody. HEK293T cells transfected with SLC44A2-tGFP or isolated neutrophils were also perfused over VWF in the absence of platelets, for 30 mins at 25 s−1 or 50 s−1 respectively. Data presented are the mean number of bound cells per field of view. Data were analyzed using one-way ANOVA with multiple comparisons. (e) Representative micrographs of HEK293T cells transfected with i) SLC44A2-tGFP in the absence of antibody, ii) SLC44A2-tGFP in the presence of anti-SLC44A2#1 antibody and iii) SLC44A2(R154Q)-tGFP bound to activated VWF-‘primed’ platelets. (f) Graphical representation of the number of neutrophils rolling per minute on VWF-‘primed’ platelets. PFB from individuals homozygous for the R154-encoding allele of SLC44A2(R154/R154) or the Q154-encoding allele of SLC44A2(Q154/Q154) (shown in red), or heterozygotes SLC44A2(R154/Q154) (shown in green) were perfused over ‘primed’ platelets for 10 min at 50 s−1 (see Video 7). Experiments were performed in the presence and absence of anti-SLC44A2#1 or anti-SLC44A2#2 antibodies. Data plotted are mean ± SD. Data were analyzed using one-way ANOVA with multiple comparisons.
-
Figure 8—source data 1
SLC44A2 binds activated αIIbβ3 source data.
- https://cdn.elifesciences.org/articles/53353/elife-53353-fig8-data1-v2.xlsx
Figure 9
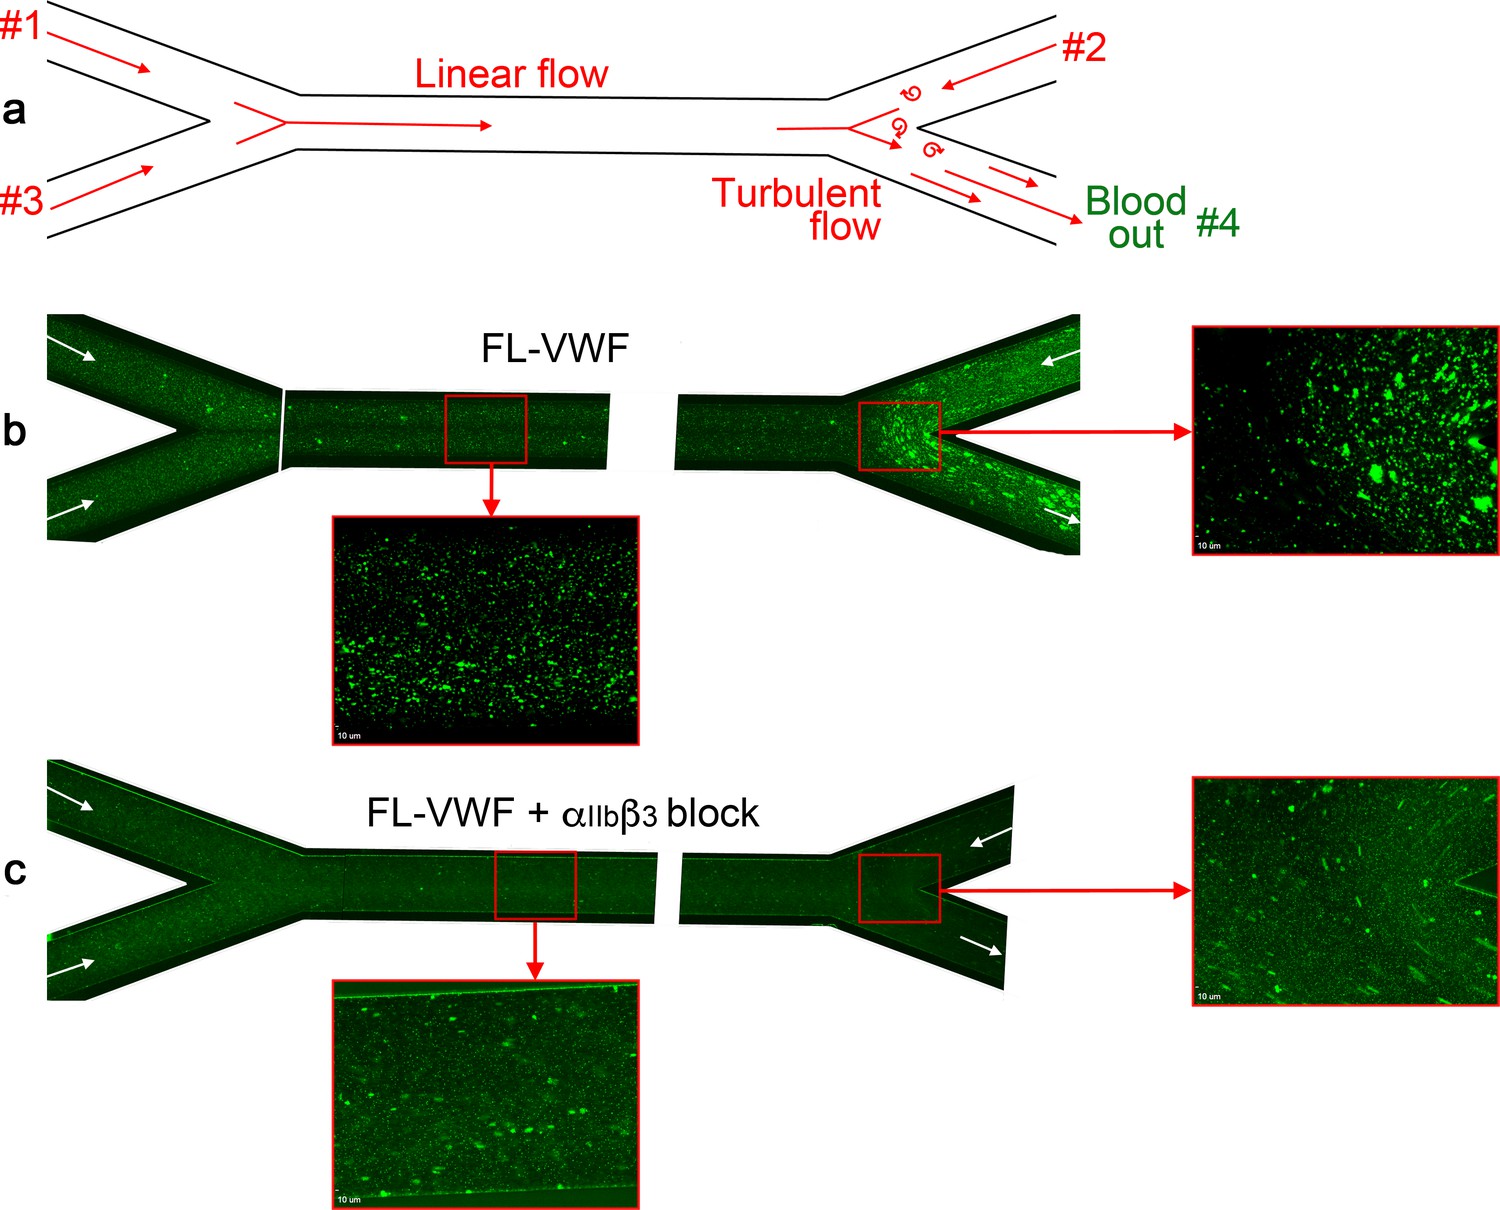
Analysis of platelet binding to FL-VWF under low/disturbed flow and subsequent leukocyte binding.
(a) Schematic representation of blood flow through bifurcated channels. Blood is drawn through inlets #1, #2 and #3, and out through outlet #4. For much of the channels, the flow is linear, with particular exception to the bifurcation site on the right where disturbed flow exists due to convergence of flows. (b) Channels were coated with FL-VWF and whole blood labeled with DiOC6 was perfused through channels as in a), and as denoted by arrows, at an exit shear rate of 50 s−1. At this low shear rate, platelets can bind to the channel surface to which leukocytes (larger cells also stained in green) also bind. Although this is evident in the linear part of the channel (inset), at the site of most turbulent flow increased platelet and leukocyte binding was observed. (c) As in b) except GR144053 was added to block αIIbβ3. Blocking αIIbβ3 inhibited the majority of leukocyte binding to platelets (the majority of those observed are in transit). However, in the absence of leukocyte binding the binding of platelets to the VWF surface under low flow can be more clearly observed in both the linear and turbulent flow areas.
Figure 10
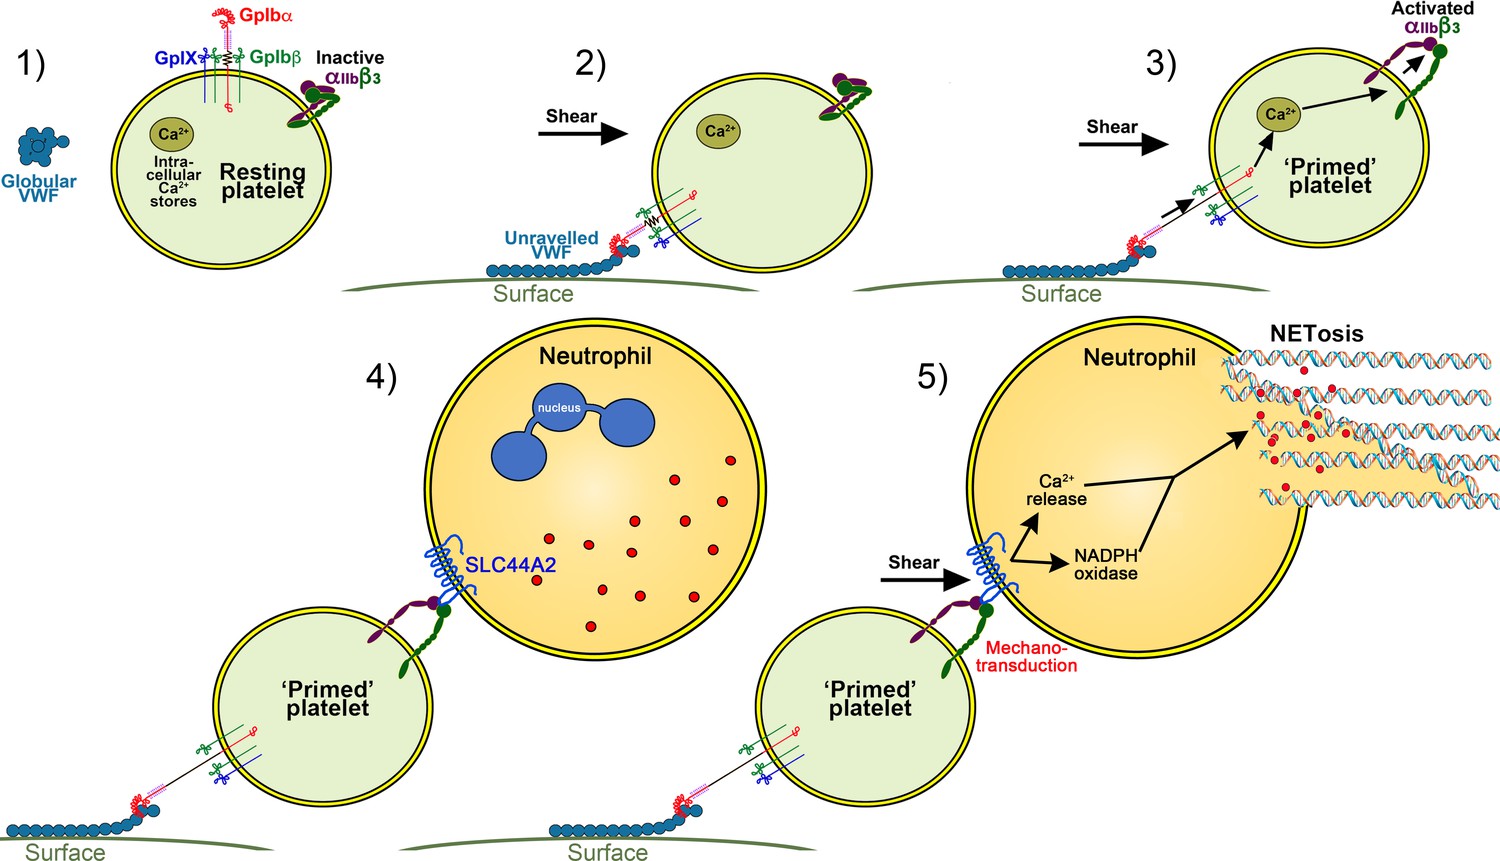
Model of platelet priming, neutrophil binding and NETosis.
(1) Under normal conditions, VWF circulates in plasma in a globular conformation that does not interact with platelets. Resting platelets present GPIbα on their surface - in complex with GPIbβ, GPIX and GPV - and also αIIbβ3 in its inactive conformation. (2) When VWF is attached to a cell surface (e.g. activated endothelial cell/Kuppfer cell or to a bacterial cell) or to an exposed collagen surface under flow, VWF unravels to expose its A1 domain enabling capture of platelets via GPIbα. (3) Binding of platelets to VWF under flow induces mechano-unfolding of the juxtamembrane stalk of GPIbα leading to intraplatelet signaling, release of intraplatelet Ca2+ stores and activation of integrin αIIbβ3.(4) Neutrophils can bind to activated αIIbβ3 under flow via SLC44A2. (5) Shear forces on the neutrophil induce mechanosensitive signaling into the neutrophil causing intracellular Ca2+ release and NADPH oxidase-dependent NETosis.
Author response image 1
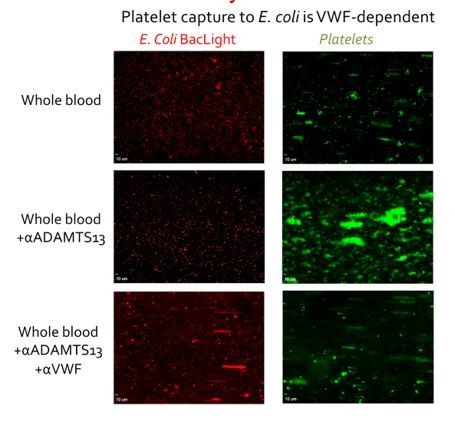
E. coli labelled with BacLight (red) were adsorbed to the surface of microchannels (left panels).
Thereafter, whole blood supplemented with DiOC6 to label platelets and leukocytes was perfused at 1000s-1 for 3 mins and then at 50s-1 for 3 mins. Platelets bound to E. coli in a VWF-dependent manner. Inhibiting ADAMTS13 (which cleaves VWF) with a pAb significantly increased platelet binding was observed, demonstrating the VWF-dependence of the platelet capture. Conversely when both ADAMTS13 and VWF were inhibited almost no platelet binding was detected, again highlighting the dependency upon VWF. When the flow was reduced to 50s-1, leukocytes bound to bound platelets, but not when VWF had been blocked (not shown).
Videos
Video 1
Platelet capture on FL-VWF, VWF A1 or VWF A1*.
Vena8 microchannels were coated with either full-length VWF (FL-VWF), VWF A1 or A1*. Whole blood labelled with DiOC6 was perfused at 1000 s−1 for 3 min. Note the reduced rate of platelet rolling on microchannels coated with A1* when compared to FL VWF or A1.
Video 2
VWF A1-GpIbα interaction induces intraplatelet Ca2+ release under flow.
Platelets were pre-loaded with Fluo-4 AM prior to perfusion through VWF A1*-coated microchannels at 1000 s−1 for 5 min. Increases in platelet fluorescence corresponds to platelet intracellular Ca2+ release following attachment to VWF A1*. Note the repeated transient increases in fluorescence under flow, indicative of sustained and repeated signaling stimuli.
Video 3
Leukocytes bind/roll on VWF-‘primed’ platelets.
Whole blood or plasma-free blood labeled with DiOC6 was perfused through channels coated with VWF A1* at high shear for 3.5 min to capture platelets in the presence or absence of either a blocking anti-P-selectin antibody or eptifibatide (αIIbβ3 blocker) prior to the acquisition of videos. The shear rate was reduced to 50 s−1 to visualize leukocyte rolling or attaching (tracked in blue). Leukocytes rolled/bound on platelets in whole blood, plasma-free blood and plasma-free blood containing anti-P-selectin blocking antibody, but not in the presence of eptifibatide (αIIbβ3 blocker). The use of the anti-P-selectin blocking antibody did, however, increase the rolling velocity of leukocytes over the platelet surface.
Video 4
Neutrophil start scanning following interaction with activated αIIbβ3.
Following attachment of neutrophils (labeled with anti-CD16; red) to platelets (green) captured on FL-VWF (left), neutrophils start to scan the platelet surface. Similarly, neutrophils (anti-CD16-APC and Hoechst staining) bound to activated αIIbβ3-coated microchannels also scanned the surface and in some cases appeared to start migrating against the direction of flow. Shear rate = 50 s−1.
Video 5
Intracellular Ca2+ release in neutrophils following interaction with activated αIIbβ3 under flow.
Neutrophils were pre-loaded with Fluo-4 AM and perfused over FL-VWF ‘primed’ platelets, αIIbβ3-coated or anti-CD16 coated microchannels at 50 s−1. Following attachment of neutrophils to VWF-‘primed’ platelets or activated αIIbβ3 (but not anti-CD16), an increase in fluorescence corresponding to neutrophil intracellular Ca2+ release was observed.
Video 6
αIIbβ3-induced NETosis.
Isolated PMNs labeled with Hoechst (blue) and cell-impermeable Sytox Green were perfused over αIIbβ3-coated microchannels at 50 s−1 for 10 min and then monitored under static conditions. Video shown represents period from 80 to 95 min after attachment. Sytox Green staining appears, indicative of DNA becoming extracellular highlights the neutrophils undergoing NETosis.
Video 7
Neutrophil binding to VWF-‘primed’ platelets occurs via SLC44A2 is modified by the rs2288904 SNP.
Plasma-free blood generated from individuals homozygous for the rs2288904-G major allele in SLC44A2 (SLC44A2 (R154/R154)) or the rs2288904-A minor allele (SLC44A2 (Q154/Q154)) SNP in SLC44A2 was labeled with DiOC6 and perfused through channels coated with VWF at high shear for 3.5 min. Shear was subsequently reduced to 50 s−1. SLC44A2 (R154/R154) leukocytes (tracked in blue) were seen to roll on the VWF-‘primed’ platelets. The number of leukocytes interacting was severely reduced in the presence of the anti-SLC44A2 #2 antibody. Leukocytes homozygous for the rs2288904-A minor allele, SLC44A2 (Q154/Q154), associated with protection against venous thrombosis, exhibited reduced ability to interact with VWF-‘primed’ platelets.
Tables
Key resources table
| Reagent type (species) or resource | Designation | Source or reference | Identifiers | Additional information |
|---|---|---|---|---|
| Recombinant DNA reagent | pMT-puro VWFA1-V5-His | In house | The insect cell expression vector to express VWF A1 domain can be obtained from Prof Crawley | |
| Recombinant DNA reagent | pMT-puro VWFA1*- V5-His | In house | The insect cell expression vector to express VWF A1* domain can be obtained from Prof Crawley | |
| Bacterial strain, strain background (E. coli) | TOP10 (DH10B background) | Invitrogen | C4040-03 | Chemically competent cells |
| Antibody | anti-6xHis-HRP (rabbit polyclonal) | Abcam | RRID:AB_298652 | (WB: 1:10000) |
| Cell line (D. melanogaster) | S2 | S2 cells originally from ATCC transfected and selected in house | VWF A1-V5-His/S2 and VWF A1*-V5-His/S2 | Cell line maintained in Crawley lab; stably transfected with human VWF A1 domain-V5-Hisor VWF A1*-V5-His |
| Cell line (Homo-sapiens) | Human embryonic Kidney HEK293T | ATCC | RRID:CVCL_0063 | |
| Antibody | anti-VWF (rabbit polyclonal) | Agilent | RRID:AB_2315602 | (WB 1:1000) |
| Biological sample (Homo sapiens) | αIIbβ3 | Enzyme Research Laboratories | GP2b3a | αIIbβ3 isolated from human platelets |
| Antibody | anti-PECAM-1 (mouse monoclonal) | BioLegend | RRID:AB_314328 | (flow assays: 0.25 mg/ml IF:50 μg/ml) |
| Antibody | anti-beta3 (LIBS2) (mouse monoclonal) | Millipore | RRID:AB_10806476 | (flow assays 0.25 mg/ml) |
| Antibody | anti-CD16 (mouse monoclonal) | eBiosciences | RRID:AB_467129 | (flow assays 0.25 mg/ml) |
| Chemical compound, drug | eptifibatide | Sigma | SML1042-10MG | αIIbβ3 blocking/inhibition 2.4 μM |
| Chemical compound, drug | GR144053 | Tocris | 1263 | αIIbβ3 blocking/inhibition 2 μM |
| Antibody | anti-P-selectin (mouse monoclonal) | BD Biosciences | RRID:AB_395908 | Clone Ak4 (blocking P-selectin: 50 μg/ml) |
| Antibody | anti-SLC44A2 #1 (rabbit polyclonal) | Abcam | RRID:AB_2827953 | (SLC44A2 blocking 0–20 μg/ml) |
| Antibody | anti-SLC44A2 #2 (rabbit polyclonal) | LS Bio | RRID:AB_2827954 | (SLC44A2 blocking 0–20 μg/ml) |
| Antibody | anti-CD14-APC (mouse monoclonal) | BioLegend | RRID:AB_314190 | (IF 1:20) |
| Antibody | anti-CD3-APC (mouse monoclonal) | BioLegend | RRID:AB_314066 | (IF 1:20) |
| Antibody | anti-CD19-APC (mouse monoclonal) | BioLegend | RRID:AB_314242 | (IF 1:20) |
| Antibody | anti-CD16-APC (mouse monoclonal) | eBiosciences | RRID:AB_2016663 | (IF 1:20) |
| Chemical compound, drug | TMB-8 | Sigma | T111 | PKC inhibition: 20 μM |
| Chemical compound, drug | DPI | Sigma | 300260 | NADPH oxidase inhibition: 30 μM |
| Recombinant DNA reagent | pCMV6 Entry/SLC44A2-tGFP (plasmid with cDNA) | Origene | RG207181 | Expression vector of human SLC44A2 with C-terminal turbo GFP fusion |
| Recombinant DNA reagent | pCMV6 Entry/SLC44A2(R154Q)-tGFP (plasmid with cDNA) | In house | As above but containing SLC44A2 (R154Q) variant. The expression vector pCMV6 Entry/SLC44A2(R154Q)-tGFP can be obtained from Prof Crawley | |
| Sequence-based reagent | R154Q top primer | Invitrogen | 5’-GTG GCT GAG GTG CTT CAA GAT GGT GAC TGC CCT-3’ | |
| Sequence-based reagent | R154Q bot primer | Invitrogen | 5’-AGG GCA GTC ACC ATC TTG AAG CAC CTC AGC CAC-3’ | |
| Sequence-based reagent | SLC44A2 top sequencing primer | Invitrogen | 5’-ACC TCA CGT ACC TGA ATG-3’ | |
| Sequence-based reagent | SLC44A2 bot sequencing primer | Invitrogen | 5’-AGC CAT GCC CAT CCT CAT AG-3’ | |
| Antibody | anti-tGFP (mouse monoclonal) | Origene | RRID:AB_2622256 | (WB:0.3 μg/ml) |
| Antibody | anti-Cit H3 (rabbit polyclonal) | Abcam | RRID:AB_304752 | (IF:10 μg/ml) |
| Software | GraphPad Prism | GraphPad Prism | RRID:SCR_002798 | |
| Software | SlideBook 6.0 | 3i | RRID:SCR_014300 |
Additional files
Download links
A two-part list of links to download the article, or parts of the article, in various formats.
Downloads (link to download the article as PDF)
Open citations (links to open the citations from this article in various online reference manager services)
Cite this article (links to download the citations from this article in formats compatible with various reference manager tools)
Activated αIIbβ3 on platelets mediates flow-dependent NETosis via SLC44A2
eLife 9:e53353.
https://doi.org/10.7554/eLife.53353


