Theoretical relation between axon initial segment geometry and excitability
- Sorbonne Université, INSERM, CNRS, Institut de la Vision, France
Figures
Figure 1
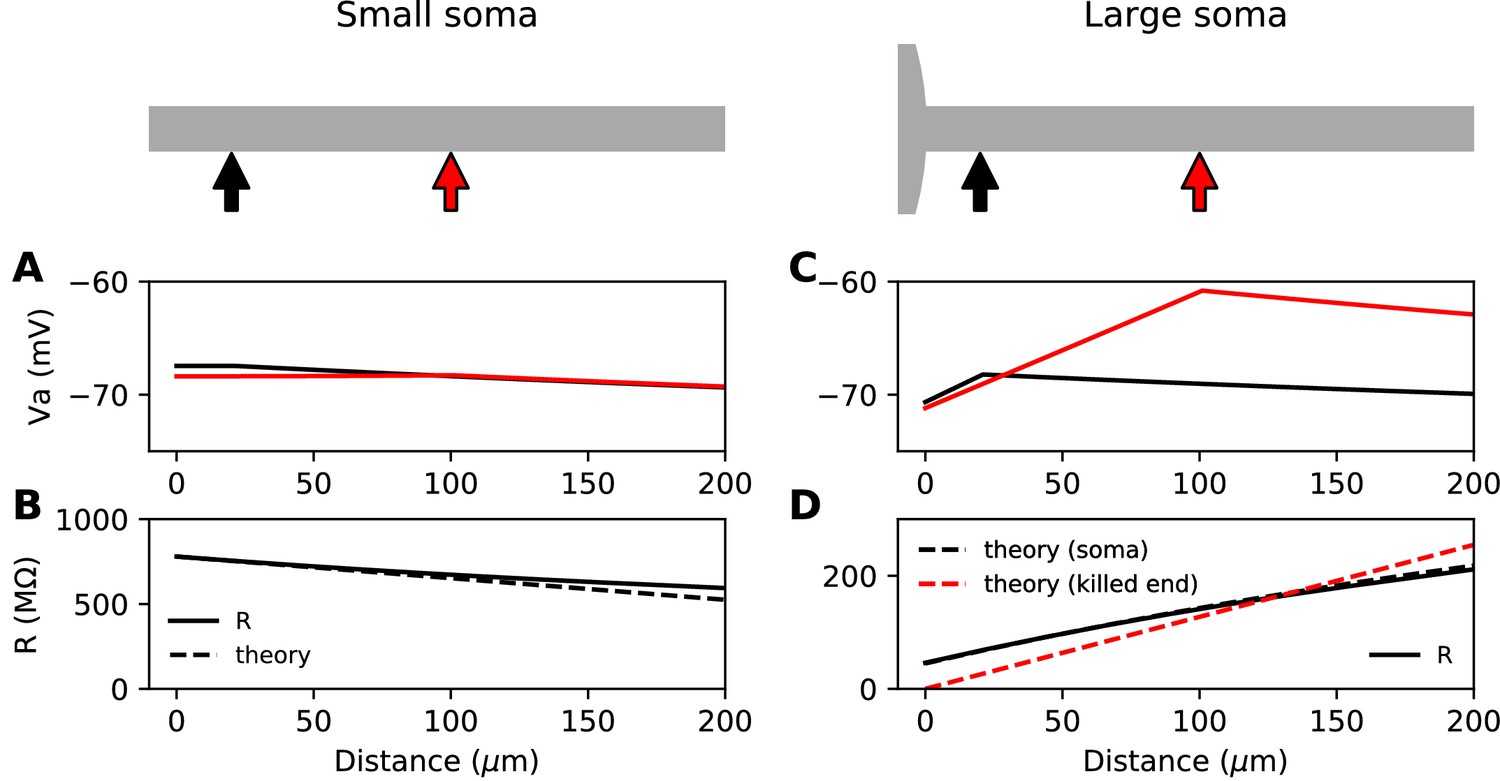
Steady-state passive response of the axon (ra=1.3 MΩ/μm, λ=612 μm, EL = -75 mV).
(A, B) With a very small soma; (C, D) With a large soma. (A) Voltage response along the axon for a 10 pA current injected at 20 µm (black) and at 100 µm (red). (B) Input resistance as a function of distance, as numerically measured (solid) and according to the simplified theoretical formula (, dashed). (C) Same as A for a large soma (diameter: 100 µm, current: 100 pA). (D) Same as B for a large soma, with the simplified theoretical prediction for the killed end condition (, dashed red) and the full theoretical prediction for a finite soma (, dashed black; = 47.7 MΩ).
Figure 2
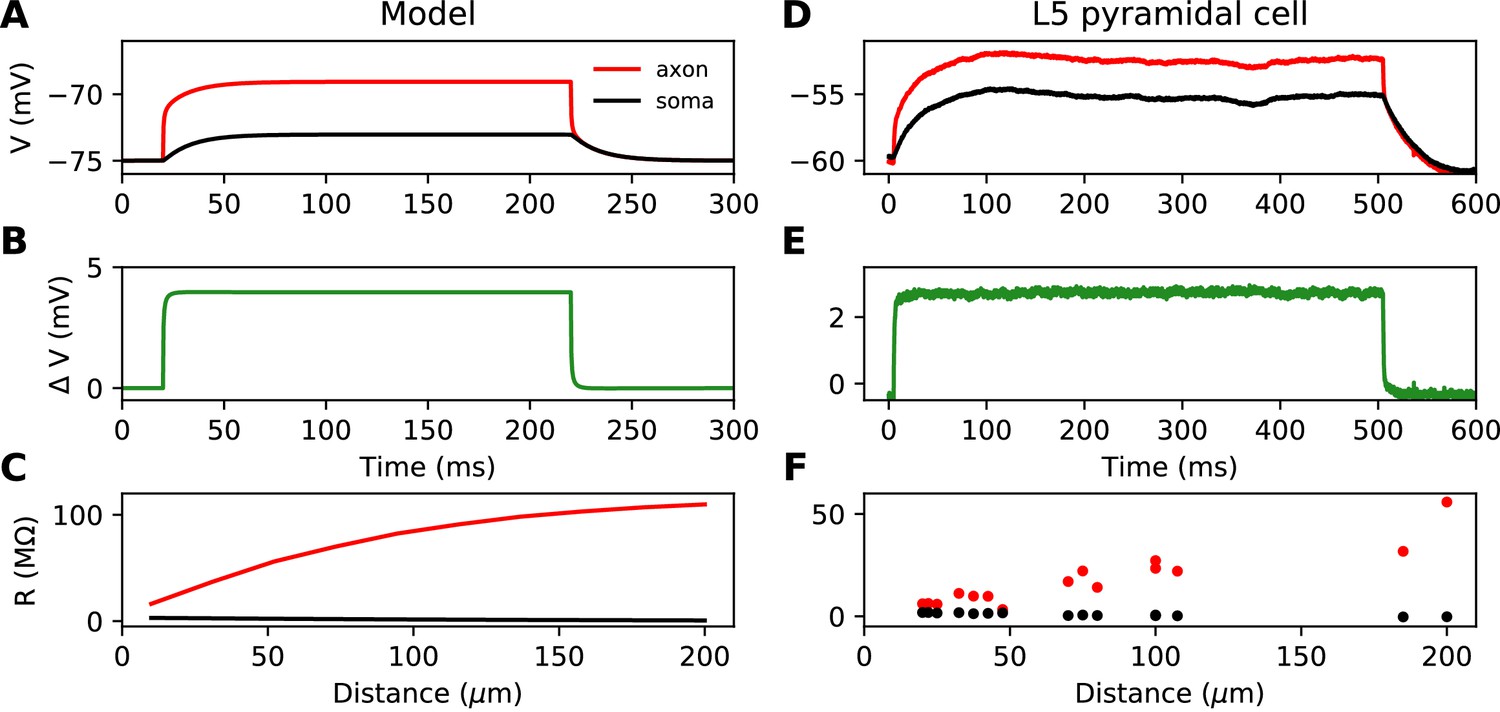
Time scale of responses to axonal current injection in a model with large soma (A-C) and in layer five pyramidal neurons (D-F).
(A, D) Voltage response at the axonal injection site 75 µm away from the soma (red) and at the soma (black). (B, E) Difference between the two responses. (C, F) Input resistance measured 300 µs after the start of current injection as a function of the distance of the injection site (red), compared to the resistance obtained from the somatic voltage response at the same time (black).
Figure 3
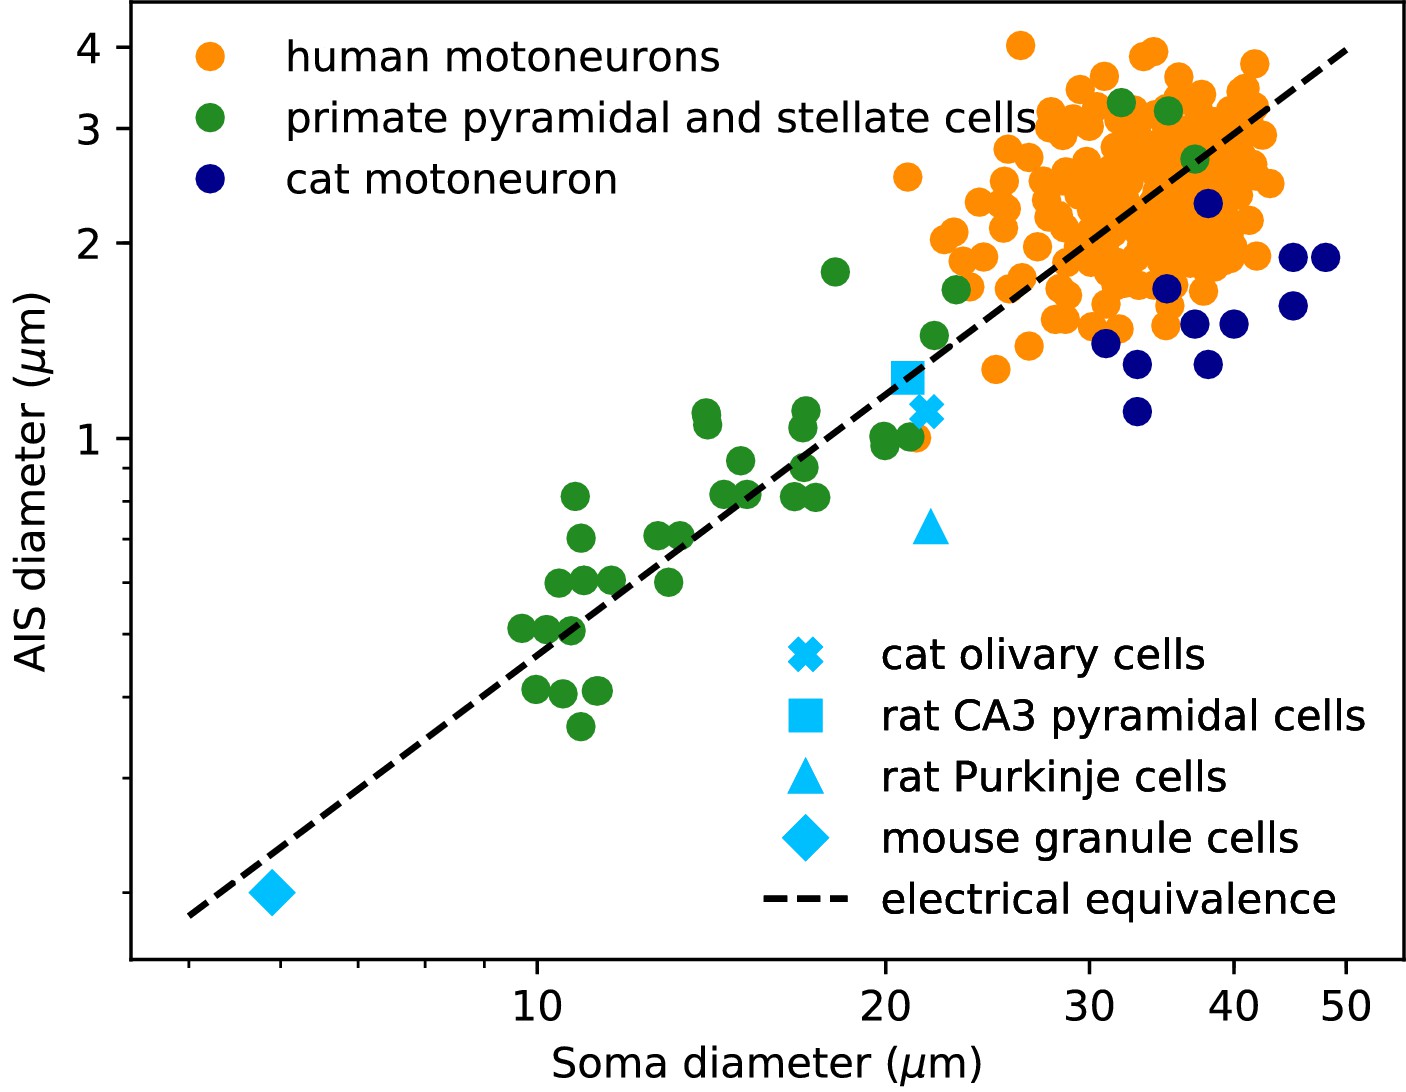
AIS diameter vs. soma diameter in a variety of cell types.
Four points are averages over many neurons of the same type (light blue symbols), other points are individual measurements (dots). Electrical equivalence is represented by the dashed line.
Figure 4
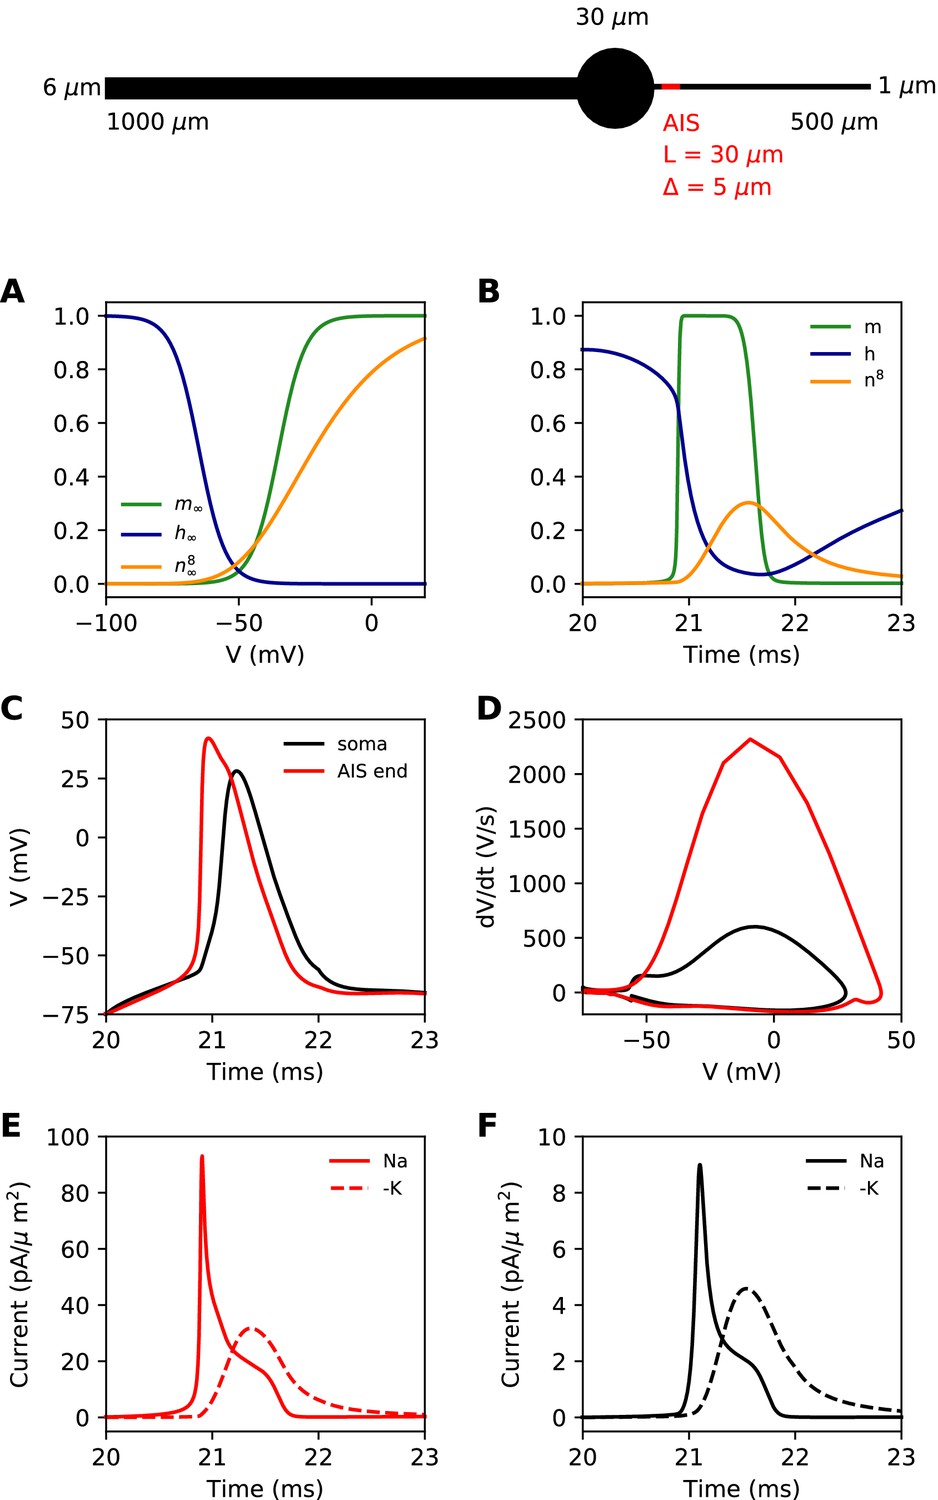
Simple biophysical model of spike initiation.
Top, morphology of the neuron. (A) Equilibrium functions of the gating variables m, h, and n8. (B) Time course of the gating variables at the distal end of the AIS during an action potential. (C) Action potential observed at the end of the AIS (red) and at the soma (black). (D) The same action potential shown in a phase plot. (E) Absolute value of Na+ and K+ currents at the AIS during a spike. (F) Same as E, at the soma.
Figure 5
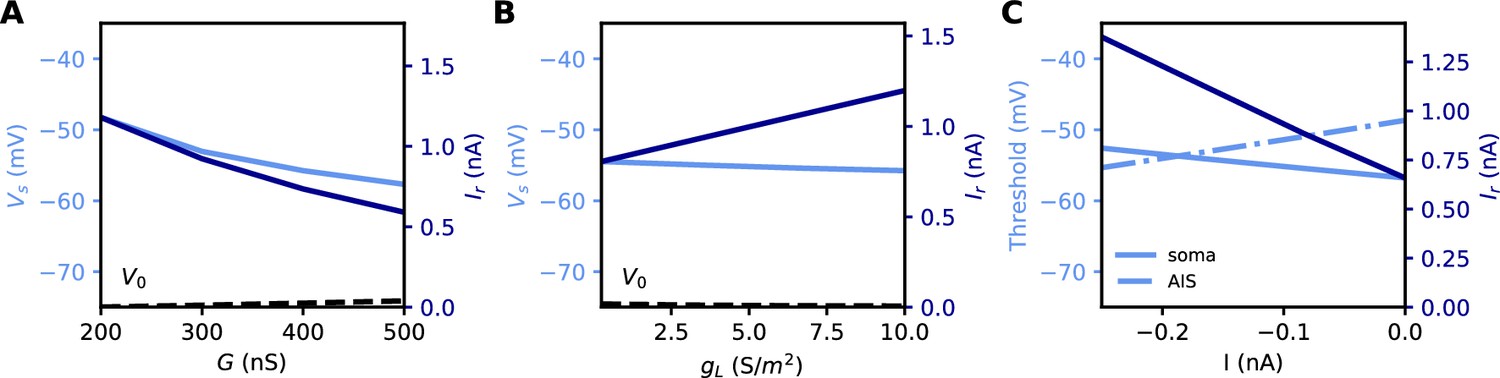
Measuring excitability in the biophysical model.
(A) Rheobase (dark blue) and somatic voltage threshold (light blue) as a function of total Nav conductance in the AIS G (dS = 30 µm). The resting potential also changes slightly (dashed). (B) Rheobase and somatic voltage threshold as a function of leak conductance density (G = 350 nS). (C) Voltage threshold at the soma (solid light blue) and AIS (dashed light blue) as a function of a hyperpolarizing current injected at the AIS end. The rheobase is shown in dark blue.
Figure 6
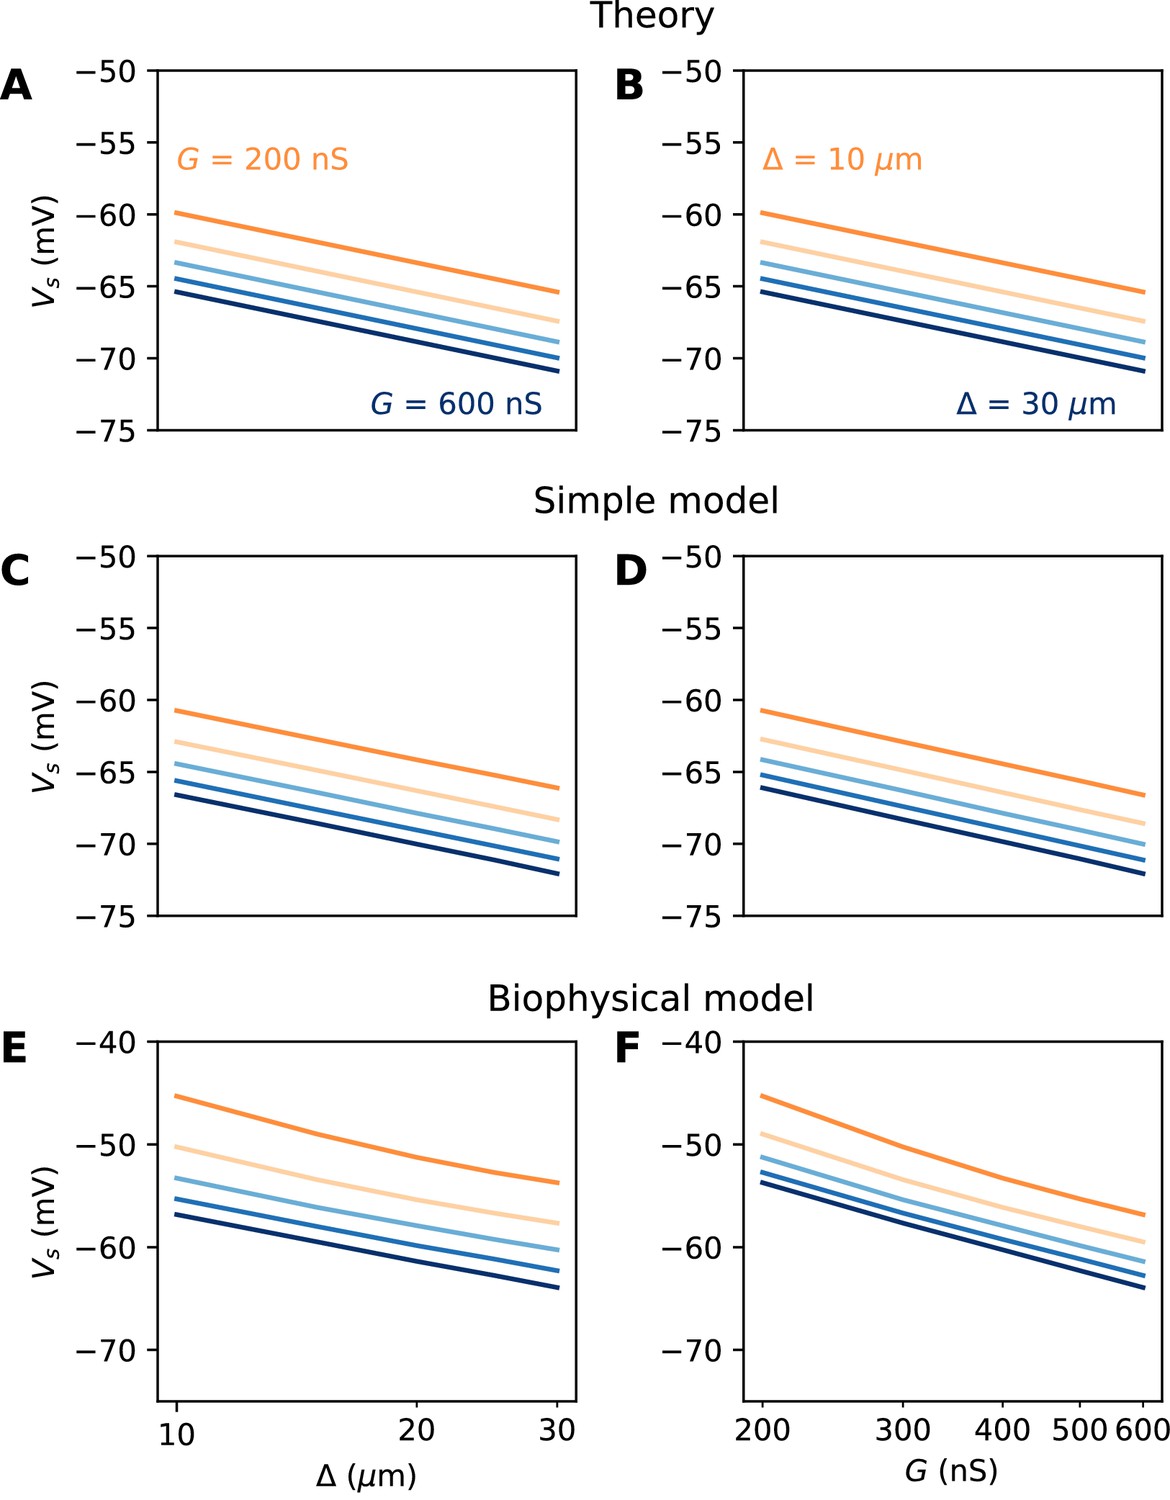
Spike threshold vs. AIS position and Nav conductance with a point AIS.
(A) Theoretical prediction of spike threshold vs. AIS position in logarithmic scale, for different total Nav conductances (from 200 to 600 nS). (B) Theoretical prediction of spike threshold vs. total Nav conductance for different AIS positions (from 10 to 30 µm). (C) Spike threshold in a simplified model measured in somatic voltage clamp, vs. AIS position. The regression slope is about 5 mV for all curves. (D) Spike threshold in the simplified model vs. total Nav conductance. The regression slope varies between 5.3 mV ( = 10 µm) and 5.4 mV ( = 30 µm). (E) Spike threshold vs. AIS position in the biophysical model in current clamp. Regression slopes vary between 7.7 mV (G = 200 nS) and 6.5 mV (G = 600 nS). (F) Spike threshold vs. total Nav conductance in the biophysical model. Regression slopes vary between 10.5 mV ( = 10 µm) and 9.3 mV ( = 30 µm).
Figure 7
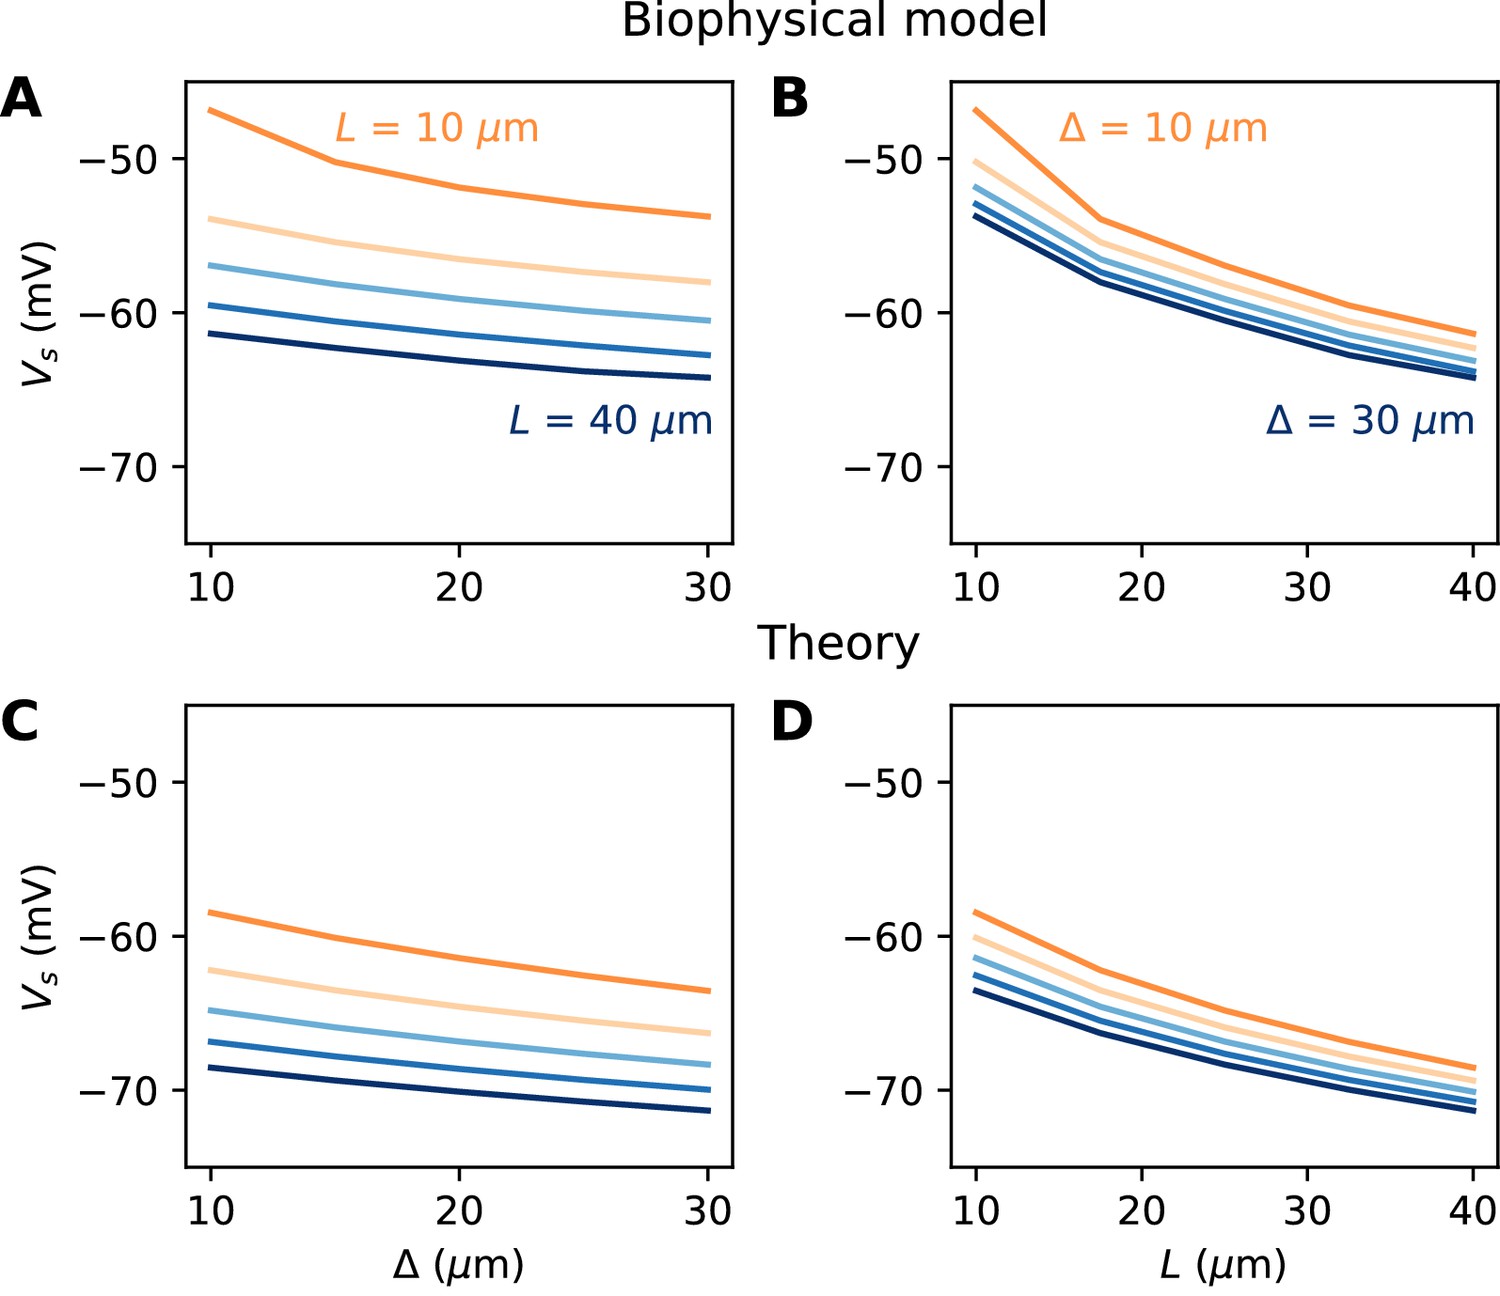
Relation between AIS geometry and voltage threshold in the biophysical model with constant Nav channel density.
(A) Threshold vs. AIS position (distance between soma and AIS start), for different AIS lengths between 10 and 40 µm. (B) Threshold vs. AIS length for different AIS positions between 10 and 30 µm. (C) Theoretical relation between threshold and AIS position (corresponding to panel A). (D) Theoretical relation between threshold and AIS length (corresponding to panel B).
Figure 8
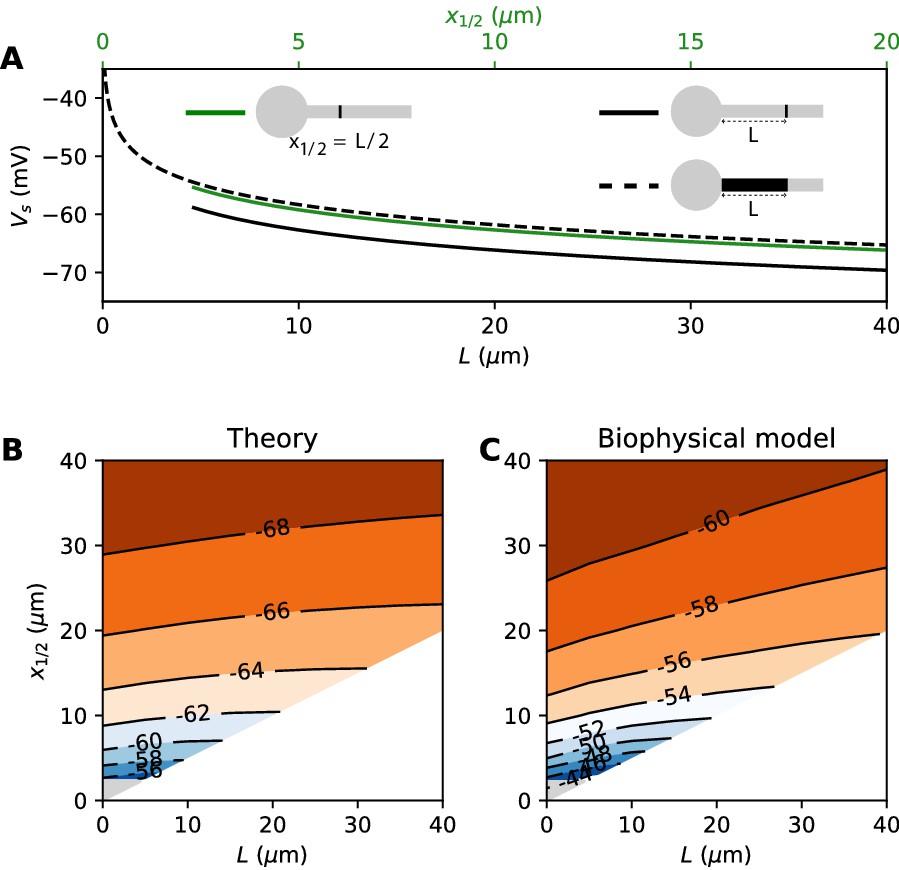
Effect of compressing the AIS on spike threshold, with total Nav conductance held fixed.
(A) Theoretical spike threshold of an AIS of length L starting from the soma (dashed), compared to an equivalent point AIS placed at position = L (solid black) and at = x1/2 = L/2 (solid green). (B) Theoretical spike threshold (in mV) vs. AIS middle position and length, with fixed total Nav conductance. The lower right white triangle corresponds to impossible geometries; the lower left shaded triangle is the region where the threshold is undefined in the point model. (C) Observed relation in the biophysical model.
Figure 9
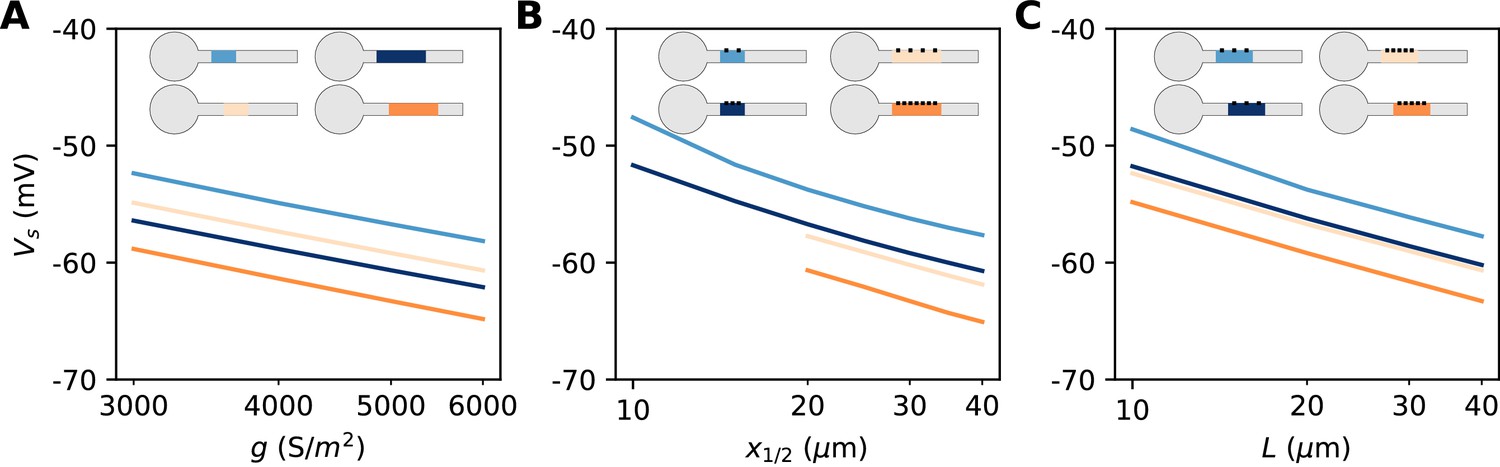
Dependence of spike threshold on AIS geometry and Nav conductance density in the biophysical model.
(A) Spike threshold vs. Nav conductance density g, for 4 combinations of AIS middle position x1/2 and length L (light blue, x1/2 = 20 µm, L = 20 µm, regression slope: 8.4 mV; light orange, x1/2 = 20 µm, L = 40 µm, regression slope: 8.3 mV; dark blue, x1/2 = 30 µm, L = 20 µm, regression slope: 8.2 mV; dark orange, x1/2 = 30 µm, L = 40 µm, regression slope: 8.7 mV). (B) Spike threshold vs x1/2 for 4 combinations of g and L (light blue, g = 3500 S/m2, L = 20 µm, regression slope: 7.1 mV; light orange, g = 3500 S/m2, L = 40 µm, regression slope: 6 mV; dark blue, g = 5000 S/m2, L = 20 µm, regression slope: 6.5 mV; dark orange, g = 5000 S/m2, L = 40 µm, regression slope: 6.4 mV). (C) Spike threshold vs. L for 4 combinations of g and x1/2 (light blue, g = 3500 S/m2, x1/2 = 20 µm, regression slope: 6.6 mV; light orange, g = 5000 S/m2, x1/2 = 20 µm, regression slope: 6 mV; dark blue, g = 3500 S/m2, x1/2 = 30 µm, regression slope: 6.1 mV; dark orange, g = 5000 S/m2, x1/2 = 30 µm, regression slope: 6.1 mV).
Figure 10
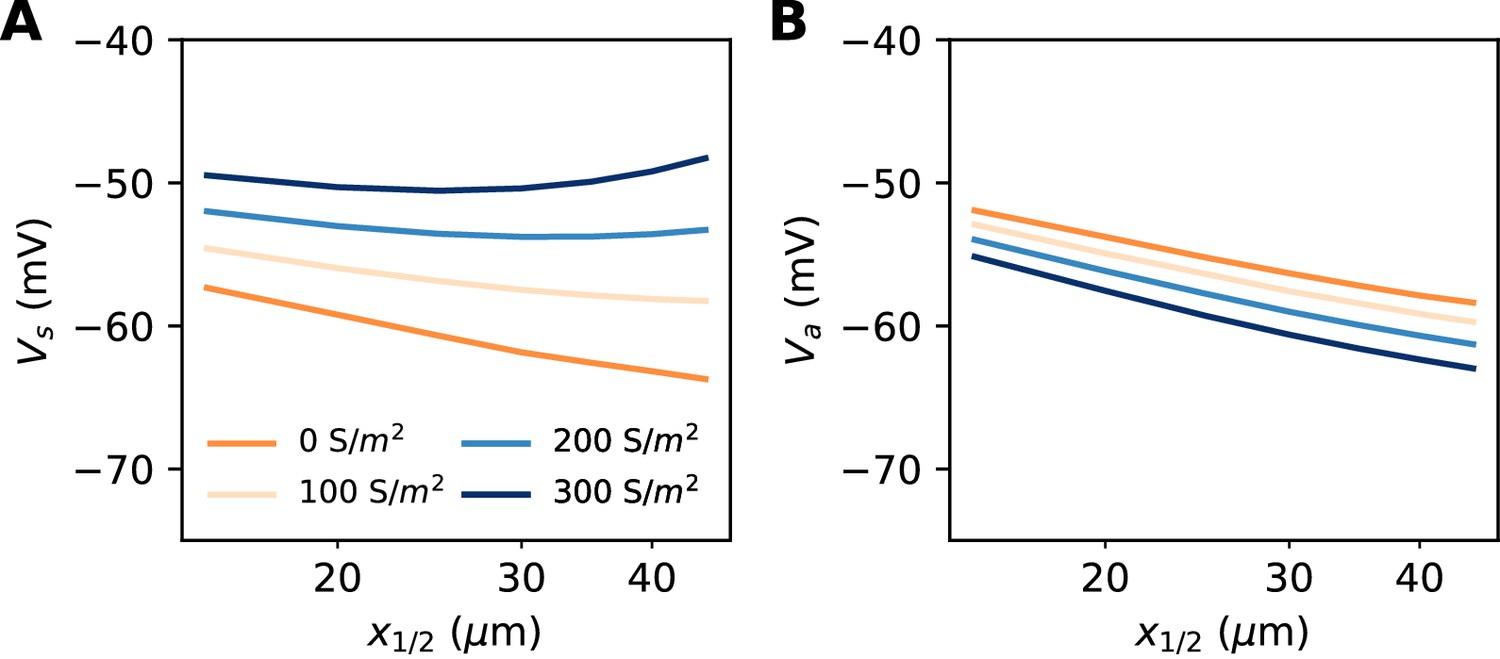
Excitability as a function AIS position with hyperpolarizing conductance (biophysical model).
The conductance has reversal potential E = −90 mV and is uniformly expressed in the distal half of the 30 µm long AIS (G = 500 nS). (A) Somatic threshold vs. AIS position for different conductance values (an empirical estimate in layer 5 pyramidal cells is 144 S/m2, Battefeld et al., 2014). (B) Threshold at the distal end of the AIS for different conductance values (logarithmic regression slopes: 5.9 to 7.1 mV).
Figure 11
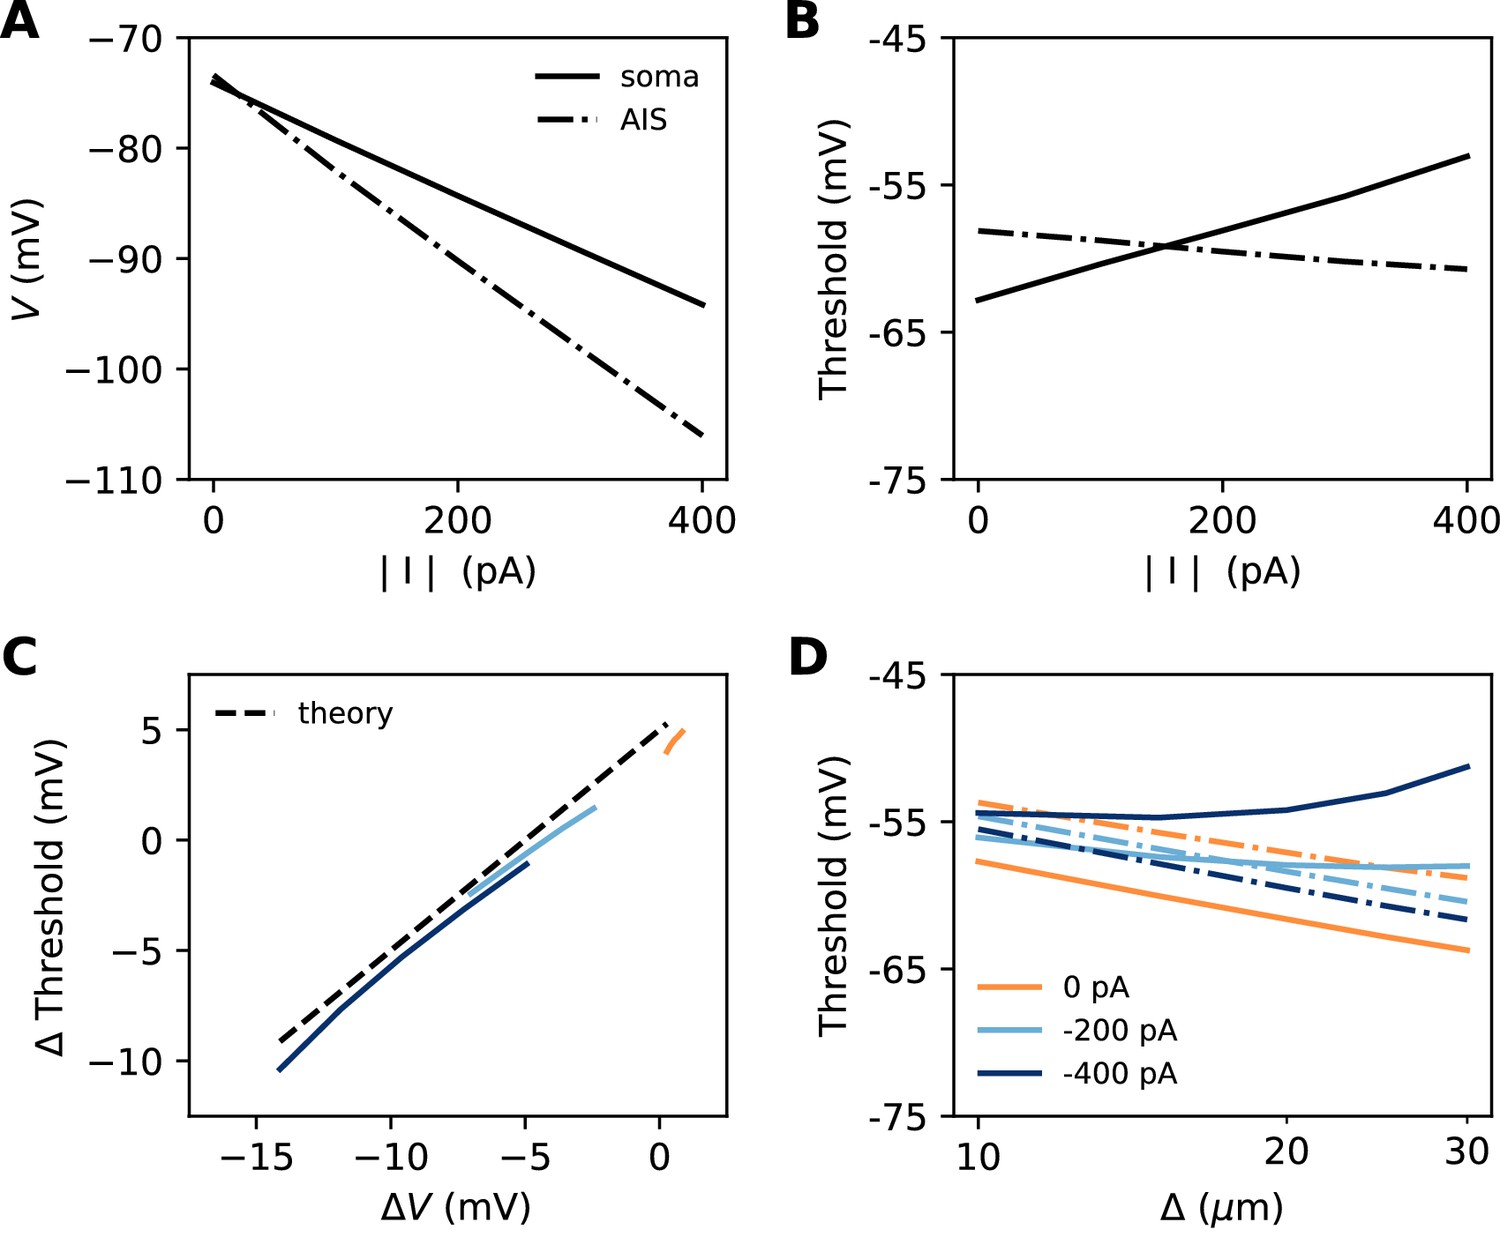
Effect of a hyperpolarizing axonal current in the biophysical model with a point AIS.
(A) Resting potential at the soma and AIS as a function of current intensity |I|, for an AIS placed 25 µm away from the soma. (B) Threshold at the AIS and soma as a function of |I|. (C) Difference between AIS and somatic threshold vs. difference between AIS and somatic resting potential. Each curve corresponds to a variable AIS position with a given current intensity (0 to -400 pA). (D) Somatic (solid) and AIS threshold (dashed) vs. when currents are injected at the AIS.
Figure 12
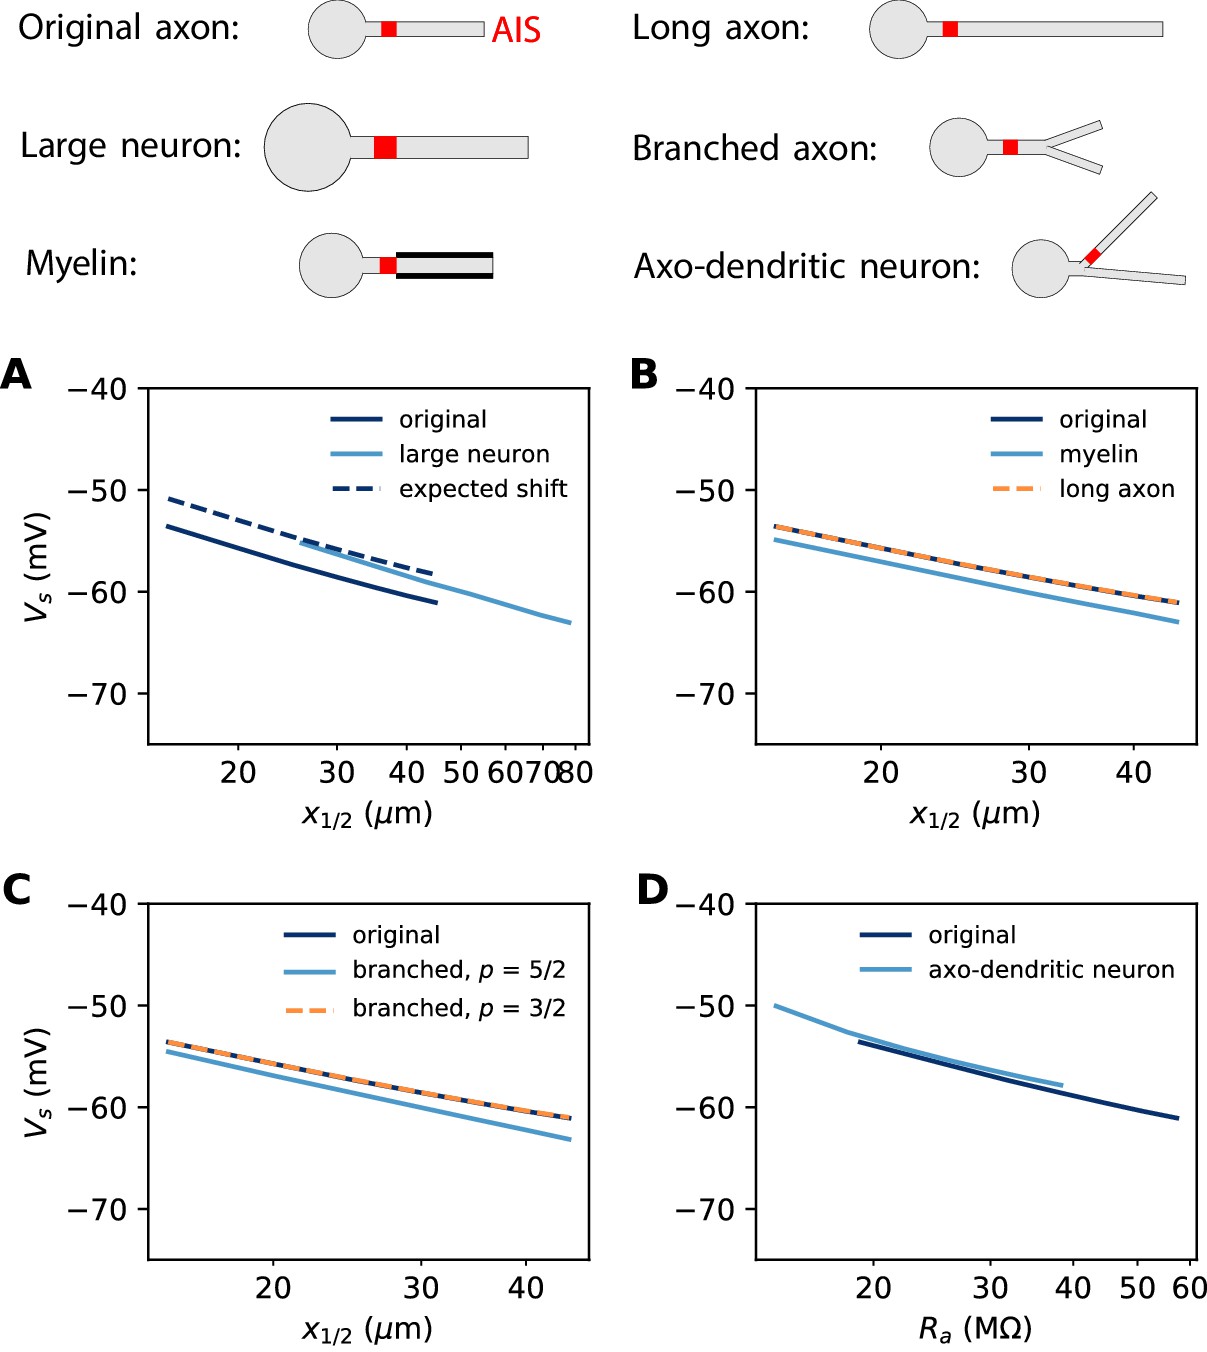
Effect of axon morphology on the relation between AIS position and excitability (biophysical model).
Top: schematics of the different morphologies considered. (A) Somatic threshold vs. AIS position for a large neuron (light blue; diameter: 3 µm) compared to the original neuron (dark blue; diameter: 1 µm). AIS length is scaled up as the space constant, that is, by a factor √3. This scaling results in a theoretical threshold shift of about 2.7 mV (dashed). (B) Somatic threshold vs. AIS position for a longer axon (dashed orange) and for a myelinated axon (light blue), compared to the original neuron (dark blue). (C) Somatic threshold vs. AIS position for a branching axon with diameters such that , where p = 5/2 (light blue) or 3/2 (dashed orange). (D) Somatic threshold vs axial resistance Ra between soma and AIS middle position, in an axo-dendritic neuron (light blue). The axon-carrying dendrite starts with diameter 2 µm from the soma and splits after 7 µm into two branches of equal diameter (such that ).
Figure 13
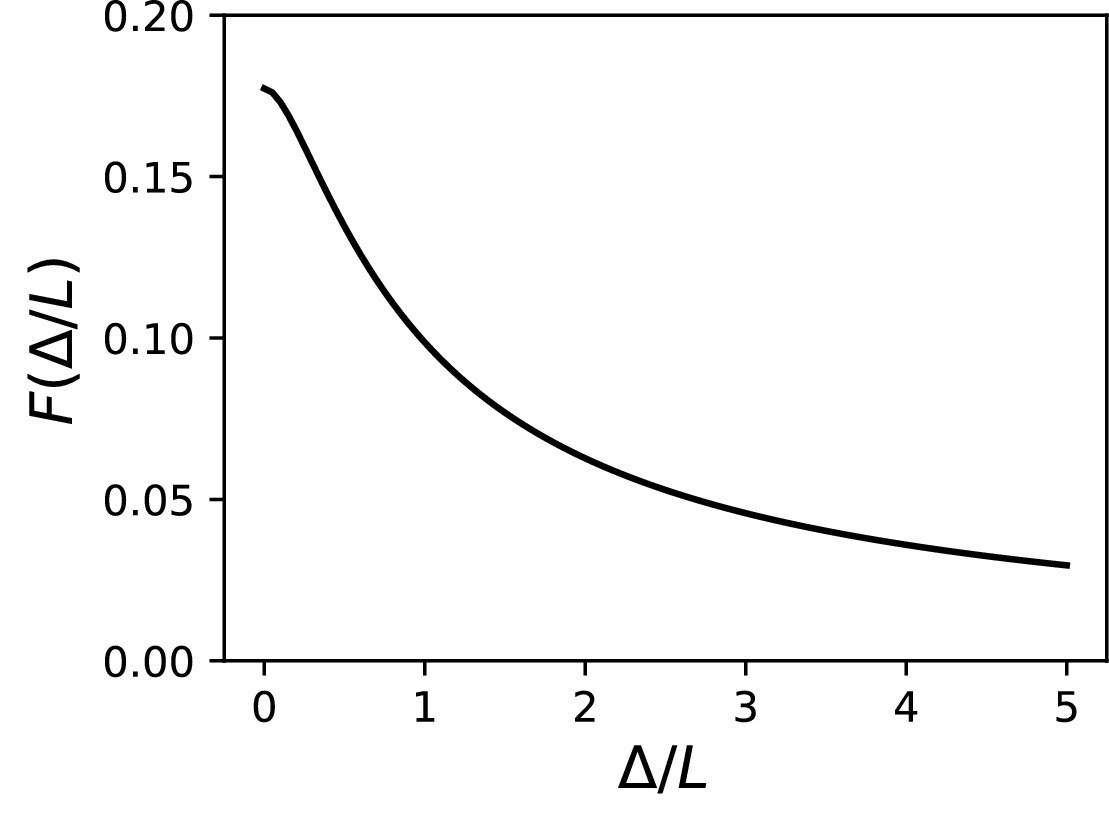
Corrective term .
The threshold of an extended AIS differs from that of point AIS with the same total conductance placed at the midpoint by at most .
Tables
Table 1
Parameters values of the biophysical model.
Time constants corrected for temperature are indicated in brackets.
| Passive properties | Rm | 15 000 .cm2 |
| EL | −75 mV | |
| Ri | 100 Ω.cm | |
| Cm | 0.9 µF/cm2 | |
| Nav channels | gNa, soma | 250 S/m2 |
| gNa, dendrite and axon (non AIS) | 50 S/m2 | |
| gNa, AIS | variable (default: 3500 S/m2) | |
| ENa | 70 mV | |
| , soma | −30 mV | |
| , soma | −60 mV | |
| , AIS | −35 mV | |
| , AIS | −65 mV | |
| km | 5 mV | |
| kh | 5 mV | |
| 150 µs (corrected: 54 µs) | ||
| 5 ms (corrected: 1.8 ms) | ||
| Kv1 channels | gK, soma | 250 S/m2 |
| gK, dendrite and axon (non AIS) | 50 S/m2 | |
| gK, AIS | 1500 S/m2 | |
| EK | −90 mV | |
| −70 mV | ||
| kn | 20 mV | |
| 1 ms | ||
| Kv7 channels | gKv7 | variable |
| EK | −90 mV |
Table 2
Changes in AIS geometry and voltage threshold (ΔVs) in structural plasticity and development studies, with the theoretical expectation, assuming constant functional Nav channel density and everything else unchanged (e.g. axon diameter, channel properties).
| Neuron type | Initial AIS L (μm) | Initial AIS x1/2 (μm) | Final AIS L (μm) | Final AIS x1/2 (μm) | ΔVs (mV) | ΔVs theory (mV) | Reference |
|---|---|---|---|---|---|---|---|
| Plasticity | |||||||
| Chicks nucleus magnocelluaris | 9.6 | 13.3 | 19.5 | 18.4 | -4 | −5.2 | Kuba et al., 2010 |
| Hippocampal cultures (only excitatory) | 34.8 | 20.9 | 33.6 | 27.2 | 4.3 | −1.1 | Grubb and Burrone (2010) |
| Hippocampal dentate granule cells in cultures | 19.2 | 10.4 | 15.7 | 7.85 | −1.1 | 2.4 | Evans et al., 2015 |
| Olfactory bulb dopaminergic neurons in cultures | 11.7 | 21.1 | 14.2 | 15.5 | −0.4 | 0.6 | Chand et al., 2015 |
| Development* | |||||||
| Chicks nucleus laminaris, low | 30.3 | 24.8 | 23.9 | 19.9 | −12.7 | 2.3 | Kuba et al., 2014 |
| Chicks nucleus laminaris, middle | 28.8 | 24.8 | 14.4 | 28.3 | / | 2.8 | Kuba et al., 2014 |
| Chicks nucleus laminaris, high | 26.5 | 26.6 | 9.8 | 50.1 | −14.3 | 1.8 | Kuba et al., 2014 |
-
*Initial = E15, final = P3-7.
Table 3
Mean diameter of soma and AIS in 4 cell types, extracted from electron microscopy studies.
| Adult cat olivary cells | Soma | 21.7 µm ± 3.7 µm | (de Zeeuw et al., 1990) |
| AIS | 1.1 µm ± 0.3 µm | (Ruigrok et al., 1990) | |
| Adult rat CA3 pyramidal cells | Soma | 20.9 ± 3.2 µm | (Buckmaster, 2012) |
| AIS | 1.2 µm ± 0.4 µm | (Kosaka, 1980) | |
| Adult rat Purkinje cells | Soma | 21.9 µm ± 1.9 µm | (Takacs and Hamori, 1990) |
| AIS | 0.7 µm ± 0.2 µm | (Somogyi and Hámori, 1976) | |
| Adult mouse cerebellar granule cells | Soma | 5.9 µm ± 0.3 µm | (Delvendahl et al., 2015) |
| AIS | 0.2 µm (no s.d.) | (Palay and Chan-Palay, 2012) |
Additional files
Download links
A two-part list of links to download the article, or parts of the article, in various formats.
Downloads (link to download the article as PDF)
Open citations (links to open the citations from this article in various online reference manager services)
Cite this article (links to download the citations from this article in formats compatible with various reference manager tools)
Theoretical relation between axon initial segment geometry and excitability
eLife 9:e53432.
https://doi.org/10.7554/eLife.53432


