Polypyrimidine tract-binding proteins are essential for B cell development
- Laboratory of Lymphocyte Signalling and Development, The Babraham Institute, United Kingdom
- Department of Biochemistry, University of Cambridge, United Kingdom
- Next Generation Sequencing Facility, The Babraham Institute, United Kingdom
- Buchmann Institute for Molecular Life Sciences, Goethe University Frankfurt, Germany
Figures
Figure 1 with 1 supplement
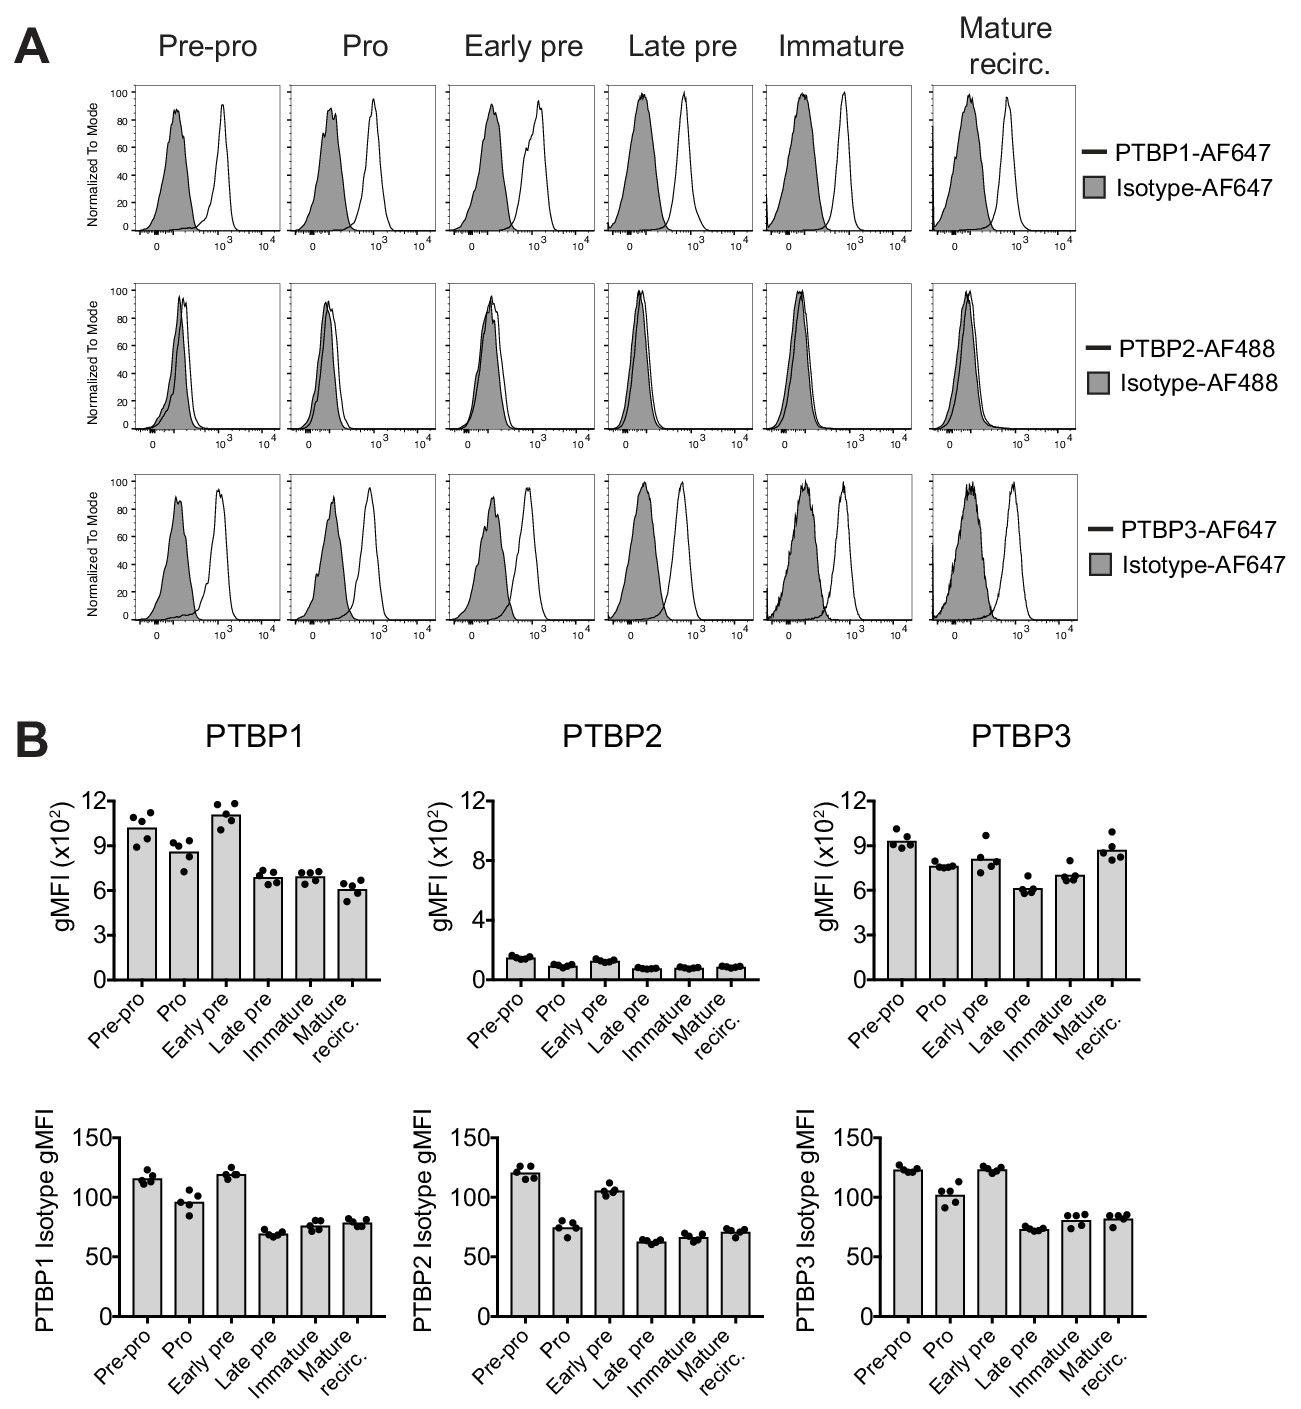
PTBP1 and PTBP3 are expressed throughout B cell development.
(A) Expression of PTBP1, PTBP2 and PTBP3 analysed by flow cytometry. Identification of different B cell developmental stages was carried out as shown in Figure 1—figure supplement 1B. (B) Geometric mean fluorescence intensity (gMFI) of staining for anti-PTBP1, PTBP2, PTBP3 and isotype control antibodies as shown in A. Bars depict arithmetic means. Each data point shows data from an individual control mouse (CD79a+/+;Ptbp1fl/fl;Ptbp2fl/fl). Data shown are from one experiment with five mice.
Figure 1—figure supplement 1
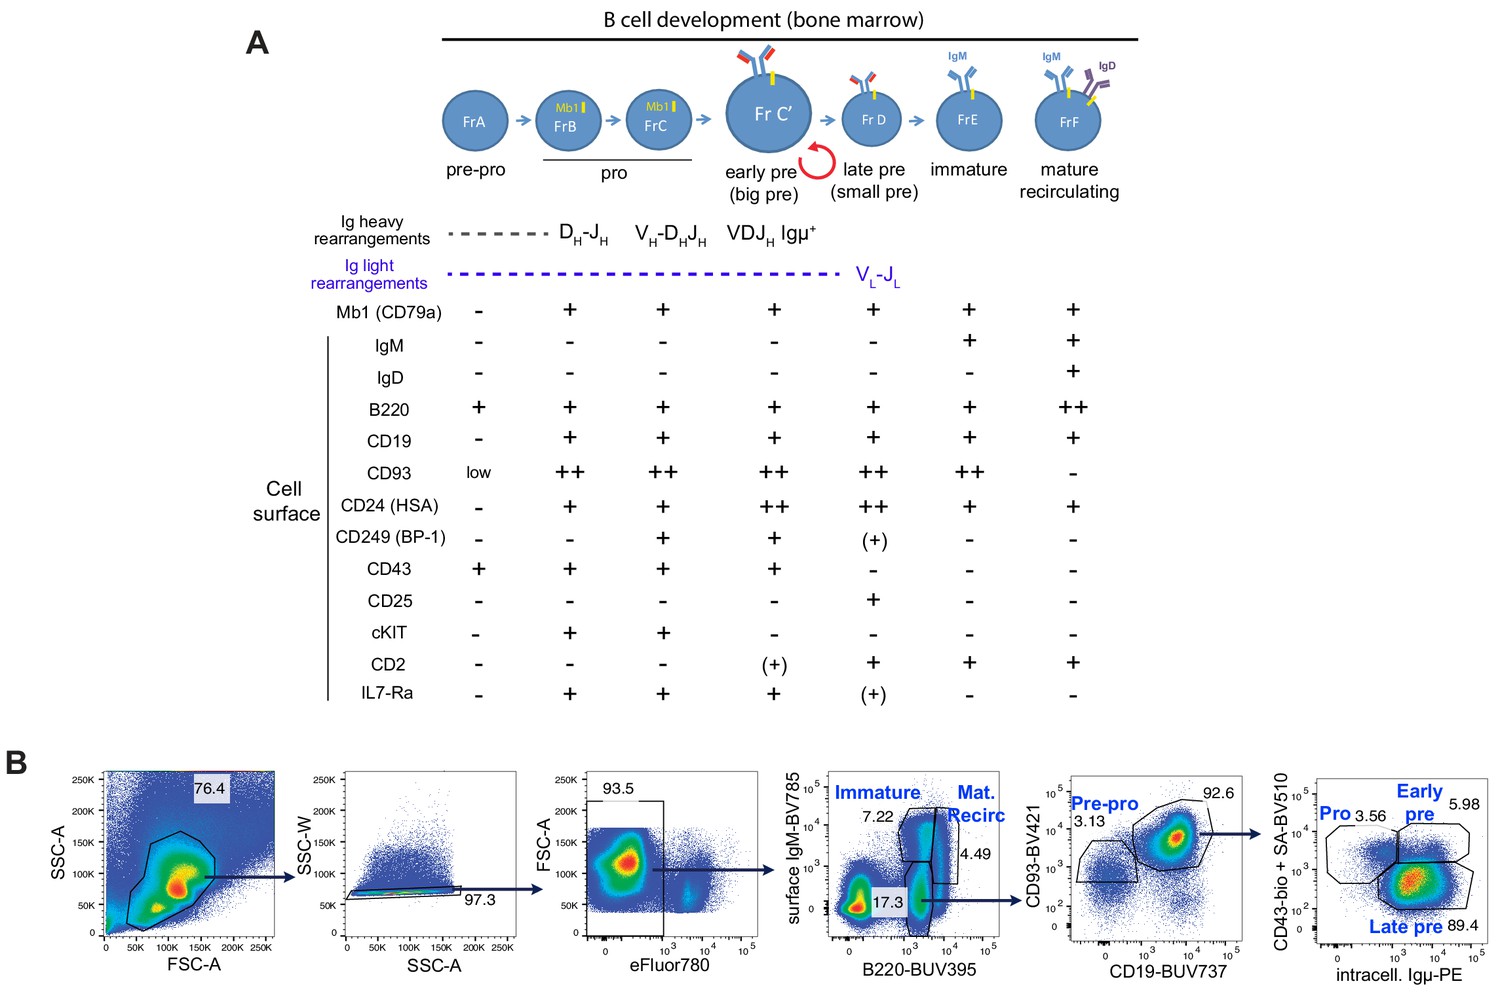
B cell developmental stages in the bone marrow.
(A) Representation of B cell development in the bone marrow using the Philadelphia nomenclature (Hardy and Hayakawa, 2003) including Hardy’s fractions (Fr) based on cell-surface markers (Hardy et al., 1991). (B) Identification strategy for bone marrow cells using cell-surface and intracellular markers.
Figure 2 with 1 supplement
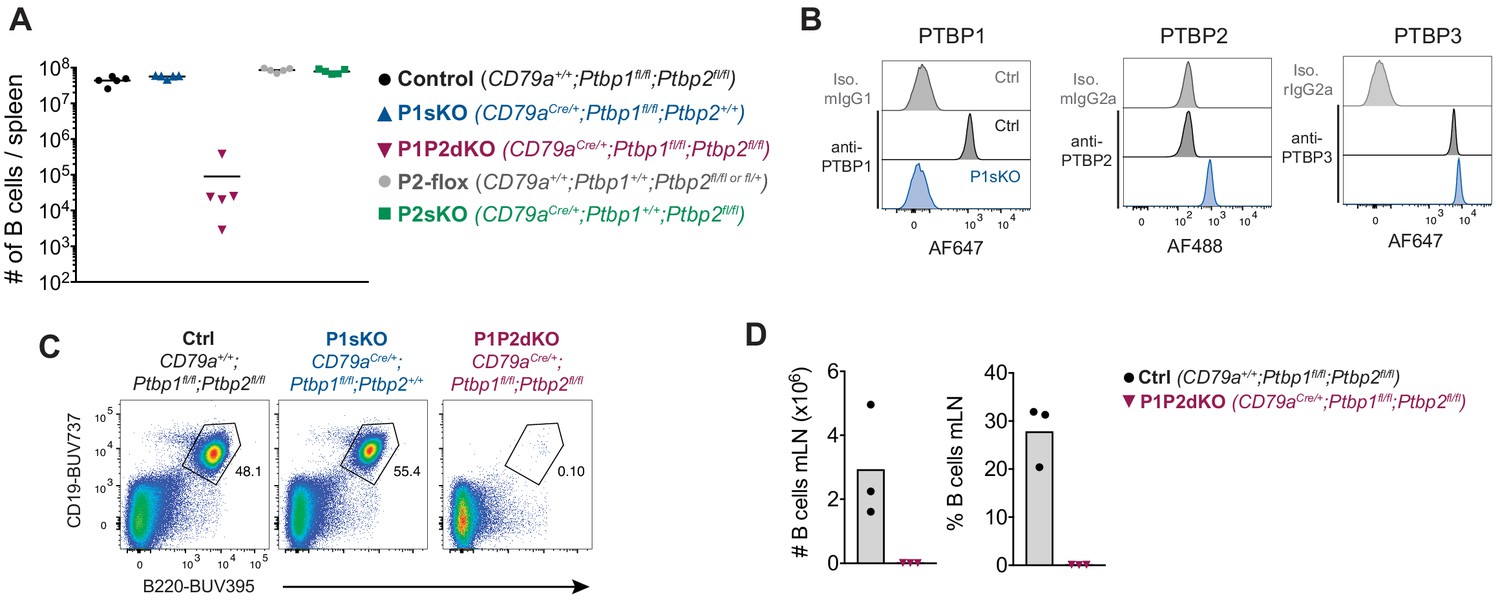
Lack of B cells in the absence of PTBP1 and PTBP2.
(A) Numbers of B cells (B220+CD19+) in spleens of mice with the indicated genotypes. Data points are from individual mice. Arithmetic means are shown with lines. (B) PTBP1, PTBP2, PTBP3 and isotype control staining of splenic B cells (CD19+) from control mice (CD79a+/+;Ptbp1fl/fl) and P1sKO (CD79aCre/+;Ptbp1fl/fl) mice analysed by flow cytometry. Data shown are from one mouse representative of three individual mice analysed. (C) Flow cytometry of splenocytes to identify B cells shown in A. Numbers shown are proportions of gated B cells. Events shown were pre-gated on live (eFluor780-) single cells. (D) Numbers and proportions of B cells (B220+CD19+) in mesenteric lymph nodes. Data shown are from one experiment.
Figure 2—figure supplement 1
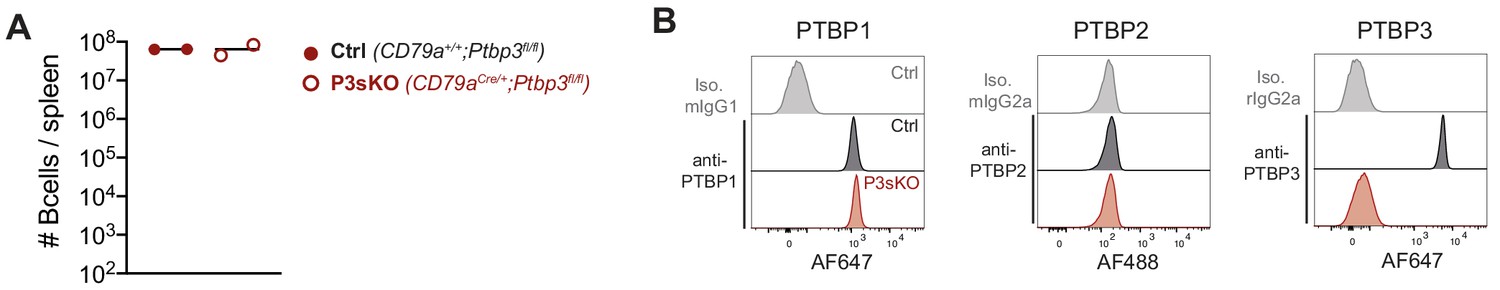
Normal numbers of mature B cells in the absence of PTBP3.
(A) Numbers of B cells (B220+ CD19+) in spleens of mice with the indicated genotypes. Data points are from individual mice. Arithmetic means are shown with lines. Data shown are from one experiment. (B) PTBP1, PTBP2, PTBP3 and isotype control staining of splenic B cells (CD19+) from control mice (CD79a+/+;Ptbp3fl/fl) and P3sKO (CD79aCre/+;Ptbp3fl/fl) mice analysed by flow cytometry. Data shown are from one mouse representative of three individual mice analysed.
Figure 3 with 2 supplements
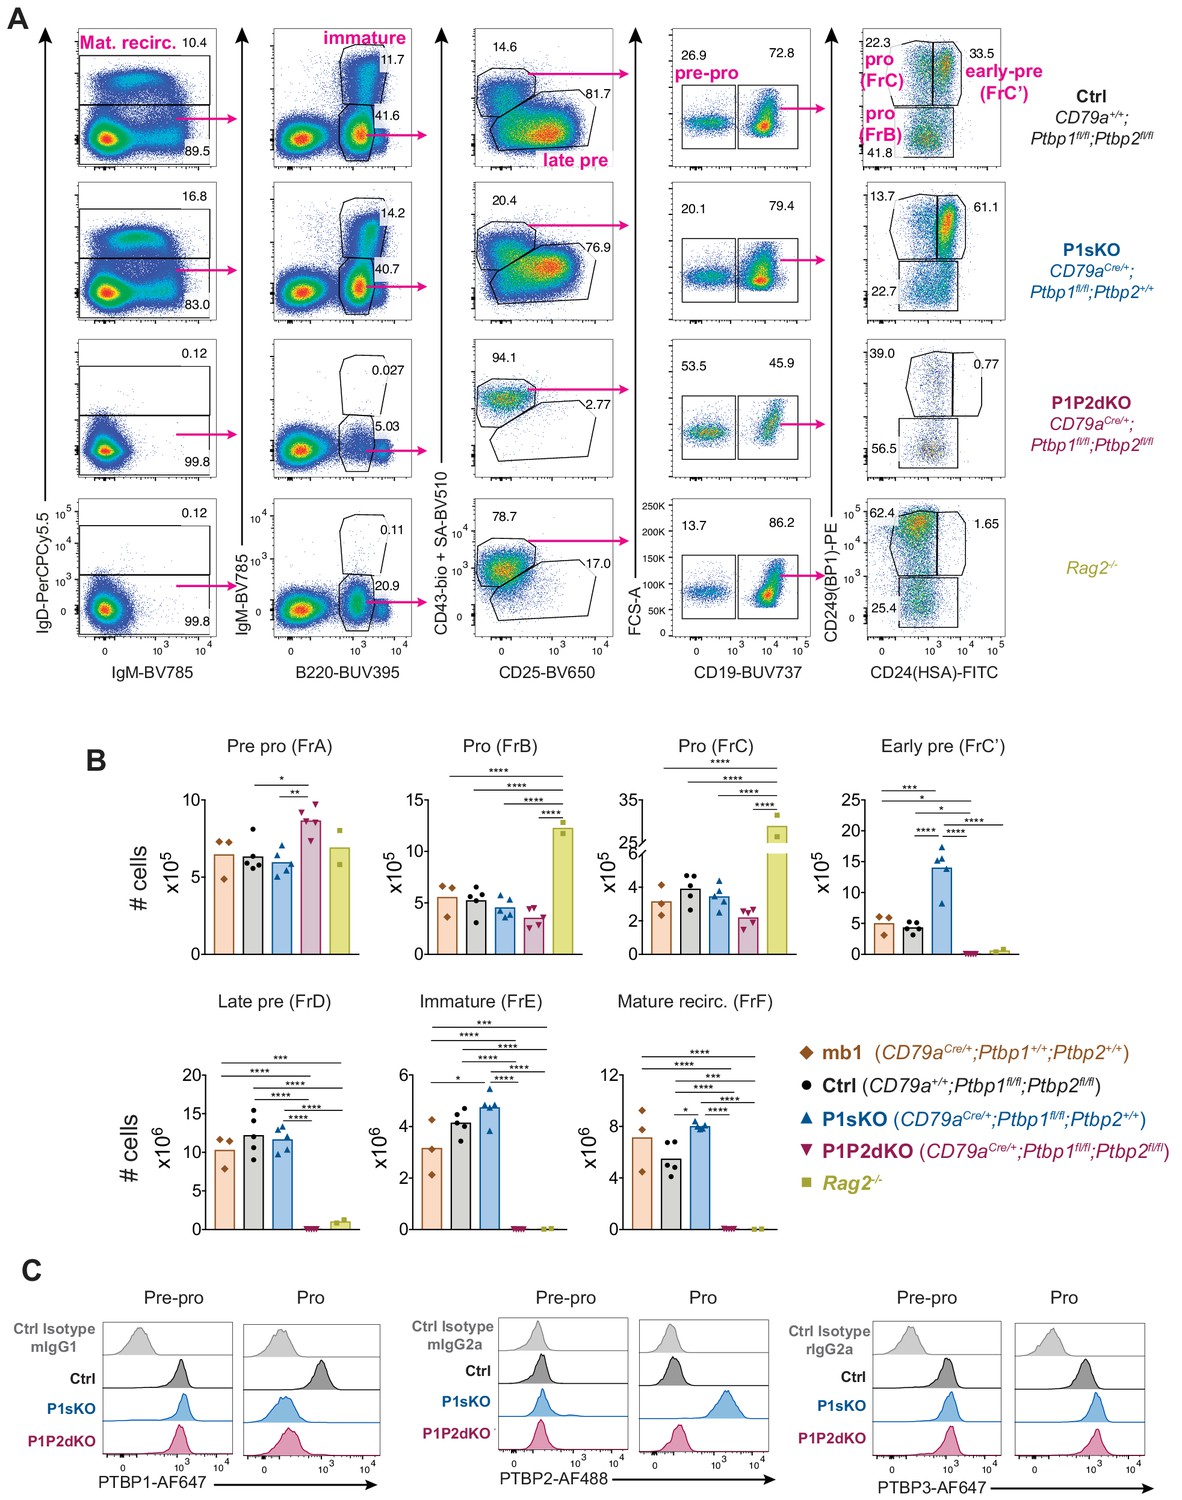
Absence of PTBP1 and PTBP2 blocks B cell development at the pro-B cell stage.
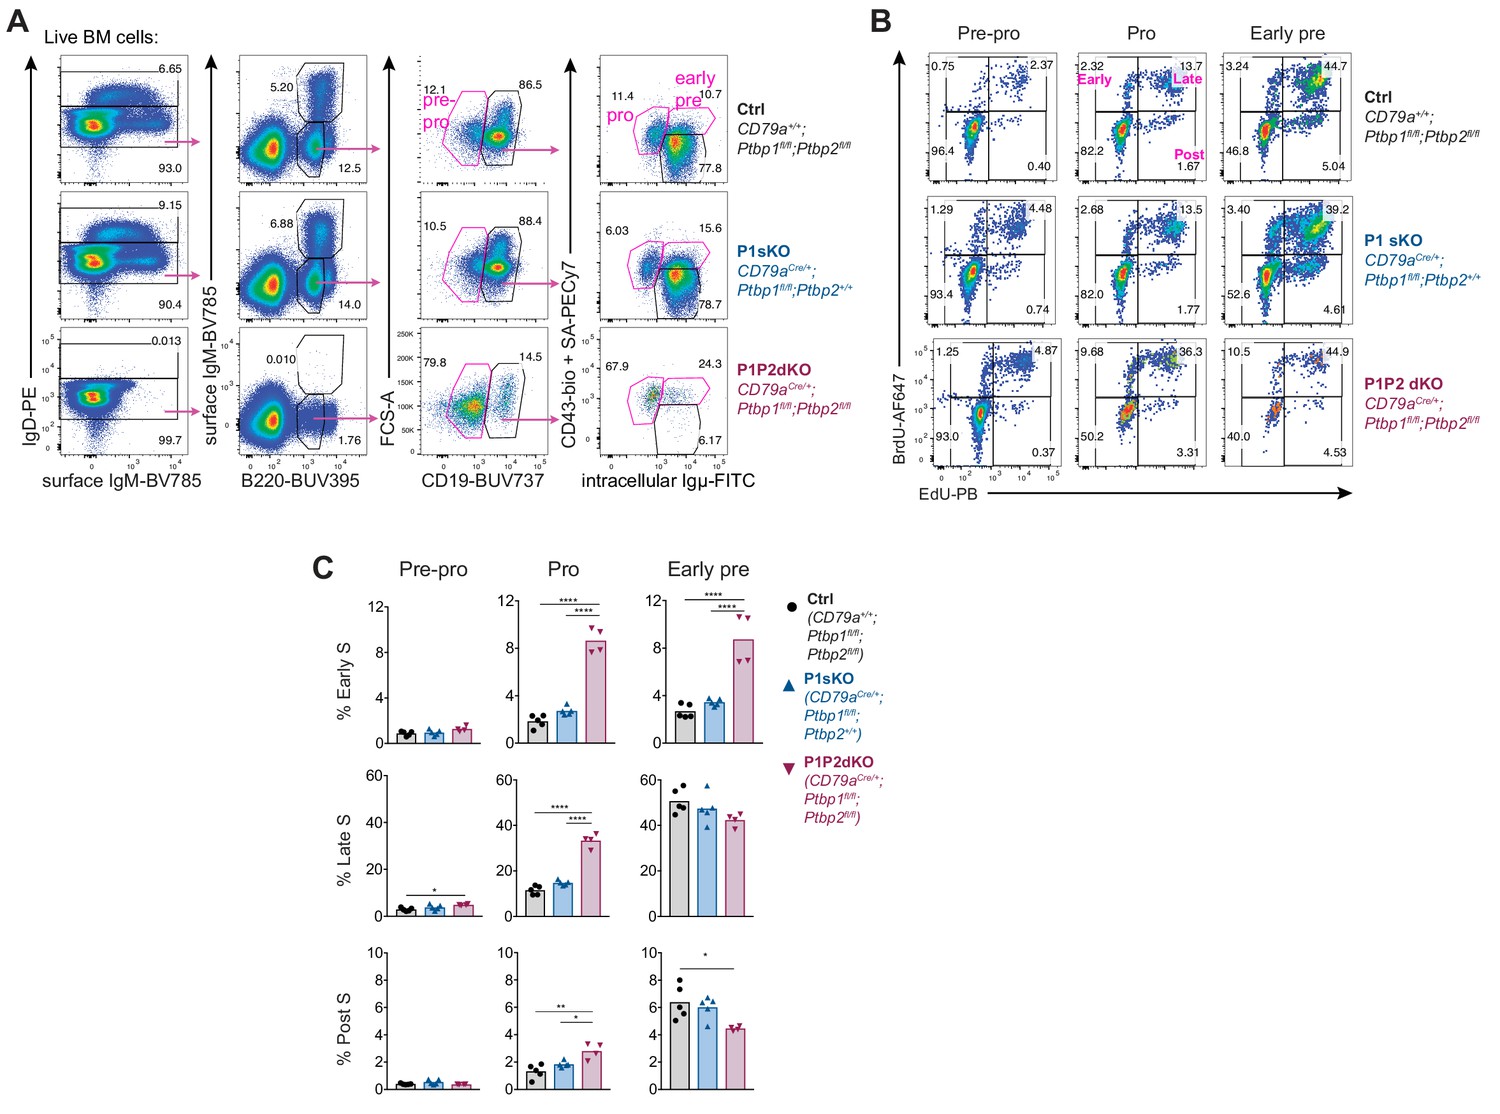
(A) Gating strategy based on cell-surface markers for developing B cells from bone marrow cells pre-gated on dump (Gr-1, CD11b, NK1.1, Siglec-F and F4/80)-negative live (eFluor780-) cells. (B) Number of developing B cells in the bone marrow (two femurs and two tibias per mouse) of mice with the indicated genotypes. Data shown are from one representative out of three independent experiments carried out with the same mouse genotypes shown except for CD79aCre/+;Ptbp1+/+;Ptbp2+/+ mice which were only included in the experiment shown. Bars depict arithmetic means, each point represents data from an individual mouse and P-values were calculated by one-way ANOVA with Tukey's multiple comparisons test. Summary adjusted p value *<0.05, **<0.01, ***<0.001, ****<0.0001. (C) PTBP1, PTBP2, PTBP3 and isotype control staining in Pre-pro and Pro-B cells identified as shown in Figure 3—figure supplement 1C. Data shown are of a representative mouse out of five for each indicated genotype. Data shown are from one experiment.
Figure 3—figure supplement 1
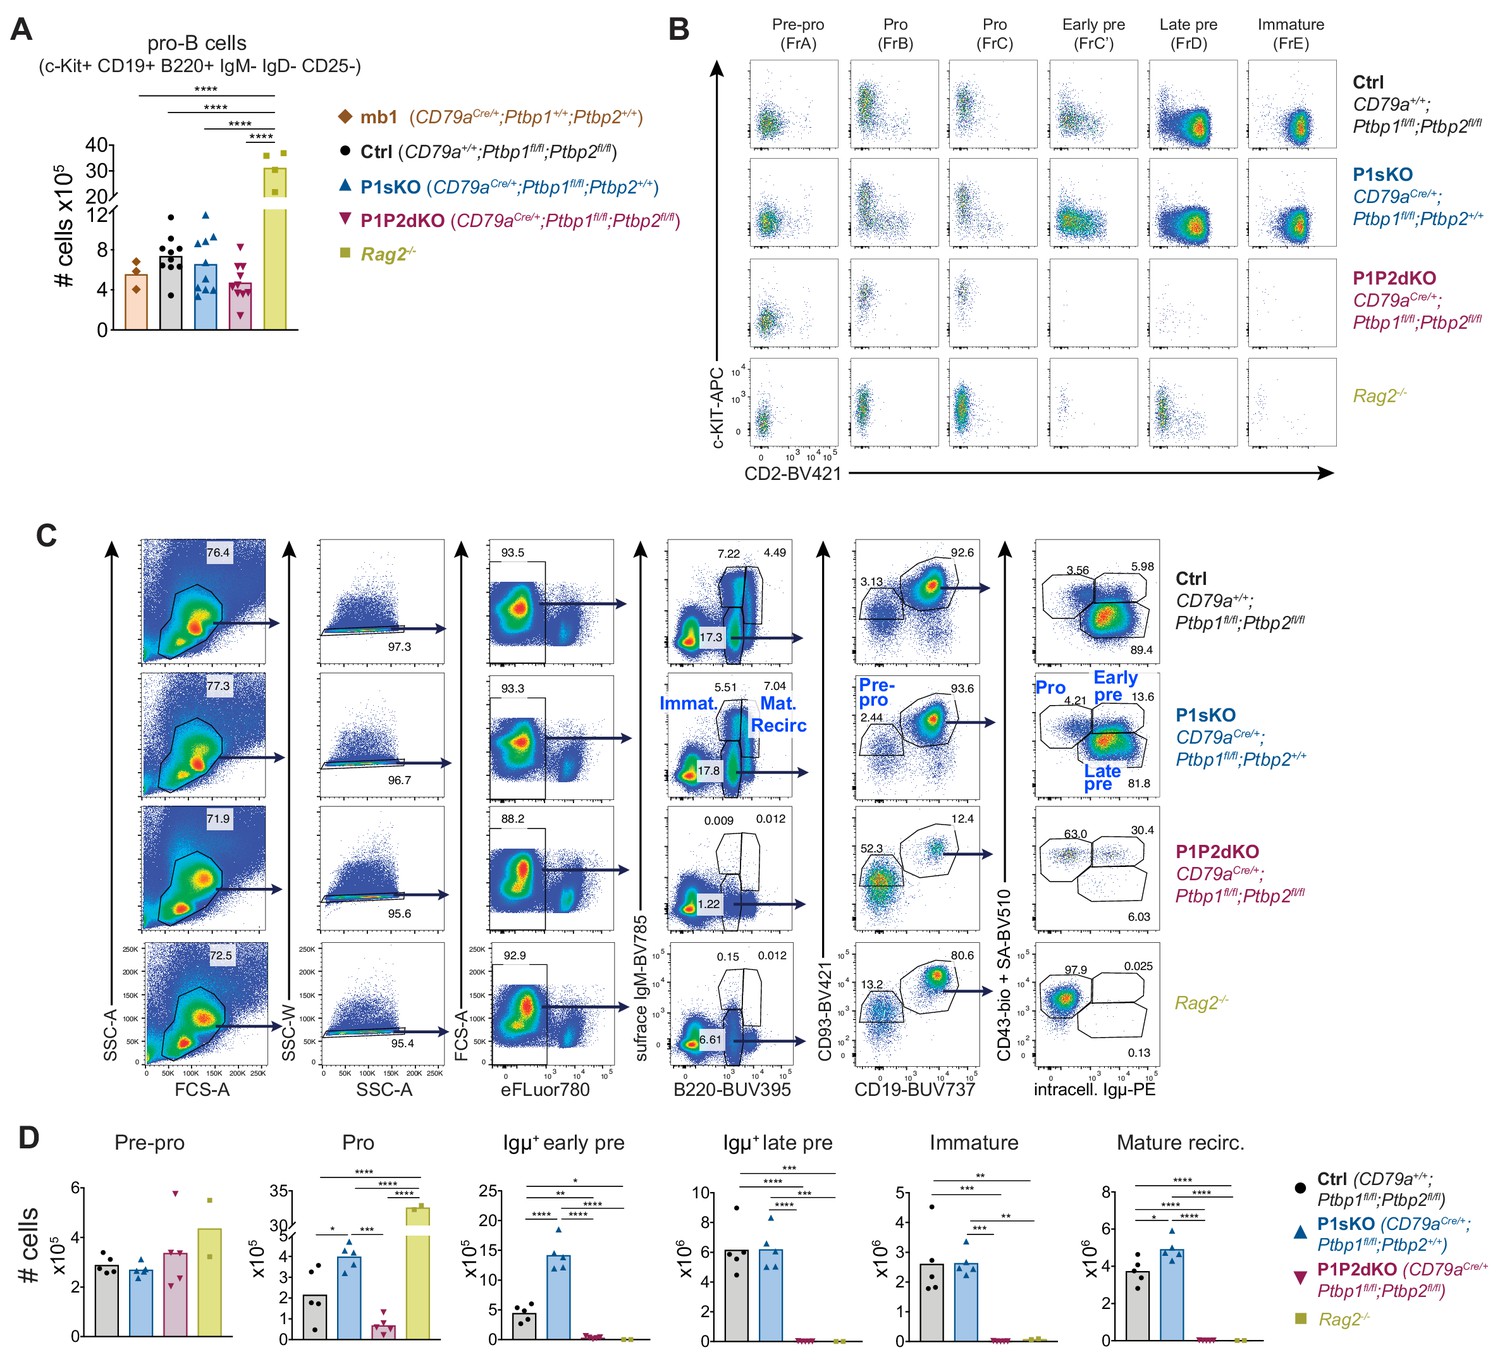
Absence of PTBP1 and PTBP2 blocks B cell development at the pro-B cell stage.
(A) Numbers of Pro-B cells gated on dump (Gr-1, CD11b, Siglec-F, F4/80, NK1.1)-negative, IgD-, IgM-, B220+, CD19+, cKIT+, CD25- bone marrow cells. Data shown are from two independent experiments together. Each individual data point shows data from two femurs and two tibias from one mouse. (B) c-KIT and CD2 staining at different B cell developmental stages gated as shown in Figure 3A in mice of the indicated genotypes. (C) Cell surface and intracellular staining strategy to define B cell developmental stages using Igµ staining in bone marrow cells from mice of the indicated genotypes. Numbers shown are percentages of gated events. (D) Numbers of developing B cells in bone marrow from two femurs and two tibias identified as shown in C. Data shown are from one experiment. (A and D) Bars depict arithmetic means, each point represents data from an individual mouse and P-values were calculated by one-way ANOVA with Tukey's multiple comparisons test. Summary adjusted p value *<0.05, **<0.01, ***<0.001, ****<0.0001.
Figure 3—figure supplement 2
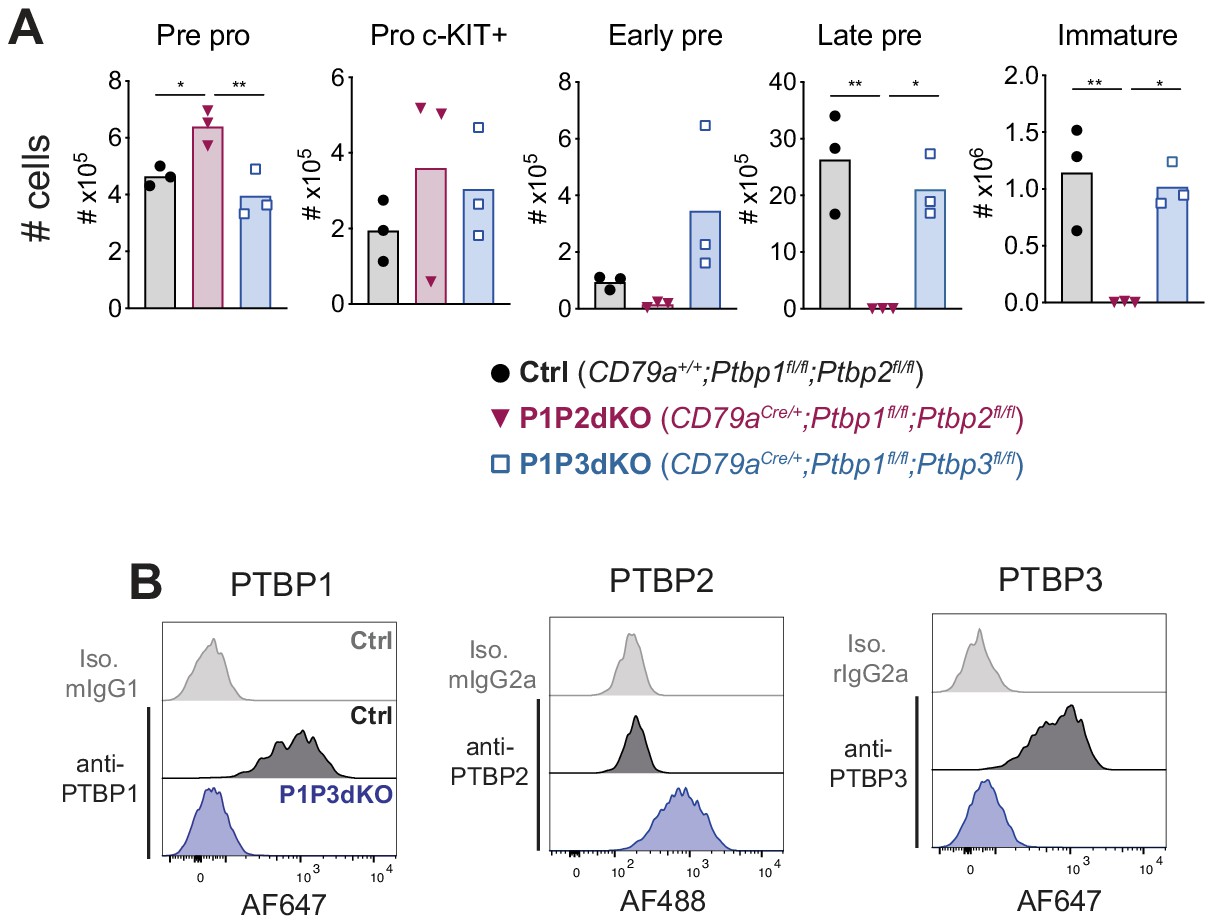
Deletion of Ptbp1 and Ptbp3 results in normal B cell development in the bone marrow.
(A) Numbers of distinct developmental B cell stages in the bone marrow (two femurs) from mice with the indicated genotypes identified as: Pre-pro (IgD- IgM- B220+ CD43+ CD19-), Pro cKIT+ (IgD- IgM- B220+ CD43+ CD19+ cKIT+ CD25- CD2-), Early pre-B cells (IgD- IgM- B220+ CD43+ CD19+ CD25+ CD2+), Late pre (IgD- IgM- B220+ CD43- CD19+) and Immature (IgD- IgM+ B220+) B cells. Bars depict arithmetic means, each point represents data from an individual mouse and P-values were calculated by one-way ANOVA with Tukey's multiple comparisons test. Summary adjusted p value *<0.05, **<0.01, ***<0.001, ****<0.0001. Adjusted p values between P1P3dKO and control late pre-B cells and immature B cells were 0.5617 and 0.8592, respectively. Data shown are from one experiment. (B) PTBP1, PTBP2, PTBP3 and isotype control staining of pro-B cells B cells (IgD- IgM- B220+ CD19+ CD43high CD2-) from control mice (CD79a+/+;Ptbp1fl/fl;Ptbp2fl/fl) and P1P3dKO (CD79aCre/+;Ptbp1fl/fl;Ptbp3fl/fl) mice analysed by flow cytometry. Data shown are from one mouse representative of three individual mice analysed in one experiment.
Figure 4 with 2 supplements
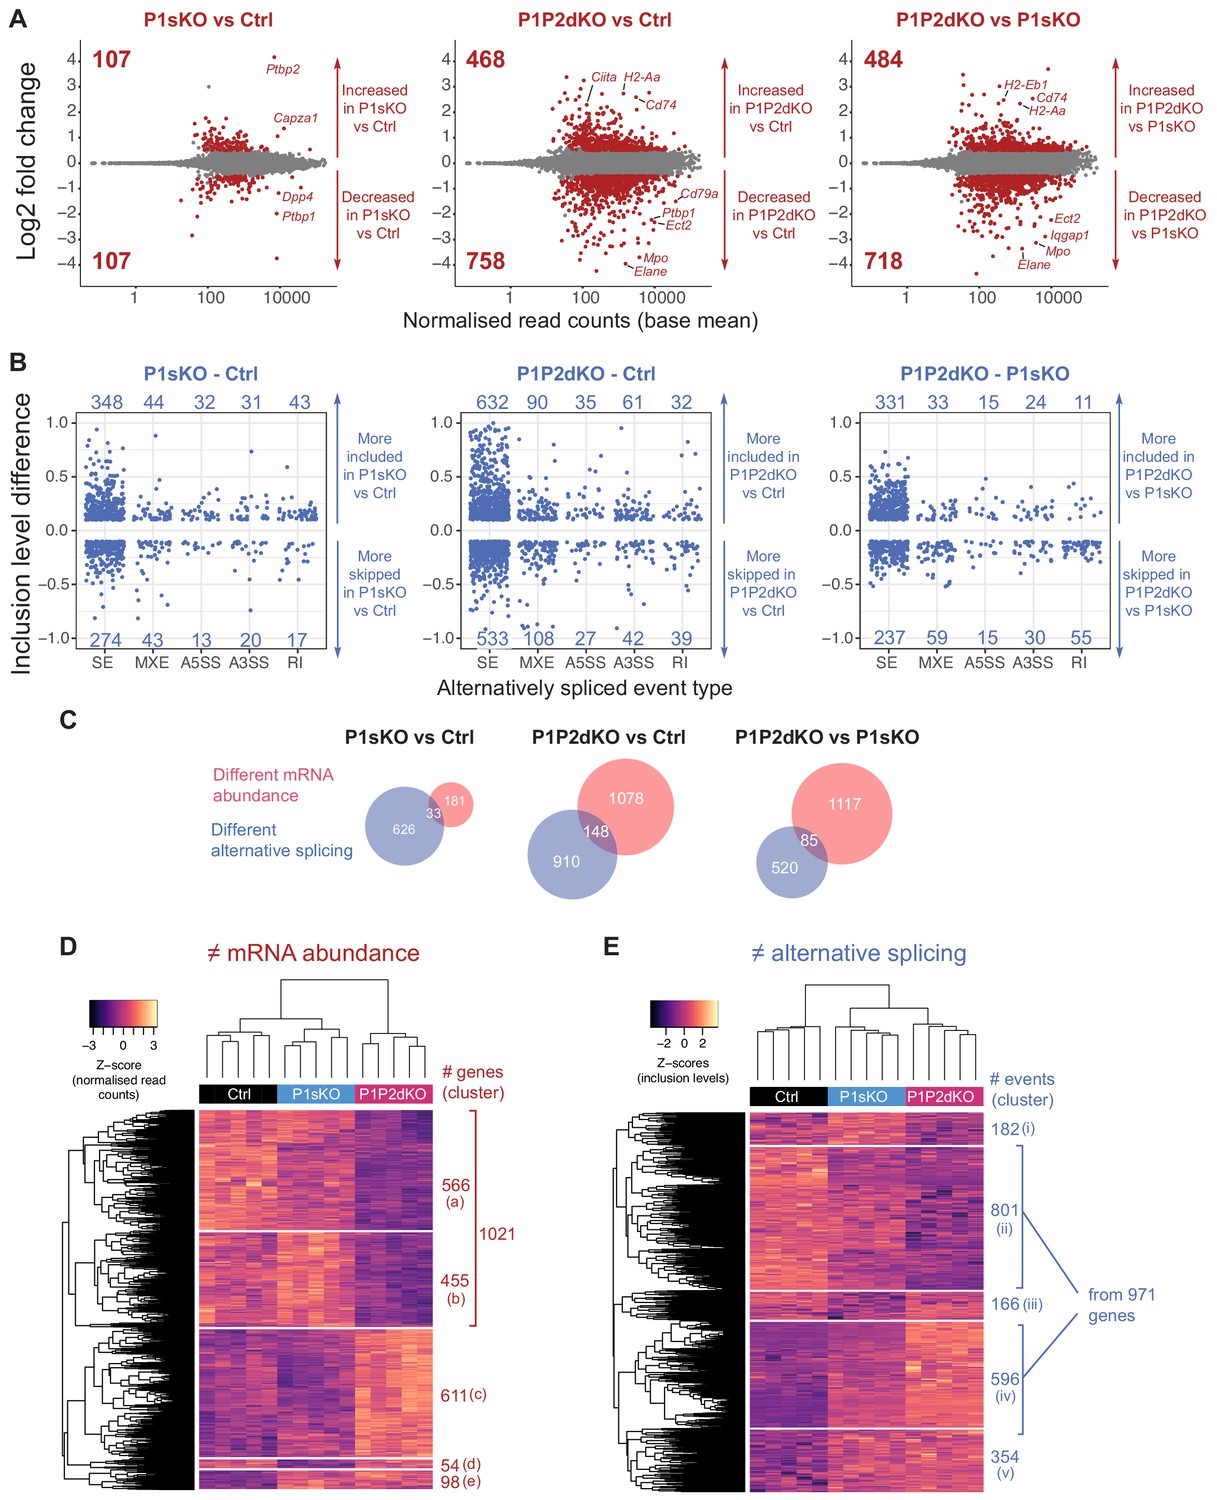
PTBP1 and PTBP2 absence causes changes in mRNA abundance and AS.
(A) Differences in mRNA abundance in pairwise comparisons from pro-B cell transcriptomes. Shown are Log2Fold changes calculated with DESeq2 (Figure 4—source data 1). Red dots are values from genes with significant differences in mRNA abundance (padj value <0.05) with a |Log2Fold change| > 0.5. Grey dots are values from genes with no significant differences (padj >0.05) or with a |Log2Fold change| < 0.5. Numbers in plots are the number of genes with increased or decreased mRNA abundance. (B) Differences in AS in pairwise comparisons from pro-B cells. Shown are |inclusion level differences| > 0.1 with an FDR < 0.05 for different types of alternatively spliced events (Figure 4—figure supplement 2C): skipped exons (SE), mutually exclusive exons (MXE), alternative 5’ and 3’ splice sites (A5SS and A3SS, respectively), and retained introns (RI), (Figure 4—source data 2) analysed with rMATS. Each dot shows the inclusion level difference for one event. (C) Overlaps of genes that have changes in abundance and AS. (D) Heatmap shows z-scores of normalised read counts from DESeq2 from each biological replicate for genes that were found with differential mRNA abundance in any of the three pair-wise comparisons shown in A. (E) Heatmap shows z-scores of inclusion levels from each biological replicate for those AS events that are alternatively spliced in any of the three pairwise comparisons shown in B. (D, E) Unsupervised hierarchical clustering was done on Euclidean distances from z-scores and is shown with dendrograms.
-
Figure 4—source data 1
Changes in mRNA abundance.
DESeq2 results shown in Figure 4A. Separate tabs show genes with significant differential (padj <0.05) mRNA abundance with a |log2 fold change| > 0.5 for the different pairwise comparisons carried out and also all the results obtained with DESeq2. Additional tabs show genes whose transcripts were bound by PTBP1 clusters at their 3’UTR.
- https://cdn.elifesciences.org/articles/53557/elife-53557-fig4-data1-v2.xls
-
Figure 4—source data 2
Changes in AS.
Different tabs show inclusion level differences (IncLevelDifference) shown in Figure 4B for the three pairwise comparisons carried out. The first three tabs show significant (FDR < 0.05) alternative splicing events with an absolute inclusion level difference >0.1. ‘allresults’ tabs show all the results from rMATS. ‘PTBP1 bound’ tabs show those significantly differential splicing events that were bound in their vicinity by PTBP1 clusters.
- https://cdn.elifesciences.org/articles/53557/elife-53557-fig4-data2-v2.xls
Figure 4—figure supplement 1
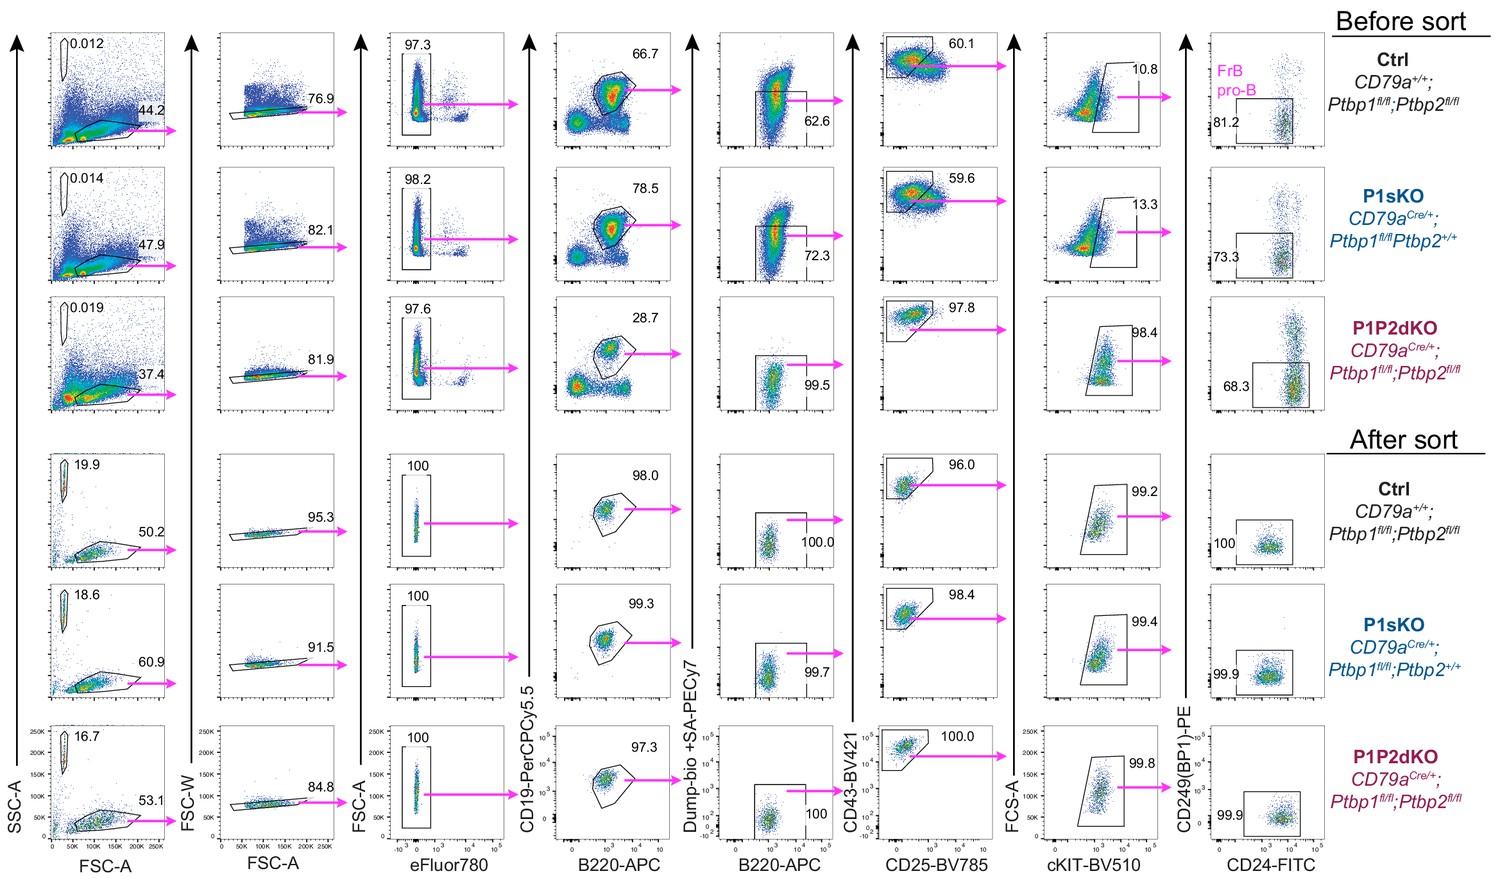
Cell sorting strategy of pro-B cells.
Cell sorting strategy of FrB pro-B (B220+CD19+IgM-IgD-CD2-CD43highCD25-cKIT+CD24+CD249+) cells used to isolate RNA and carry out mRNAseq libraries. ‘Dump’ contains excluded cells stained with anti-IgM, anti-CD2 and streptavidin. Prior sorting, bone marrow cells were depleted from Gr-1, CD11b, IgD, NK1.1, CD3e and Ter119-positive cells using biotinylated antibodies.
Figure 4—figure supplement 2

Transcriptome analysis of pro-B cells.
(A) Transcriptome correlation in mitogen-activated primary B cells and FrB pro-B cells. Dots show mean values of TPMs (Transcripts Per Million) from four or five biological replicates in mitogen-activated B cells and pro-B cells, respectively. Correlation was calculated with Spearman's rank correlation rho on genes with > = 1 TPM in pro-B cells and >0 TPM in mitogen-activated B cells (12545 genes). 681 genes had 0 TPMs in mitogen-activated B cells and > = 1 TPM in pro-B cells. (B) Proportions of genes with differences in mRNA abundance for the indicated pairwise comparisons that are bound by clusters of PTBP1 (iCLIP data) on their 3’UTR (Figure 4—source data 1). (C) Different types of alternative splicing events analysed with rMATS. (D) Proportions of AS changes between the indicated comparisons that are bound by at least one PTBP1 cluster on the alternatively spliced exon or in its vicinity (500 nucleotides upstream or downstream of the alternatively spliced exon, on the constitutive flanking exons, on the 500 nucleotides downstream of the upstream constitutive exon or on the 500 nucleotides upstream of the downstream constitutive exon) (Figure 4—source data 2). (E) mRNA abundance of known regulators of B cell development in pro-B cells. DESeq2 normalised read counts of the indicated genes. DESeq2 calculated padj values are shown when < 0.05. Bars show arithmetic means. Each dot shows data from an individual mRNAseq biological replicate.
Figure 5
PTBP1 regulates pathways associated with growth and proliferation.
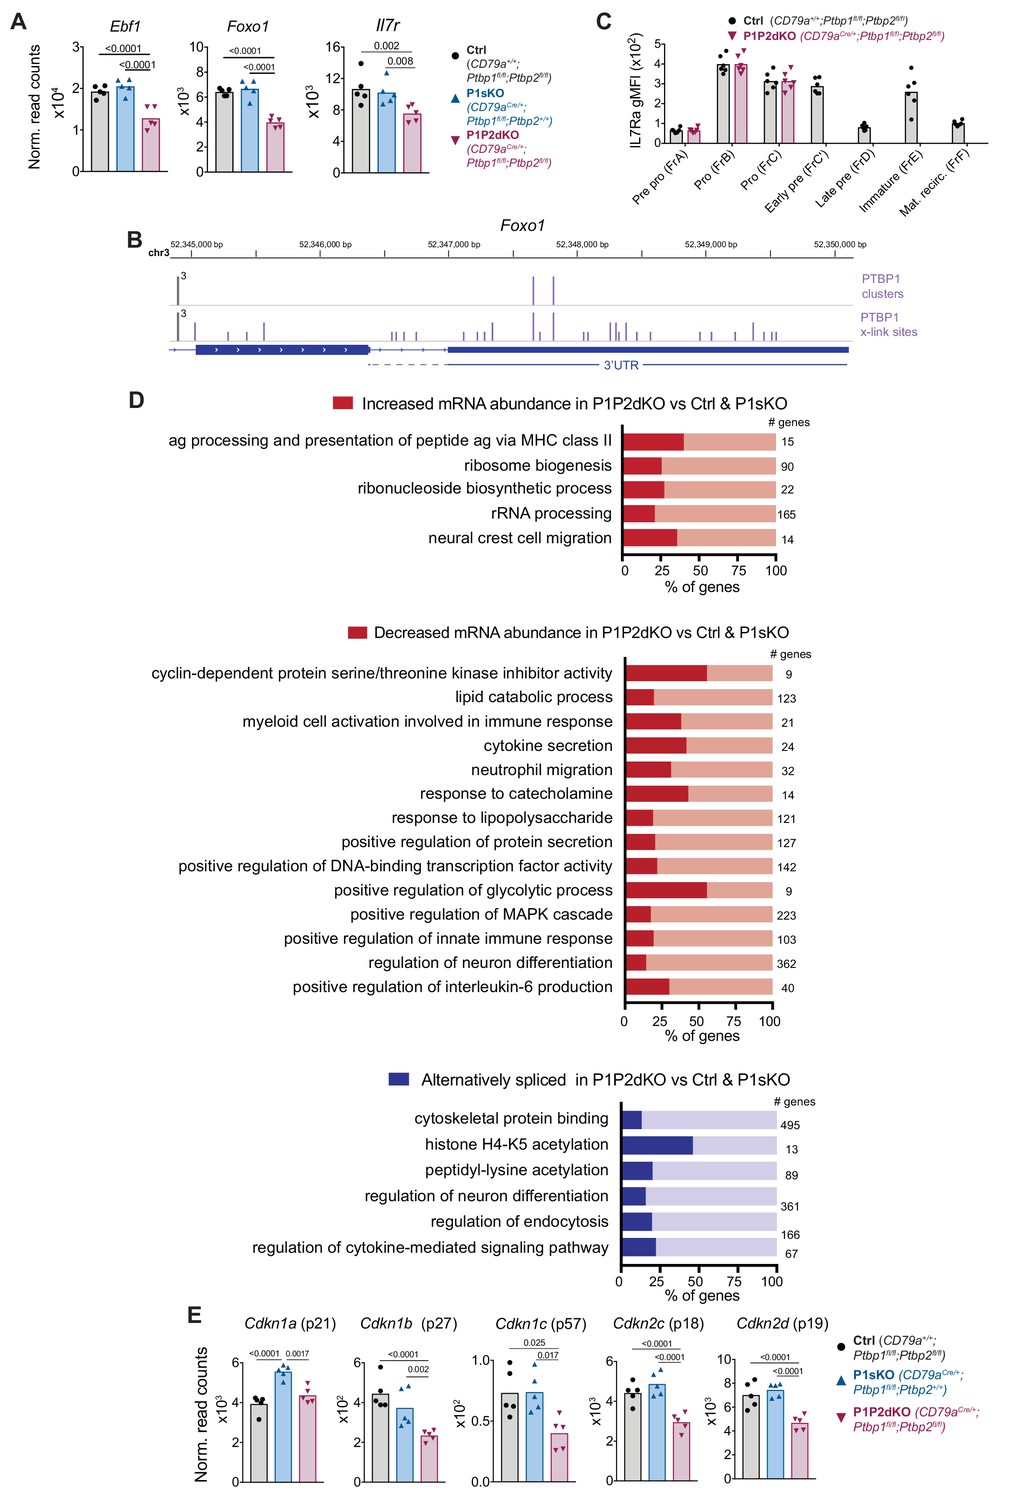
(A) Ebf1, Foxo1 and IL7r mRNA abundance in FrB pro-B cells from control, P1sKO and P1P2dKO mice. (B) PTBP1 binding (iCLIP data) to the Foxo1 3’UTR. (C) IL-7R (CD127) geometric mean fluorescent intensity in stages of B cell development identified as shown in Figure 3A . Individual data points are from individual mice. Data shown are from one representative out of two experiments. Unpaired T-test was carried out comparing control and P1P2dKO developing B cells. p values were > 0.05 and are not shown. (D) Selected gene ontology (GO) terms (process and function) significantly (p-value<0.05) enriched amongst genes that are differentially expressed at the abundance or the AS level when comparing the transcriptome of P1P2dKO pro-B cells to P1sKO and control pro-B cells as shown in Figure 4D and E. Numbers show how many genes a GO term relates to. Figure 5—source data 1 contains all significantly enriched GO process and function terms. (E) mRNA abundance of CDK inhibitors in pro-B cells from control, P1sKO and P1P2dKO mice. (A and E) Points show DESeq2 normalised read counts from individual pro-B cell mRNAseq libraries. Bars depict arithmetic means. DESeq2 calculated p-adjusted values are shown when < 0.05 for the indicated pairwise comparisons.
-
Figure 5—source data 1
Gene ontology enrichment analysis.
- https://cdn.elifesciences.org/articles/53557/elife-53557-fig5-data1-v2.xls
Figure 6 with 2 supplements
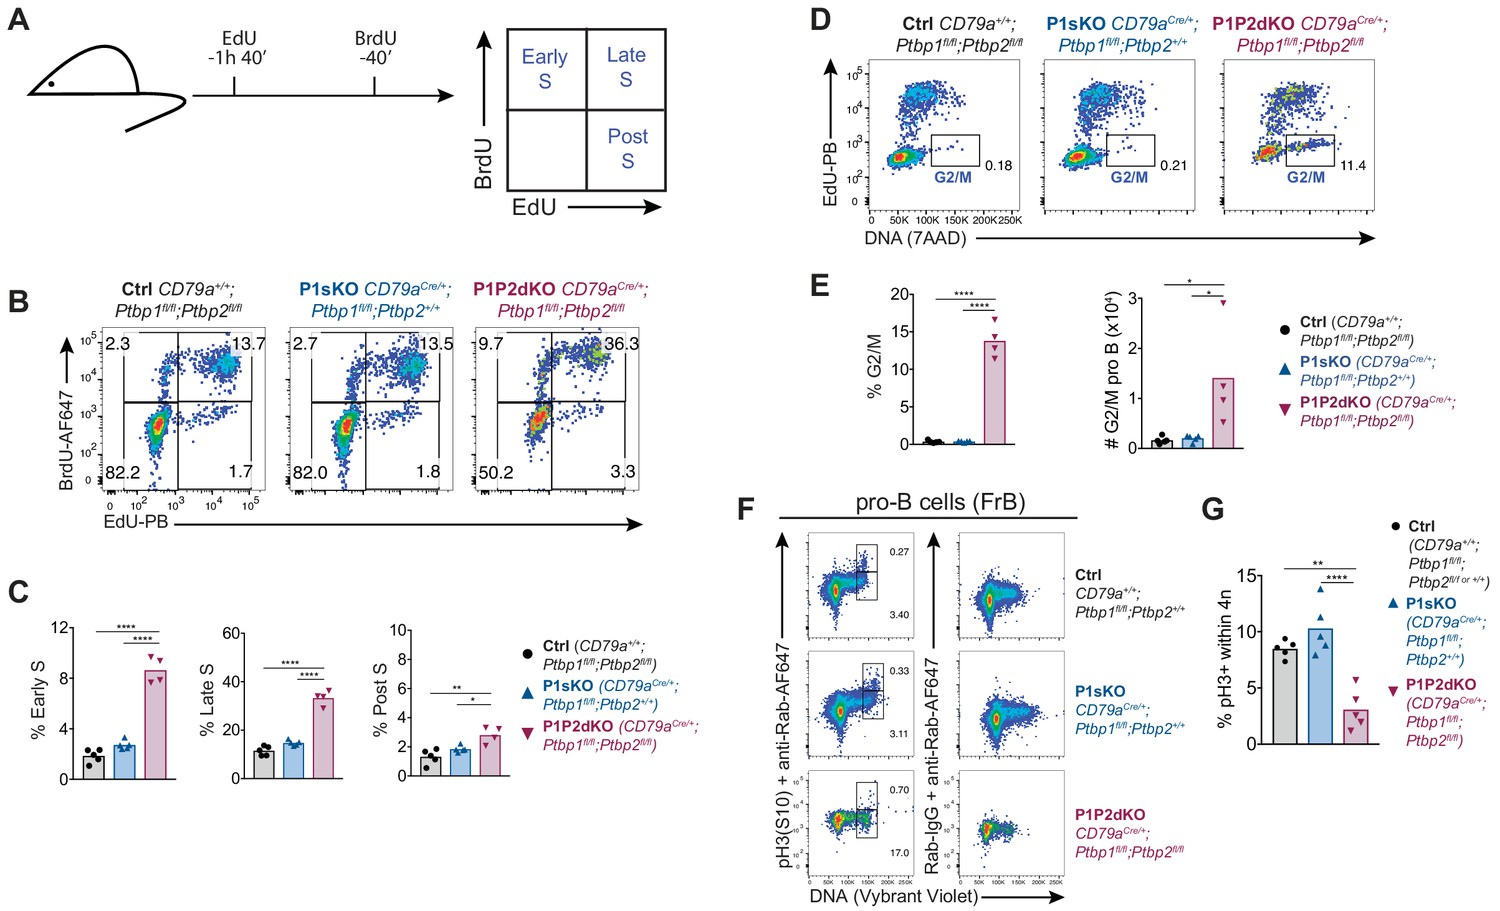
Enhanced entry into S-phase and block at G2 in P1P2dKO pro-B cells.
(A) EdU and BrdU sequential labelling experimental set up to distinguish early, late and post S-phase cells. (B) Flow cytometry data of the different stages of S-phase in pro-B cells (B220+CD19+IgD-surfaceIgM-intracellular-Igμ-CD43high) identified as shown in Figure 6—figure supplement 2A. Numbers shown are proportions of cells. (C) Percentages of pro-B cells in different S-phase stages determined as shown in A and B. (D) Flow cytometry data of pro-B cells identified as shown in Figure 6—figure supplement 2A and excluding BrdU+-only (cells in early S-phase). Numbers shown are proportions of cells in the G2/M gate. (E) Proportions and numbers (in 2 femurs and two tibias per mouse) of pro-B cells in G2/M identified as shown in (D). (F) Phospho-histone 3 serine 10 (pH3 S10) staining amongst FrB pro-B cells identified as in Figure 6—figure supplement 1A. (G) Percentages of pH3(S10)-positive cells amongst cells with 4N DNA amounts in pro-B cells (FrB) assessed by flow cytometry as shown in F. (C, E, G) Bars depict arithmetic means, each point represents data from an individual mouse and P-values were calculated by one-way ANOVA with Tukey's multiple comparisons test. Summary adjusted p-value *<0.05, **<0.01, ***<0.001, ****<0.0001. (B–E) Data shown are from one of two independent experiments. (F, G) Data shown are from one out of three independent experiments.
Figure 6—figure supplement 1

Cell cycle analysis in FrB and FrC pro-B cells.
(A) Identification strategy of proliferating FrB and FrC pro-B cells amongst bone marrow cells from mice with the indicated genotypes. Events shown on the left were pre-gated on eFluor780- live IgM-, IgD-, CD2-, CD25-, Gr1- bone marrow cells. Mice were injected with EdU i.p. one hour before analysis to track cells in G0/G1, S and G2/M phases of the cell cycle. (B) Proportions of FrB and FrC developing B cells in G0/G1, S and G2/M phases identified as as in A. Data shown are from one out of three independent experiments. (C) FCS-A measurements of FrB and FrC pro-B cells in different phases of the cell cycle identified as in A. No data are shown for FrC pro-B cells in G2 as there were too few events to carry out reliable measurements. (B, C) Bars depict arithmetic means, each point represents data from an individual mouse and P-values were calculated by one-way ANOVA with Tukey's multiple comparisons test. Summary adjusted p-value *<0.05, **<0.01, ***<0.001, ****<0.0001.
Figure 6—figure supplement 2
Cell cycle analysis in pro-B cells.
(A) Gating strategy to identify pre-pro-, pro- and early-pre-B cells in EdU and BrdU sequential labelling experiments in live bone marrow cells from the indicated genotypes. (B) Early-, late- and post-S-phase gating amongst pre-pro-, pro- and early-pre-B cells identified as shown in A. (C) Proportions of early, late and post S-phase cells amongst pre-pro-, pro- and early-pre-B cells identified as shown in A and B. Data shown are from one out of two independent experiments. Bars show arithmetic means, each point shows data from an individual mouse and P-values were calculated by one-way ANOVA with Tukey's multiple comparisons test. Summary adjusted p-value *<0.05, **<0.01, ***<0.001, ****<0.0001.
Figure 7 with 1 supplement
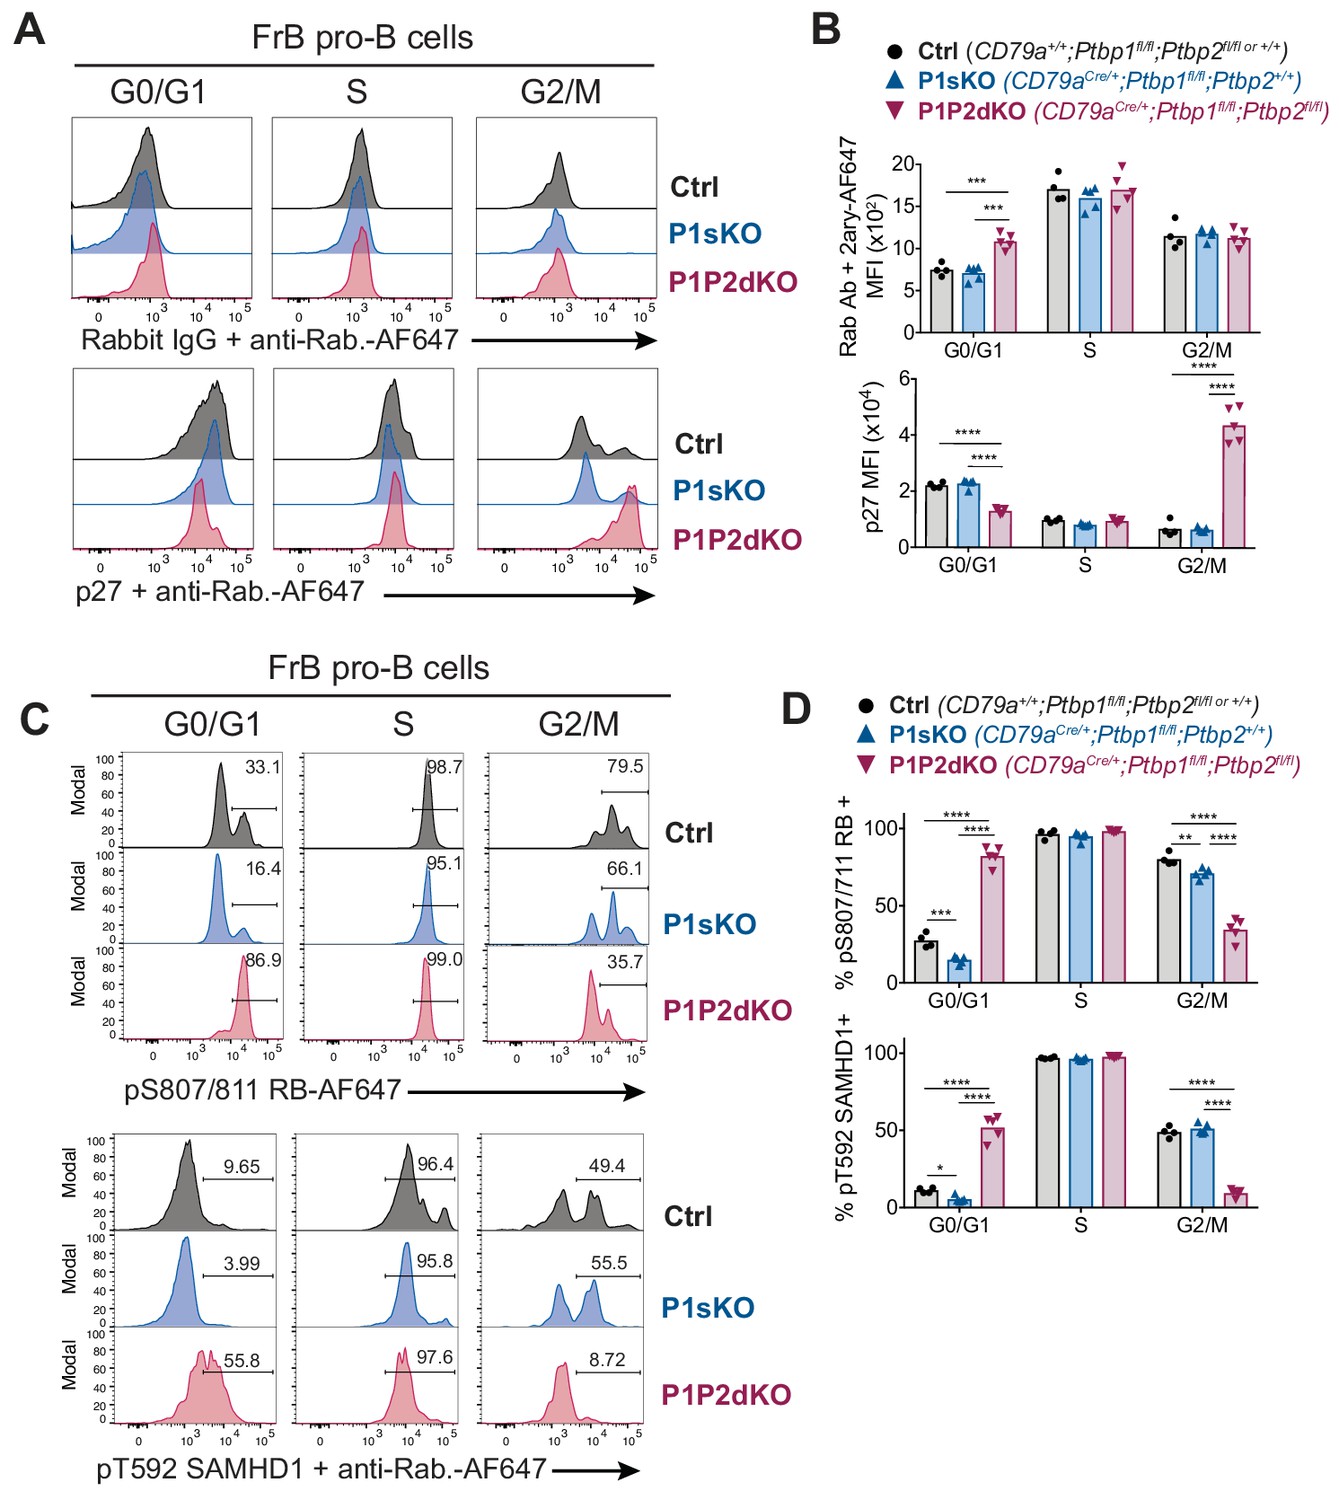
PTBP1 controls CDK activity in FrB pro-B cells.
(A) Intracellular flow cytometry with anti-p27 antibody or control isotype staining detected with an anti-rabbit AF647-conjugated secondary antibody. (B) Median fluorescence intensities (MFI) from staining shown in A. (C) Intracellular flow cytometry with the indicated antibodies. Numbers show proportions of gated events. (D) Proportions of cells identified in C. (A, C) Each histogram line shows data from an individual mouse with the indicated genotype. FrB pro-B cells in G0/G1, S or G2/M phases of the cell cycle were defined by EdU incorporation and DNA staining as shown in Figure 6—figure supplement 1A. (B, C) Points show data from individual mice. Bars depict arithmetic means. P-values were calculated by two-way ANOVA with Tukey's multiple comparisons test. Summary adjusted p value *<0.05, **<0.01, ***<0.001, ****<0.0001. (A–D) Data are from one experiment with four to five mice per genotype. The differences observed for pT592-SAMHD1 and pS807/S811-RB between control and P1P2dKO cells were confirmed in an independent experiment where two control and two P1P2dKO mice were used.
Figure 7—figure supplement 1
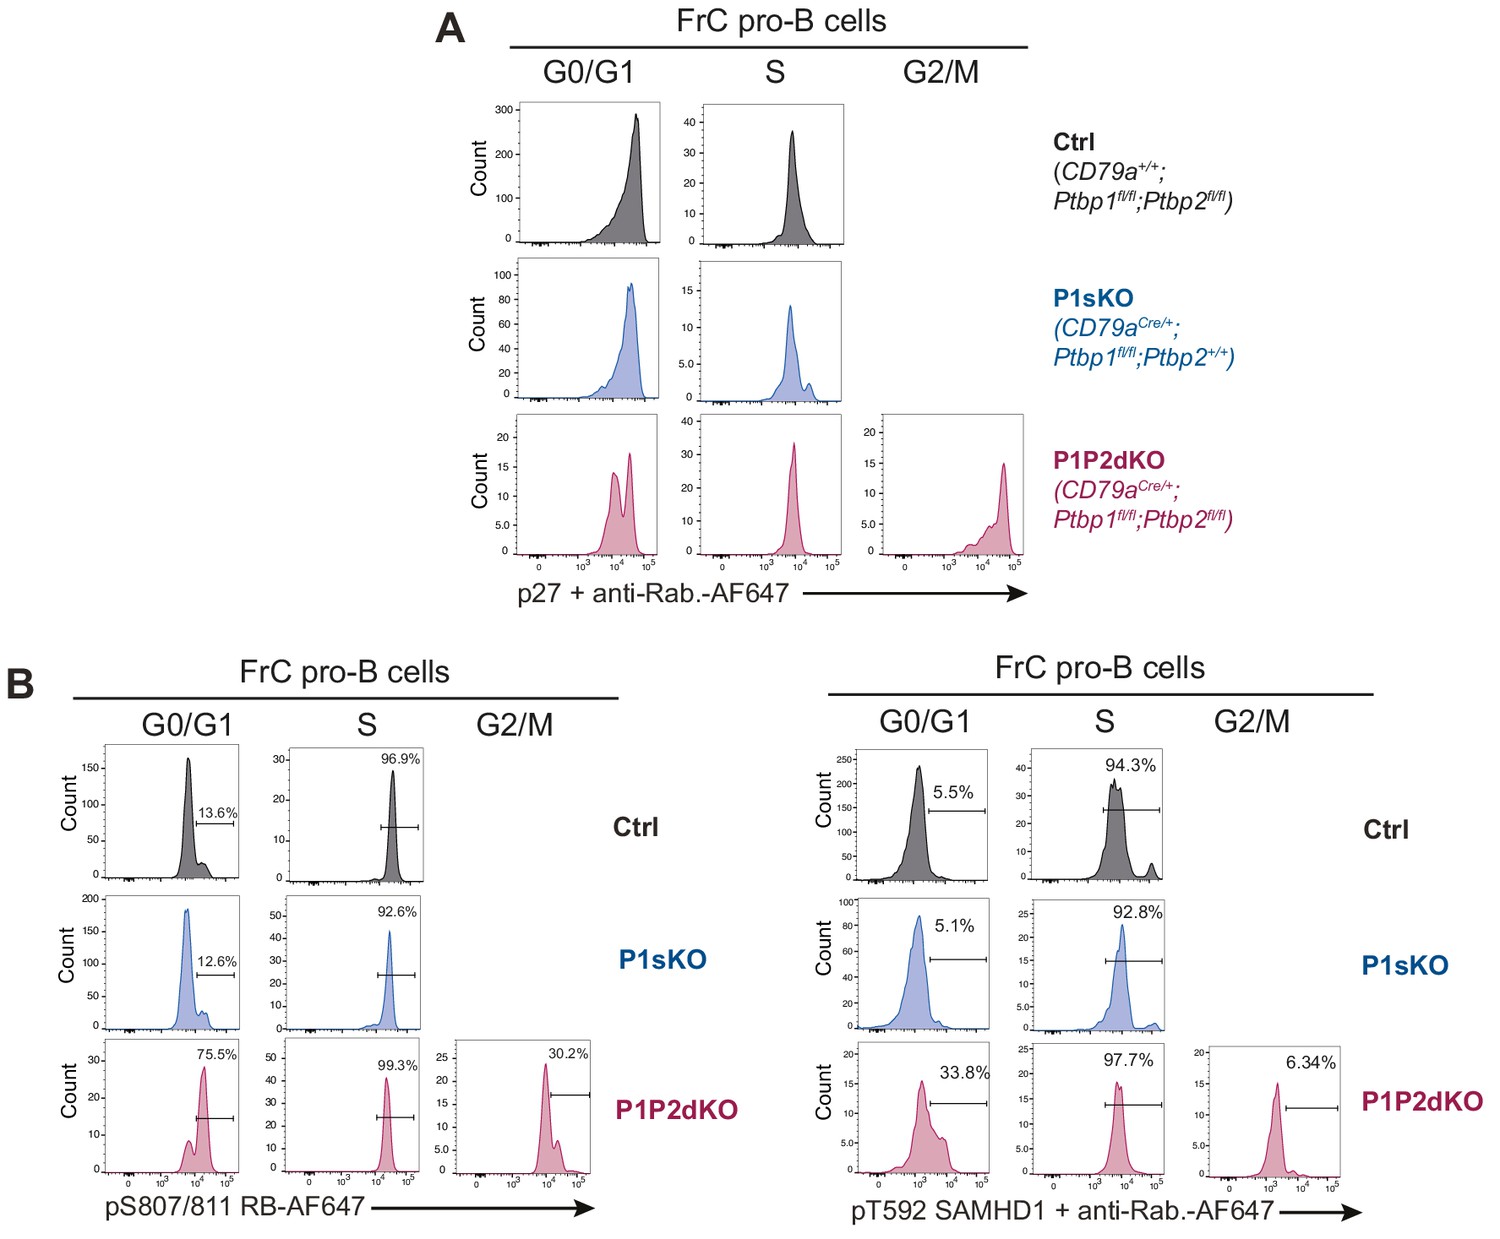
PTBP1 controls CDK activity in FrC pro-B cells.
Intracellular staining for p27 (A), pT592-SAMHD1 and pS807/S811-RB (B) amongst FrC pro-B cells. FrC pro-B cells in distinct phases of the cell cycle were identified as shown in Figure 6—figure supplement 1A. Data shown are from one representative mouse out of four or five per genotype. No data are shown for G2/M FrC pro-B cells from control and P1sKO mice as the number of events in these gates was smaller than 100 events.
Figure 8 with 2 supplements
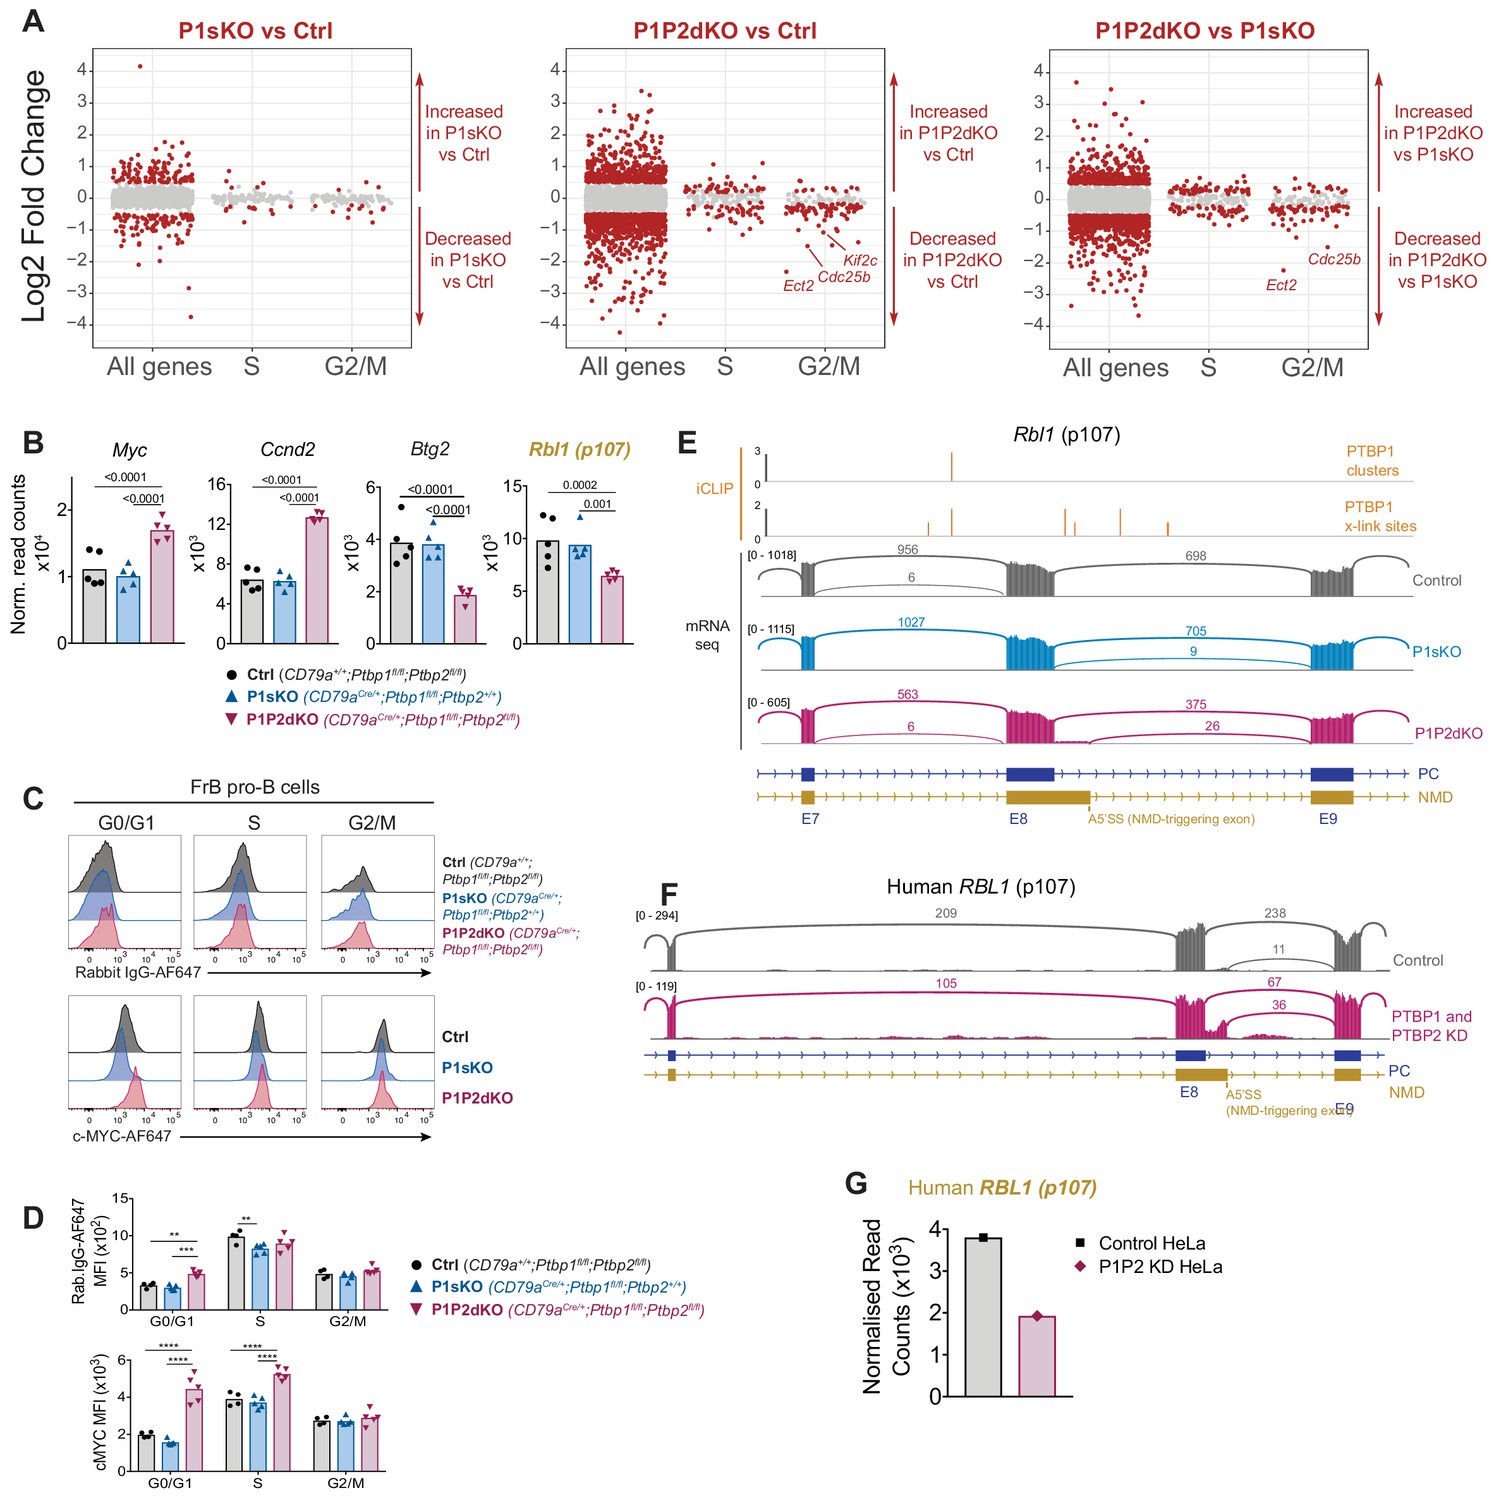
PTBP1 controls expression of genes important for S-phase entry.
(A) Log2-fold changes in mRNA abundance in the indicated pairwise comparisons for all tested genes (all genes), genes with increased abundance in S-phase (S) and G2/M-phases (G2/M). Grey dots show genes with padj >0.05. Red dots amongst ‘all genes’ show genes with padj <0.05 and a |log2-fold change| > 0.5. Red dots amongst S and G2M groups show genes with a padj <0.05 regardless of their log2-fold change. (B) mRNA abundance in pro-B cells from control, P1sKO and P1P2dKO mice. Rbl1 (name in yellow) is predicted to have reduced mRNA abundance due to changes in AS triggering NMD upon Ptbp1 and Ptbp2 deletion. Individual data points show DESeq2 normalised read counts from individual pro-B cell mRNAseq libraries. Bars depict arithmetic means. DESeq2 calculated adjusted p-values are shown when < 0.05 for the indicated pairwise comparisons. (C) Intracellular c-MYC or control isotype staining of FrB pro-B cells in different stages of the cell cycle identified as shown in Figure 6—figure supplement 1A. (D) Median fluorescence intensities (MFI) from the staining shown in C. Each point shows data from an individual mouse. Bars show means. P-values were calculated by two-way ANOVA with Tukey's multiple comparisons test. Summary adjusted p value *<0.05, **<0.01, ***<0.001, ****<0.0001. Data shown are from one representative out of two independent experiments. (E) PTBP1 iCLIP and mRNAseq data visualisation. For PTBP1 iCLIP, x-link sites are shown for all events. Clusters of PTBP1 binding are shown when found. mRNAseq data from pro-B cells of one replicate per genotype is shown using sashimi plot visualisation from Integrative Genomics Viewer (IGV). Numbers on the left show the maximum number of reads in the coverage plots. Arcs depict exon-exon junctions detected in mRNAseq reads. Numbers in arcs show the number of reads for the depicted exon-exon junction. Parts of transcript isoforms predicted to be degraded by NMD are shown in yellow. Parts of transcript isoforms coding for proteins are shown in blue. Exon numbers of transcript isoforms coding for proteins are shown with E and a number. (F) mRNAseq visualisation as in (E) from HeLa control cells or cells where PTBP1 and PTBP2 were knocked down (Ling et al., 2016). (G) Human RBL1 normalised DESeq2 read counts from the two mRNAseq libraries (one control and one double knock down) shown in (F).
-
Figure 8—source data 1
DESeq2 results for genes shown to have high mRNA expression levels in S or G2/M phases (Giotti et al., 2019) in the three pair-wise comparisons shown in Figure 8A.
- https://cdn.elifesciences.org/articles/53557/elife-53557-fig8-data1-v2.xls
Figure 8—figure supplement 1
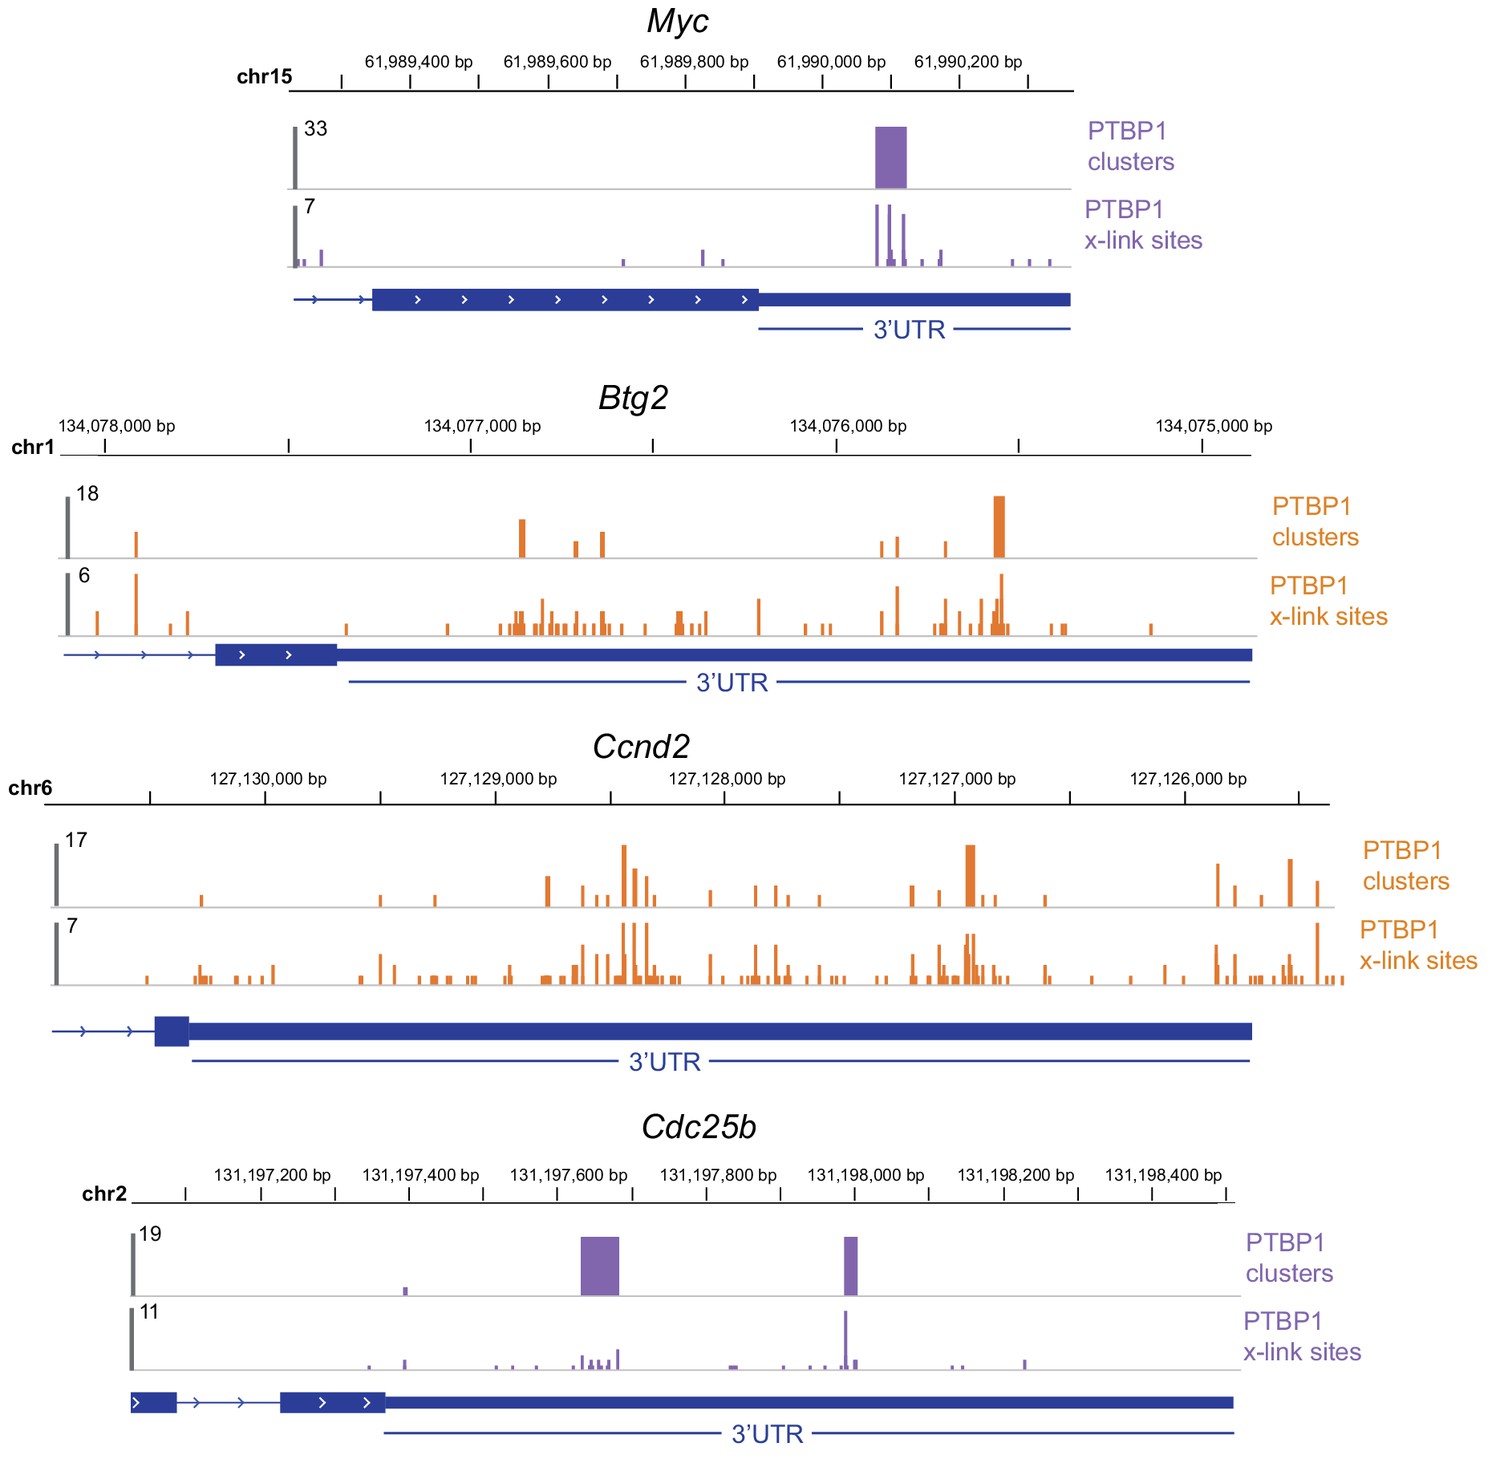
PTBP1 binding to target transcripts.
PTBP1 binding (iCLIP data) to 3’UTRs.
Figure 8—figure supplement 2
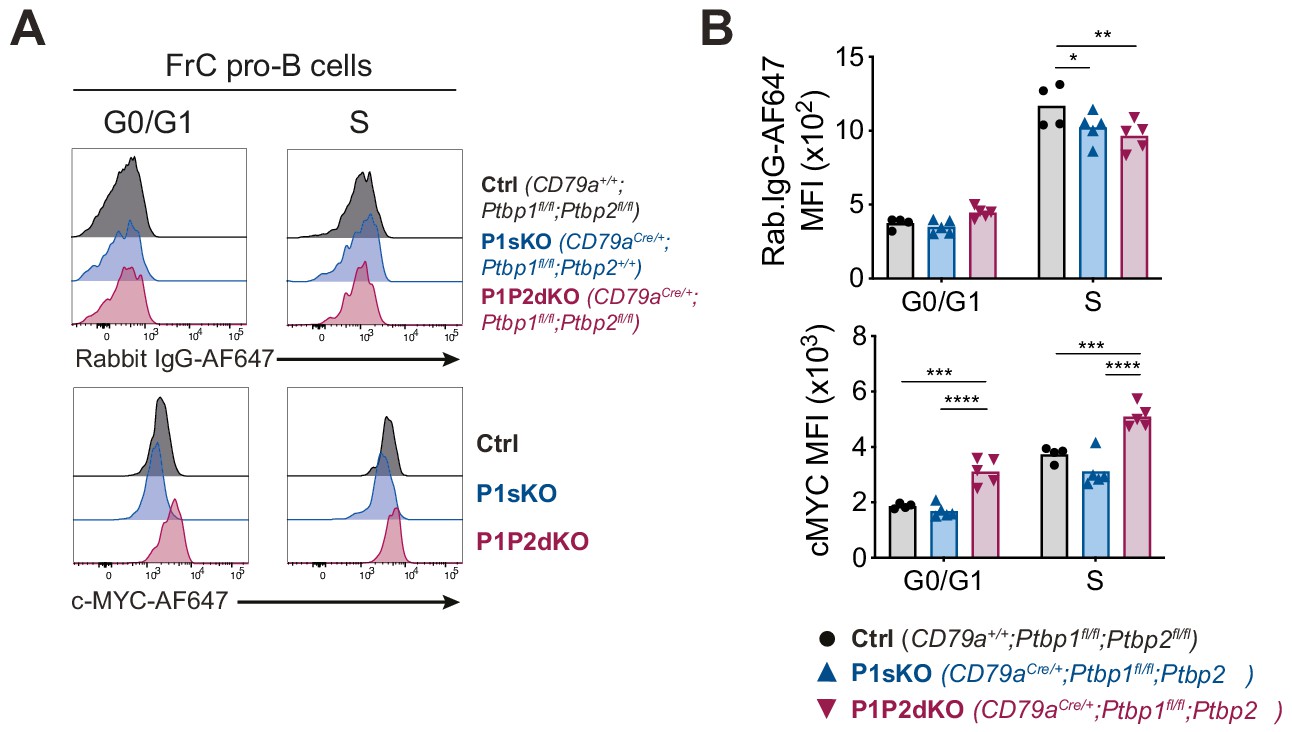
c-MYC staining in FrC pro-B cells.
(A) Intracellular c-MYC or control isotype staining of FrC pro-B cells in different stages of the cell cycle identified as shown in Figure 6—figure supplement 1A. (B) Median fluorescence intensities (MFI) from the staining shown in A. Each point shows data from an individual mouse. Bars show means. P-values were calculated by two-way ANOVA with Tukey's multiple comparisons test. Summary adjusted p value *<0.05, **<0.01, ***<0.001, ****<0.0001. Data shown are from one representative out of two independent experiments.
Figure 9

PTBP1 controls expression of genes important for mitosis.
(A) mRNA abundance of the indicated genes. Genes whose names are in yellow and bold are predicted to have reduced mRNA abundance due to changes in AS triggering NMD upon Ptbp1 and Ptbp2 deletion. Individual data points show DESeq2 normalised read counts from individual pro-B cell mRNAseq libraries. Bars depict arithmetic means. DESeq2 calculated adjusted p-values are shown when < 0.05 for the indicated pairwise comparisons. (B) PTBP1 iCLIP and mRNA-Seq visualisation as described in Figure 8E. Ect2 has an additional isoform that appears with low numbers of reads which is not depicted in the gene model. This isoform results from the inclusion of an alternative 3’ splice site on Ect2 exon 20 which will generate in an isoform predicted to be degraded by NMD. (C) Representation of cell cycle mRNA regulon controlled by PTBP1 in pro-B cells and consequences of Ptbp1 and Ptbp2 deletion in pro-B cells. Depicted interactions of PTBP1 with individual factors are likely to be direct.
Tables
Table 1
mRNA expression levels of cell cycle regulators in mitogen activated mature B cells and FrB pro-B cells.
Values shown are arithmetic mean Transcripts Per Million (TPMs) from four and five mRNAseq libraries for activated mature B cells and for FrB pro-B cells, respectively.
| Activated mature B cells | FrB pro-B cells | |
|---|---|---|
| Myc | 155.8 | 315.3 |
| Ccnd2 | 128.5 | 52.7 |
| Btg2 | 51.5 | 109.3 |
| Rbl1 | 19.3 | 127.0 |
| Cdc25b | 66.8 | 190.1 |
| Ect2 | 17.8 | 198.9 |
| Kif2c | 30.0 | 151.6 |
| Kif22 | 35.6 | 344.3 |
Additional files
-
Supplementary file 1
PTBP1 binding sites (xlinks).
- https://cdn.elifesciences.org/articles/53557/elife-53557-supp1-v2.csv.zip
-
Supplementary file 2
PTBP1 binding sites (clusters).
- https://cdn.elifesciences.org/articles/53557/elife-53557-supp2-v2.csv
-
Supplementary file 3
Key resources table.
- https://cdn.elifesciences.org/articles/53557/elife-53557-supp3-v2.docx
-
Transparent reporting form
- https://cdn.elifesciences.org/articles/53557/elife-53557-transrepform-v2.docx
Download links
A two-part list of links to download the article, or parts of the article, in various formats.
Downloads (link to download the article as PDF)
Open citations (links to open the citations from this article in various online reference manager services)
Cite this article (links to download the citations from this article in formats compatible with various reference manager tools)
Polypyrimidine tract-binding proteins are essential for B cell development
eLife 9:e53557.
https://doi.org/10.7554/eLife.53557


