Caenorhabditis elegans PIEZO channel coordinates multiple reproductive tissues to govern ovulation
- National Institute of Diabetes and Digestive and Kidney Diseases, National Institutes of Health, United States
- Department of Bioengineering, Northeastern University, United States
- Department of Biology, Northeastern University, United States
- Division of Biology and Biological Engineering, California Institute of Technology, United States
Figures
Figure 1 with 1 supplement
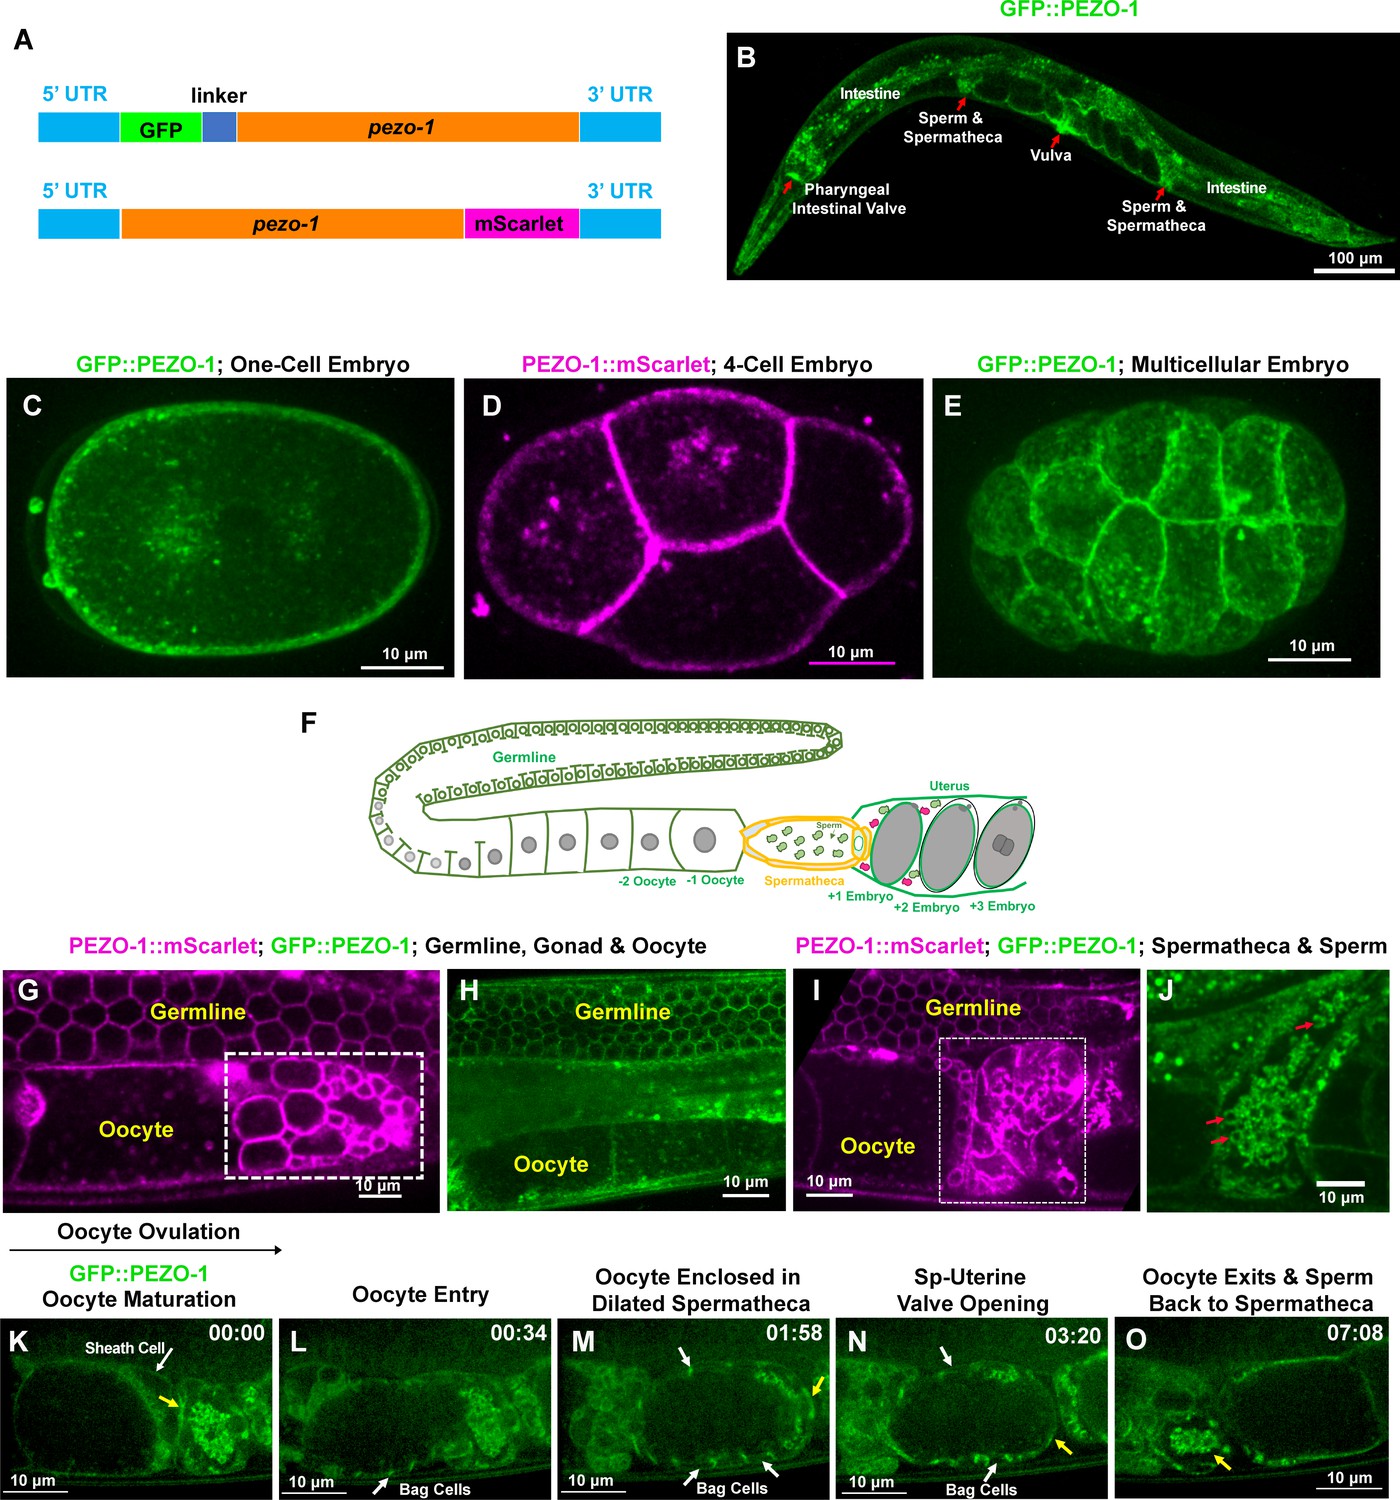
pezo-1 is widely expressed in C. elegans.
(A) Two fluorescent reporter genes were knocked-in to both N-terminus and C-terminus of pezo-1. (B) GFP::PEZO-1 is strongly expressed in multiple mechanosensitive tissues, such as the pharyngeal-intestinal valve, spermatheca, and vulva (red arrows). (C, E) GFP::PEZO-1 (green) is expressed in the plasma membrane of different-staged embryos. (D) PEZO-1::mScarlet (magenta) also localizes to the plasma membranes of embryos. (F) A schematic of the C. elegans gonad. (G–J) Both PEZO-1::mScarlet (magenta) and GFP::PEZO-1 (green) localize to reproductive tissues, such as the plasma membranes of the germline cells (G–I), somatic gonad (G–J), spermatheca (I; in white box), and sperm (J; red arrows). PEZO-1::mScarlet (magenta) also labels the spermatids that have not yet migrated into the spermatheca (small circles, white box in panel [G]) and the residual bodies not yet engulfed by the sheath cells (bigger circles, white box in panel [G]) (Huang et al., 2012). (K–O) Representative images of PEZO-1 localization during ovulation and fertilization. GFP::PEZO-1 (green) localizes to the sheath cell (white arrow) and the spermathecal distal valve (yellow arrow (K), which remains closed before ovulation. The oocyte is ovulated, enters into the spermatheca (L) and remains enclosed in the spermatheca until fertilization is completed (M). During fertilization, GFP::PEZO-1 remained on the spermathecal-uterine (sp-ut) valve as indicated by a yellow arrow (M, N). The bag cells of the spermatheca also express GFP::PEZO-1 at this time (representative bag cells are marked by white arrows in panels (L–N). After fertilization, the sp-ut valve opened (N, yellow arrow) and allowed the newly fertilized zygote to exit the constricting spermatheca (N, O). Constriction of the spermatheca pushes the fertilized zygote into the uterus; sperm can be seen in the constricted spermatheca (O, yellow arrow). The black arrow above panel (K) shows the direction of embryo travelthrough the spermatheca from left to right. The timing of each step is labeled on the top right in minutes and seconds. Scale bars are indicated in each panel.
-
Figure 1—source data 1
Number of independent samples were collected for pezo-1 expression pattern in C. elegans.
- https://cdn.elifesciences.org/articles/53603/elife-53603-fig1-data1-v3.xlsx
Figure 1—figure supplement 1
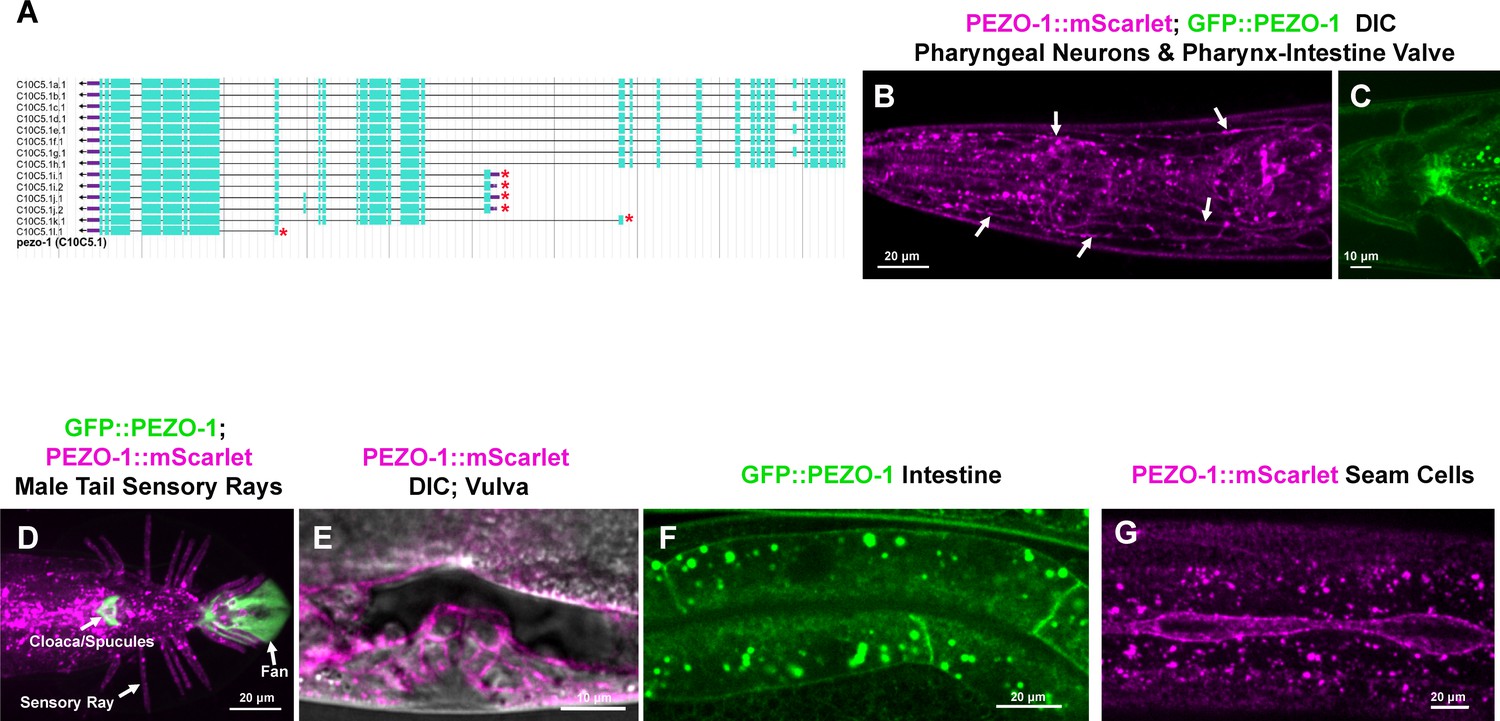
PEZO-1 is expressed in multiple tissues throughout development.
(A) There are 14 mRNA isoforms encoded by pezo-1. Isoforms i-l encode the six short forms of pezo-1 (red asterisks). The 5′−3′ orientation is right to left. (B–G) Both PEZO-1::mScarlet (magenta) and GFP::PEZO-1 (green) express in a variety of cell types, including pharyngeal neurons (panel [B], white arrows), pharyngeal-intestinal valve (C), male tail, including sensory rays (magenta), fan (green), cloaca/spicules (green) (D), vulva (E), intestinal cells (F) and seam cells (G). Scale bars are shown in each panel. The illustration in panel (A)was taken from WormBase (https://wormbase.org).
Figure 2 with 1 supplement
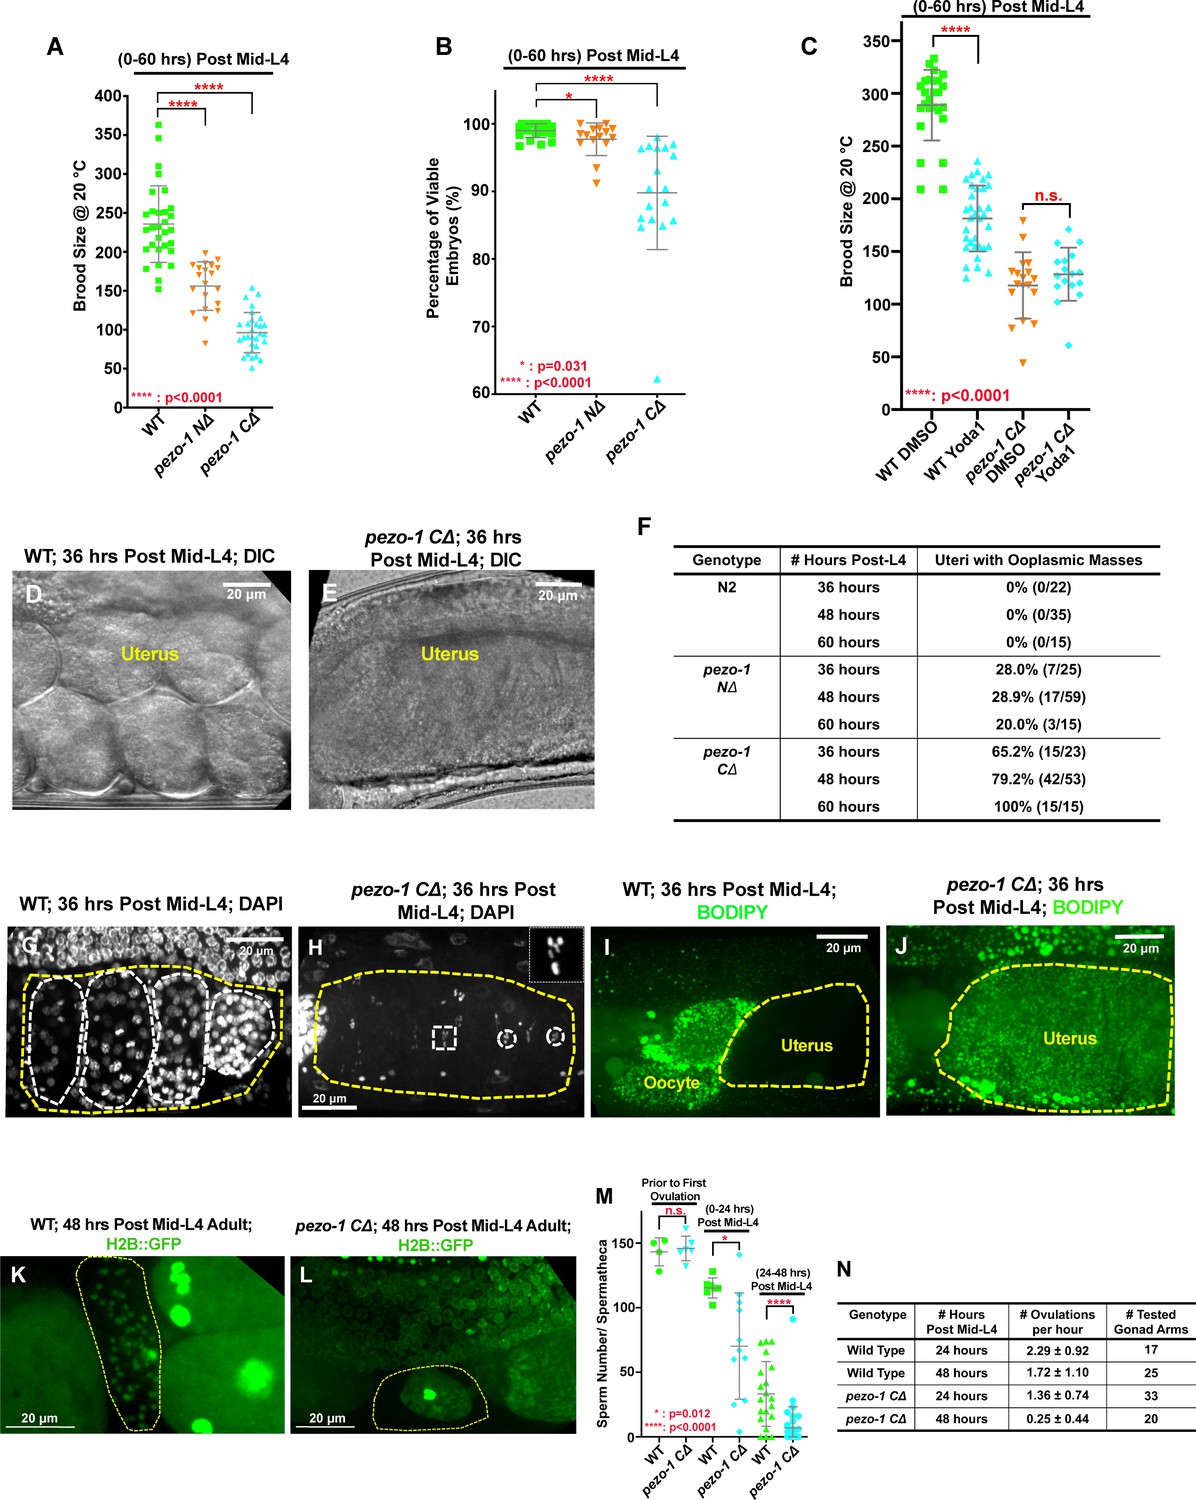
Deletions of the pezo-1 gene cause a reduction in brood size.
(A) Brood size was significantly reduced in both pezo-1 NΔ and pezo-1 CΔ animals when compared with wildtype, and this reduction was most evident in older adult animals. (B) The percentage of viable embryos was reduced in the pezo-1 CΔ animals. (C) Dietary supplementation of a PIEZO1-channel-specific activator Yoda1 in wildtype animals significantly reduced the brood size compared with control treatment, but brood size was not further reduced in pezo-1 C∆ when treated with Yoda1. (D, E) DIC images of the uteri of gravid adult animals. Wildtype animals had young embryos in their uteri (D), whereas only a large ooplasmic mass was observed in pezo-1 CΔ mutant uteri (E). (F) Quantification of the percentage of uteri with ooplasmic masses in wildtype and pezo-1 deletion mutants. N2 is the wildtype strain. (G, H) DAPI staining demonstrated that multicellular embryos (white circles in panel [G]) were present in the uteri of wildtype animals, whereas only oocyte meiotic chromosomes (white circles and rectangle) were observed in the uteri of pezo-1 CΔ mutants (panel [H]; inset in the top right white box shows an amplified image of the meiotic chromatin marked with a white rectangle). The yellow dotted lines indicate the boundaries of the uteri in panels (G) and (H). (I, J) Only unfertilized oocytes and newly fertilized zygotes are permeable to BODIPY (green) in wildtype (WT) animals (I), whereas staining was observed throughout the entire uterine mass (yellow circle in panel [J]) of pezo-1 CΔ animals. (K, L) An H2B::GFP transgene was crossed into our strains to visualize oocyte and sperm chromatin. (K) Sperm labeled by H2B::GFP (green cells in yellow circle) reside in the spermatheca (yellow circle) of Day 2 adults (48 hr post mid-L4). (L) Only oocyte debris (yellow circle) is left in the spermatheca of an age-matched pezo-1 CΔ mutant. (M) Quantification of sperm counts in both wildtype and pezo-1 CΔ hermaphrodites at different time windows. (N) Quantification of the oocyte ovulation rate of wildtype and pezo-1 CΔ adults at different ages. The oocyte ovulation rate was significantly reduced in the older pezo-1 CΔ mutant adults. P-values: *, p=0.031 (B); *, p=0.012(M); ****, p<0.0001 (t-test).
-
Figure 2—source data 1
Quantification data describing brood size, the percentage of viable embryos and sperm counts of pezo-1 mutants compared with wild-type.
- https://cdn.elifesciences.org/articles/53603/elife-53603-fig2-data1-v3.xlsx
Figure 2—figure supplement 1

Verification of CRISPR/Cas9-generated deletions in pezo-1 knockout animals.
(A) Representative PCR gel from genotyping single animals for pezo-1 C∆ knockout candidates. A positive homozygous knockout line is labeled with a red asterisk. Three primers (two that flank the deletion and one internal) were used to test the homozygosity of candidate pezo-1 deletion animals. The amplicon size of a homozygous deletion with both flanking primers is 450-bp (labeled –/–). In the wild type, an 879-bp PCR product was able to be amplified by one flanking primer and the internal primer (labelled +/+). Heterozygous animals contain both of the PCR products (labeled +/–). (B) Schematic of the 14 mRNA isoforms and the position of the three deletion alleles used in this study and the isoforms that they should affect. The STOP-IN line is also shown as an insertion in the beginning of exon 27. The 5′−3′ orientation is right to left. (C) The full deletion allele and four other alleles generated for this study also had reduced brood sizes: the full deletion mutant pezo-1(av240), a N-terminal mutant pezo-1(av144), a C-terminal mutant pezo-1(av149), a stop-in mutant pezo-1(sy1199) and a small deletion allele pezo-1(sy1398) in isoforms I and J. (D) The reduction in brood size of pezo-1 deletion animals was enhanced when the animals were grown at 25°C. (E) Quantification of the percentage of uteri with ooplasmic masses in pezo-1(sy1199) and pezo-1(sy1398) mutants. P-values: ***, p=0.0003 (C); **, p=0.0021 (D); ***, p=0.0002 (D); ****, p<0.0001 (t-test). The illustration in panel (B) was taken from WormBase (https://wormbase.org).
-
Figure 2—figure supplement 1—source data 1
Quantification data describing brood size and the percentage of viable embryos of pezo-1 mutants compared with wild-type.
- https://cdn.elifesciences.org/articles/53603/elife-53603-fig2-figsupp1-data1-v3.xlsx
Figure 3
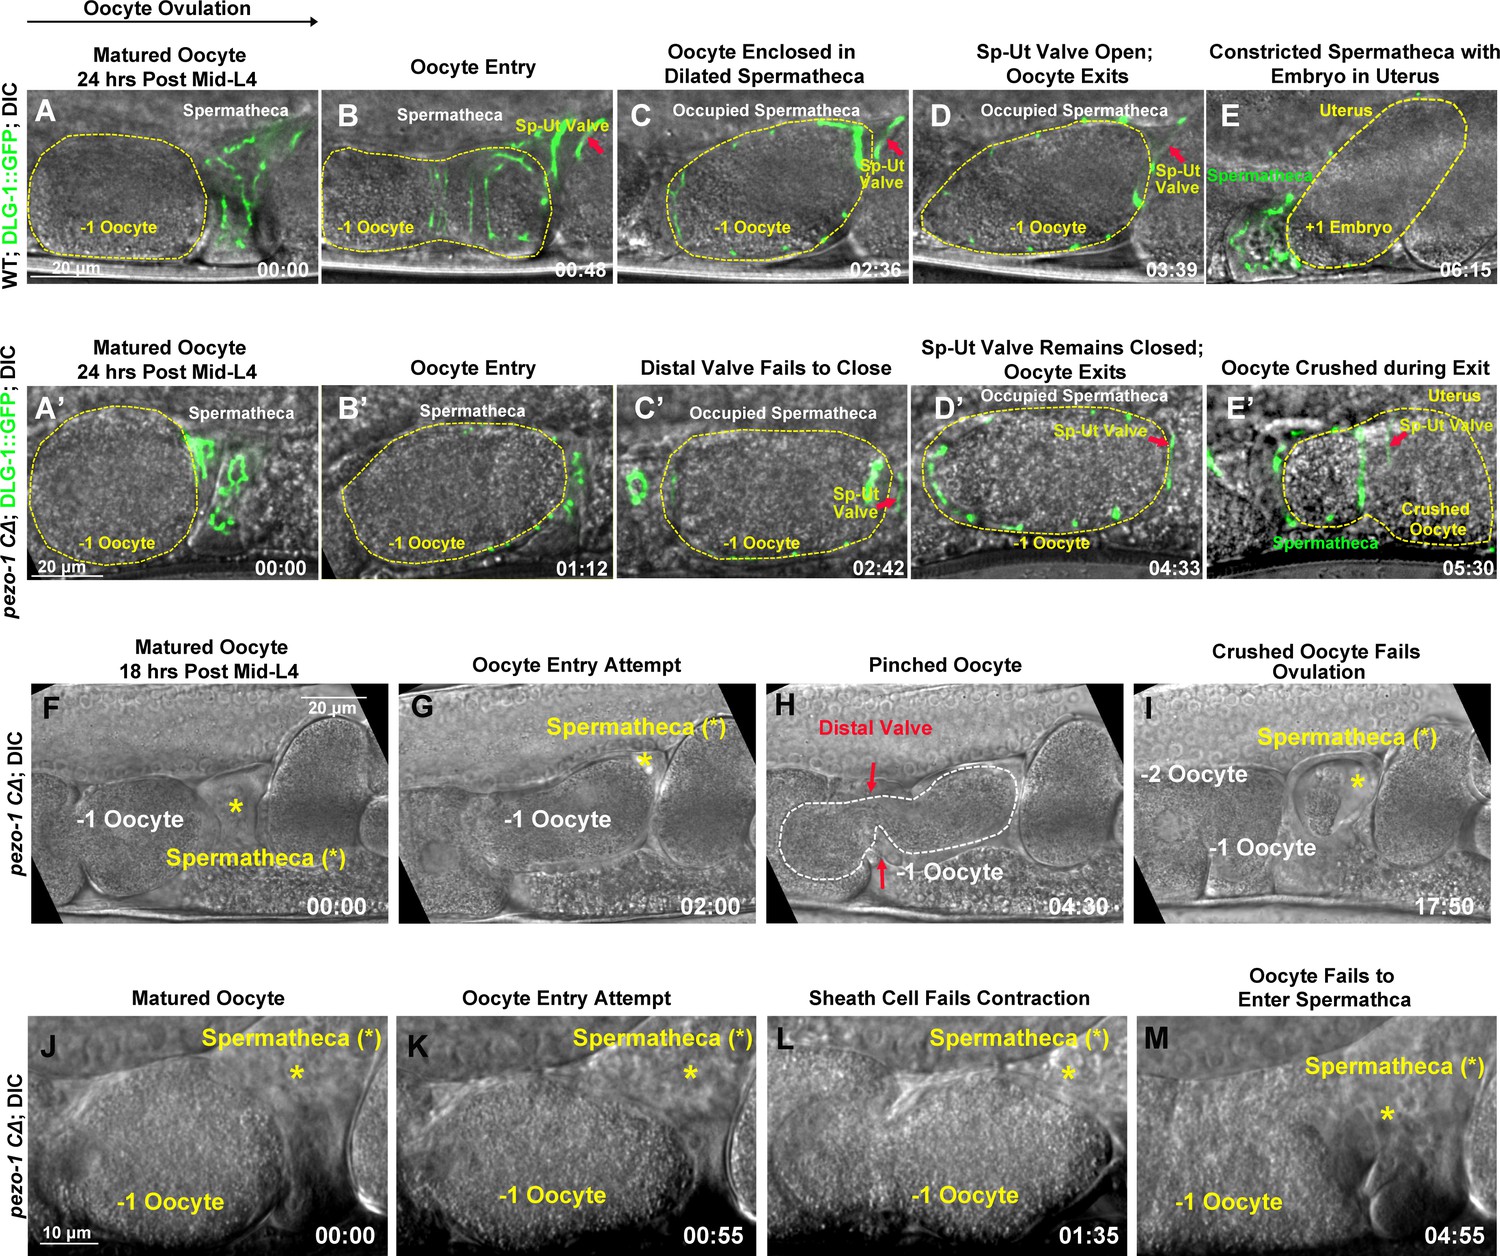
PEZO-1 mutants exhibit severe ovulation defects.
(A–E) Ovulation in wildtype animals. (A, B) Ovulation is initiated by oocyte (yellow dotted circle) entry into the spermatheca, which was labelled by the apical junctional marker DLG-1::GFP (green). (C) Fertilization occurs in the occupied spermatheca (yellow dotted circle). (D, E) After fertilization, the sp-ut valve (red arrows) opened immediately to allow the newly fertilized zygote (yellow dotted circle) to exit the spermatheca and enter the uterus. (A′–E′) Abnormal ovulation was observed in pezo-1 CΔ animals. Control of the spermathecal valves was aberrant (C′–E′) during ovulation and the DLG-1::GFP labelled sp-ut valve (red arrow) never fully opened; the oocyte was crushed as it was expelled (E′). (F–M) Two examples of ovulation defects observed in the pezo-1 C∆ mutants. (F–I) The ovulating oocyte (white dotted circle) was pinched off by the spermathecal distal valve (red arrows in panel [H]). This oocyte never exited into the uterus. (J–M) pezo-1 CΔ oocytes frequently failed to enter the spermatheca and were retained in the oviduct (M). The black arrow above panel (A) shows the direction of embryo travel through the spermatheca from left to right. All four image time series follow this same left to right orientation. The timing of each step is labeled on the bottom right in minutes and seconds. Scale bars are shown in each panel.
-
Figure 3—source data 1
Number of independent samples were collected for imaging ovulation defects in pezo-1 mutants.
- https://cdn.elifesciences.org/articles/53603/elife-53603-fig3-data1-v3.xlsx
Figure 4
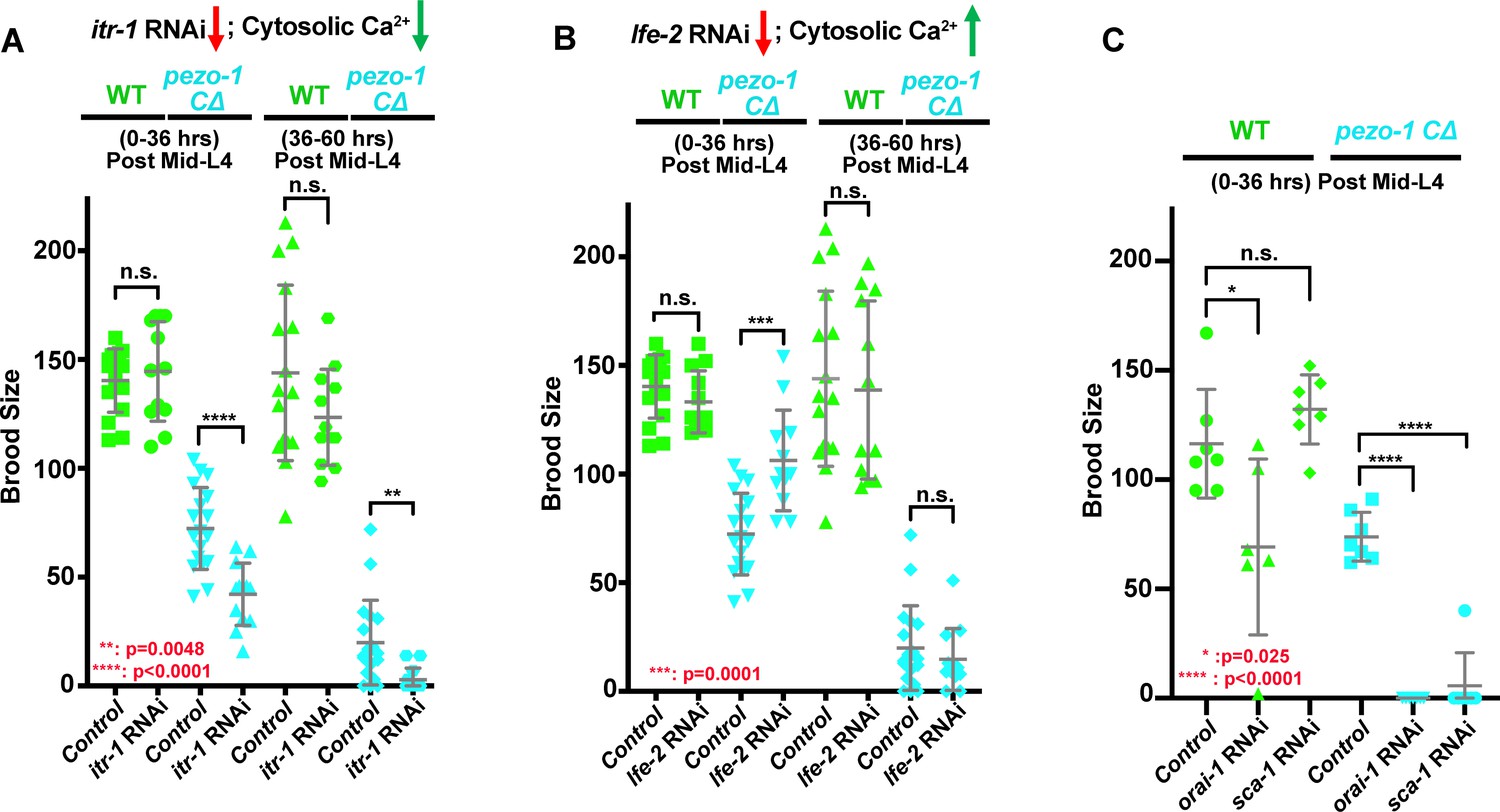
pezo-1 mutants show genetic interactions with cytosolic Ca2+ regulators.
(A) itr-1 (RNAi) reduced the brood size in pezo-1 CΔ animals. (B) By contrast, lfe-2 (RNAi) slightly rescued the smaller brood size in pezo-1 CΔ animals. (C) Depletion of both orai-1 and sca-1 by RNAi also enhanced the brood size reduction of pezo-1 CΔ mutants. P-values: *, p=0.025 (C); **, p=0.0048 (A); ***, p=0.0001 (B); ****, p<0.0001 (t-test).
-
Figure 4—source data 1
Quantification of brood size for genetic interaction of pezo-1 mutants with RNAi depletion of calcium regulators.
- https://cdn.elifesciences.org/articles/53603/elife-53603-fig4-data1-v3.xlsx
Figure 5 with 1 supplement
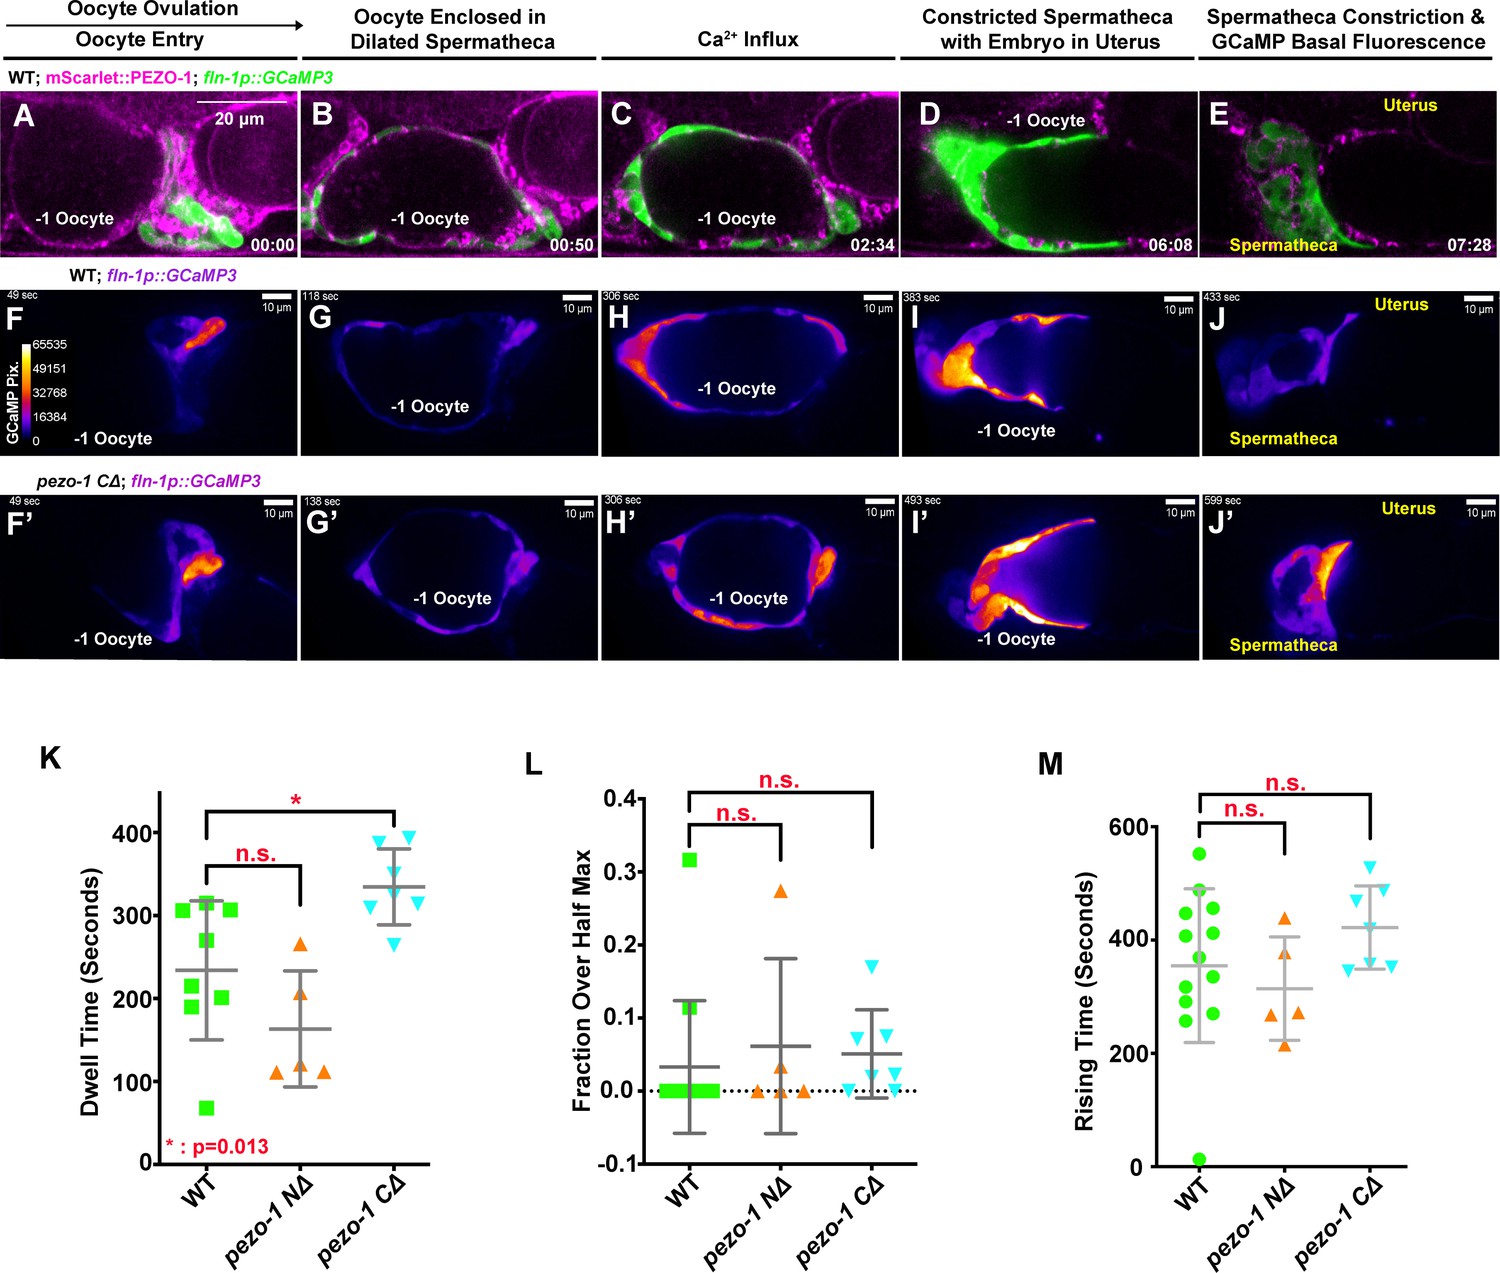
PEZO-1 mutants show normal GCaMP3 fluorescence during ovulation.
(A–E) mScarlet::PEZO-1 colocalizes with GCaMP3, which is driven by a spermatheca-specific promoter. These images represent the third ovulation for this spermatheca. (F–J′) Time series frames from GCaMP3 recordings in the third ovulation of both wildtype animals (F–J) and pezo-1 C∆ animals (F′–J′). Ca2+ influx was quantified during ovulation and fertilization, as indicated by the intensity of GCaMP3 pixels (colored bar in panel [F]). (F, F′) Oocyte entry into the spermatheca in wildtype and pezo-1 CΔ. (G, G′) Oocytes in the spermatheca, (H, H′) Ca2+ influx during fertilization, (I, I′) intense Ca2+ influx as the sp-ut valve closes to push newly fertilized zygote into the uterus, and (J, J′) the return to basal levels as the spermatheca prepares for the next ovulation. (K) Dwell time is a tissue function metric calculated as the time the oocyte resides in the spermatheca from the closing of the distal valve to the opening of the sp-ut valve. (L, M) Calcium signaling metrics: fraction over half max (L) and rising time (M) in pezo-1 mutants showed normal calcium levels during ovulation compared with wild type (Bouffard et al., 2019). The black arrow above panel (A) shows the direction of embryo travel through the spermatheca from left to right. All three image time series follow this same left to right orientation. The timing of each step is labeled in the bottom right in minutes and seconds (A–E), or on the top left in seconds (F–J′). Scale bars are shown in each panel.
-
Figure 5—source data 1
Quantification of calcium metrics in pezo-1 mutants and wild-type.
- https://cdn.elifesciences.org/articles/53603/elife-53603-fig5-data1-v3.xlsx
Figure 5—figure supplement 1
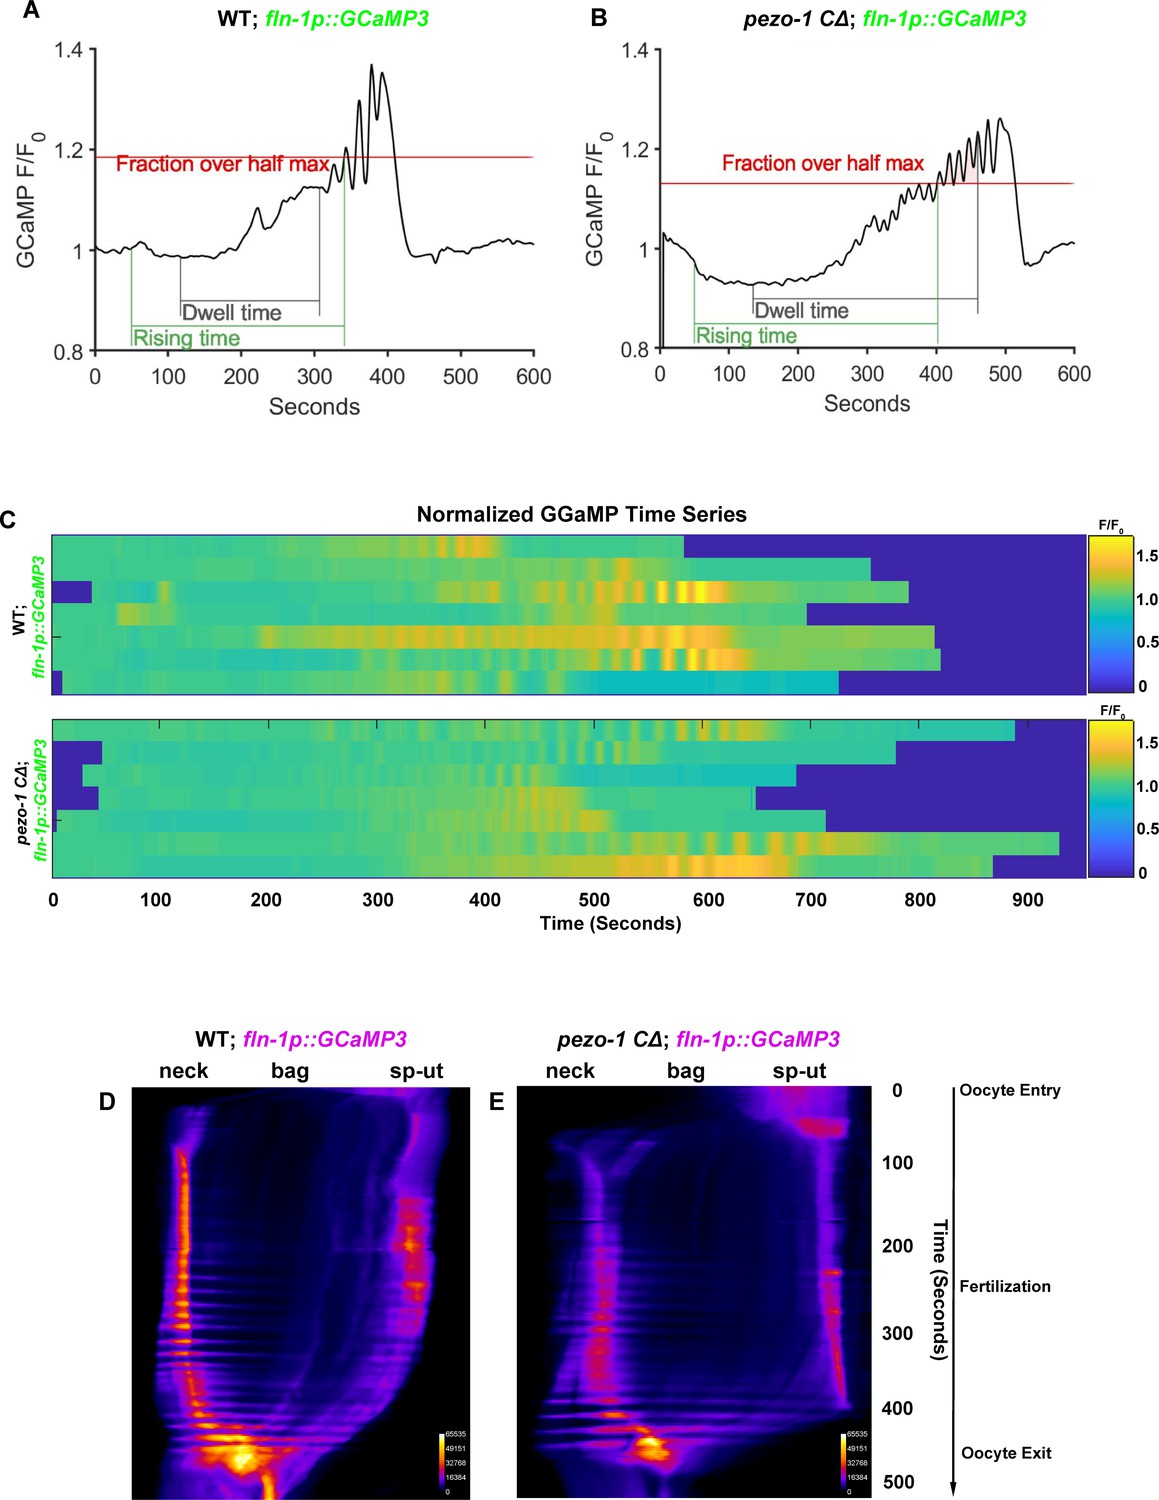
Normal calcium signaling was observed in the spermathecal cells in pezo-1 mutants.
(A, B) GCaMP3 time series of normalized average pixel intensity from a single oocyte transit recording over the same spatial frame and time. (C) Heat map of GCaMP3 normalized average pixel intensity (F/F0) versus time series during ovulation from seven oocyte transit recordings in both wildtype and pezo-1 CΔ mutants. Color bar represents the gradient of the normalized average pixel intensity (F/F0). (D, E) Representative kymograms of GCaMP3 in both wildtype and pezo-1 CΔ mutants. Color bar represents the gradient of the fluorescence intensity.
Figure 6 with 1 supplement
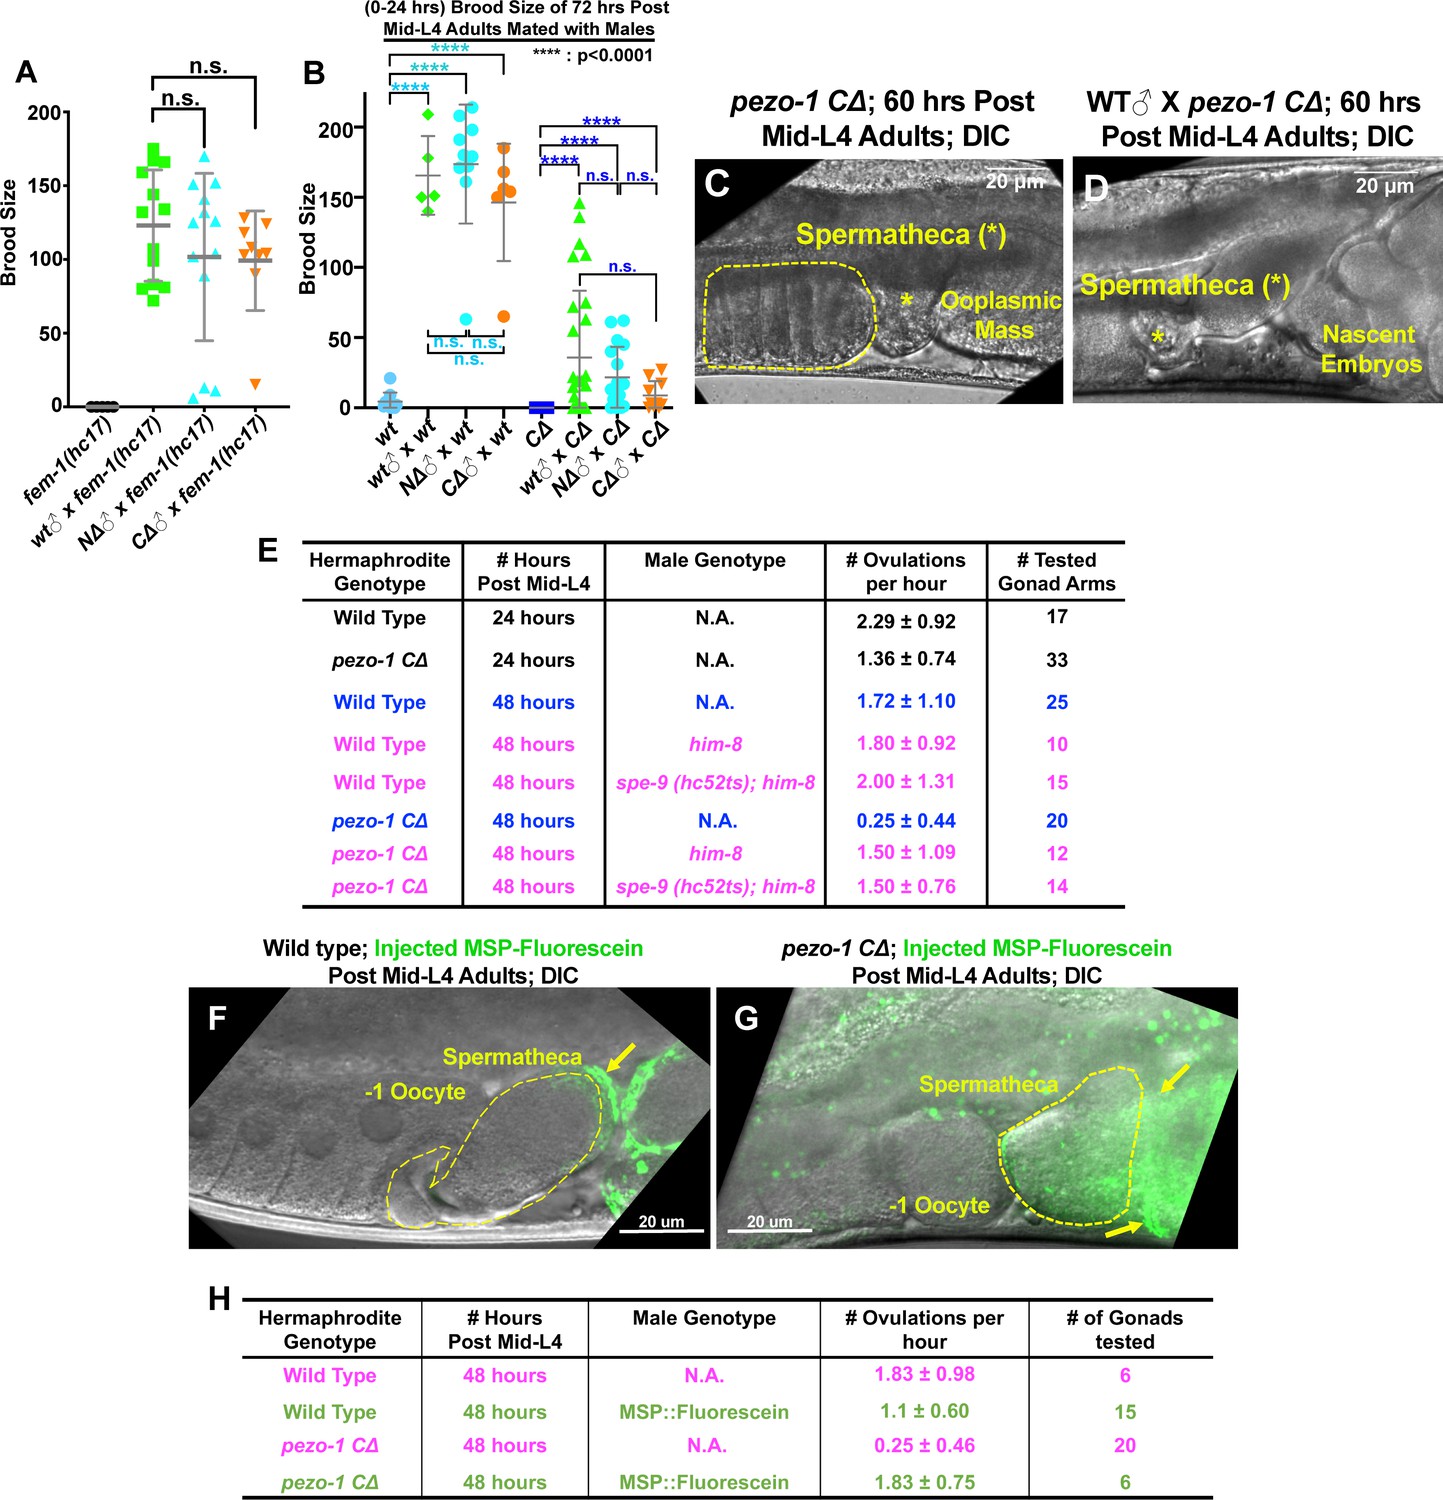
Male sperm rescue the ovulation defects in pezo-1 mutants.
(A) Both pezo-1 C∆ and N∆ males are fertile and sire progeny when mated with fem-1(hc17ts) mutants (essentially female animals). (B) Mating with male sperm rescued fertility in Day 3 pezo-1 CΔ adults (72 hr post mid-L4). (C) The oocyte maturation and ovulation rate are very low in Day 3 pezo-1 CΔ mutant adults, and oocytes accumulate in the proximal gonad arm (yellow dashed circle). (D) By contrast, the ovulation rates are recovered to high levels after mating with wildtype male sperm. Newly fertilized embryos pushed the ooplasmic mass out of the uterus. Yellow asterisks indicate the spermatheca (C, D). (E) Quantification of the oocyte ovulation rate of wildtype and pezo-1 CΔ adults at different ages. him-8(e1489) and spe-9 (hc52ts) sperm significantly rescue ovulation rates in pezo-1 CΔ hermaphrodites, even though they do not fertilize oocytes. (F, G) Injection of purified fluorescein-tagged MSP in the uteri of both wildtype and pezo-1 C∆ aged adults. Fluorescein-tagged MSP moved through the entire uterus to localize next to the spermatheca. The yellow dotted circle represents the spermatheca. The yellow arrows indicate the fluorescein-tagged MSP (green) localized next to the spermatheca. (H) Quantification of the oocyte ovulation rate of wildtype and pezo-1 C∆ adults without or without injections of fluorescein-tagged MSP. P-values: ****, p<0.0001 (t-test). Scale bars are shown in panels (C, D, F, G).
-
Figure 6—source data 1
Quantification of sire progeny in different mating assays.
- https://cdn.elifesciences.org/articles/53603/elife-53603-fig6-data1-v3.xlsx
Figure 6—figure supplement 1
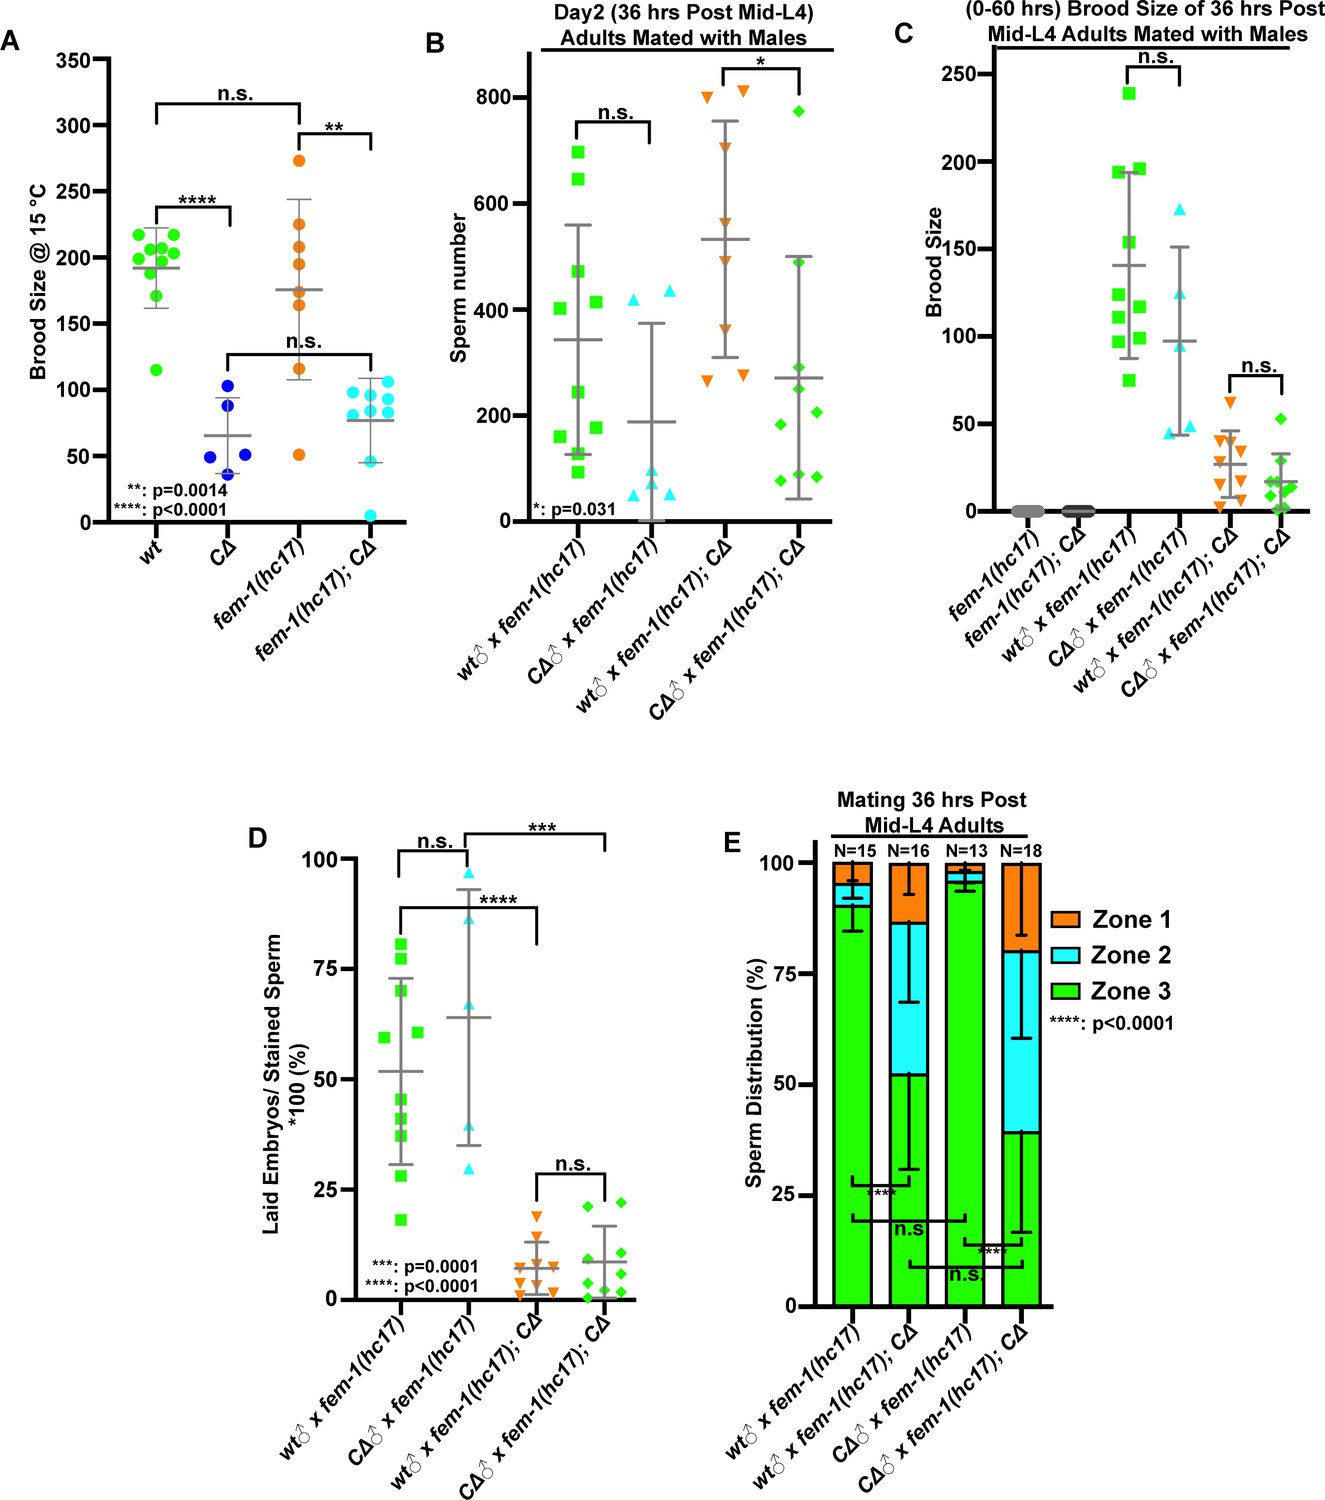
Male sperm rescue the fecundity in pezo-1 CΔ female.
(A) Brood size was significantly reduced in pezo-1 CΔ females when compared with fem-1(hc17) females only at permissive temperature (15°C). (B) Quantification of Mito-tracker-stained male sperm in the female uteri after mating for 30 min. (C) Both pezo-1 C∆ and wildtype males sire progeny when mated with fem-1(hc17ts) mutants (essentially female animals) and pezo-1 CΔ females at non-permissive temperature (25°C). However, the number of cross progeny was greatly reduced in the pezo-1 C∆ female. (D) Fertilization ratio [(laid embryos/stained sperm) *100%] in different females. (E) Quantification of sperm distribution in the pezo-1 C∆ female after mating for 30 min. P-values: *, p=0.031 (B); **, p=0.0014 (A); ***, p=0.0001 (D); ****, p<0.0001 (A, D, E) (t-test).
-
Figure 6—figure supplement 1—source data 1
Quantification of sire progeny and sperm count in different mating assays.
- https://cdn.elifesciences.org/articles/53603/elife-53603-fig6-figsupp1-data1-v3.xlsx
Figure 7

Sperm guidance and navigation is disrupted in pezo-1 mutants.
(A) To quantify sperm migration, this illustration indicates the three zones that were scored for sperm distribution. Zone 3 is the spermatheca region and the space containing the +1 fertilized embryo (yellow dotted circles in panels (B, D, F, H), whereas Zone 1 is the area closest to the vulva. Sperm distribution is measured 1 hr after males were removed from the mating plate. (B–I) The distribution of fluorescent male sperm labeled with MitoTracker in the three zones in both wildtype and pezo-1 mutants 1 hr after the males were removed. Yellow asterisks indicate the vulva (C, E, G, I). Scale bars are indicated in each panel. (J) Quantification of sperm distribution values. The numbers of the scored uteri are shown above each of the bars. P-values: ****, p<0.0001 (t-test).
-
Figure 7—source data 1
Quantification of sperm count in sperm distribution assays.
- https://cdn.elifesciences.org/articles/53603/elife-53603-fig7-data1-v3.xlsx
Figure 8 with 3 supplements
Tissue-specific degradation of PEZO-1 causes a reduced brood size and sperm navigational defects.
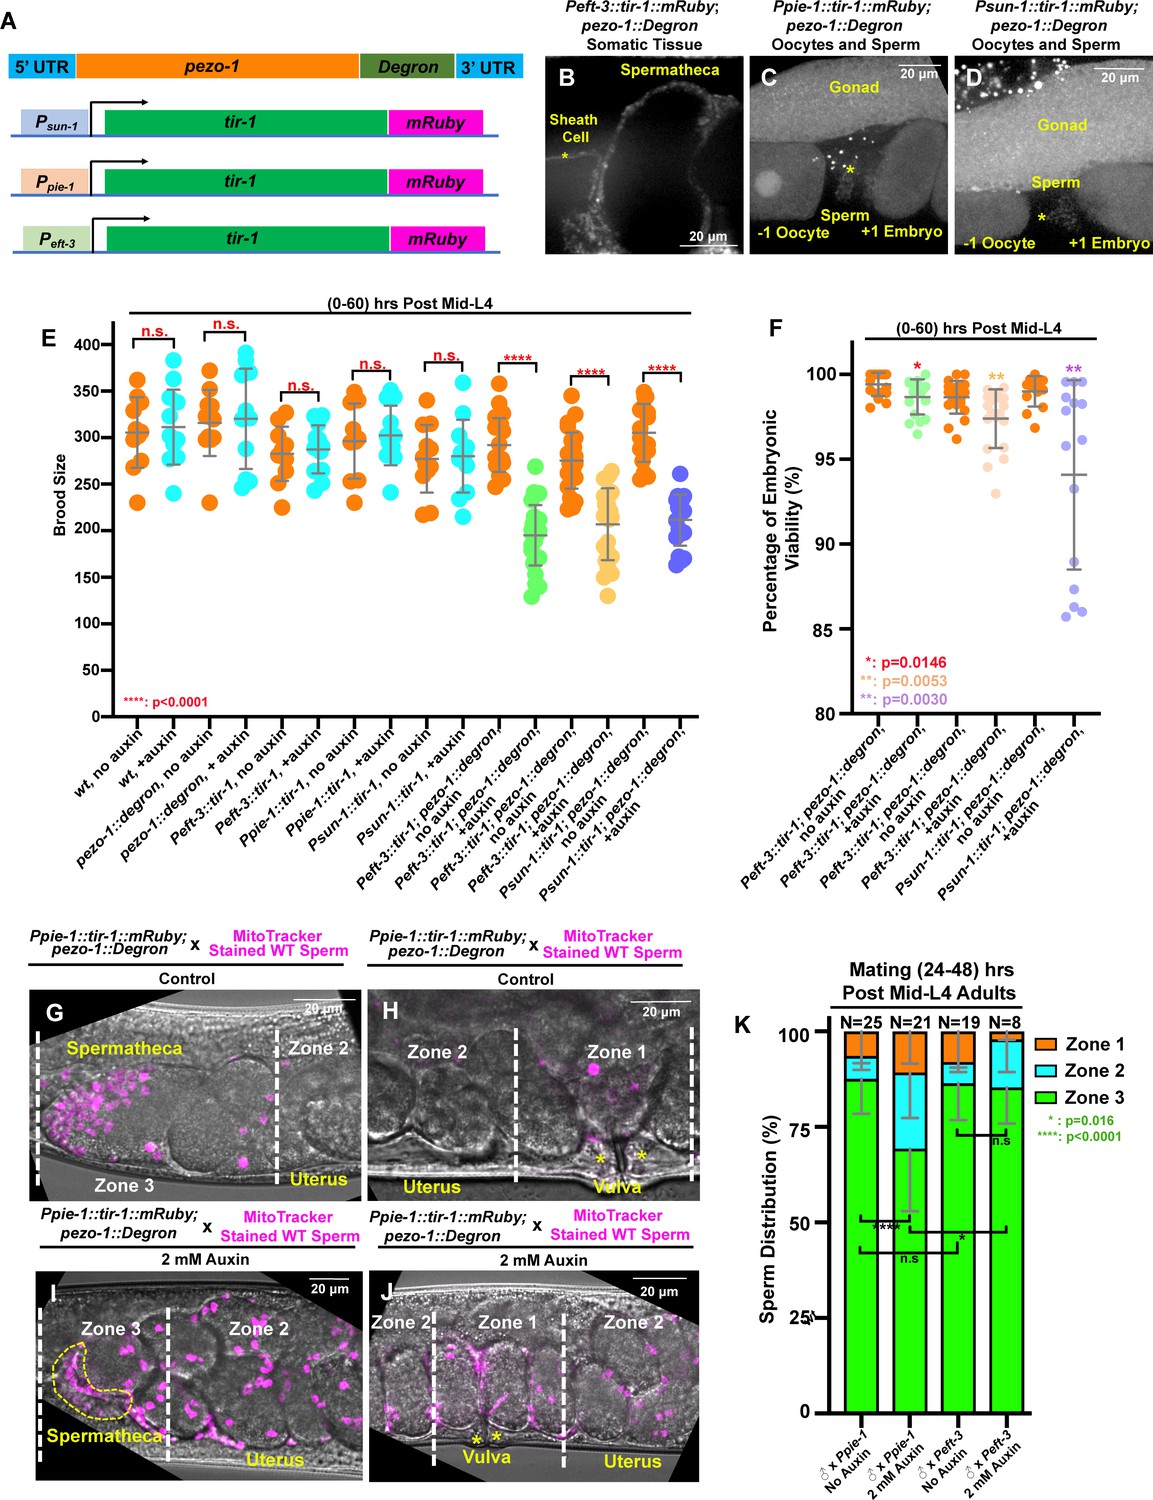
(A) Schematic of the auxin-inducible degradation (AID) system. A degron tag was inserted at the 3′ end of the pezo-1 coding sequence using CRISPR/Cas9-mediated editing. (B) The eft-3 promoter was used to drive TIR-1 expression in most or all somatic tissues, including the spermatheca and the sheath cells. TIR-1::mRuby driven by the germline-specific promoters sun-1 and pie-1 is strongly expressed in the germline and oocytes (C, D), and weakly expressed in the sperm (asterisks in panels [C, D]). (E, F) Brood size and embryonic viability were reduced in all degron strains when animals were treated with 2 mM auxin. Data are presented as the mean ± standard error from at least two independent experiments. (G–J) Sperm distribution 1 hr after the removal of males from mating plates. The germline-specific PEZO-1::Degron hermaphrodites were mated with wildtype males for 30 min. The representative images show that pezo-1 degradation in the germ line influences sperm distribution from the vulva (zone 1) to the spermatheca (zone 3). (K) Quantification of sperm distribution in the PEZO-1::Degron strains grown on plates with (+) or without (–) 2 mM auxin. P-values: *, p=0.0146 (F); *. p=0.016 (K); **, p=0.0030 (F); **, p=0.0053 (F); ****, p<0.0001 (E, K) (t-test). Scale bars are shown in each micrograph.
-
Figure 8—source data 1
Quantification of brood size and sperm counts in each AID strain.
- https://cdn.elifesciences.org/articles/53603/elife-53603-fig8-data1-v3.xlsx
Figure 8—figure supplement 1

Expression pattern of tir-1::mRuby in reproductive tissues.
(A–A′′) The eft-3 promoter was used to drive TIR-1 expression in most or all somatic tissues, including the spermatheca but not in the sperm [dotted circles in lower part of panel (A)]. Strong GFP autofluorescence is observed in the sperm cytosol (inserts from panels [A, A′′]). (B–C′′) TIR-1::mRuby driven by the germline specific promoters sun-1 and pie-1 is strongly expressed in the germline and oocytes (B–B′, C–C′) and weakly expressed in the sperm (dotted circles in the inserts under panels [B and C]).
Figure 8—figure supplement 2

Tissue-specific degradation of PEZO-1 displays a reduced GFP::PEZO-1 fluorescence in each tissue expressing tir-1::mRuby.
(A–A′′) GFP::PEZO-1::Degron localized to reproductive tissues, such as the plasma membrane of the germline cells, oocyte, somatic sheath cells (yellow arrow, A, A′′), spermatheca (yellow arrow, A, A′′) and sperm. (B–B′′) TIR-1::mRuby driven by the somatic-tissue-specific promoter eft-3 is strongly expressed in the somatic sheath cells and spermatheca. (C–C′′, H–I) Fluorescent signals of GFP::PEZO-1::Degron at spermatheca and somatic sheath cells are significantly reduced when animals were treated with 2 mM auxin. However, fluorescent signals of GFP::PEZO-1::Degron at germline cells, oocyte and sperm are not affected. (D–E′′) TIR-1::mRuby driven by the germline specific promoters sun-1 and pie-1 is strongly expressed in the germline and oocytes (D′, E′, F, G′). Fluorescent signals of GFP::PEZO-1::Degron in germline cells and oocytes were significantly reduced (D–G, D′′–G′′, H–I), whereas the expression level of GFP::PEZO-1::Degron in somatic tissues is not affected (D–G, D′′–G′′, H–I). (H–I) Quantification of the fluorescent signals of GFP::PEZO-1::Degron under the different conditions. P-values: ****, p<0.0001 (t-test).
-
Figure 8—figure supplement 2—source data 1
Quantification of the fluorescent intensity of GFP-PEZO-1::Degron at different conditions.
- https://cdn.elifesciences.org/articles/53603/elife-53603-fig8-figsupp2-data1-v3.xlsx
Figure 8—figure supplement 3
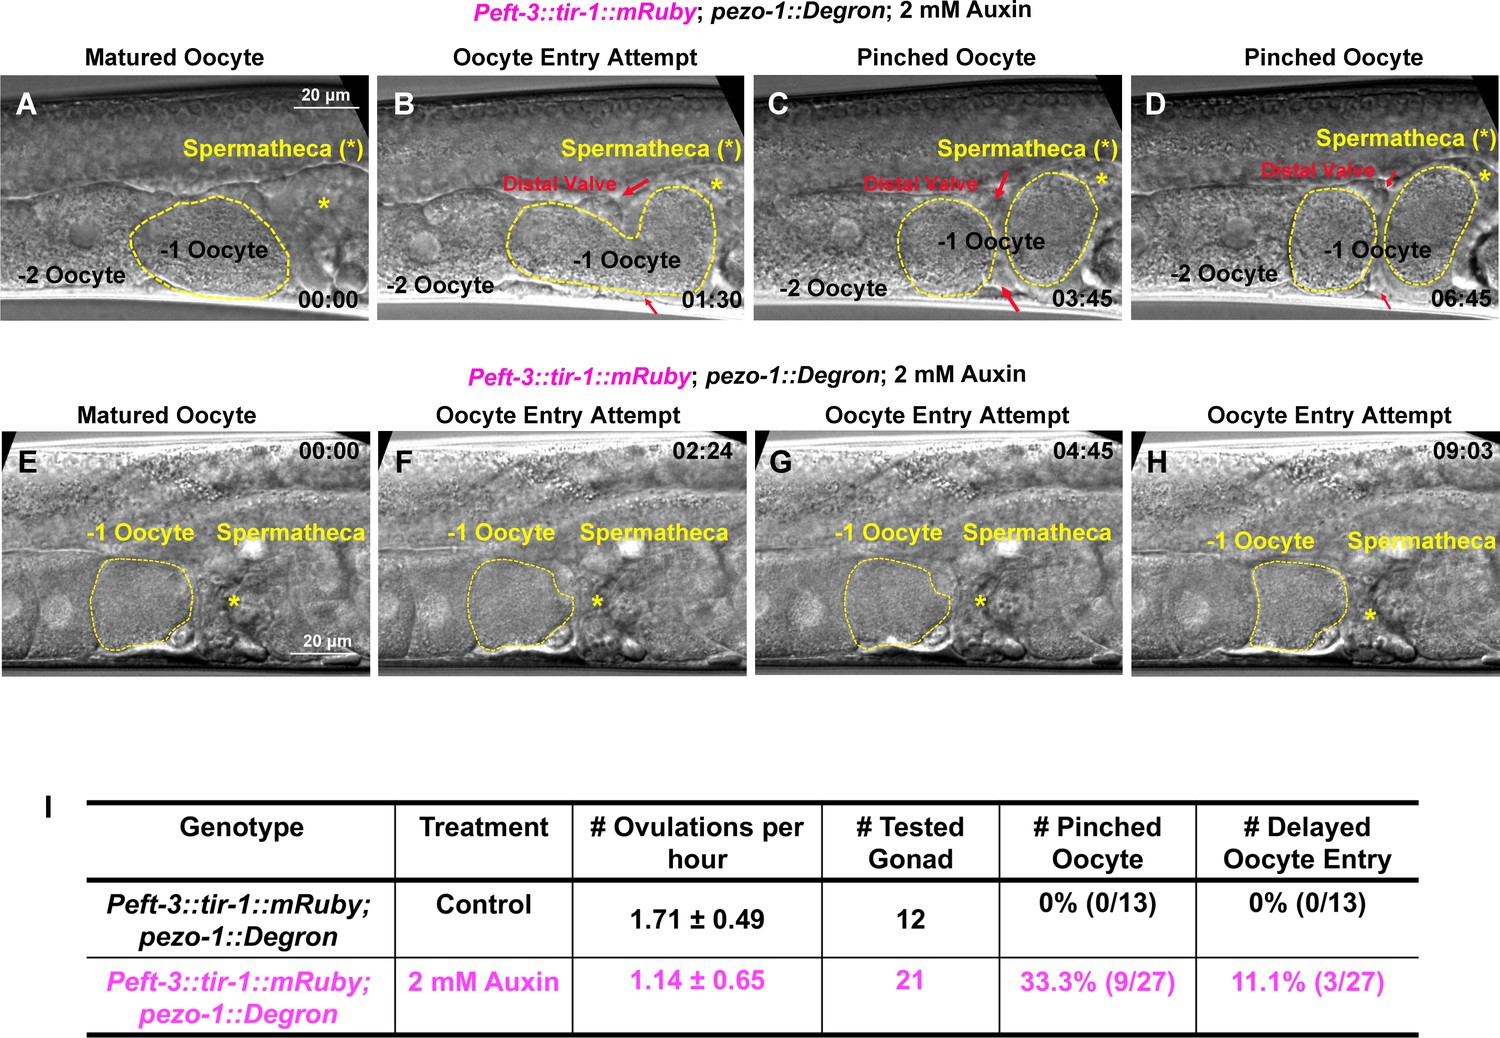
Somatic-tissue specific degradation of PEZO-1 causes severe ovulation defects.
(A–H) Abnormal ovulations were observed in the somatic-tissue-specific PEZO-1::Degron animals. Two different ovulation events are shown. (A, E) Ovulation initiated by oocyte (yellow dotted circle) entry into the spermatheca. The spermathecal distal valve (red arrows) was defective (B, C, E–H) and either pinched off the oocyte when it attempted to enter the spermatheca (B–D) or failed to open and block/delayed the entry of the oocyte into the spermatheca (yellow asterisks) (E–H). The timing of each step is labeled in each panel in minutes and seconds. (I) Quantification of the oocyte ovulation rate and ovulation defects in the Peft-3::tir-1; pezo-1::Degron animals with or without 2 mM auxin. Scale bars are indicated in panels (A–H).
Figure 9
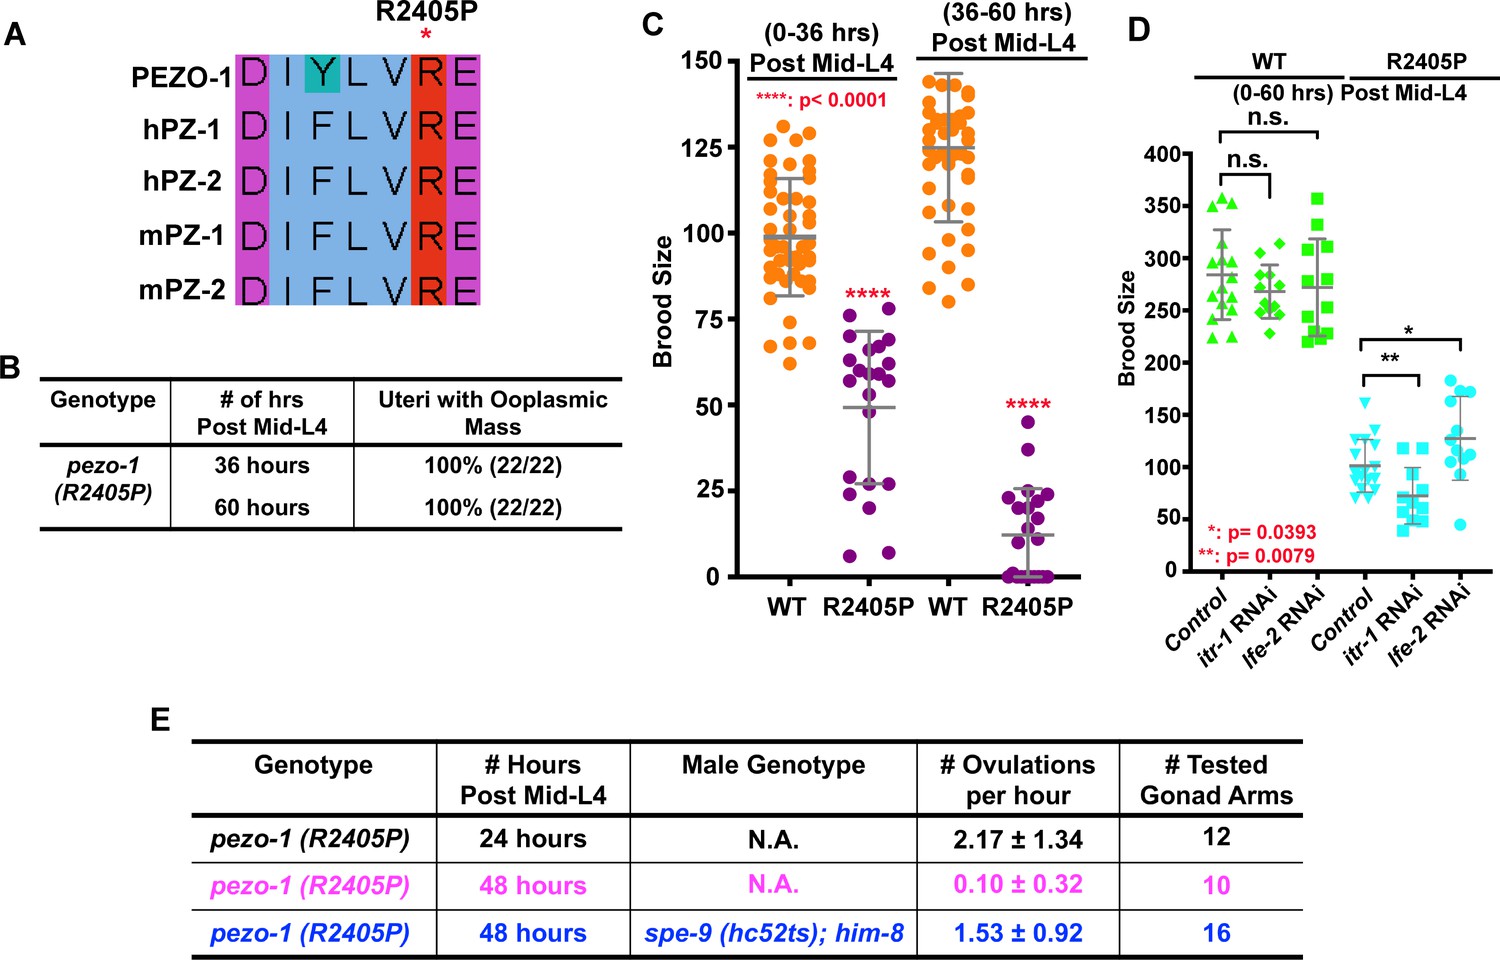
The PIEZO1 disease allele causes severe brood size reduction in C. elegans.
(A) Sequence alignment showing arginine 2405 (R2405) in C. elegans PEZO-1 is highly conserved with human and mouse PIEZO1 and PIEZO2. (B) A conserved patient-specific allele, pezo-1(R2405P), was generated and causes uterine ooplasmic masses and (C) a severe reduction in brood size. (D) itr-1(RNAi) enhanced the brood size reduction of pezo-1(R2405P) mutants, while lfe-2(RNAi) slightly rescued the reduced brood size. (E) spe-9(hc52ts) sperm rescued the very low ovulation rate in pezo-1(R2405P) hermaphrodites. P-values: *, p=0.0393 (D); **, p=0.0079 (D); ****, p<0.0001 (C) (t-test).
-
Figure 9—source data 1
Quantification of brood size in mutants for the patient-specific allele pezo-1(R2405P) and the genetic interaction of pezo-1(R2405P) with the RNAi depletion of calcium regulators.
- https://cdn.elifesciences.org/articles/53603/elife-53603-fig9-data1-v3.xlsx
Figure 10
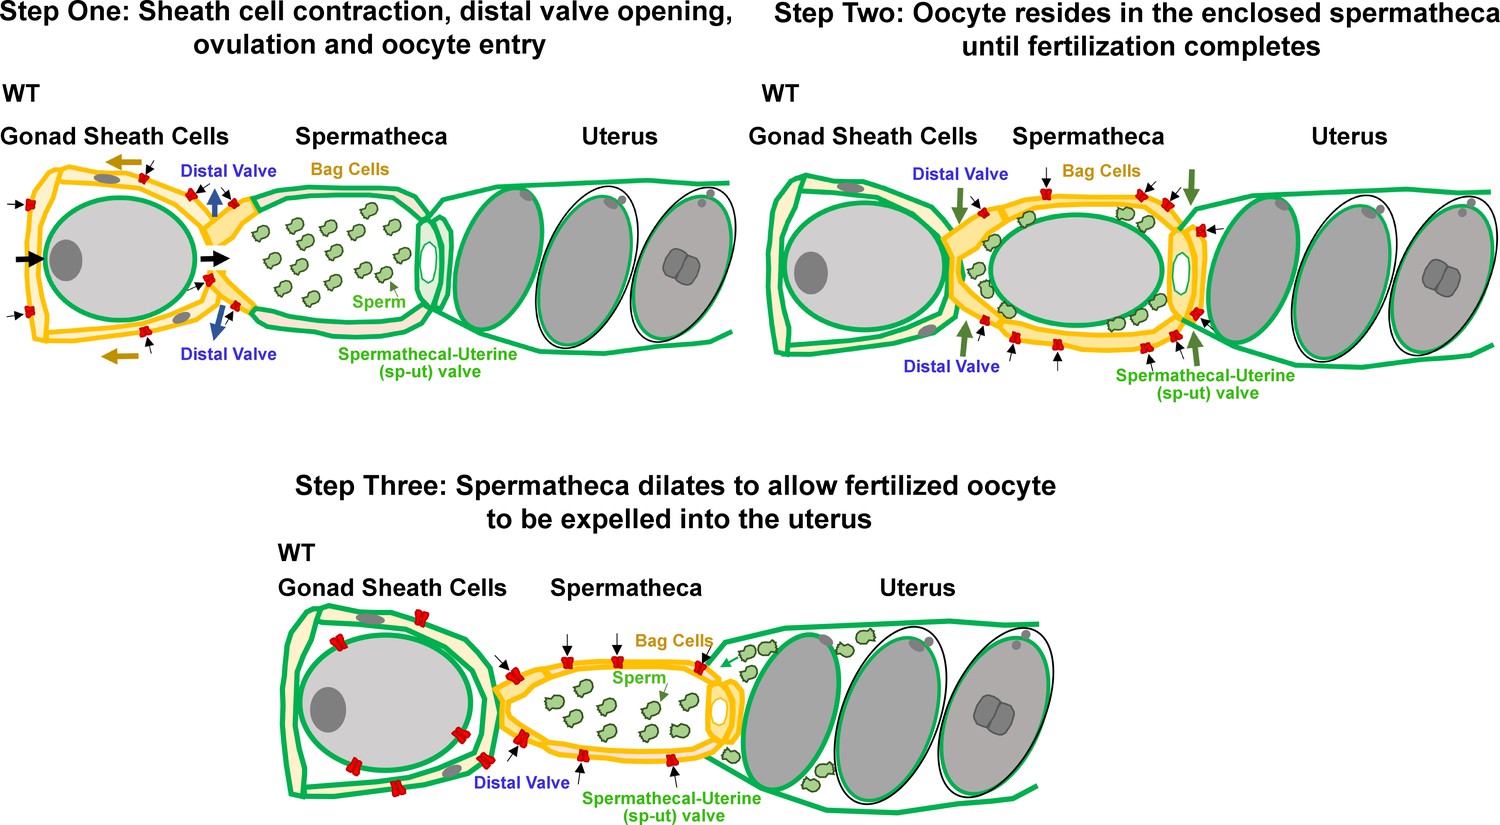
Working model for PEZO-1 during ovulation.
Step One: PEZO-1 regulates somatic sheath cells and the spermathecal distal valve to push the oocyte into the spermatheca. Once a matured oocyte is ready for ovulation, PEZO-1 (red trapezoids) on the somatic sheath cells (yellow) triggers the contraction of the sheath to push the oocyte into the dilating spermatheca, through the distal valve. Meanwhile, the activated PEZO-1 (red trapezoids) on the distal valve (yellow) keeps the valve open and allows oocyte entry the spermatheca (green). Step Two: during fertilization, the PEZO-1 (red trapezoids) coordinates both distal (yellow) and spermathecal-uterine valves (yellow) to remain closed for 3–5 min. Step Three: After fertilization, PEZO-1 (red trapezoids) is activated on the spermathecal bag cells (yellow) and the sp-ut valve (yellow) to trigger a series of mechanical events (including spermathecal contractions and sp-ut valve opening) to expel the fertilized oocyte into the uterus (green). After oocyte entry into the uterus, we speculate that the PEZO-1 (red trapezoids) on the oocyte (far left) also functions to attract the sperm (green cells) back to the spermatheca. The precise mechanism of how PEZO-1 regulates sperm attraction remains unknown. Dysfunction of PEZO-1 causes the oocytes to be crushed as they are pushed into (Step 1) and expelled from the spermatheca (Step 3). The yellow represents the tissues that are under mechanical tension at each step during ovulation. PEZO-1 probably functions at the plasma membrane to sense the mechanical stimuli and to trigger intracellular signaling. The black arrows indicate the direction of extracellular cation influx when PEZO-1 channels are activated.
Videos
Video 1
PEZO-1 expression pattern during ovulation.
Ovulation imaged in the genome-edited animals expressing GFP::PEZO-1 (green). The yellow arrow in the right panel indicates GFP::PEZO-1 expression on the spermathecal valves. White arrows in the right panel indicate GFP::PEZO-1 expression on the bag cells. After fertilization, GFP::PEZO-1-labeled sperm crawled back to the spermatheca. The left panel shows the merged channel of DIC (grey) with GFP (green). The right panel indicates the GFP (green) channel only. Images are single z planes taken every 2 s. Timing is indicated in the lower right panel. Playback rate is 15 frames/second. A scale bar is shown in the left panel.
Video 2
Crushed oocyte phenotype frequently occurs in the pezo-1 CΔ mutant.
Time-lapse video recording showing a wildtype oocyte (top panel) entering into the spermatheca and completing fertilization in 5 min. The constricted spermatheca smoothly expels the oocyte into the uterus. White arrows in the top panel indicate an opening spermathecal valve. In the bottom panel, the pezo-1 CΔ oocyte successfully enters the spermatheca, but the oocyte is crushed by the sp-ut valve and the ooplasmic debris is observed in the uterus. Yellow arrows in the bottom panel indicate the spermathecal valve. Images are single z planes taken every 2 s. Timing is indicated in lower right. Playback rate is 15 frames/second. Scale bars are indicated in each panel.
Video 3
The sp-ut valve fails to open during spermathecal contraction.
Time-lapse recordings on the left are of DIC and GFP. Recordings on right are of GFP alone. Oocyte entry occurs from the left at the 15 s mark. The spermatheca was labelled by the apical junctional marker DLG-1::GFP. In the wild type (top panels), the sp-ut valve (white arrow) opened immediately to allow the oocyte to be expelled into the uterus (on the right). In pezo-1 CΔ (bottom panels), however, the DLG-1::GFP labelled sp-ut valve (white arrow) never fully opened, the oocyte was crushed as it was expelled, and ooplasmic debris was pushed out into the uterus. Images are single z planes taken every 3 s. Timing is indicated in the bottom right corner. Playback rate is 15 frames/second. Scale bars are shown in each DIC panel.
Video 4
Spermatheca dilation is defective in pezo-1 mutants.
Time-lapse video recording (DIC). Oocyte entry occurs from the left at the 35-s mark. The distal valve was not able to close completely and the oocyte was pinched. One portion of the broken oocyte was left in the spermatheca, the other portion remains in the oviduct (white arrows, left panel). Images are single z planes taken every 2 s. Timing is indicated in the bottom left corner. Playback rate is 15 frames/second. A scale bar is shown in the bottom right corner.
Video 5
Sheath cell contraction is defective in pezo-1 mutants.
Time-lapse video recording (DIC). An oocyte fails to enter the spermatheca after a few attempts. Sheath cells fail to contract and push the oocyte into the spermatheca (on the right) and the oocyte moves left, back into the oviduct. Images are single z planes taken every 2 s. Timing is indicated in the bottom right corner. Playback rate is 15 frames/second. A scale bar is shown in the bottom left corner.
Video 6
mScarlet::PEZO-1 colocalizes with spermathecal-specific GCaMP3.
Example of the colocalization of mScarlet::PEZO-1 (magenta) with the Pfln-1::GCaMP3 transgene (green) in the spermathecal cells in a wildtype animal. The top left recording shows the merged channel of DIC (grey), mScarlet::PEZO-1 (magenta) and the Pfln-1::GCaMP3 transgene (green). The top right panel lacks the DIC channel. The bottom left recording shows just the mScarlet::PEZO-1 expression pattern during ovulation. The bottom right video indicates that Pfln-1::GCaMP3 only displays the changes in GCaMP3 intensity, which are indicative of calcium influx. Images were acquired in a single z plane every 2 s. Timing is indicated in the lower right panel. Playback rate is 30 frames/second. Scale bars are shown in each panel.
Video 7
Normal GCaMP3 influx was observed in pezo-1 mutants.
Examples of GCaMP3 recordings of embryo transits in wildtype (left panels) and pezo-1 CΔ (right panels) animals. Recordings were temporally aligned to the start of oocyte entry at 50 s. GCaMP3 normalized average pixel intensity (F/F0, top, Y-axis) versus GCaMP3 time (top, X-axis) generated from GCaMP3 recordings, with highlighted metrics shown on the top of the tracings. Dwell time is a tissue function metric that represents the duration from the closing of the distal valve to the opening of the sp-ut valve, rising time is a calcium signaling metric measuring the time from the opening of the distal valve to the first time point at which the time series reaches half maximum of GCaMP3 intensity, and fraction over half max is a calcium signaling metric, which measures the duration of the dwell time over the GCaMP3 half-maximal value divided by the total dwell time. Images were acquired in a single z plane every 1 s. Timing is indicated in the top left corners of the two lowerhe panels. Playback rate is 30 frames/second. Scale bars are shown in these panels.
Tables
Table 1
C. elegans strains list in the study.
| Strain | Genotype | |
|---|---|---|
| Figure 1 | AG404 | pezo-1(av142[mScarlet::pezo-1]) IV, CRISPR/Cas9 edit |
| AG408 | pezo-1(av146 [gfp::pezo-1]) IV, CRISPR/Cas9 edit | |
| AG483 | pezo-1(av182 [pezo-1::mScarlet]) IV, CRISPR/Cas9 edit | |
| Figure 2 | N2 | Bristol (wild-type) |
| AG406 | pezo-1(av144[N-∆]) IV, CRISPR/Cas9 edit, deletion of exon 1–13 and introns | |
| AG416 | pezo-1(av149[C-∆]) IV, CRISPR/Cas9 edit, deletion of exon 27–33 and introns | |
| AG530 | pezo-1(av149[C-∆]) IV; ruIs32 [pie-1p::GFP::H2B + unc-119(+)] III | |
| AZ212 | ruIs32 [pie-1p::GFP::H2B + unc-119(+)] III | |
| Figure 3 | N2 | Bristol (wild-type) |
| AG416 | pezo-1(av149) IV, CRISPR/Cas9 edit, deletion of exon 27–33 and introns | |
| LP598 | dlg-1(cp301[dlg-1::mNG-C1^3xFlag]) X, CRISPR/Cas9 edit | |
| AG491 | pezo-1(av149) IV; dlg-1(cp301[dlg-1::mNG-C1^3xFlag]) X | |
| Figure 4 | N2 | Bristol (wild-type) |
| AG416 | pezo-1(av149) IV, CRISPR/Cas9 edit, deletion of exon 27–33 and introns | |
| Figure 5 | UN1108 | xbIs1101 [fln-1p::GCaMP3; pRF4(rol-6D(su1006))] II |
| AG414 | pezo-1(av144) IV; xbIs1101 [fln-1p::GCaMP3; pRF4(rol-6D(su1006))] II | |
| AG415 | pezo-1(av149) IV; xbIs1101 [fln-1p::GCaMP3; pRF4(rol-6D(su1006))] II | |
| AG448 | pezo-1(av142 [mScarlet::pezo-1]) IV; xbIs1101 [fln-1p::GCaMP3; pRF4(rol-6D(su1006))] II | |
| Figure 6 | N2 | Bristol (wild-type) |
| AG406 | pezo-1(av144) IV, CRISPR/Cas9 edit, deletion of exon 1–13 and introns | |
| AG416 | pezo-1(av149) IV, CRISPR/Cas9 edit, deletion of exon 27–33 and introns | |
| AG531 | spe-9(hc52ts) I; him-8(e1489) IV | |
| BA17 | fem-1(hc17ts) IV | |
| CB1489 | him-8(e1489) IV | |
| Figure 7 | N2 | Bristol (wild-type) |
| AG416 | pezo-1(av149) IV, CRISPR/Cas9 edit, deletion of exon 27–33 and introns | |
| Figure 8 | N2 | Bristol (wild-type) |
| AG487 | pezo-1(av190 [pezo-1::degron]) IV, CRISPR/Cas9 edit | |
| AG493 | pezo-1(av190 [pezo-1::degron]) IV; ieSi65 [sun-1p::TIR1::sun-1 3’UTR + Cbr-unc-119(+)] II; unc-119(ed3) III | |
| AG494 | pezo-1(av190 [pezo-1::degron]) IV; ieSi57 [eft-3p::TIR1::mRuby::unc-54 3'UTR + Cbr-unc-119(+)] II | |
| AG495 | pezo-1(av190[pezo-1::degron]) IV; fxIs1[pie-1p::TIR1::mRuby] I | |
| AG564 | fxIs1[pie-1p::TIR1::mRuby] I | |
| AG565 | ieSi65 [sun-1p::TIR1::sun-1 3’UTR + Cbr-unc-119(+)] II; unc-119(ed3) III. | |
| AG566 | ieSi57 [eft-3p::TIR1::mRuby::unc-54 3'UTR + Cbr-unc-119(+)] II | |
| Figure 9 | N2 | Bristol (wild-type) |
| AG437 | pezo-1(av165[R2405P]) IV, CRISPR/Cas9 edit. | |
| AG531 | spe-9(hc52ts) I; him-8(e1489) IV | |
| Figure 1—figure supplement 1 | AG404 | pezo-1(av142 [mScarlet::pezo-1]) IV, CRISPR/Cas9 edit |
| AG408 | pezo-1(av146 [gfp::pezo-1]) IV, CRISPR/Cas9 edit | |
| AG483 | pezo-1(av182 [pezo-1::mScarlet]) IV, CRISPR/Cas9 edit | |
| Figure 2—figure supplement 1 | N2 | Bristol (wild-type) |
| AG406 | pezo-1(av144) IV, CRISPR/Cas9 edit, deletion of exon 1–13 and introns | |
| AG416 | pezo-1(av149) IV, CRISPR/Cas9 edit, deletion of exon 27–33 and introns | |
| PS8111 | pezo-1(sy1199) IV, CRISPR/Cas9 edit, Stop-cassette | |
| PS8546 | pezo-1(sy1398) IV, CRISPR/Cas9 edit, deletion of the first exon of isoforms i and j | |
| AG570 | pezo-1(av240) IV, CRISPR/Cas9 edit, deletion of full length of pezo-1 | |
| Figure 5—figure supplement 1 | UN1108 | xbIs1101 [fln-1p::GCaMP3; pRF4(rol-6D(su1006))] II |
| AG414 | pezo-1(av144) IV; xbIs1101 [fln-1p::GCaMP3; pRF4(rol-6D(su1006))] II | |
| AG415 | pezo-1(av149) IV; xbIs1101 [fln-1p::GCaMP3; pRF4(rol-6D(su1006))] II | |
| Figure 6—figure supplement 1 | AG494 | pezo-1(av190 [pezo-1::degron]) IV; ieSi57 [eft-3p::TIR1::mRuby::unc-54 3'UTR + Cbr-unc-119(+)] II |
| AG416 | pezo-1(av149) IV, CRISPR/Cas9 edit, deletion of exon 27–33 and introns | |
| BA17 | fem-1(hc17ts) IV | |
| AG571 | pezo-1(av149) IV; fem-1(hc17ts) IV | |
| Figure 8—figure supplement 1 | AG493 | pezo-1(av190 [pezo-1::degron]) IV; ieSi65 [sun-1p::TIR1::sun-1 3’UTR + Cbr-unc-119(+)] II; unc-119(ed3) III |
| AG494 | pezo-1(av190 [pezo-1::degron]) IV; ieSi57 [eft-3p::TIR1::mRuby::unc-54 3'UTR + Cbr-unc-119(+)] II | |
| AG495 | pezo-1(av190[pezo-1::degron]) IV; fxIs1[pie-1p::TIR1::mRuby] I | |
| Figure 8—figure supplement 2 | AG582 | pezo-1(av241 [gfp::pezo-1::degron]) IV, CRISPR/Cas9 edit |
| AG567 | pezo-1(av241 [gfp::pezo-1::degron]) IV; ieSi57 [eft-3p::TIR1::mRuby::unc-54 3'UTR + Cbr-unc-119(+)] II | |
| AG568 | pezo-1(av241 [gfp::pezo-1::degron]) IV; fxIs1[pie-1p::TIR1::mRuby] I | |
| AG569 | pezo-1(av241 [gfp::pezo-1::degron]) IV; ieSi65 [sun-1p::TIR1::sun-1 3′UTR + Cbr-unc-119(+)] II; unc-119(ed3) III | |
| Figure 8—figure supplement 3 | AG494 | pezo-1(av190 [pezo-1::degron]) IV; ieSi57 [eft-3p::TIR1::mRuby::unc-54 3'UTR + Cbr-unc-119(+)] II |
| Video 1 | AG408 | pezo-1(av146 [gfp::pezo-1]) IV, CRISPR/Cas9 edit |
| Video 2 | N2 | Bristol (wild-type) |
| AG406 | pezo-1(av149)] IV, CRISPR/Cas9 edit, deletion of exon 27–33 and introns | |
| Video 3 | LP598 | dlg-1(cp301[dlg-1::mNG-C1^3xFlag]) X, CRISPR/Cas9 edit |
| AG491 | pezo-1(av149) IV; dlg-1(cp301[dlg-1::mNG-C1^3xFlag]) X | |
| Video 4 | AG406 | pezo-1(av149) IV, CRISPR/Cas9 edit, deletion of exon 27–33 and introns |
| Video 5 | AG448 | pezo-1(av142 [mScarlet::pezo-1]) IV; xbIs1101 [fln-1p::GCaMP3; pRF4(rol-6D(su1006))] II |
| Video 6 | UN1108 | xbIs1101 [fln-1p::GCaMP3; pRF4(rol-6D(su1006))] II |
| AG415 | pezo-1(av149) IV; xbIs1101 [fln-1p::GCaMP3; pRF4(rol-6D(su1006))] II |
Table 2
List of the sequence for the CRISPR design.
| Strain | Genotype | Description | Sequence name | Sequence 5′−3′ | PAM | |
|---|---|---|---|---|---|---|
| AG406 | pezo-1 (av144) IV | Deletion of exons 1–13 and introns of pezo-1 | crRNA N-terminus | ACACAGCAACAACAGAATGA | CGG | |
| crRNA C-terminus | TGGGGGTGTTGCAGTGGCTA | AGG | ||||
| Repair template | atctgaatcggtggtcgtaacacagcaacaacagagtttgacacattttccgttgagacttgaaaaatag | |||||
| Genotyping F1 | GCGGTAAATCTGAATCGGTGG | |||||
| Genotyping R1 | TTGGAAAAGCAGGCACAACC | |||||
| Genotyping internal | CGATCCAGCGTGGATGAACT | |||||
| AG416 | pezo-1 (av149) IV | Deletion of exons 27–33 and introns of pezo-1 | crRNA N-terminus | CGGTGGCAGCGTACATTATC | TGG | |
| crRNA C-terminus | CACCAGCGACACTCATCGAA | TGG | ||||
| Repair template | tccagtctcccatatttattttttttctgttccagTAGATAAGTAAGAGCAAAAAGAAGCAAGAATAA | |||||
| Genotyping F1 | AATCTGACTTGTGCCCTCCG | |||||
| Genotyping R1 | AATCAGGCGAGCAGTGAGAG | |||||
| Genotyping internal | TCCACAGTCAATTCCTGCGT | |||||
| AG404 | pezo-1(av142 [mScarlet::pezo-1]) IV | Knock in mScarlet at N-terminus of pezo-1, mScarlet was amplified from plasmid pMS050 | crRNA | ACACAGCAACAACAGAATGA | CGG | |
| Repair template F1 | tgaatcggtggtcgtaacacagcaacaacagaATG CTTGTAGAGCTCGTCCATTCC (mScarlet) | |||||
| Repair template R1 | AATTTGACGACGCACGATTTTAAAAGCGGCGGGACTGT CTTGTAGAGCTCGTCCATTCC (mScarlet) | |||||
| AG408 | pezo-1(av146 [gfp::pezo-1]) IV | Knock in GFP at N-terminus of pezo-1, GFP was amplified from plasmid pDD282 | crRNA | ACACAGCAACAACAGAATGA | CGG | |
| Repair template F1 | tgaatcggtggtcgtaacacagcaacaacagaATG agtaaaggagaagaattgttc (GFP) | |||||
| Repair template R1 | AATTTGACGACGCACGATTTTAAAAGCGGCGGGACTGT CTTGTAGAGCTCGTCCATTC (GFP) | |||||
| AG483 | pezo-1(av182 [pezo-1::mScarlet]) IV. | Knock in mScarlet at C-terminus of pezo-1, mScarlet was amplified from plasmid pMS050 | NEST1 crRNA | CACCAGCGACACTCATCGAA | TGG | |
| Repair template | AATATTCCTGTTCCGATCACCAGCGACACTCATCGAATGGACTCGTATGAGTAAGAAAAAACAGGAG GTCTCCAAGGGAGAGGCCGTCATCAAGGAGTTCATGCGTTTCAAGGTCCAAGCGCTCCGAGGGACGTCACTCCACCGGAGGAATGGACGAGCTCTACAAGTAAatttaaatatttcactgtcaaatattctgcga (mScarlet) | |||||
| Genotyping F1 | TGGTTCGAGAAGCGAAGGAC | |||||
| Genotyping R1 | aatcaggcgagcagtgagag | |||||
| NEST2 crRNA | TTCAAGGTCCAAGCGCTCCG | AGG | ||||
| Repair template F1 | GCCGTCATCAAGGAGTTCATGCGTTTCAAGGTCCACATGGAGGGATCCATGAACG | |||||
| Repair template R1 | TAGAGCTCGTCCATTCCTCCGGTGGAGTGACGTCCTTCTGAACGCTCGTATTGCTCGACGACGGTG | |||||
| AG487 | pezo-1(av190 [pezo-1::degron]) IV | Knock in Degron sequence at C-terminus of pezo-1, Degron was amplified from plasmid pK0132 | crRNA | CACCAGCGACACTCATCGAA | TGG | |
| Repair template F1 | AATATTCCTGTTCCGATCACCAGCGACACTCATCGAATGGACTCGTATGAGTAAGAAAAAACAGGAGggagcatcgggagcctcaggagcatcg (linker)GACTACAAAGACCATGACGGTG (Degron) | |||||
| Repair template R1 | tcgcagaatatttgacagtgaaatatttaaatTTACTTCACGAACGCCGCC (Degron) | |||||
| AG437 | pezo-1(av165[R2405P]) IV | Generate a point mutation R2405P in pezo-1 | crRNA | CTATTTGGTTCGAGAAGCGA | AGG | |
| Repair template | CATCTTCTCAAAATTTGTCTCGACATCTATTTGGTACCAGAAGCGAAAGACTTCATGTTGGAGCAGgtaattatttagtttta | |||||
| AG570 | pezo-1(av240) IV | Deletion of full length of pezo-1 | crRNA1 | ACACAGCAACAACAGAATGA | CGG | |
| crRNA2 | CACCAGCGACACTCATCGAA | TGG | ||||
| Repair template | ctgaatcggtggtcgtaacacagcaacaacagaATGTAGATAAGTAAGAGCAAAAAGAAGCAAGAATAAatttaaatatttc | |||||
| AG571 | pezo-1(av242) IV | Deletion of exons 27–33 and introns of pezo-1 in fem-1(hc17) | crRNA1 | CGGTGGCAGCGTACATTATC | TGG | |
| crRNA2 | CACCAGCGACACTCATCGAA | TGG | ||||
| Repair template | tccagtctcccatatttattttttttctgttccagTAGATAAGTAAGAGCAAAAAGAAGCAAGAATAA | |||||
| AG582 | pezo-1(av241) IV | Knock in Degron sequence at C-terminus of pezo-1 in AG404,Degron was amplified from plasmid pK0132 | crRNA | CACCAGCGACACTCATCGAA | TGG | |
| Repair template F1 | AATATTCCTGTTCCGATCACCAGCGACACTCATCGAATGGACTCGTATGAGTAAGAAAAAACAGGAGggagcatcgggagcctcaggagcatcg (linker)GACTACAAAGACCATGACGGTG (Degron) | |||||
| Repair template R1 | tcgcagaatatttgacagtgaaatatttaaatTTACTTCACGAACGCCGCC (Degron) | |||||
| PS8111 | pezo-1(sy1199) IV | Knock in a stop cassette at C-terminus of pezo-1 | crRNA | CCAGAAGCTCGTAAGCCAGG | AGG | |
| Repair template | cttatcgctgtttctgaaccagaagctcgtaagccGGGAAGTTTGTCCAGAGCAGAGGTGACTAAGTGATAAgctagcaggaggcactgaagaaacggatggtgatgaag | |||||
| Genotyping F1 | GACAGGACTTTCCCGCCAACTTAA | |||||
| Genotyping R1 | ATCATTCGCCGATTGCACAAGTTG | |||||
| PS8546 | pezo-1(sy1398) IV | Deletion of the first exon of pezo-1 isoforms i and j | crRNA1 | gagaacttgaattcaatgg | AGG | |
| crRNA2 | aagcttcttccgtctccgg | CGG | ||||
| crRNA3 | gcagtatttgaccaactgg | TGG | ||||
| crRNA4 | ataaaacaaggcaaccagg | GGG | ||||
| Genotyping F1 | CTCTCGCCTATCCACTTGAGCTTA | |||||
| Genotyping R1 | GGAAACAATTGAGCCGAGAATGGA | |||||
-
Note: Capital letters represent the ORF or exon sequence, small letters indicate the intron sequence. Bolded letters indicate the optimized bases needed for the CRISPR design.
Additional files
Download links
A two-part list of links to download the article, or parts of the article, in various formats.
Downloads (link to download the article as PDF)
Open citations (links to open the citations from this article in various online reference manager services)
Cite this article (links to download the citations from this article in formats compatible with various reference manager tools)
Caenorhabditis elegans PIEZO channel coordinates multiple reproductive tissues to govern ovulation
eLife 9:e53603.
https://doi.org/10.7554/eLife.53603


