Thioredoxin-1 distinctly promotes NF-κB target DNA binding and NLRP3 inflammasome activation independently of Txnip
- Institute of Molecular Health Sciences, ETH Zürich, Switzerland
Figures
Figure 1 with 3 supplements

The Trx1 system is largely dispensable for the development and homeostatic maintenance of myeloid cells.
(A–E) Txnrd1fl/fl;Rosa26-CreERT2 mice and Txnrd1fl/fl littermates were injected with TAM to delete the Txnrd1 gene and were analyzed by flow cytometry 2 weeks later. Depicted are the total numbers or percentages of the indicated populations in the thymus (A), bone marrow (BM; B), blood (C), lungs (D), spleen (E); n = 4–5 mice). (F–I) Lethally irradiated WT mice (CD45.1+CD45.2+) were reconstituted with a 1:1 mixture of WT (CD45.1+) and TAM-treated Txnrd1fl/fl;Rosa26-CreERT2 (CD45.2+) bone marrows (or Txnrd1fl/fl as control). After reconstitution, the percentage of donor CD45.2+ cells among the indicated cell populations was determined by flow cytometry (n = 4–5 mice). (F) Schematic showing the experimental setup. (G) Depicted are the CD45.2+ percentages of total TCRβ+ T cells in the indicated organs. (H, I) The percentages of CD45.2+ cells among the indicated myeloid populations in the bone marrow (BM; H) and lungs (I) are shown. DP, CD4+CD8+ double positive thymocytes; CD4+ T, CD4+ single positive thymocytes; CD8+ T, CD8+ single positive thymocytes; Eo, eosinophils; Neutro, neutrophils; Mono, monocytes; DC, dendritic cells; AlvMac, alveolar macrophages; cDC1/2, type 1/2 conventional dendritic cells; Mac, macrophages; LN, lymph nodes. Bar graphs show mean + standard deviation (A–E, G–I). Data are representative of three independent experiments. For each panel, a representative experiment with biological replicates (A–E,G–I) is shown. Student’s t test (two-tailed, unpaired) was used for the comparison of two groups (A–E, G–I): *, p≤0.05; **, p≤0.01; ***, p≤0.001; ****, p≤0.0001; ns, not significant.
Figure 1—figure supplement 1
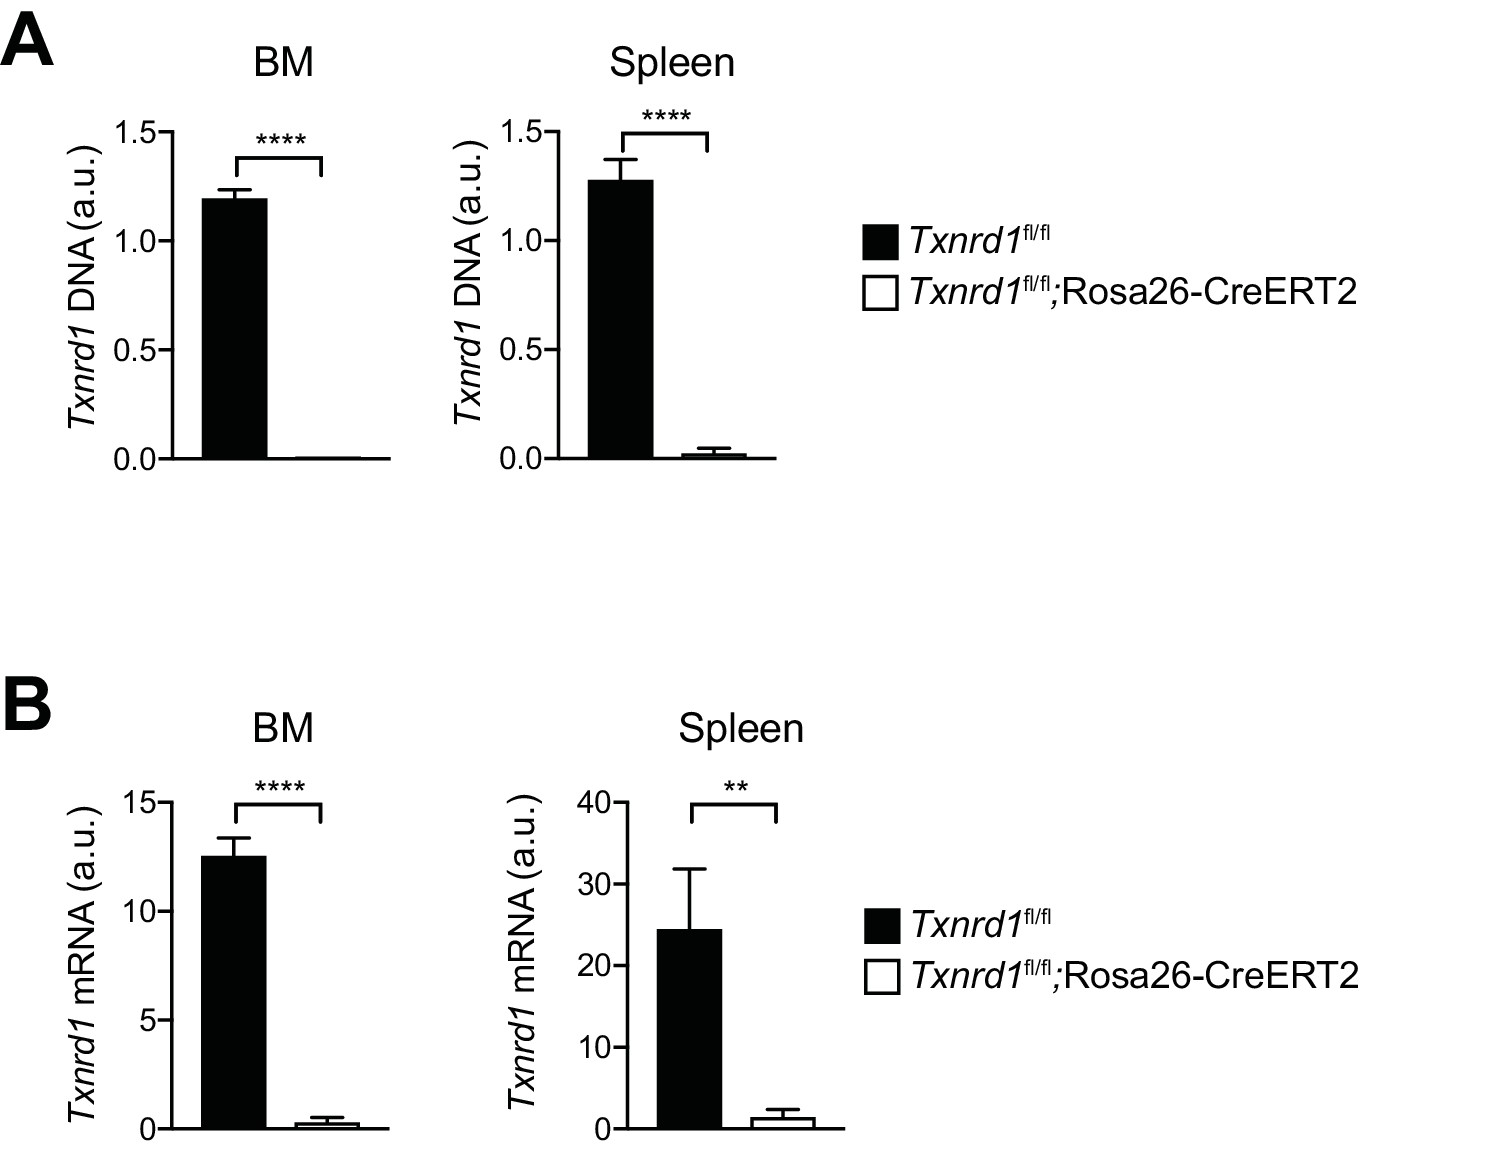
Efficiency of Txnrd1 gene deletion.
(A, B) Txnrd1fl/fl;Rosa26-CreERT2 mice and Txnrd1fl/fl littermates were injected with TAM to delete the Txnrd1 gene and were analyzed by flow cytometry 2 weeks later. Depicted is the analysis of genomic Txnrd1 DNA (A) and Txnrd1 mRNA (B) in total bone marrow (BM) cells (left) and in MACS-enriched CD11b+ cells from the spleen (right) determined by RT-PCR (n = 3 mice). Bar graphs show mean + standard deviation. Data are representative of two independent experiments. For each panel, a representative experiment with biological replicates is shown. Student’s t test (two-tailed, unpaired) was used for the comparison of two groups: *, p≤0.05; **, p≤0.01; ***, p≤0.001; ****, p≤0.0001; ns, not significant.
Figure 1—figure supplement 2
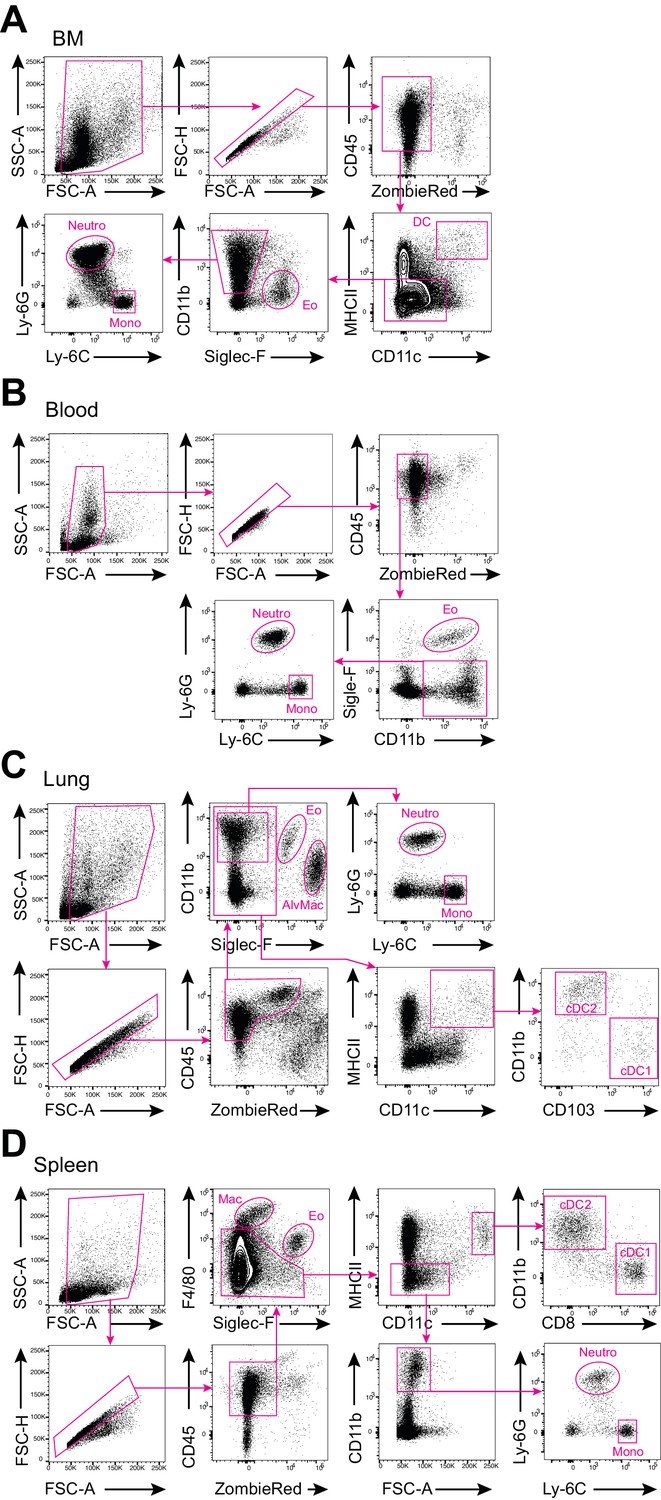
Gating strategies for the analysis of distinct myeloid-cell populations in vivo.
(A–D) Shown are the gating strategies utilized for the analysis of the indicated myeloid-cell populations in the bone marrow (BM; A), blood (B), lungs (C), and spleen (D). Eo, eosinophils; Neutro, neutrophils; Mono, monocytes; DC, dendritic cells; AlvMac, alveolar macrophages; cDC1/2, type 1/2 conventional dendritic cells; Mac, macrophages.
Figure 1—figure supplement 3
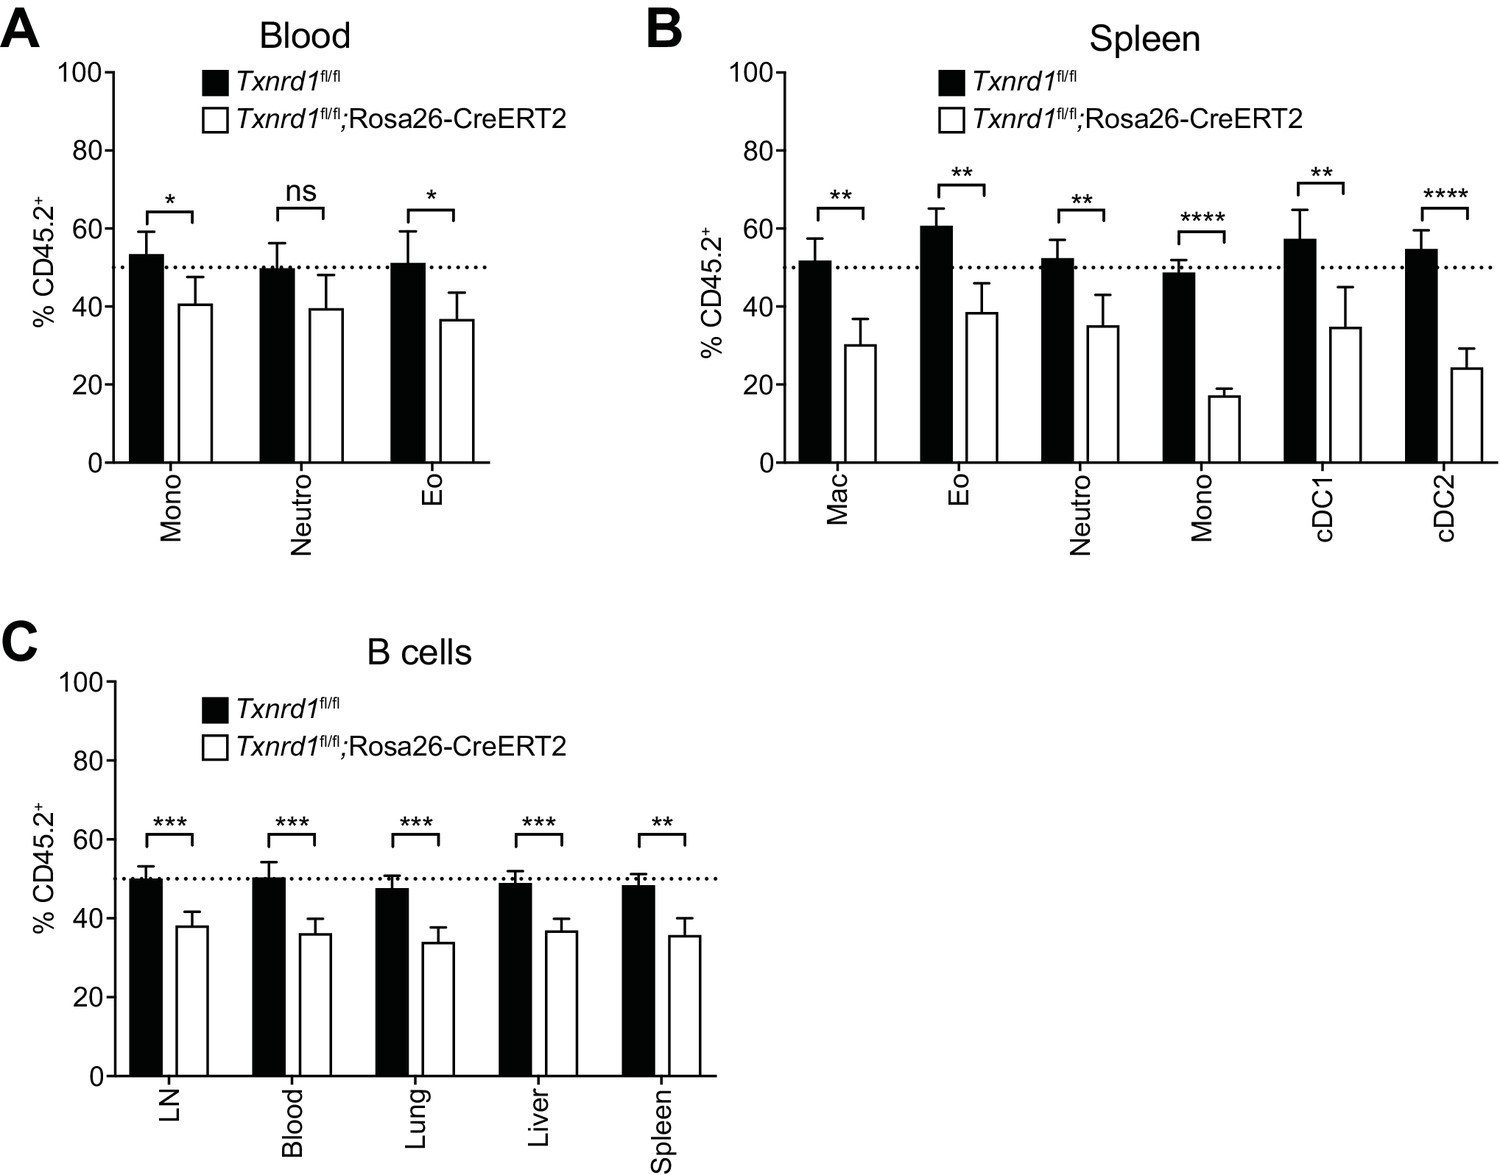
The Trx1 system is largely dispensable for the maintenance and homeostasis of myeloid cells in mixed-bone marrow chimera settings.
(A–C) Lethally irradiated WT mice (CD45.1+CD45.2+) were reconstituted with a 1:1 mixture of WT (CD45.1+) and TAM-treated Txnrd1fl/fl;Rosa26-CreERT2 (CD45.2+) bone marrows (or Txnrd1fl/fl as control). After reconstitution, the percentage of donor CD45.2+ cells among the indicated cell populations was determined by flow cytometry (n = 4–5 mice). (A, B) The percentages of CD45.2+ cells among the indicated myeloid populations in the blood (A) and spleen (B) are shown. (C) Depicted are the CD45.2+ percentages of total CD19+ B cells in the indicated organs. Mono, monocytes; Neutro, neutrophils; Eo, eosinophils; Mac, macrophages; cDC1/2, type 1/2 conventional dendritic cells. Bar graphs show mean + standard deviation. Data are representative of three independent experiments. For each panel, a representative experiment with biological replicates is shown. Student’s t test (two-tailed, unpaired) was used for the comparison of two groups: *, p≤0.05; **, p≤0.01; ***, p≤0.001; ****, p≤0.0001; ns, not significant.
Figure 2 with 2 supplements
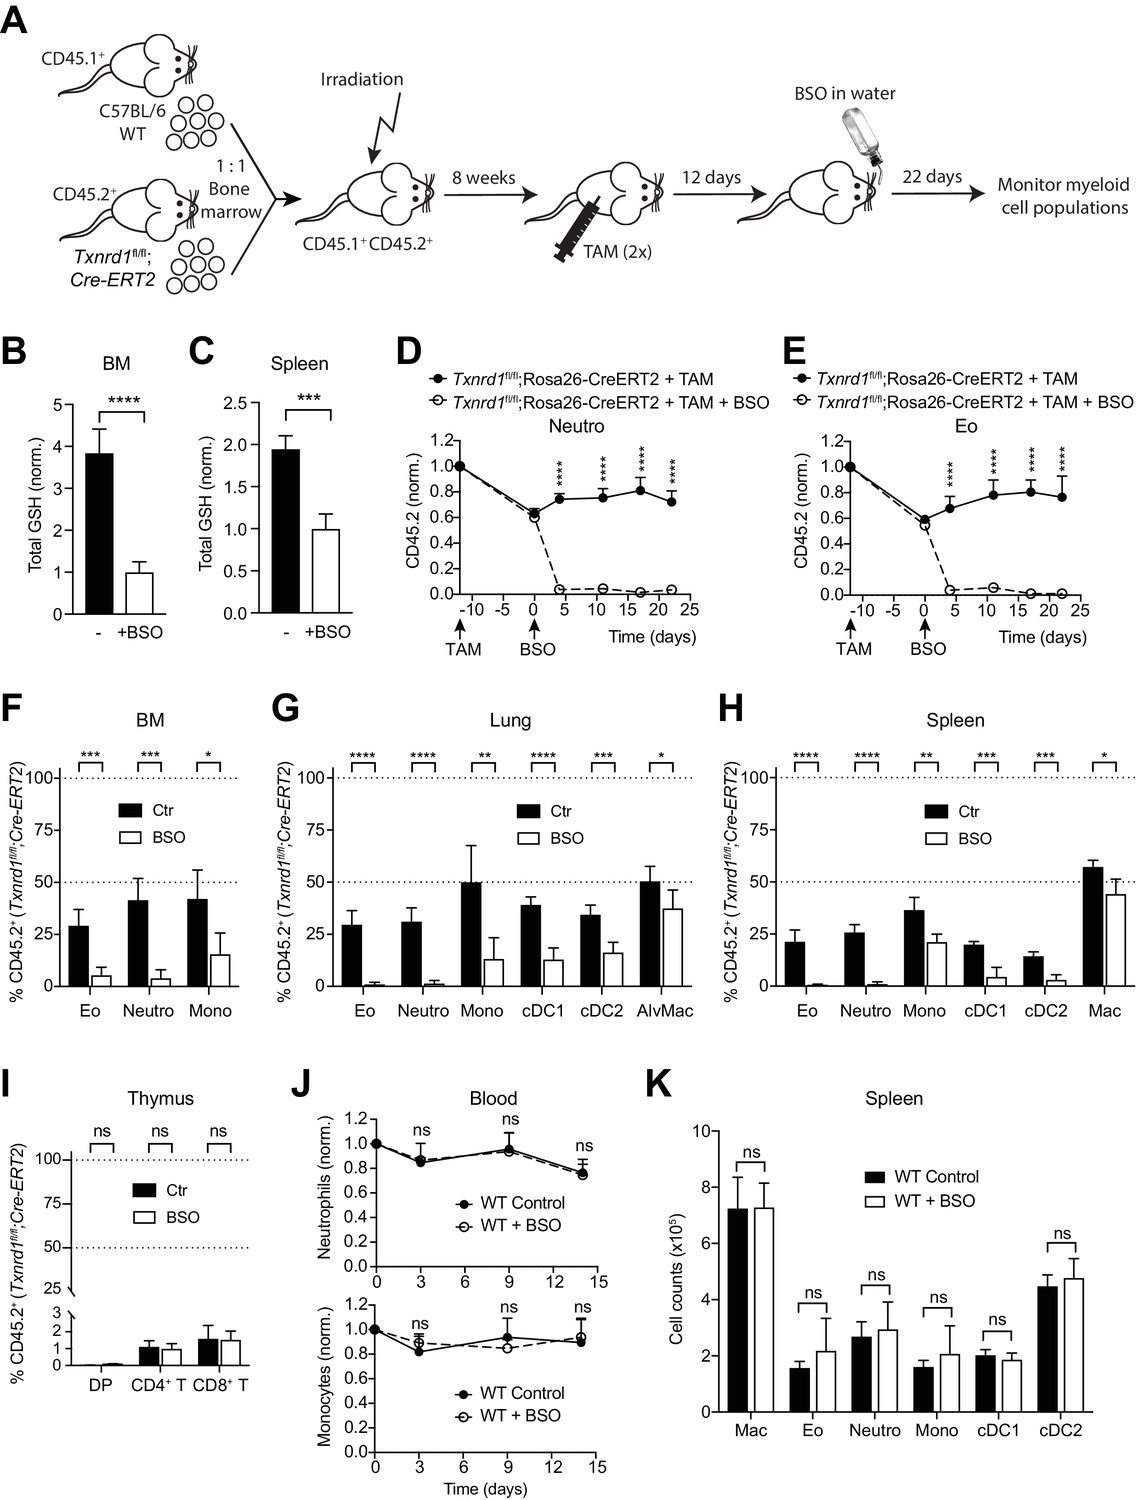
The GSH/Grx system sustains the development and maintenance of Txnrd1-deficient myeloid cells.
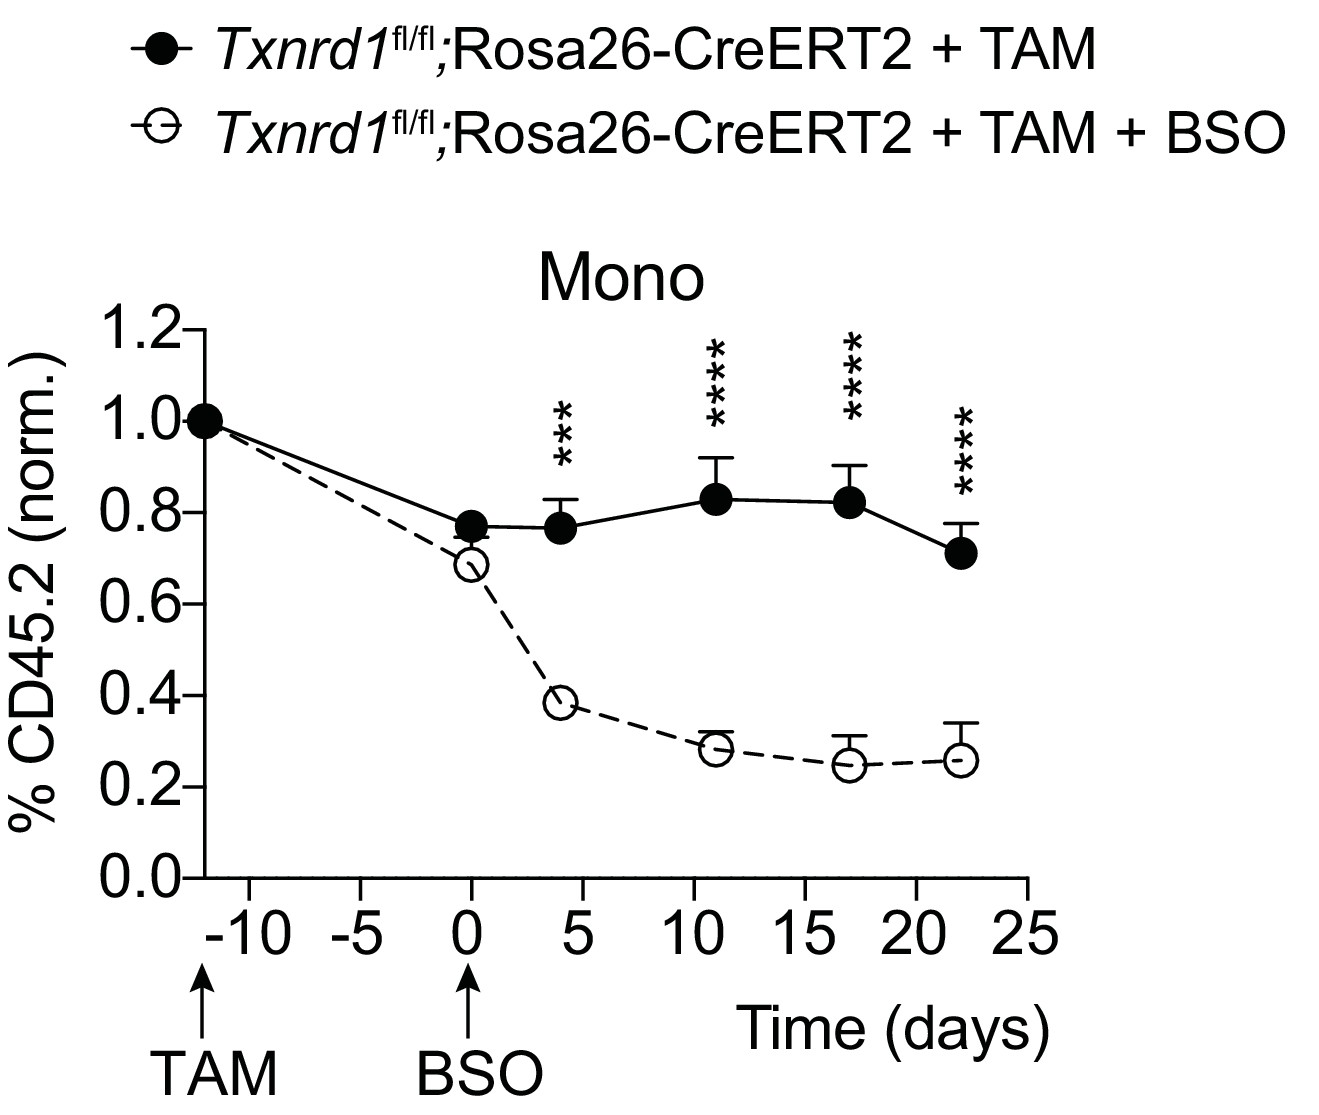
(A–I) Lethally irradiated WT mice (CD45.1+CD45.2+) were reconstituted with a 1:1 mixture of WT (CD45.1+) and Txnrd1fl/fl;Rosa26-CreERT2 (CD45.2+) bone marrows. After reconstitution, mice were injected with TAM to delete the Txnrd1 gene, and after 12 days BSO was administered in the drinking water to deplete GSH levels. Cell populations in the blood were monitored over time, and animals were analysed on day 22 upon BSO administration (n = 4–5 mice). (A) Schematic showing the experimental setup. (B, C) Depicted are the total glutathione (GSH) levels in the lysates from total bone marrow (BM) cells (B) and spleen (C). (D, E) The percentages of CD45.2+ neutrophils (D) and eosinophils (E) in the blood were monitored over the indicated period of time. (F–H) The percentages of the indicated myeloid-cell populations coming from the Txnrd1fl/fl;Rosa26-CreERT2 (CD45.2+CD45.1-) donors were analyzed in the bone marrow (BM; F), lungs (G) and spleen (H) on day 22 upon BSO administration. (I) The percentages of the indicated thymocyte populations coming from the Txnrd1fl/fl;Rosa26-CreERT2 (CD45.2+CD45.1-) donors were analyzed 22 days after BSO administration. (J, K) WT mice were treated with BSO in the drinking water and analyzed 2 weeks later (n = 4–5 mice). (J) Total neutrophils (above) and monocytes (below) in the blood were monitored over the period of 2 weeks. The percentages at the indicated times were normalized with the percentage on day 0. (K) Shown are the total numbers of the indicated myeloid-cell populations in the spleen 2 weeks after BSO administration. Neutro, neutrophils; Eo, eosinophils; Mono, monocytes; AlvMac, alveolar macrophages; cDC1/2, type 1/2 conventional dendritic cells; Mac, macrophages; DP, CD4+CD8+ double positive thymocytes; CD4+ T, CD4+ single positive thymocytes; CD8+ T, CD8+ single positive thymocytes. Bar graphs and dot plots show mean + standard deviation (B–K). Data are representative of two independent experiments. For each panel, a representative experiment with biological replicates (B–K) is shown. Student’s t test (two-tailed, unpaired) was used for the comparison of two groups (B, C, F–I, K): *, p≤0.05; **, p≤0.01; ***, p≤0.001; ****, p≤0.0001; ns, not significant. Two-way ANOVA adjusted by Bonferroni's multiple comparison test was used in D, E, J: ****, p≤0.0001; ns, not significant.
Figure 2—figure supplement 1
The GSH/Grx system compensates for the absence of the Trx1 pathway in Txnrd1-deficient monocytes.
Lethally irradiated WT mice (CD45.1+CD45.2+) were reconstituted with a 1:1 mixture of WT (CD45.1+) and Txnrd1fl/fl;Rosa26-CreERT2 (CD45.2+) bone marrows. After reconstitution, mice were injected with TAM to delete the Txnrd1 gene, and BSO was administered in the drinking water to deplete GSH after 12 days. Monocytes in the blood were monitored over the period of 22 days. Depicted is the percentage of CD45.2+ monocytes (n = 4–5 mice). Data are representative of two independent experiments, a representative experiment with biological replicates is shown for each panel. Two-way ANOVA adjusted by Bonferroni's multiple comparison test was used for statistical analysis: ***, p≤0.0002; ****, p≤0.0001.
Figure 2—figure supplement 2

BSO administration does not affect the maintenance and homeostasis of WT myeloid cells.
(A, B) WT mice were treated with BSO in the drinking water and analyzed 2 weeks later (n = 4–5 mice). Shown are the total counts of the indicated myeloid populations in the bone marrow (BM; A) and lungs (B). Neutro, neutrophils; Eo, eosinophils; Mono, monocytes; AlvMac, alveolar macrophages; DC, dendritic cells; cDC1/2, type 1/2 conventional dendritic cells. Data are representative of two independent experiments, a representative experiment with biological replicates is shown for each panel. Student’s t test (two-tailed, unpaired) was used for the comparison of two groups: ns, not significant.
Figure 3
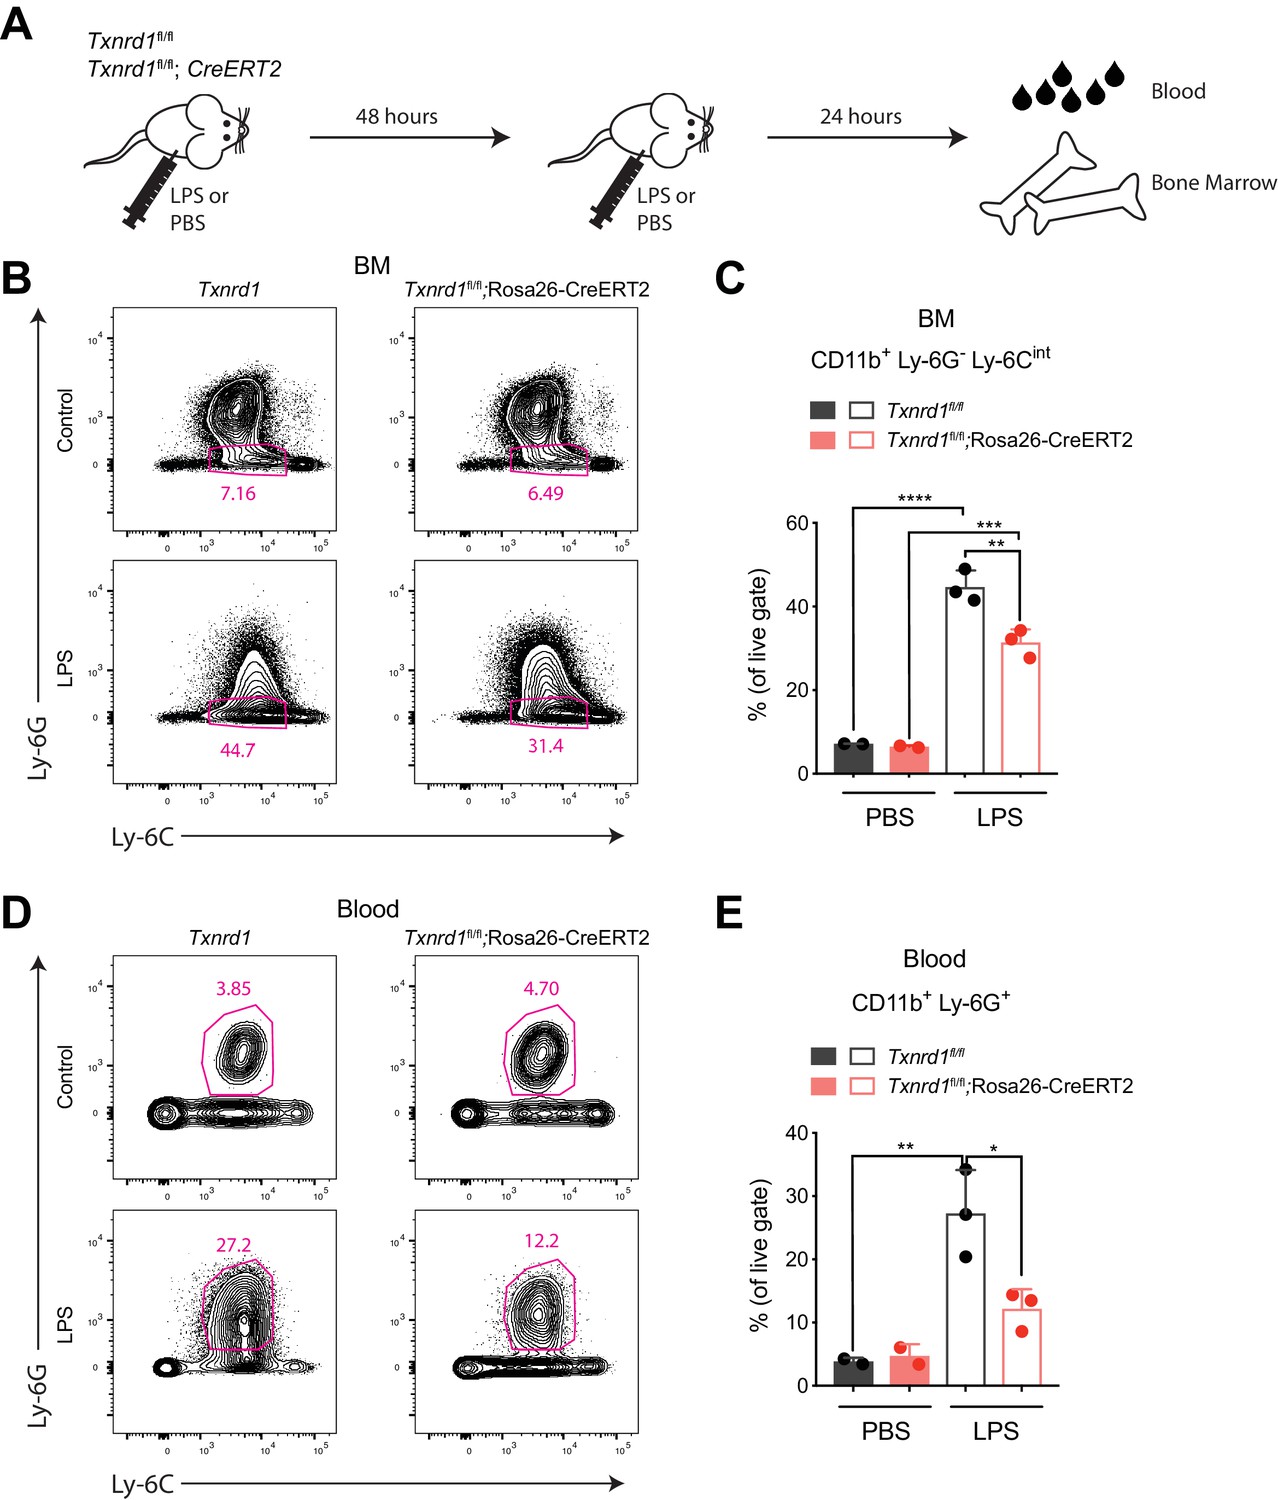
The Trx1 system is required in the bone marrow during emergency hematopoiesis.
(A–E) TAM-treated Txnrd1fl/fl;Rosa26-CreERT2 mice (or Txnrd1fl/fl littermate controls) were intraperitoneally injected with 35 μg LPS in a 48 hr interval and sacrificed 24 hr later for analysis (n = 3 mice). (A) Schematic showing the experimental setup. (B, C) Shown are the gating strategy (B) and percentages (C) of CD11b+Ly-6G-Ly-6Cint cells in the bone marrow (BM). (D, E) Depicted are the gating strategy (D) and percentages (E) of CD11b+Ly-6G+ neutrophils in the blood. Numbers in the FACS plots indicate the average percentages of the depicted gate. Bar graphs show mean + standard deviation (C, E). Data are representative of three independent experiments. For each panel, a representative experiment with biological replicates (B–E) is shown. One-way ANOVA adjusted by Tukey’s multiple comparison test was used in C, E: *p≤0.0332; **p≤0.0021; ***p≤0.0002; ****p≤0.0001.
Figure 4 with 2 supplements
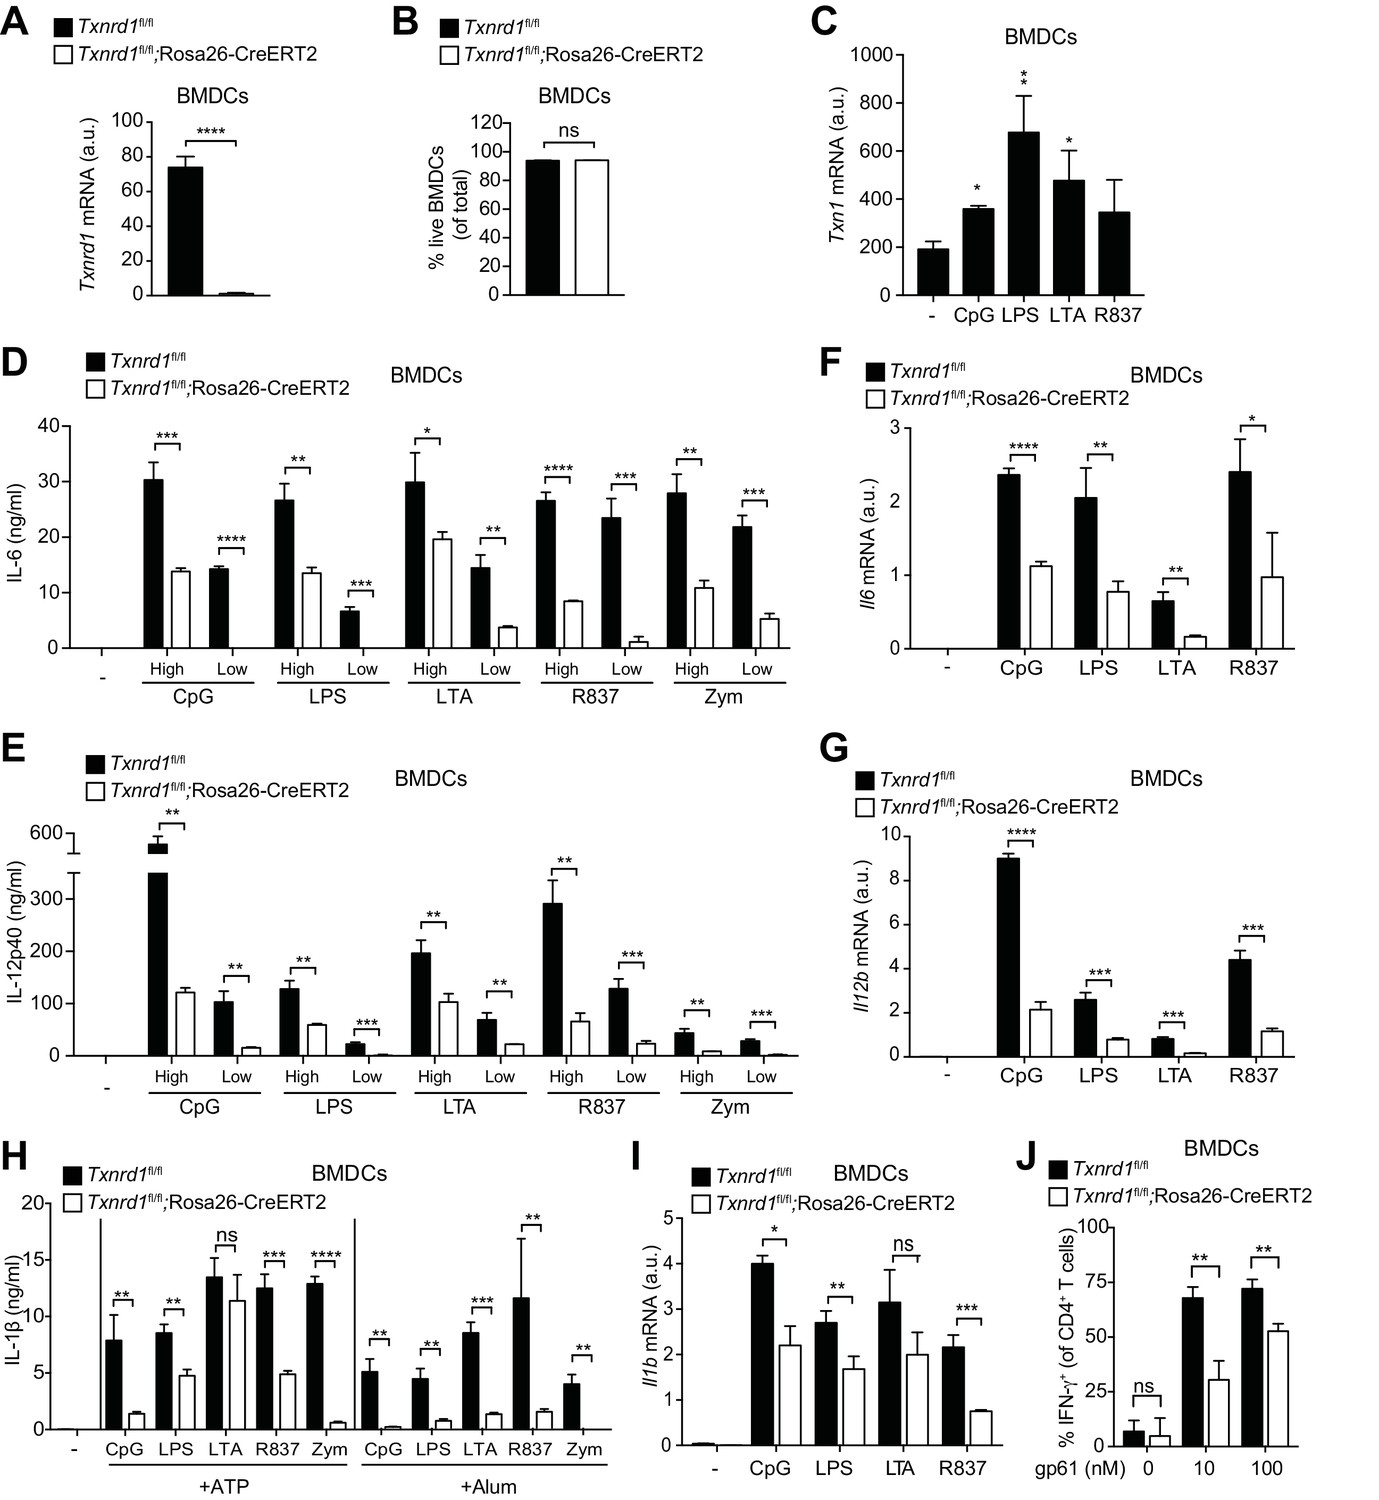
Txnrd1-deficient BMDCs undergo defective transcription of pro-inflammatory cytokines.
(A–J) Txnrd1fl/fl;Rosa26-CreERT2 mice and Txnrd1fl/fl littermates were injected with TAM to delete the Txnrd1 gene. Bone marrow cells were differentiated with GM-CSF to obtain BMDCs. (A) Analysis of Txnrd1 mRNA by RT-PCR in cultured Txnrd1fl/fl;Rosa26-CreERT2 and Txnrd1fl/fl BMDCs for confirmation of gene deletion (n = 3). (B) Viability (eFluor780-Annexin-V-) of BMDCs was assessed via flow cytometry (n = 3). (C) BMDCs were primed with CpG (100 nM), LPS (100 ng/ml), LTA (1 μg/ml), R837 (5 μg/ml) for 7 hr, and expression of Txn1 at the mRNA level was determined via RT-PCR (n = 3). (D, E) BMDCs were stimulated for 7 hr with CpG (100, 20 nM), LPS (100, 20 ng/ml), LTA (5, 1 μg/ml), R837 (5, 1 μg/ml), or zymosan (10, 2 μg/ml). ‘High’ and ‘Low’ indicate the concentration of the utilized stimulus. IL-6 (D) and IL-12p40 (E) were measured in supernatants by ELISA (n = 3). (F, G) BMDCs were stimulated for 7 hr with CpG (100 nM), LPS (100 ng/ml), LTA (1 μg/ml) or R837 (5 μg/ml), and the expression of Il6 (F) and Il12b (G) was determined by RT-PCR (n = 3). (H) BMDCs were stimulated with CpG (100 nM), LPS (400 ng/ml), LTA (5 μg/ml), R837 (5 μg/ml) or zymosan (10 μg/ml) before the addition of 2 mM ATP or 200 μg/ml alum for 1 hr or 4 hr, respectively. The concentration of IL-1β in supernatants was determined by ELISA (n = 3). (I) BMDCs were stimulated with TLR ligands as in F,G), and expression of Il1b at the mRNA level was determined via RT-PCR (n = 3). (J) Naive, splenic, Smarta-1 transgenic CD4+ T cells were co-cultured with Txnrd1-deficient BMDCs (or Txnrd1-sufficient BMDCs as a control) and the indicated concentrations of the GP61-80 peptide. Shown are the frequencies of CD4+ T cells producing IFN-γ+ after restimulation with PMA/ionomycin (n = 3). Bar graphs represent mean + standard deviation. Data are representative of two (A–C, F, G, I, J) or four (D, E, H) independent experiments. For each panel, a representative experiment with replicates of in vitro culture conditions is shown. Student's t test (two-tailed, unpaired) was used to compare Txnrd1fl/fl;Rosa26-CreERT2 and control Txnrd1fl/fl groups in (A, B, D–J): *p≤0.05; **p≤0.01; ***p≤0.001; ****p≤0.0001; ns, not significant. One-way ANOVA followed by Dunnett’s correction was used in C (comparison to the unstimulated control): *p≤0.0332; **p≤0.0021.
Figure 4—figure supplement 1
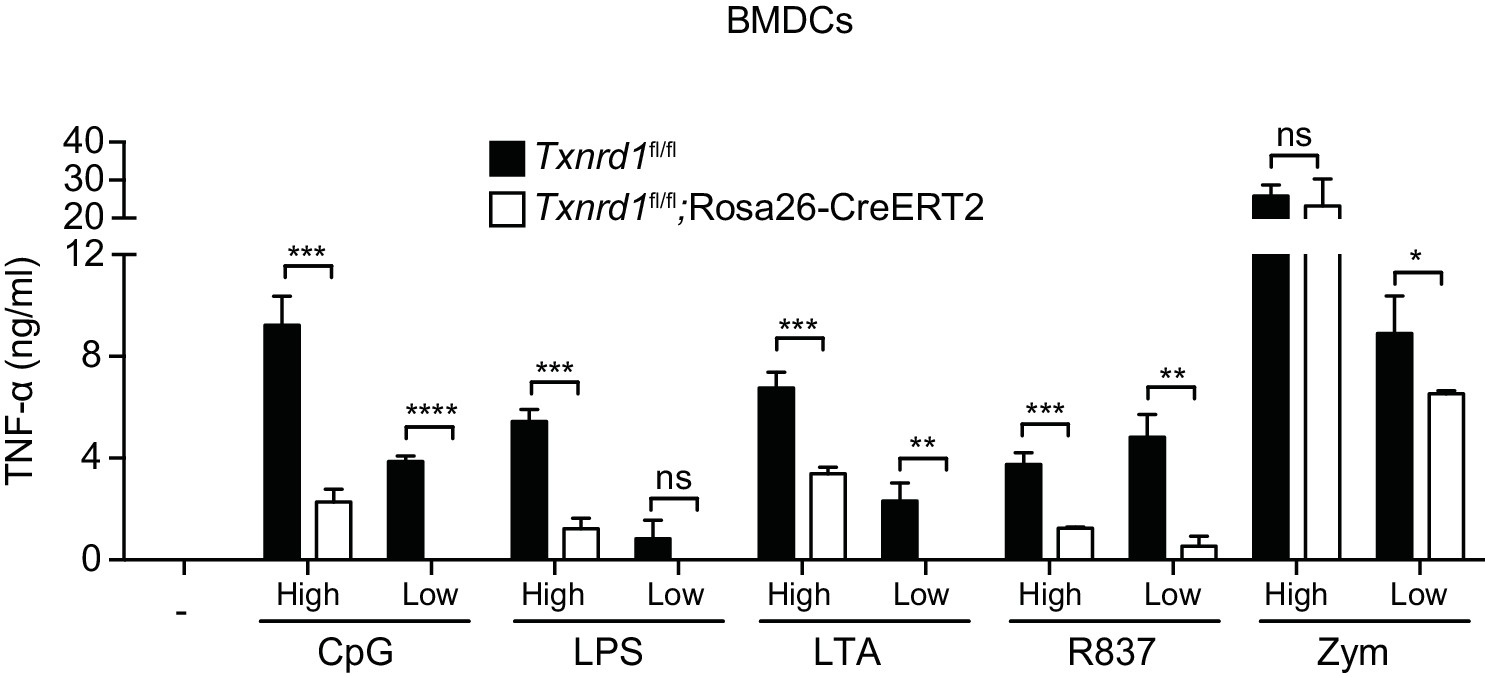
Txnrd1-deficient BMDCs display an impaired secretion of TNF-α.
Txnrd1fl/fl;Rosa26-CreERT2 mice and Txnrd1fl/fl littermates were injected with TAM to delete the Txnrd1 gene, and bone marrow cells were differentiated with GM-CSF to obtain BMDCs. BMDCs were then stimulated for 7 hr with CpG (100, 20 nM), LPS (100, 20 ng/ml), LTA (5, 1 μg/ml), R837 (5, 1 μg/ml), or zymosan (10, 2 μg/ml). ‘High’ and ‘Low’ indicate the concentration of the utilized stimulus. TNF-α was then measured in supernatants by ELISA (n = 3). Bar graphs represent mean + standard deviation. Data are representative of three independent experiments, and a representative experiment with triplicates of in vitro culture conditions is shown for each panel. Student's t test (two-tailed, unpaired) was used to compare Txnrd1fl/fl;Rosa26-CreERT2 and control Txnrd1fl/fl groups: *p≤0.05; **p≤0.01; ***p≤0.001; ****p≤0.0001; ns, not significant.
Figure 4—figure supplement 2
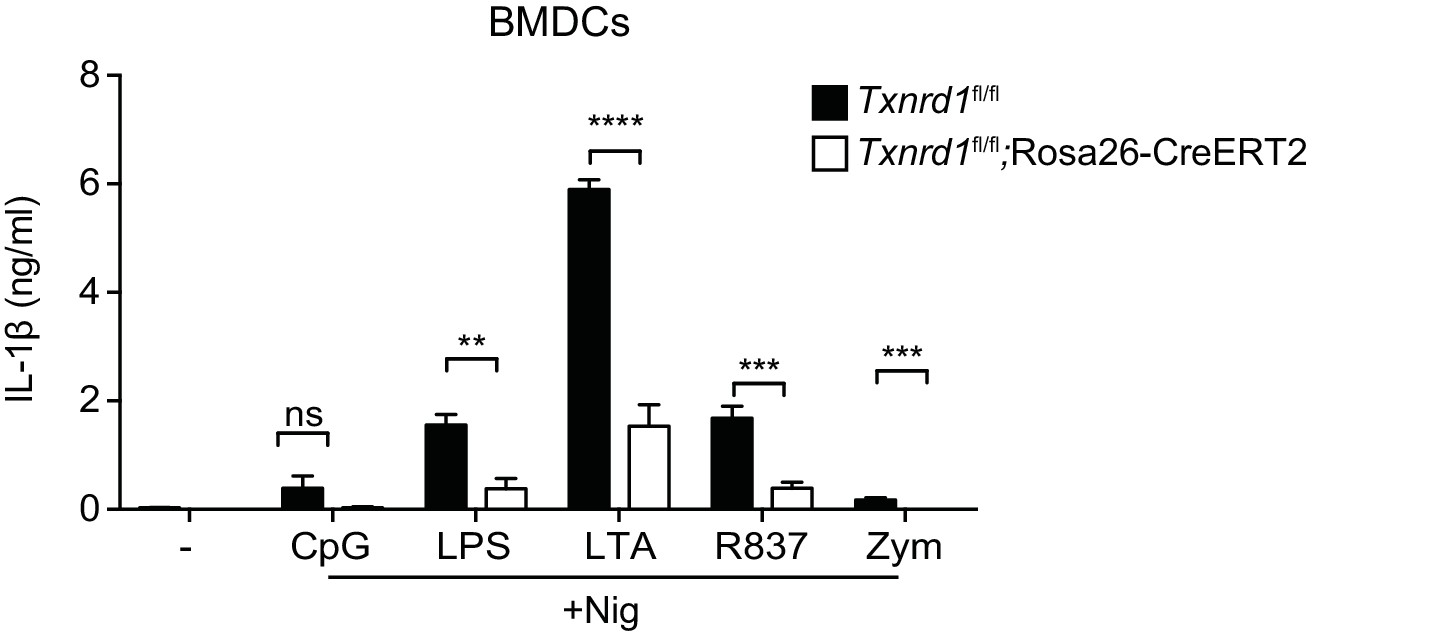
Txnrd1-deficient BMDCs display an impaired secretion of IL-1β.
Txnrd1fl/fl;Rosa26-CreERT2 mice and Txnrd1fl/fl littermates were injected with TAM to delete the Txnrd1 gene, and bone marrow cells were differentiated with GM-CSF to obtain BMDCs. BMDCs were then stimulated with CpG (100 nM), LPS (400 ng/ml), LTA (5 μg/ml), R837 (5 μg/ml) or zymosan (10 μg/ml) before the addition of 15 μM nigericin (Nig) for 1 hr; and IL-1β was measured in supernatants by ELISA (n = 3). Bar graphs represent mean + standard deviation. Data are representative of three independent experiments, and a representative experiment with triplicates of in vitro culture conditions is shown for each panel. Student's t test (two-tailed, unpaired) was used to compare Txnrd1fl/fl;Rosa26-CreERT2 and control Txnrd1fl/fl groups: *p≤0.05; **p≤0.01; ***p≤0.001; ****p≤0.0001; ns, not significant.
Figure 5 with 3 supplements
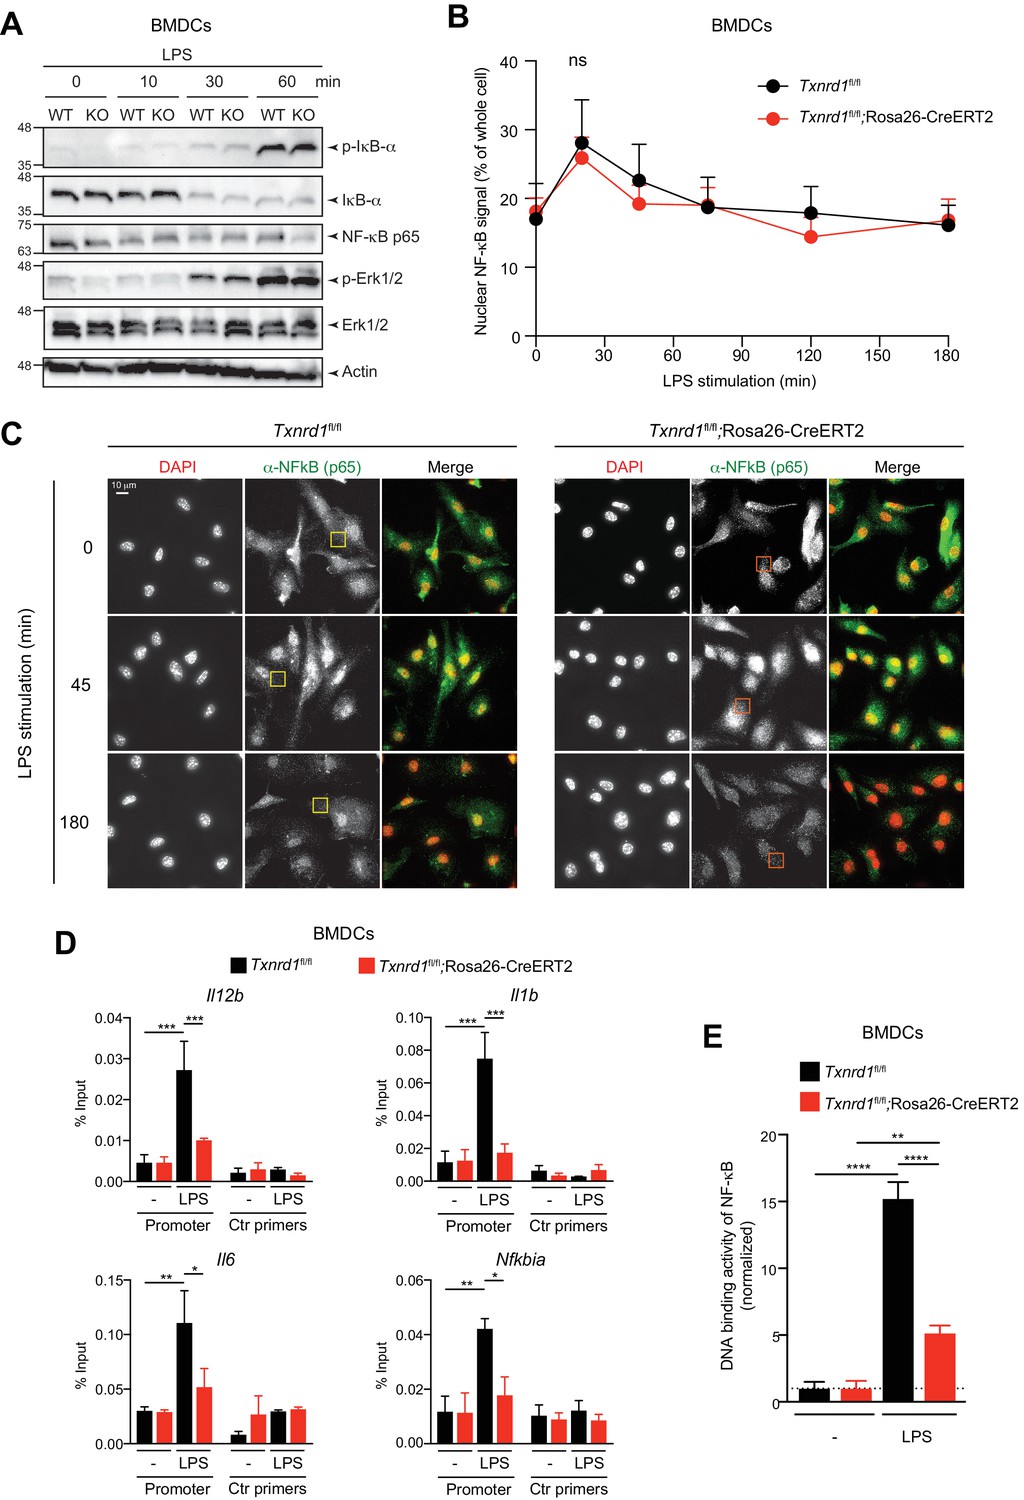
The Trx1 system positively regulates the binding activity of NF-κB p65 to the DNA in BMDCs.
(A–E) Txnrd1fl/fl;Rosa26-CreERT2 mice and Txnrd1fl/fl littermates were injected with TAM to delete the Txnrd1 gene, and bone marrow cells were differentiated with GM-CSF to obtain BMDCs. (A) BMDCs were stimulated with LPS (400 ng/ml) for 10, 30, or 60 min and lysed for western blot. Expression of phospho-IκB-α, respective IκB-α, NF-κB p65, phospho-Erk1/2 and respective Erk1/2 was assessed with β-actin as a loading control. (B, C) WT or Txnrd1-deficient BMDCs were fixed at the indicated time points post LPS treatment, stained for DNA (DAPI), NF-κB p65 and actin (Phalloidin), and imaged using a DeltaVision system. Approximately 10 randomly chosen imaging fields encapturing a total of 50–100 nuclei were analyzed per sample per condition. (B) Nuclear and whole-cell masks were made using the DAPI and phalloidin channels, and NF-κB signal intensity within the masks was quantified. Shown is the nuclear NF-κB signal strength plotted as percentage of whole-cell NF-κB signal. (C) Depicted are example images of the samples of indicated times points post LPS treatment. In the merged images, DAPI and anti-NF-κB channels are shown in red and green, respectively. Scale bar represents 10 μm (top-left panel). Squares indicate fields, which are magnified in Figure 5—figure supplement 2. (D) WT or Txnrd1-deficient BMDCs were stimulated with LPS (400 ng/ml) for 100 min, and the recruitment of NF-κB p65 to the Il12b (top-left), Il1b (top-right), Il6 (bottom-left) and Nfkbia (bottom-right) promoters was assessed by p65 chromatin immunoprecipitation (ChIP) analysis and quantified by RT-PCR. ‘Promoter’ indicates the utilization of a primer pairs that amplify a fragment close to the NF-κB binding sites at the promoter region of the indicated genes, whereas ‘Ctr primers’ indicate primer pairs that were used as a control to amplify a region several kilobases away from the NF-κB binding sites (n = 2). (E) The NF-κB p65 binding activity to its DNA response element in nuclear extracts from BMDCs stimulated with LPS (400 ng/ml) for 40 min was assessed by an ELISA-based method (n = 3). Bar graphs and dot plots represent mean + standard deviation. Data are representative of two (A–D) or three (E) independent experiments. For each panel, a representative experiment with technical replicates is shown (D, E). Two-way ANOVA adjusted by Bonferroni's multiple comparison test was used in B: ns, not significant. One-way ANOVA adjusted by Tukey’s multiple comparison test was used in D, E: *p≤0.0332; **p≤0.0021; ***p≤0.0002; ****p≤0.0001.
Figure 5—figure supplement 1
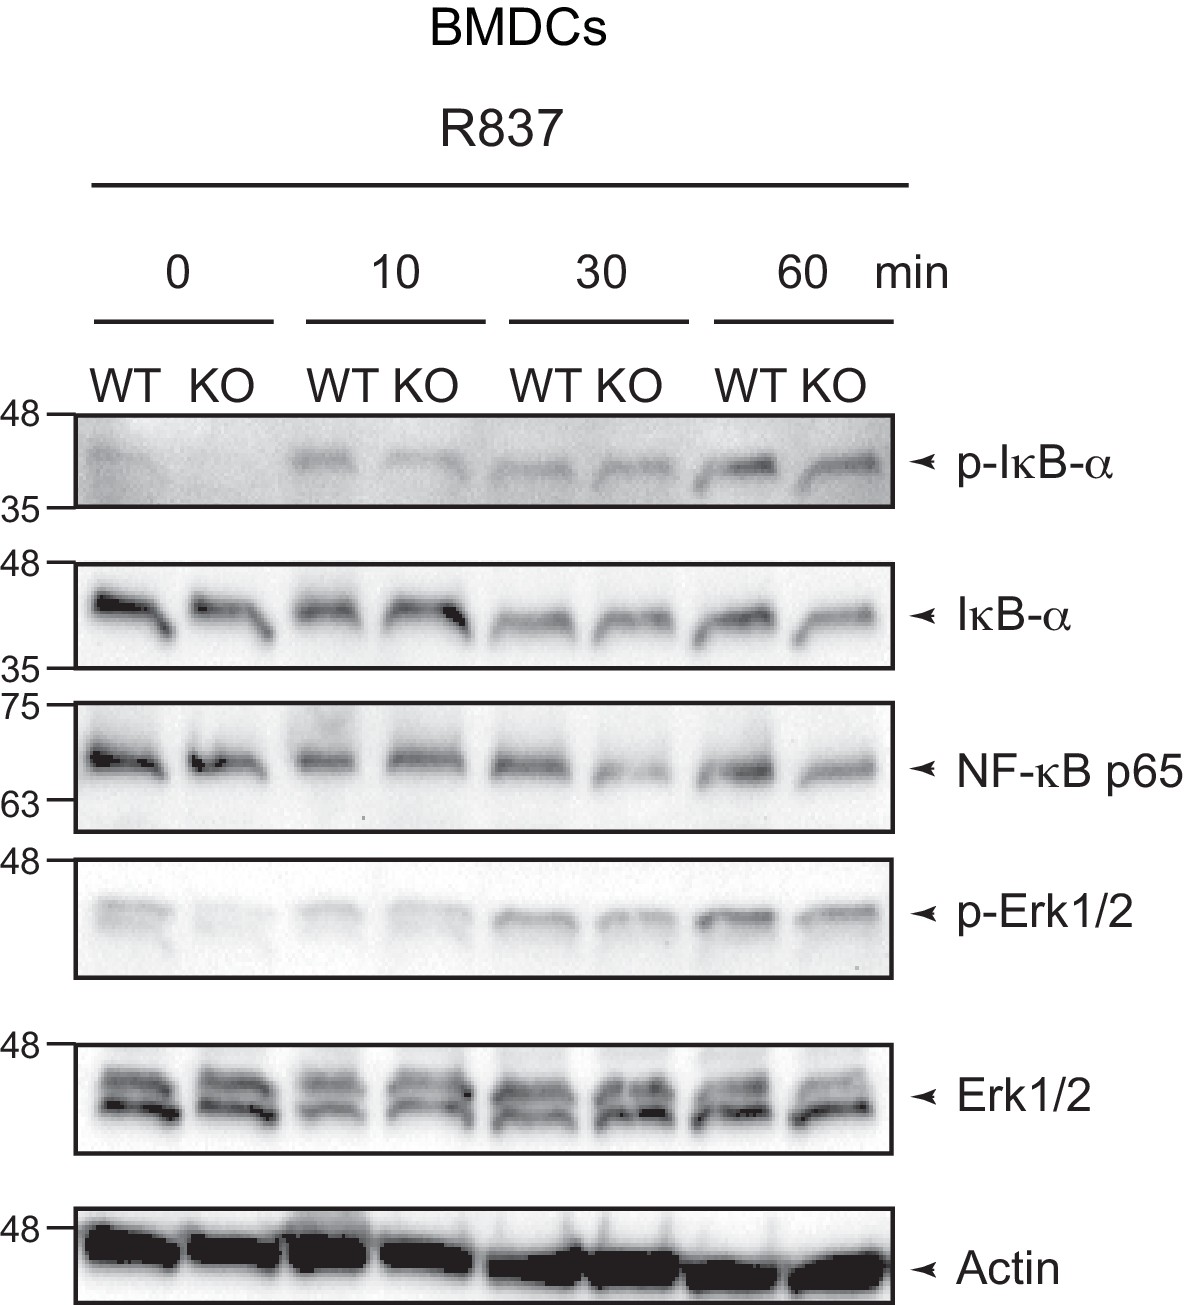
Txnrd1 deficiency does not affect TLR signaling.
Txnrd1fl/fl;Rosa26-CreERT2 mice and Txnrd1fl/fl littermates were injected with TAM to delete the Txnrd1 gene, and bone marrow cells were differentiated with GM-CSF to obtain BMDCs. BMDCs were then stimulated with R837 (5 μg/ml) for 10, 30, or 60 min and lysed for western blot. Expression of phospho-IκB-α, respective IκB-α, NF-κB p65, phospho-Erk1/2 and respective Erk1/2 was assessed with β-actin as a loading control. Data are representative of two independent experiments.
Figure 5—figure supplement 2
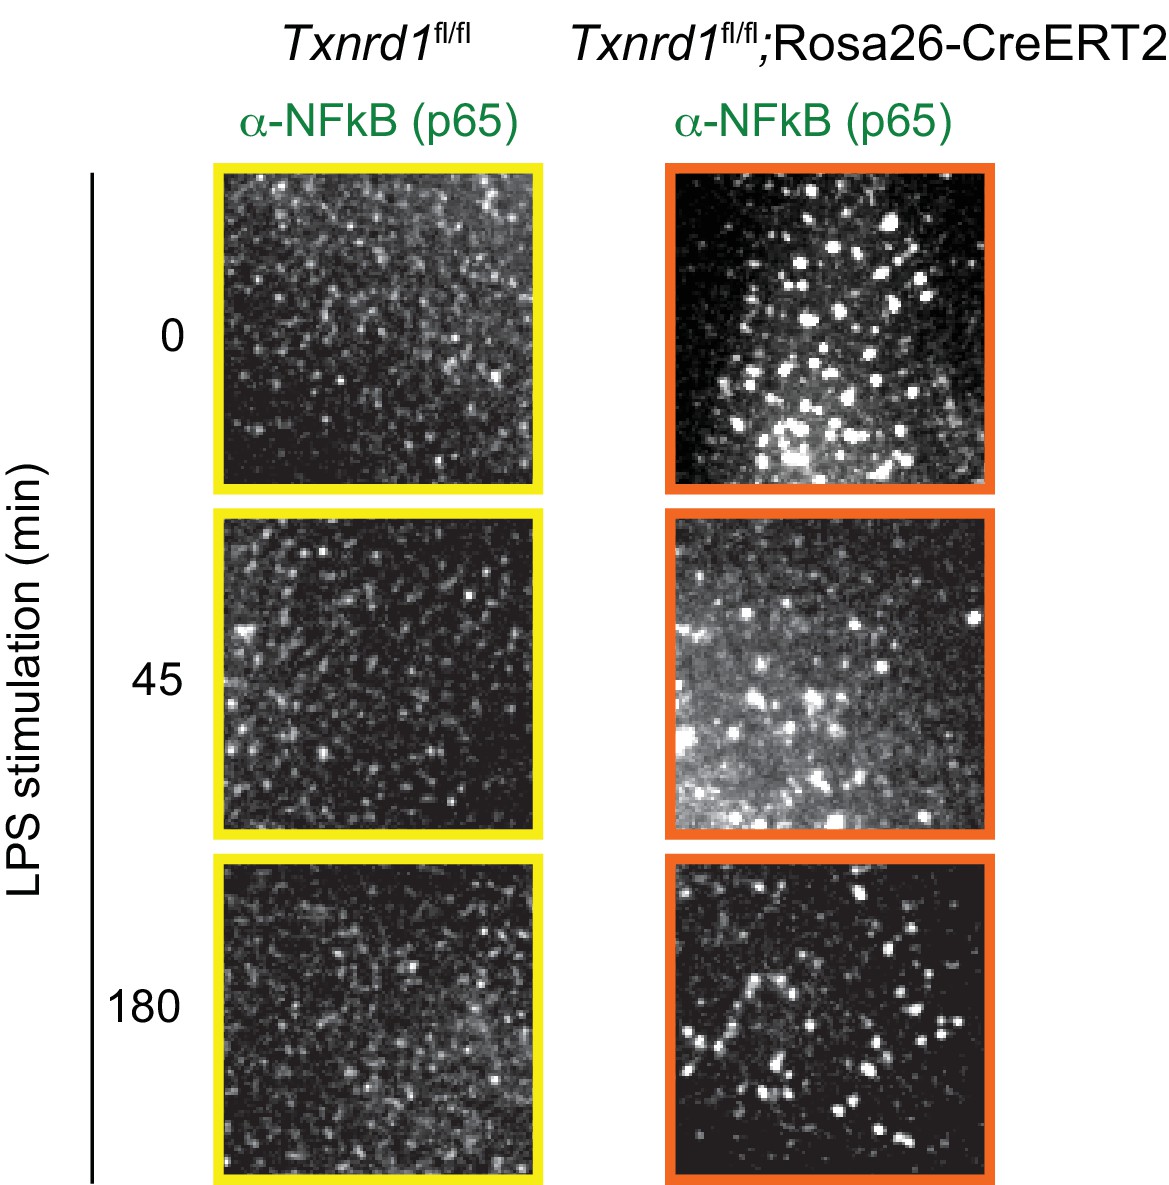
Magnification of the microscopy images of Figure 5C.
The highlighted areas in anti-NF-κB channels in Figure 5C are shown here in higher magnification.
Figure 5—figure supplement 3
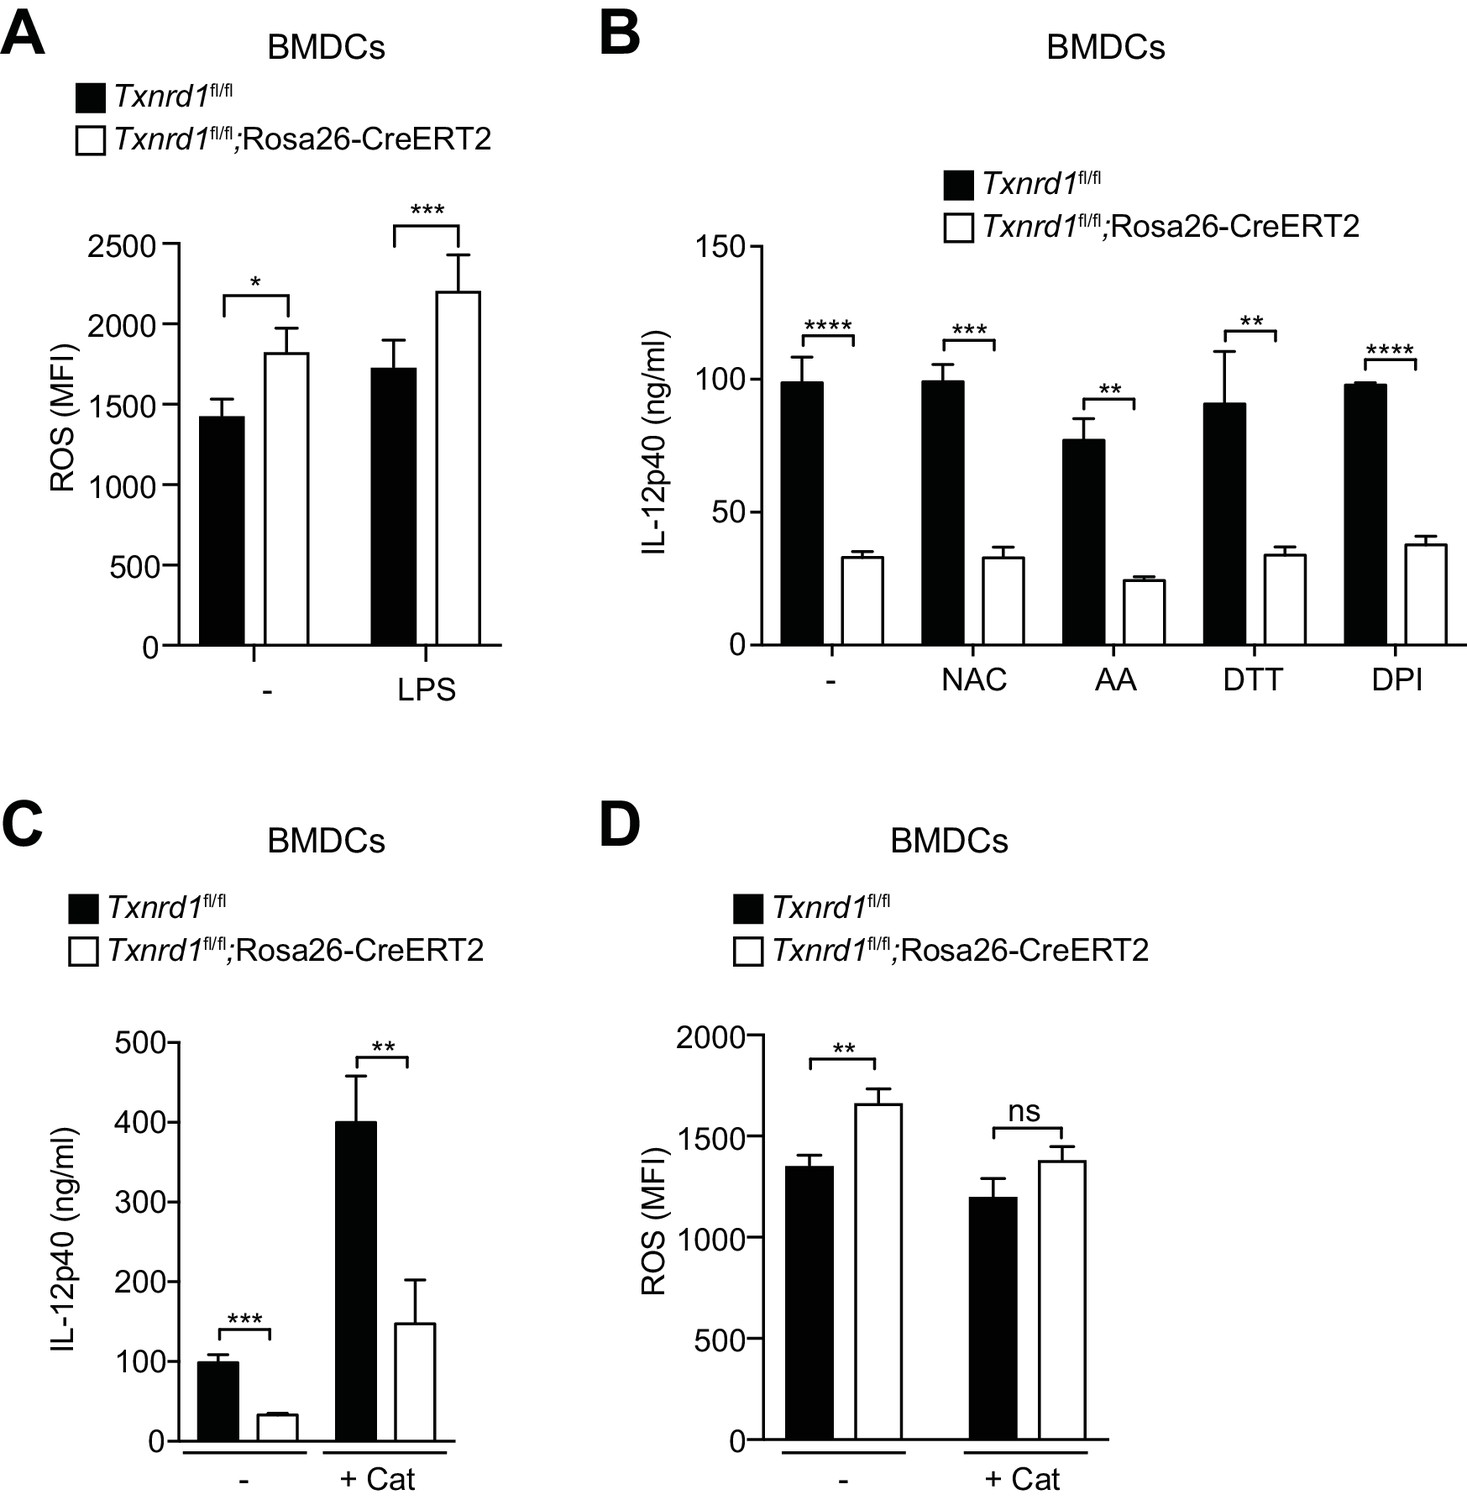
Antioxidant supplementation does not rescue IL-12p40 cytokine production in Txnrd1-deficient BMDCs.
Txnrd1fl/fl;Rosa26-CreERT2 mice and Txnrd1fl/fl littermates were injected with TAM to delete the Txnrd1 gene, and bone marrow cells were differentiated with GM-CSF to obtain BMDCs. (A) Quantification of ROS levels in unstimulated BMDCs as control or after 4 hr of stimulation with LPS (400 ng/ml) stained with CM-H2DCFDA via flow cytometry (n = 2 for the untreated group and n = 4 for the LPS-treated group). (B, C) BMDCs were then treated overnight with the antioxidants N-acetyl-L-cysteine (NAC; 0.9 mM), ascorbic acid (AA; 5 μM), DL-dithiothreitol (DTT; 1000 μM), diphenyleneiodonium chloride (DPI; 62.5 nM) (B) or catalase-polyethylene glycol (Cat; 250 U/ml) (C) before stimulation with R837 (5 ng/ml) for 7 hr. The concentration of IL-12p40 in supernatants was subsequently determined by ELISA (n = 3). (D) BMDCs were treated overnight with the antioxidant catalase-polyethylene glycol (Cat) before stimulation with LPS (400 ng/ml) for 3 hr. Shown are the ROS levels measured by staining with CM-H2DCFDA (n = 3). Bar graphs represent mean + standard deviation. Data are representative two independent experiments. For each panel, a representative experiment with replicates of in vitro culture conditions is shown. Student's t test (two-tailed, unpaired) was used for two-groups analysis (A–D): *p≤0.05; **p≤0.01; ***p≤0.001; ****p≤0.0001.
Figure 6 with 3 supplements
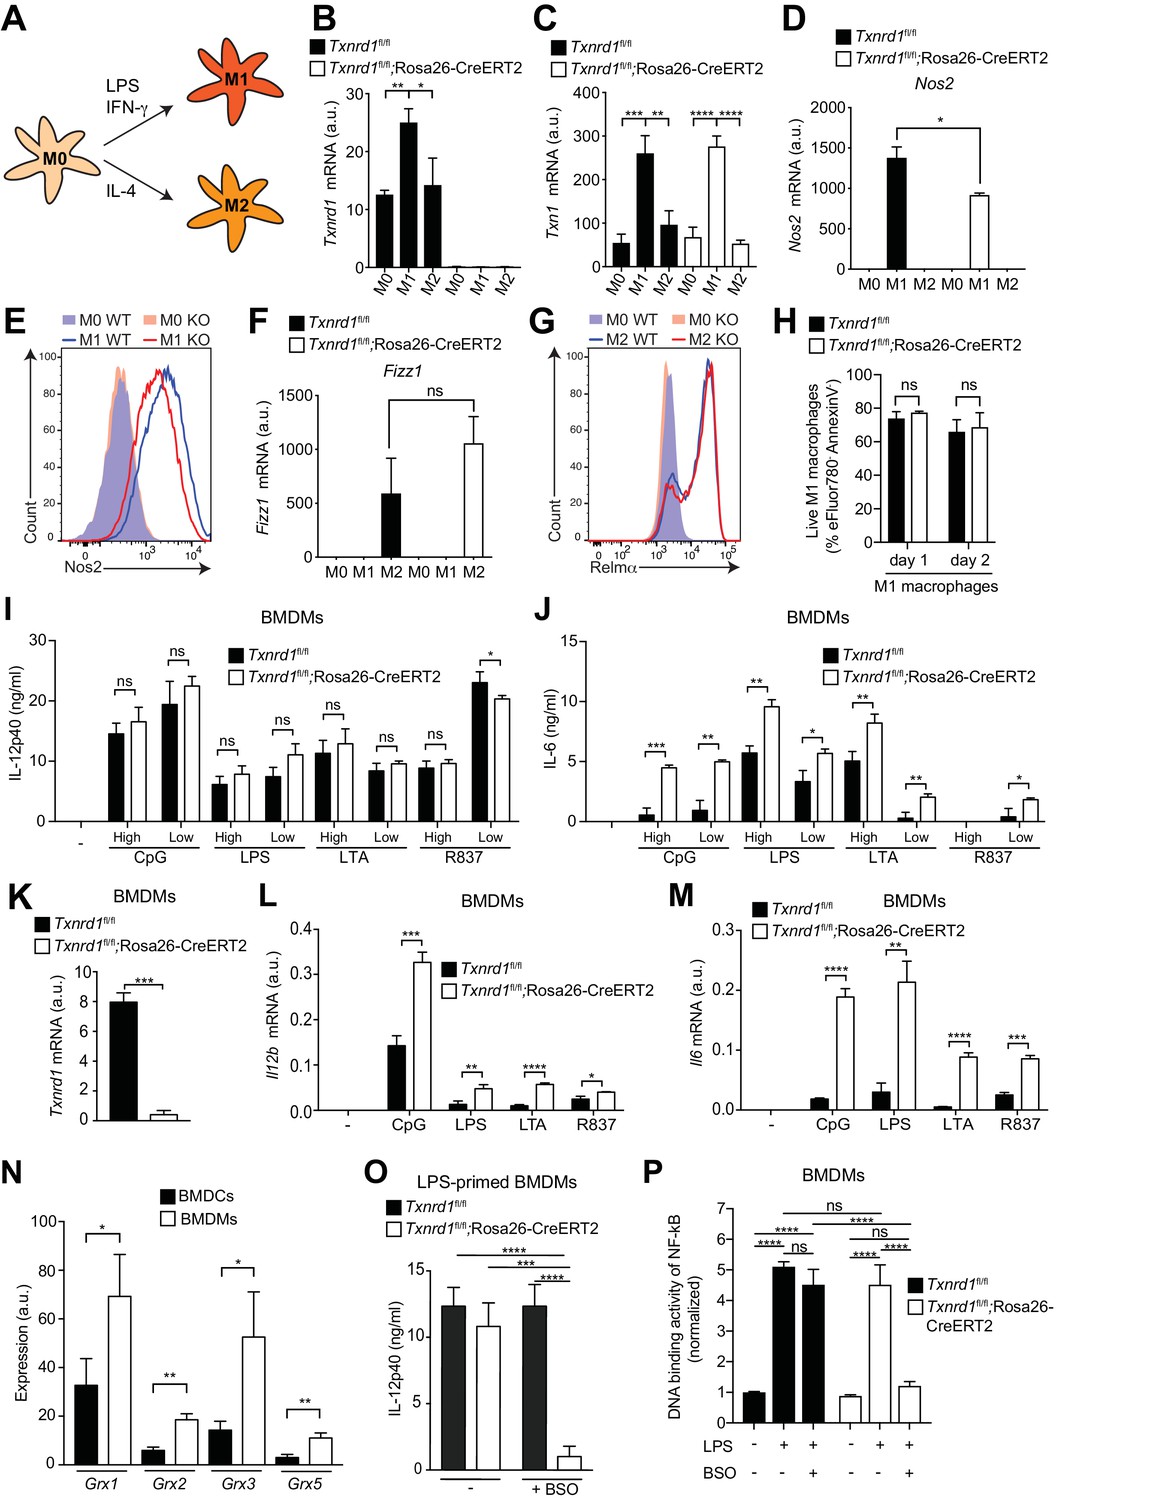
The Trx1 system is critical for proper M1 polarization but dispensable for promoting NF-κB binding to target DNA in BMDMs.
(A–P) Bone marrows from Txnrd1fl/fl;Rosa26-CreERT2 mice and control Txnrd1fl/fl littermates treated with TAM were differentiated with M-CSF to obtain BMDMs. (A–H) BMDMs were polarized toward M1 and M2 with LPS/IFN-γ and IL-4, respectively, or left untreated (M0). (A) Schematic showing the polarization assay. (B, C) Shown are the expression levels of Txnrd1 (B) and Txn1 (C) at the mRNA level determined by RT-PCR (n = 3). (D, E) Depicted is the level of the M1 marker Nos2 at the mRNA level determined by RT-PCR (D); n = 3) and at the protein level assessed by flow cytometry (E). (F, G) Shown is the level of the M2 marker Relmα at the mRNA level (Fizz1) determined by RT-PCR (F); n = 3) and at the protein level assessed by flow cytometry (G). (H) Cell survival of M1 macrophages (eFluor780-Annexin-V-) polarized either for 1 or 2 days with LPS/IFN-γ was assessed via flow cytometry (n = 3). (I, J) BMDMs were stimulated for 7 hr with CpG (400, 100 nM), LPS (100, 20 ng/ml), LTA (5, 1 μg/ml), or R837 (5, 1 μg/ml), and IL-12p40 (I) and IL-6 (J) were measured in supernatants by ELISA. ‘High’ and ‘Low’ indicate the concentration of the utilized stimulus (n = 3). (K) Analysis of Txnrd1 mRNA in BMDMs assessed by RT-PCR for confirmation of gene deletion (n = 3). (L, M) Shown is the mRNA expression of Il12b (L) and Il6 (M) determined via RT-PCR in BMDMs stimulated for 7 hr with CpG (100 nM), LPS (100 ng/ml), LTA (1 μg/ml) or R837 (5 μg/ml; n = 3). (N) Shown are the expression levels of the indicated Grx isoforms in WT BMDCs and BMDMs (n = 3). (O) BMDMs were treated overnight with BSO (3 μM) before stimulation with LPS (400 ng/ml) for 7 hr. The concentration of IL-12p40 in supernatants was subsequently determined by ELISA (n = 3). (P) Shown is the DNA binding activity of NF-κB p65 in nuclear extracts from Txnrd1fl/fl;Rosa26-CreERT2 and control Txnrd1fl/fl BMDMs treated overnight with 3 μM BSO (or medium as a control) before stimulation with LPS (400 ng/ml) for 90 min (n = 3). Bar graphs represent mean + standard deviation. Data are representative of two (B–H, K–P) or three (I, J) independent experiments. For each panel, a representative experiment with replicates of in vitro culture conditions is shown (B–D, F, H–P). One-way ANOVA adjusted by Tukey’s multiple comparison test was used in B-D, F, O, P: *p≤0.0332; **p≤0.0021; ***p≤0.0002; ****p≤0.0001; ns, not significant. Student's t test (two-tailed, unpaired) was used for two-group analysis in H–N: *p≤0.05; **p≤0.01; ***p≤0.001; ****p≤0.0001; ns, not significant.
Figure 6—figure supplement 1
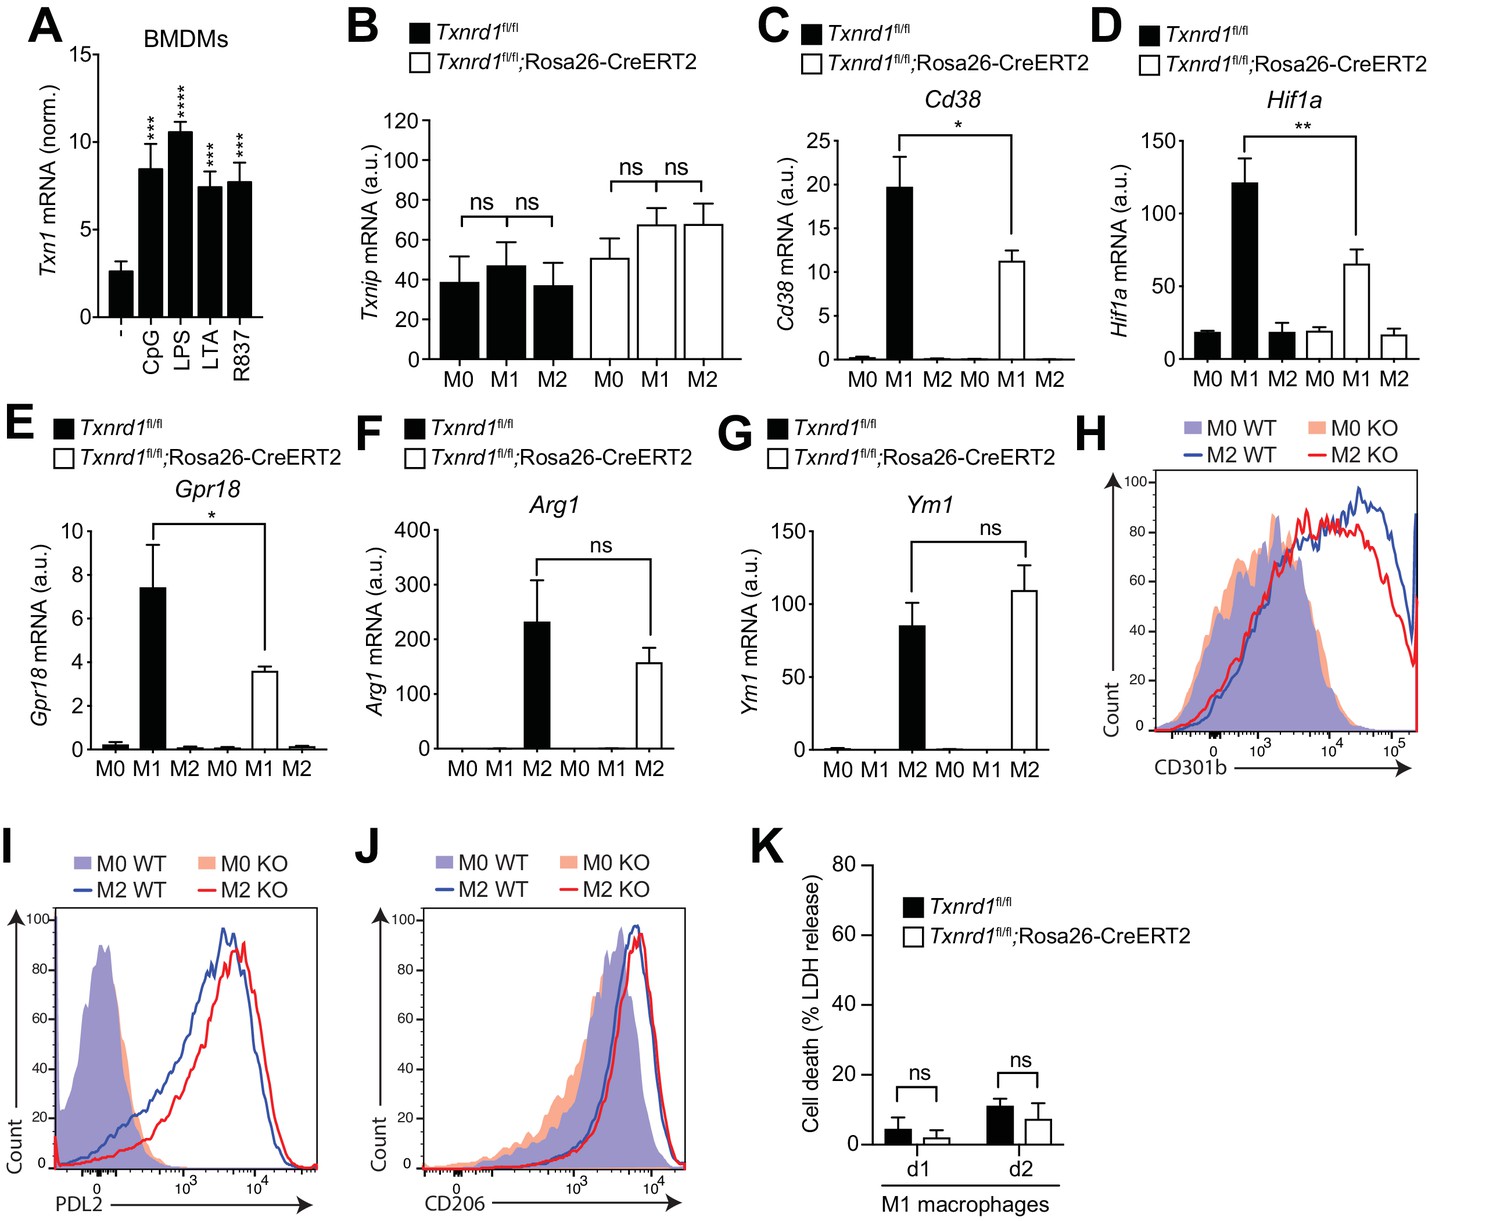
The Trx1 system promotes M1 but not M2 macrophage polarization.
(A–K) Bone marrows from Txnrd1fl/fl;Rosa26-CreERT2 mice and control Txnrd1fl/fl littermates treated with TAM were differentiated with M-CSF to obtain BMDMs. (A) Shown are the expression levels of Txn1 in WT BMDMs upon stimulation with CpG (100 nM), LPS (100 ng/ml), LTA (1 μg/ml) or R837 (5 μg/ml; n = 3). (B–K) BMDMs were polarized toward M1 and M2 with LPS/IFN-γ and IL-4, respectively, or left untreated (M0). (B) Shown is the expression levels of Txnip at the mRNA level determined by RT-PCR (n = 3). (C–E) Depicted are the levels of the M1 markers Cd38 (C), Hif1a (D) and Gpr18 (E) at the mRNA level determined by RT-PCR (n = 3). (F–J) Shown are the levels of the M2 markers Arg1 (F) and Ym1 (G) at the mRNA level determined by RT-PCR (n = 3), and of CD301b (H), PDL2 (I) and CD206 (J) at the protein level assessed by flow cytometry. (K) Lactate dehydrogenase (LDH) release into culture supernatant after 1 or 2 days of LPS/IFN-γ (M1) polarization (n = 4). Bar graphs represent mean + standard deviation. Data are representative of two independent experiments, and a representative experiment with replicates of in vitro culture conditions is shown for each panel. One-way ANOVA followed by Dunnett’s correction was used in A (comparison to the unstimulated control): ***p≤0.0002; ****p≤0.0001. One-way ANOVA adjusted by Tukey’s multiple comparison test was used in B–G: *p≤0.0332; **p≤0.0021; ***p≤0.0002; ****p≤0.0001; ns, not significant. Student's t test (two-tailed, unpaired) was used in K: *p≤0.05; ns, not significant.
Figure 6—figure supplement 2
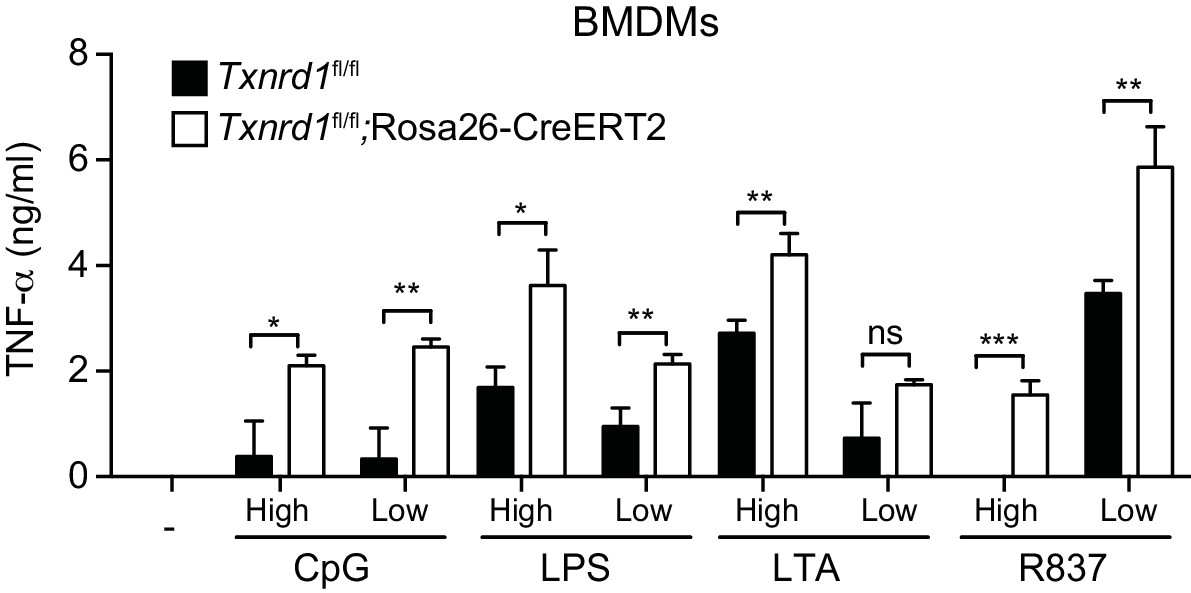
Txnrd1 deficiency does not impair TNF-α production.
Bone marrows from Txnrd1fl/fl;Rosa26-CreERT2 mice and control Txnrd1fl/fl littermates treated with TAM were differentiated with M-CSF to obtain BMDMs. BMDMs were then stimulated for 7 hr with CpG (400, 100 nM), LPS (100, 20 ng/ml), LTA (5, 1 μg/ml), or R837 (5, 1 μg/ml). ‘High’ and ‘Low’ indicate the concentration of the utilized stimulus. TNF-α was measured in supernatants by ELISA (n = 3). Bar graphs represent mean + standard deviation. Data are representative of three independent experiments, and a representative experiment with triplicates of in vitro culture conditions is shown for each panel. Student's t test (two-tailed, unpaired) was used for two-group analysis: *p≤0.05; **p≤0.01; ***p≤0.001; ****p≤0.0001; ns, not significant.
Figure 6—figure supplement 3

The GSH/Grx system compensates for the absence of the Trx1 pathway during IL-12p40 production by Txnrd1-deficient BMDMs.
Bone marrows from Txnrd1fl/fl;Rosa26-CreERT2 mice and control Txnrd1fl/fl littermates treated with TAM were differentiated with M-CSF to obtain BMDMs. (A) BMDMs were treated overnight with BSO (3 μM) before addition of LTA (5 μg/ml) for 7 hr stimulation. The concentration of IL-12p40 in supernatants was subsequently determined by ELISA. Bar graphs represent mean + standard deviation (n = 3). (B) Representative FACS plots quantifying the viability of Txnrd1fl/fl;Rosa26-CreERT2 and control Txnrd1fl/f BMDMs treated with indicated concentrations of BSO via eFluor780 staining; the gate in the FACS plots indicates the viable cells. Data are representative of two independent experiments. One-way ANOVA adjusted by Tukey’s multiple comparison test was used in A: ****p≤0.0001.
Figure 7 with 5 supplements
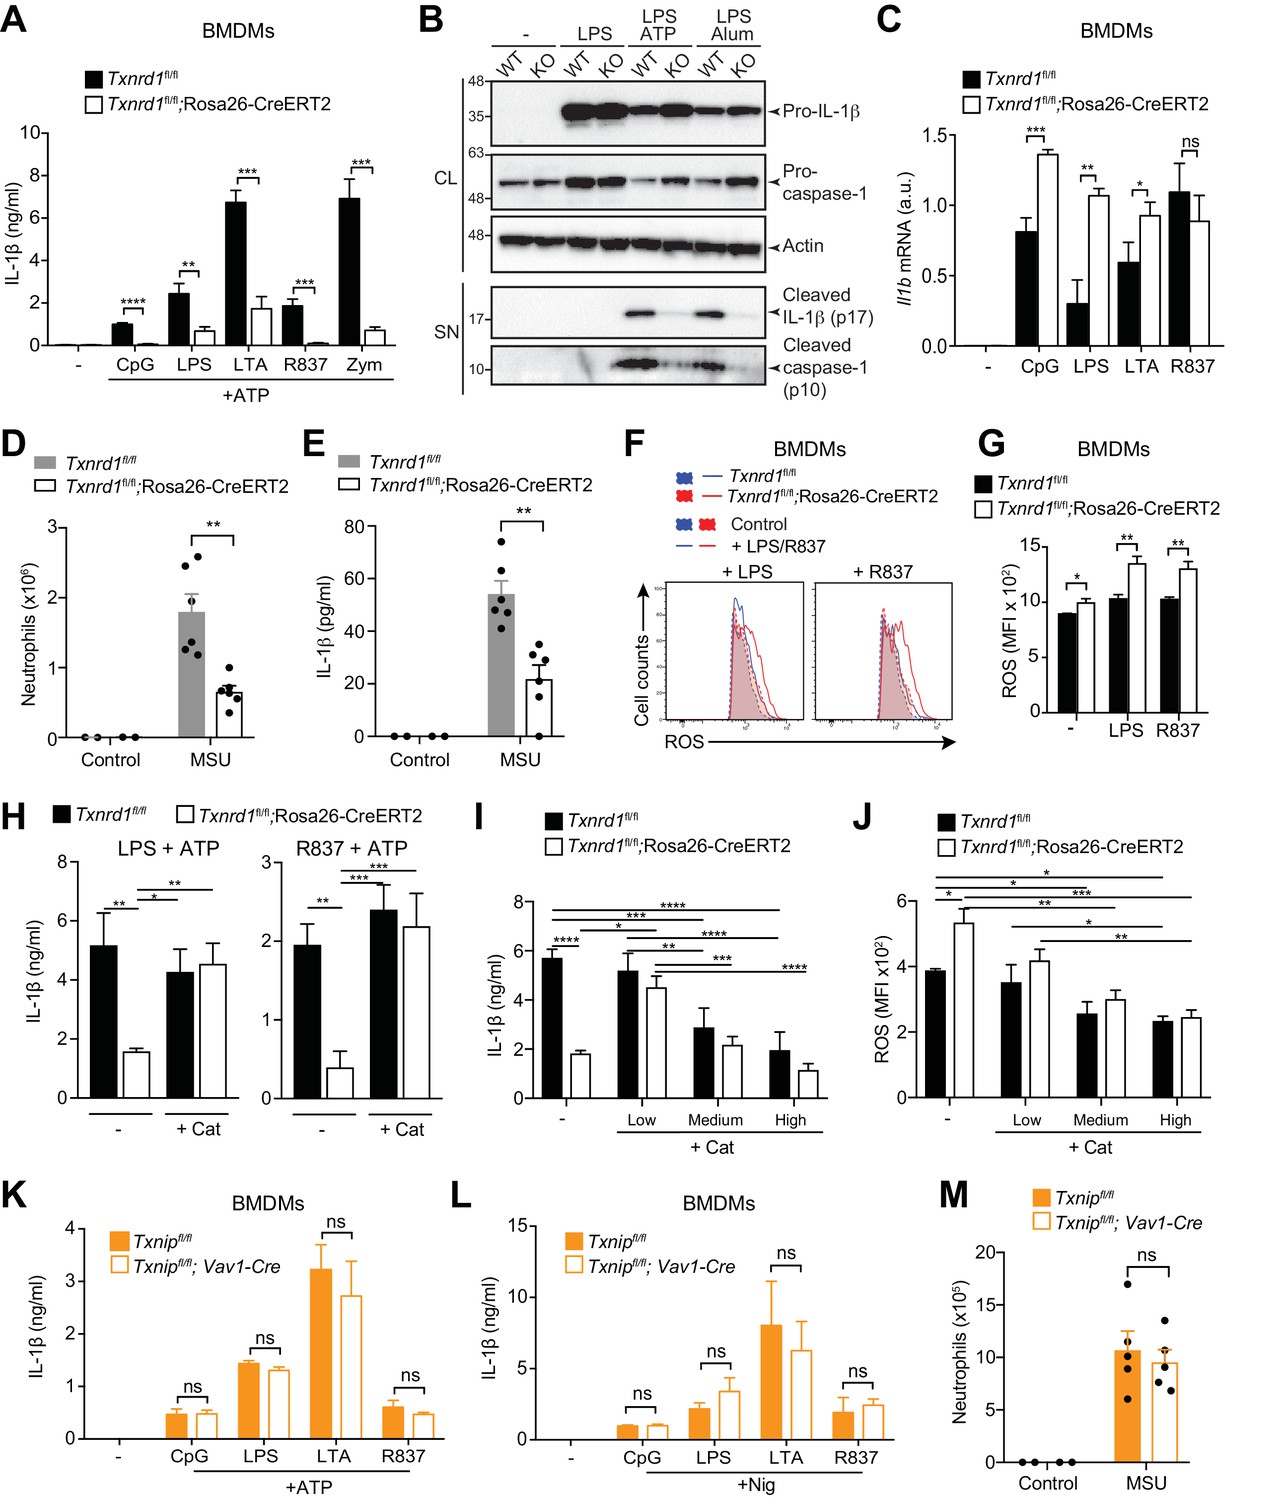
Trx1 but not Txnip promotes NLRP3-dependent IL-1β responses.
(A–C, F–L) Bone marrows from the indicated genotypes (from TAM-treated Txnrd1fl/fl;Rosa26-CreERT2 and control Txnrd1fl/fl littermates or from Txnipfl/fl;Vav1-Cre and Txnipfl/fl control mice) were differentiated with M-CSF to obtain BMDMs. (A) Txnrd1-deficient and control BMDMs were primed with CpG (100 nM), LPS (400 ng/ml), LTA (5 μg/ml), R837 (5 μg/ml) or zymosan (10 μg/ml) before stimulation with 2 mM ATP for 1 hr. The concentration of IL-1β in supernatants was then determined by ELISA (n = 3). (B) Txnrd1fl/fl (WT) and Txnrd1fl/fl;Rosa26-CreERT2 (KO) BMDMs were primed with LPS (400 ng/ml) before stimulation with 2 mM ATP or 200 μg/ml alum. Levels and processing of IL-1β and caspase-1 in the cell lysate (CL) and supernatant (SN) were assessed by western blot with β-actin as a loading control. (C) Txnrd1-deficient and control BMDMs were stimulated with CpG (100 nM), LPS (100 ng/ml), LTA (1 μg/ml), R837 (5 μg/ml) for 7 hr, and expression of Il1b at the mRNA level was determined via RT-PCR (n = 3). (D, E) TAM-treated Txnrd1fl/fl;Rosa26-CreERT2 and control Txnrd1fl/fl littermates were intraperitoneally injected with MSU crystals, and peritoneal lavage fluid was collected 8 hr later. Depicted are the total counts of infiltrating neutrophils (D) and the IL-1β levels measured by ELISA (E); n = 2 mice for controls, and n = 6 mice for MSU-treated groups). (F, G) Quantification of ROS levels in unstimulated BMDMs as control or after 4 hr of stimulation with LPS (400 ng/ml) or R837 (5 μg/ml) stained with CM-H2DCFDA via flow cytometry. Representative FACS plots (F) and mean fluorescence intensities (MFI; G) are shown (n = 3). (H) BMDMs were treated overnight with the antioxidant catalase-polyethylene glycol (Cat; 62.5 U/ml) before priming with LPS (400 ng/ml; left) or R837 (5 μg/ml; right) followed by stimulation with ATP. The secreted IL-1β was determined by ELISA (n = 3). (I, J) BMDMs were treated overnight with the antioxidant catalase-polyethylene glycol (Cat; ‘low’ is 62.5 U/ml; ‘medium’ is 250 U/ml; ‘high’ is 1000 U/ml) before stimulation (n = 3). (I) IL-1β secretion after priming with LPS (400 ng/ml) and stimulation with ATP was determined by ELISA. (J) Quantification of ROS levels after 4 hr of stimulation with LPS (400 ng/ml) was performed by flow cytometric staining with CM-H2DCFDA. (K, L) Txnip-deficient and control BMDMs were primed with CpG (100 nM), LPS (400 ng/ml), LTA (5 μg/ml), or R837 (5 μg/ml) before stimulation with 2 mM ATP (K) or 15 μM nigericin (Nig; L) for 1 hr. The concentration of IL-1β in supernatants was determined by ELISA (n = 3). (M) Txnipfl/fl;Vav1-Cre and Txnipfl/fl control mice were intraperitoneally injected with MSU crystals, and peritoneal lavage fluid was collected 8 hr later. Shown are the total counts of infiltrating neutrophils (n = 2 mice for controls, and n = 5 mice for MSU-treated groups). Bar graphs represent mean + standard deviation, and dots in the plots indicate individual mice. Data are representative of four (A), two (B–J, M), or three (K, L) independent experiments. For each panel, a representative experiment with either biological replicates (D, E, M) or replicates of in vitro culture conditions (A, C, G–L) is shown. Student's t test (two-tailed, unpaired) was used for two-groups analysis (A, C, G, K, L): *p≤0.05; **p≤0.01; ***p≤0.001; ****p≤0.0001; ns, not significant. One-way ANOVA adjusted by Tukey’s multiple comparison test was used in D, E, H-J, M: *p≤0.0332; **p≤0.0021; ***p≤0.0002; ****p≤0.0001. Legends for Figure supplements.
Figure 7—figure supplement 1
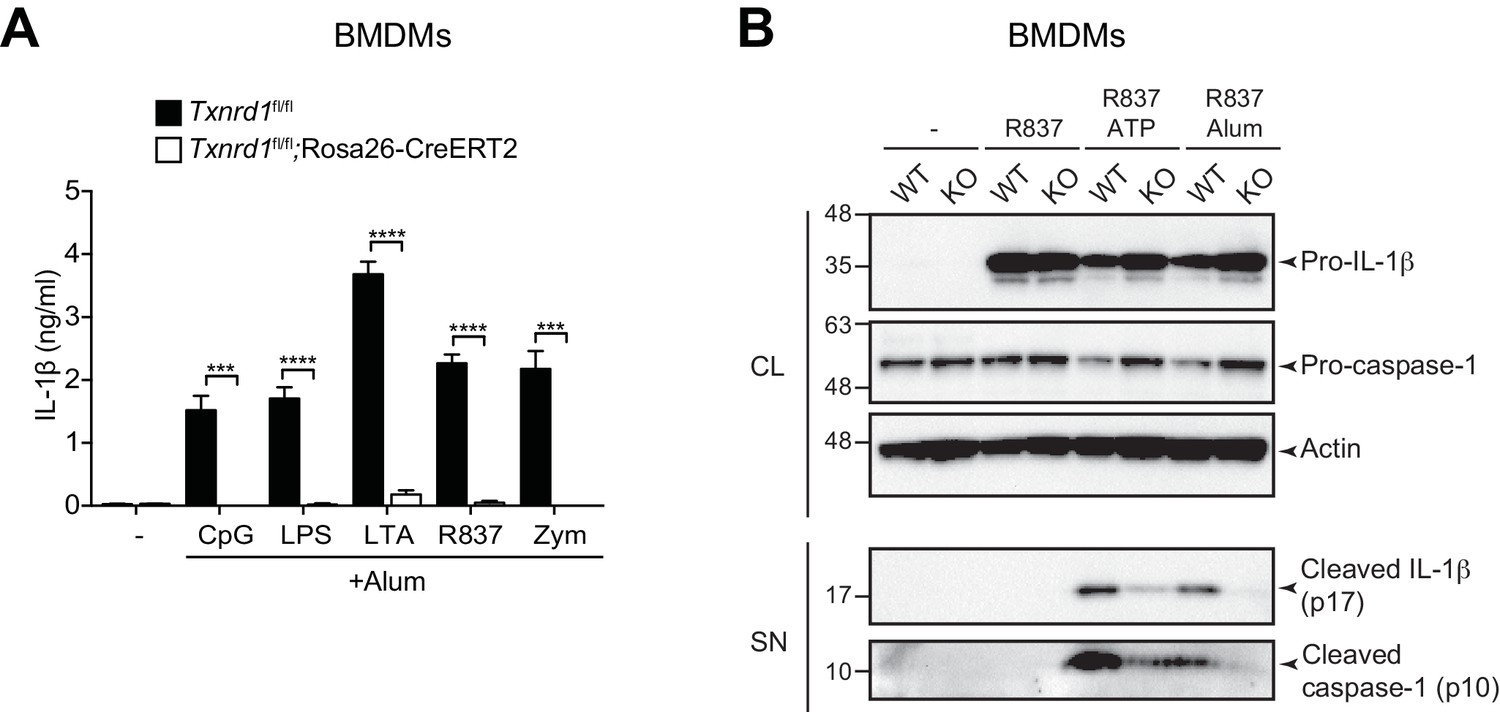
The Trx1 system is required for NLRP3 inflammasome responses.
(A, B) Bone marrows from Txnrd1fl/fl;Rosa26-CreERT2 mice (KO) and control Txnrd1fl/fl littermates (WT) treated with TAM were differentiated with M-CSF to obtain BMDMs. (A) Txnrd1-deficient and control BMDMs were primed with CpG (100 nM), LPS (400 ng/ml), LTA (5 μg/ml), R837 (5 μg/ml) or zymosan (10 μg/ml) before stimulation with 200 μg/ml alum for 4 hr. The concentration of IL-1β in supernatants was then determined by ELISA (n = 3). (B) BMDMs were primed with R837 (5 μg/ml) before stimulation with 2 mM ATP or 200 μg/ml alum. Levels and processing of IL-1β and caspase-1 in the cell lysate (CL) and supernatant (SN) were assessed by western blot with β-actin as a loading control. Data are representative of two independent experiments. A representative experiment with replicates of in vitro culture conditions is shown (A). Student's t test (two-tailed, unpaired) was used for two-groups analysis (A): ***p≤0.001; ****p≤0.0001.
Figure 7—figure supplement 2
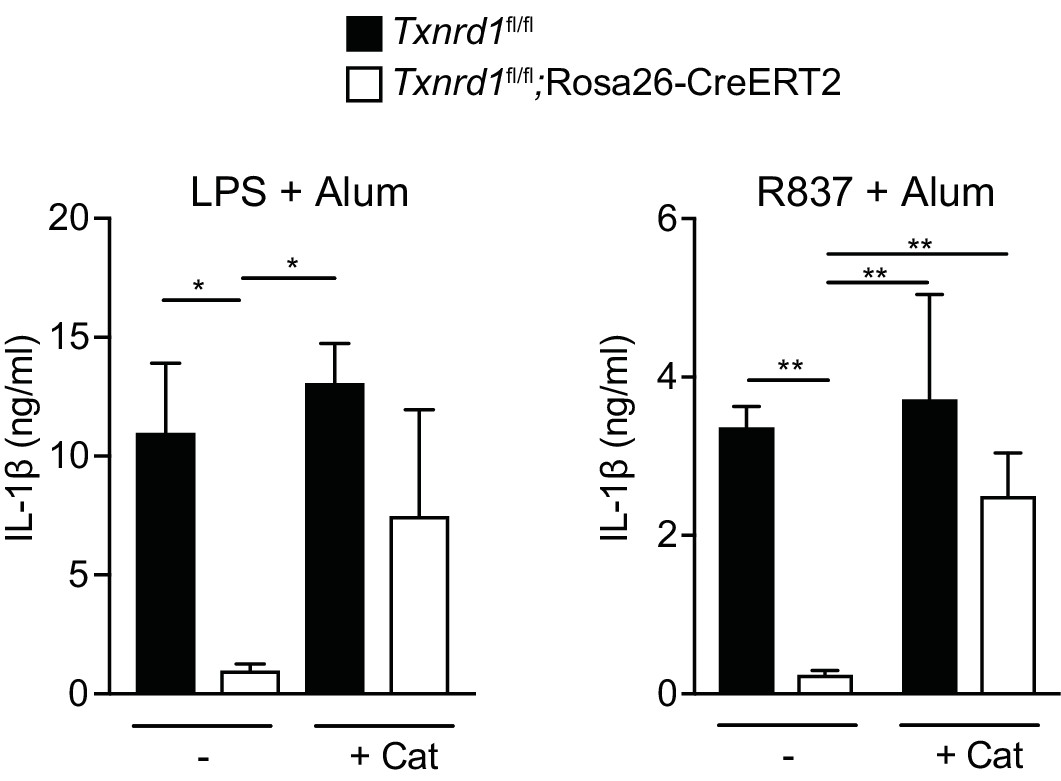
Catalase treatment restores IL-1β production in the absence of the Trx1 system.
Bone marrows from TAM-treated Txnrd1fl/fl;Rosa26-CreERT2 and control Txnrd1fl/fl littermates were differentiated with M-CSF to obtain BMDMs. BMDMs were then treated overnight with the antioxidant catalase-polyethylene glycol (Cat; 62.5 U/ml) before priming with LPS (400 ng/ml; left) or R837 (5 μg/ml; right) followed by stimulation with alum. The secreted IL-1β was determined by ELISA (n = 3).
Figure 7—figure supplement 3
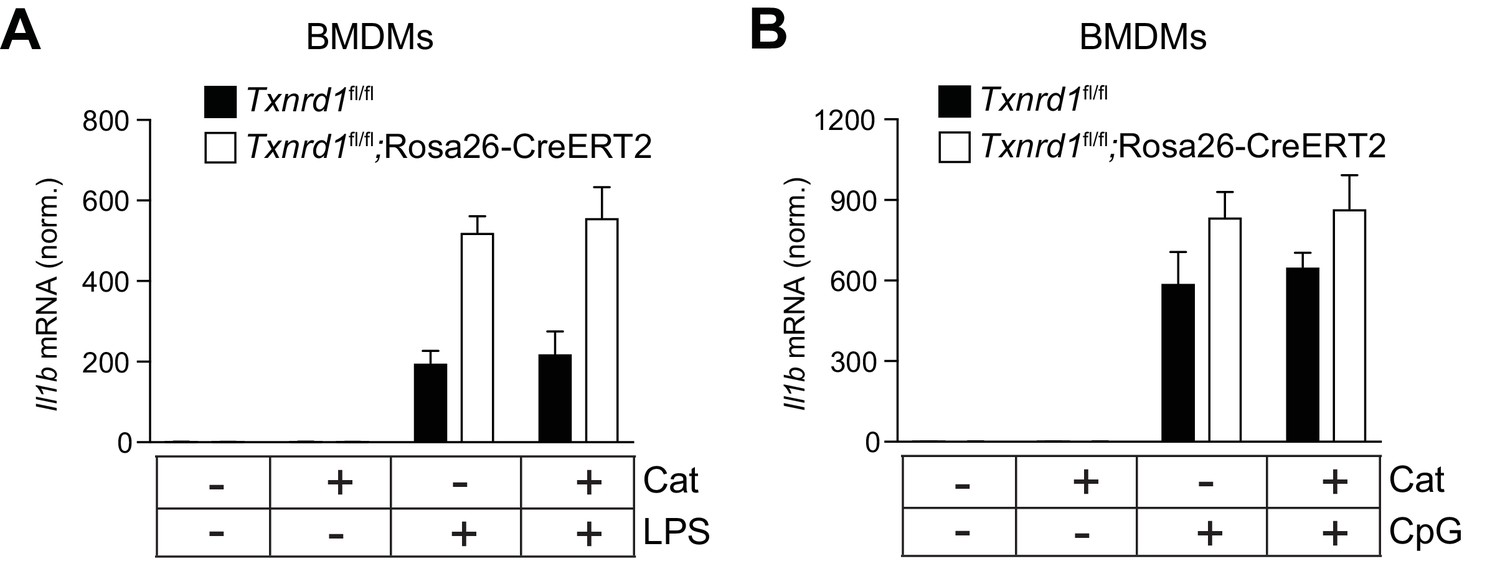
Catalase treatment does not affect transcriptional IL-1β levels.
Bone marrows from Txnrd1fl/fl;Rosa26-CreERT2 mice and control Txnrd1fl/fl littermates treated with TAM were differentiated with M-CSF to obtain BMDMs. (A, B) BMDMs were treated overnight with the antioxidant catalase-polyethylene glycol (Cat; 62.5 U/ml) before priming with LPS (400 ng/ml; A) or CpG (100 nM; B) for 7 hr. Expression of Il1b at the mRNA level was determined via RT-PCR (n = 3, replicates of in vitro culture conditions). Bar graphs represent mean + standard deviation.
Figure 7—figure supplement 4
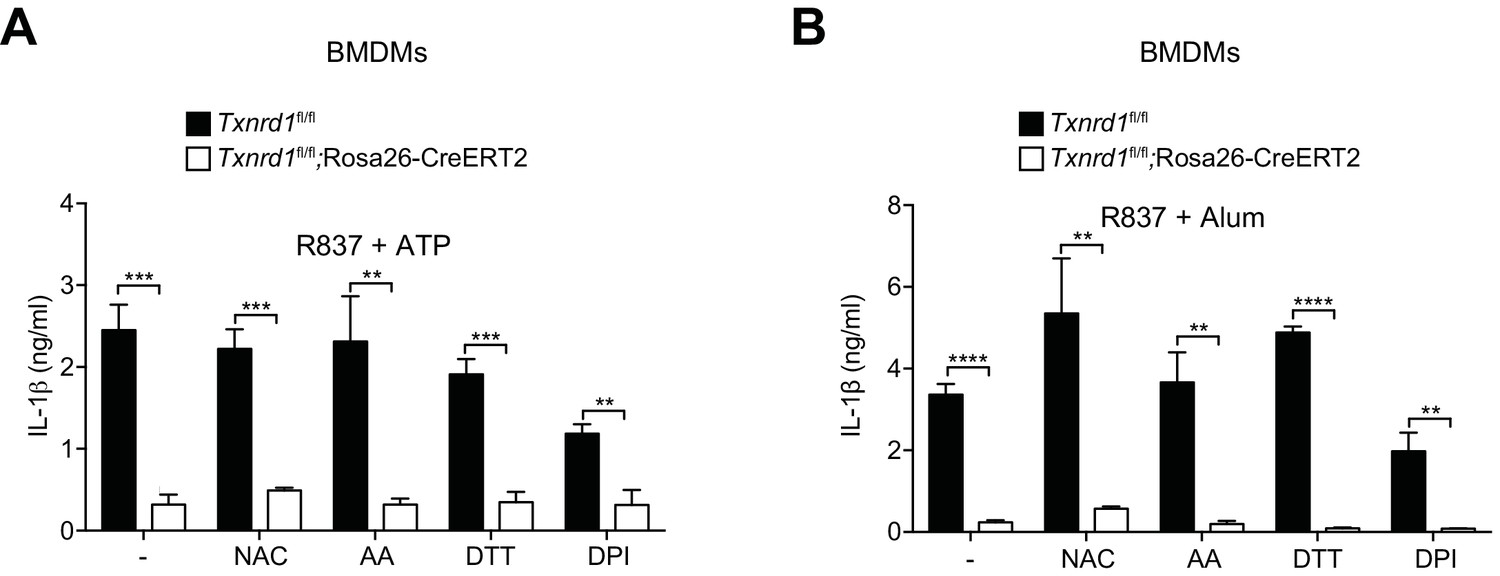
Supplementation with the indicated antioxidants does not restore IL-1β production in the absence of the Trx1 system in BMDMs.
Bone marrows from Txnrd1fl/fl;Rosa26-CreERT2 mice and control Txnrd1fl/fl littermates treated with TAM were differentiated with M-CSF to obtain BMDMs. (A, B) Txnrd1-deficient and control BMDMs were treated overnight with the antioxidants N-acetyl-L-cysteine (NAC; 0.9 mM), ascorbic acid (AA; 1.25 μM), DL-dithiothreitol (DTT; 62.5 μM), diphenyleneiodonium chloride (DPI; 1000 nM) before priming with R837 (5 μg/ml) and subsequently stimulated with either 2 mM ATP (A) or 200 μg/ml alum (B). The concentration of IL-1β in supernatants was subsequently determined by ELISA (n = 3). Bar graphs represent mean + standard deviation. Data are representative of two independent experiments, and a representative experiment with triplicates of in vitro culture conditions is shown for each panel. Student's t test (two-tailed, unpaired) was used for two-groups analysis: *p≤0.05; **p≤0.01; ***p≤0.001; ****p≤0.0001.
Figure 7—figure supplement 5
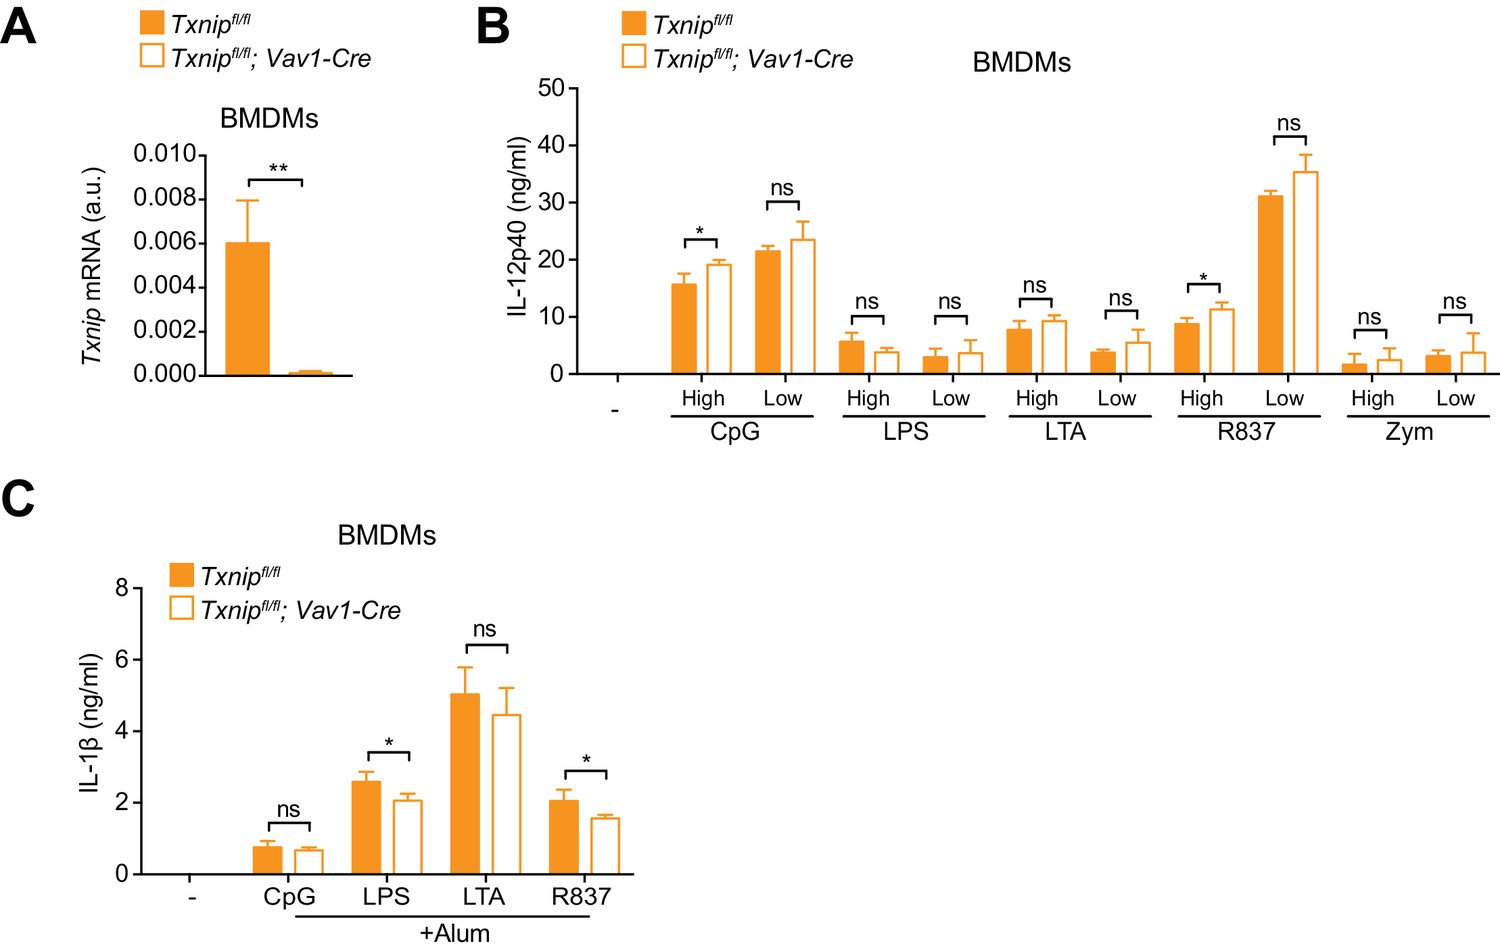
Txnip deficiency does not affect cytokine secretion in BMDMs.
Bone marrows from Txnipfl/fl;Vav1-Cre mice and Txnipfl/fl control littermates were differentiated with M-CSF to obtain BMDMs. (A) Depicted is the analysis of Txnip mRNA in BMDMs determined by RT-PCR (n = 3). (B) Txnip-deficient and control BMDMs were stimulated with CpG (400, 100 nM), LPS (400, 100 ng/ml), LTA (5, 1 μg/ml), R837 (5, 1 μg/ml), or zymosan (10, 2 μg/ml), and IL-12p40 in supernatants was determined by ELISA. ‘High’ and ‘Low’ indicate the concentration of the utilized stimulus (n = 3). (C) Txnip-deficient and control BMDMs were primed with CpG (100 nM), LPS (400 ng/ml), LTA (5 μg/ml), or R837 (5 μg/ml) before stimulation with 200 μg/ml alum for 4 hr. The concentration of IL-1β in supernatants was determined by ELISA (n = 3). Bar graphs represent mean + standard deviation. Data are representative of two (A) or three (B, C) independent experiments, and a representative experiment with triplicates of in vitro culture conditions is shown for each panel. Student's t test (two-tailed, unpaired) was used for two-groups analysis (A–C): *p≤0.05; **p≤0.01; ns, not significant.
Tables
Key resources table
| Reagent type (species) or resource | Designation | Source or reference | Identifiers | Additional information |
|---|---|---|---|---|
| Genetic reagent (M. musculus) | C57BL/6J | The Jackson Laboratory | Cat#JAX:000664; RRID: IMSR_JAX:000664 | |
| Genetic reagent (M. musculus) | B6 Ptprca (CD45.1) | The Jackson Laboratory | Cat#JAX:002014, RRID:IMSR_JAX:002014 | |
| Genetic reagent (M. musculus) | Txnrd1fl/fl | PMID: 15713651 | Kindly provided by Marcus Conrad | |
| Genetic reagent (M. musculus) | Rosa26-CreERT2 | PMID: 17456738 | ||
| Genetic reagent (M. musculus) | Txnipfl/fl | The Jackson Laboratory | Cat# JAX:016847, RRID:IMSR_JAX:016847 | |
| Genetic reagent (M. musculus) | Vav1-Cre | PMID: 12548562 | ||
| Antibody | Anti-B220 PerCP-conjugated (rat, monoclonal) | Biolegend | Cat# 103234, RRID:AB_893353 | Flow cytometry, cell surface (1:400) |
| Antibody | Anti-CD103 FITC-conjugated (armenian hamster, monoclonal) | Biolegend | Cat# 121420, RRID:AB_10714791 | Flow cytometry, cell surface (1:200) |
| Antibody | Anti-CD11b BV605-conjugated (rat, monoclonal) | Biolegend | Cat# 101237, RRID:AB_11126744 | Flow cytometry, cell surface (1:2000) |
| Antibody | Anti-CD11b PerCP-Cy5.5-conjugated (rat, monoclonal) | Biolegend | Cat# 101228, RRID:AB_893232 | Flow cytometry, cell surface (1:1000) |
| Antibody | Anti-CD11c APC-conjugated (armenian hamster, monoclonal) | Thermo Fisher Scientific | Cat# 17-0114-82, RRID:AB_469346 | Flow cytometry, cell surface (1:300) |
| Antibody | Anti-CD11c BV605-conjugated (armenian hamster, monoclonal) | Biolegend | Cat# 117333, RRID:AB_11204262 | Flow cytometry, cell surface (1:1000) |
| Antibody | Anti-CD11c PE-Cy7-conjugated (armenian hamster, monoclonal) | Biolegend | Cat# 117318, RRID:AB_493568 | Flow cytometry, cell surface (1:500) |
| Antibody | Anti-CD19 BV650-conjugated (rat, monoclonal) | Biolegend | Cat# 115541, RRID:AB_11204087 | Flow cytometry, cell surface (1:500) |
| Antibody | Anti-CD206 PerCP-Cy5.5-conjugated (rat, monoclonal) | Biolegend | Cat# 141716, RRID:AB_2561992 | Flow cytometry, intracellular (1:400) |
| Antibody | Anti-PD-L2 PE-conjugated (rat, monoclonal) | Biolegend | Cat# 107206, RRID:AB_2162011 | Flow cytometry, cell surface (1:400) |
| Antibody | Anti-CD301b PE-Cy7-conjugated (rat, monoclonal) | Biolegend | Cat# 146808, RRID:AB_2563390 | Flow cytometry, cell surface (1:600) |
| Antibody | Anti-CD4 PerCP-Cy5.5-conjugated (rat, monoclonal) | Biolegend | Cat# 100540, RRID:AB_893326 | Flow cytometry, cell surface (1:500) |
| Antibody | Anti-CD45 BV785-conjugated (rat, monoclonal) | Biolegend | Cat# 103149, RRID:AB_2564590 | Flow cytometry, cell surface (1:1000) |
| Antibody | Anti-CD45.1 APC-conjugated (mouse, monoclonal) | Biolegend | Cat# 110714, RRID:AB_313503 | Flow cytometry, cell surface (1:100) |
| Antibody | Anti-CD45.1 biotin-conjugated (mouse, monoclonal) | BD Biosciences | Cat# 553774, RRID:AB_395042 | Flow cytometry, cell surface (1:200) |
| Antibody | Anti-CD45.2 APC-conjugated (mouse, monoclonal) | Thermo Fisher Scientific | Cat# 17-0454-82, RRID:AB_469400 | Flow cytometry, cell surface (1:100) |
| Antibody | Anti-CD45.2 FITC-conjugated (mouse, monoclonal) | Thermo Fisher Scientific | Cat# 11-0454-82, RRID:AB_465061 | Flow cytometry, cell surface (1:300) |
| Antibody | Anti-CD8 PE-Cy7-conjugated (rat, monoclonal) | Biolegend | Cat# 100722, RRID:AB_312761 | Flow cytometry, cell surface (1:1000) |
| Antibody | Anti-F4/80 AF488-conjugated (rat, monoclonal) | Biolegend | Cat# 123120, RRID:AB_893479 | Flow cytometry, cell surface (1:400) |
| Antibody | Anti-F4/80 BV421-conjugated (rat, monoclonal) | Biolegend | Cat# 123131, RRID:AB_10901171 | Flow cytometry, cell surface (1:300) |
| Antibody | Anti-IFN-γ APC-conjugated (rat, monoclonal) | Biolegend | Cat# 505810, RRID:AB_315404 | Flow cytometry, intracellular (1:4000) |
| Antibody | Anti-Ly-6G BV421-conjugated (rat, monoclonal) | Biolegend | Cat# 127627, RRID:AB_10897944 | Flow cytometry, cell surface (1:800) |
| Antibody | Anti-Ly-6G PerCP-Cy5.5-conjugated (rat, monoclonal) | Biolegend | Cat# 127616, RRID:AB_1877271 | Flow cytometry, cell surface (1:600) |
| Antibody | Anti-Ly-6C APC-Cy7-conjugated (rat, monoclonal) | Biolegend | Cat# 128026, RRID:AB_10640120 | Flow cytometry, cell surface (1:2000) |
| Antibody | Anti-Ly-6C PE-Cy7-conjugated (rat, monoclonal) | Biolegend | Cat# 128018, RRID:AB_1732082 | Flow cytometry, cell surface (1:2000) |
| Antibody | Anti-MHCII PE-Cy7-conjugated (rat, monoclonal) | Biolegend | Cat# 107635, RRID:AB_2561397 | Flow cytometry, cell surface (1:400) |
| Antibody | Anti-Nos2 AF647-conjugated (mouse, monoclonal) | Santa Cruz | Cat# sc-7271, RRID:AB_627810 | Flow cytometry, intracellular (1:100) |
| Antibody | Anti-Rabbit IgG(H+L) FITC-conjugated (goat, polyclonal) | SouthernBiotech | Cat# 4055–02, RRID:AB_2795979 | Flow cytometry, Microscopy (1:500) |
| Antibody | Anti-Relmα (rabbit, polyclonal) | PeproTech | Cat# 500-P214bt-50ug, RRID:AB_1268707 | Flow cytometry, intracellular (1:100) |
| Antibody | Anti-Siglec-F PE-conjugated (rat, monoclonal) | BD Biosciences | Cat# 552126, RRID:AB_394341 | Flow cytometry, cell surface (1:300) |
| Antibody | Anti-TCRβ APC-conjugated (armenian hamster, monoclonal) | Biolegend | Cat# 109212, RRID:AB_313435 | Flow cytometry, cell surface (1:500) |
| Antibody | Anti-NF-κB p65 (rabbit, polyclonal) | Biolegend | Cat# 622604, RRID:AB_2728469 | ChIP, 3 μg antibody for 40 μg chromatin |
| Antibody | CD4 MicroBeads | Miltenyi Biotec | Cat# 130-049-201, RRID:AB_2722753 | MACS enrichment |
| Antibody | CD11b MicroBeads | Miltenyi Biotec | Cat# 130-049-601, | MACS enrichment |
| Antibody | Anti-IL-1β (armenian hamster, monoclonal) | Thermo Fisher Scientific | Cat# 14-7012-81, RRID:AB_468396 | ELISA, coating antibody (1:150) |
| Antibody | Anti-IL-1β biotin-conjugated (rabbit, polyclonal) | Thermo Fisher Scientific | Cat# 13-7112-85, RRID:AB_466925 | ELISA, detection antibody (1:150) |
| Antibody | Anti-IL-12/IL-23 p40 (rat, monoclonal) | Thermo Fisher Scientific | Cat# 14-7125-81, RRID:AB_468444 | ELISA, coating antibody (1:250) |
| Antibody | Anti-IL-12/IL-23 p40 biotin-conjugated (rat, monoclonal) | Thermo Fisher Scientific | Cat# 13-7123-81, RRID:AB_466928 | ELISA, detection antibody (1:1000) |
| Antibody | Anti-IL-6 (rat, monoclonal) | Thermo Fisher Scientific | Cat# 16-7061-81, RRID:AB_469216 | ELISA, coating antibody (1:250) |
| Antibody | Anti-IL-6 biotin-conjugated (rat, monoclonal) | Thermo Fisher Scientific | Cat# 36-7062-85, RRID:AB_469761 | ELISA, detection antibody (1:500) |
| Antibody | Anti-TNF-α (rat, monoclonal) | BD Biosciences | Cat# 551225, RRID:AB_394102 | ELISA, coating antibody (1:100) |
| Antibody | Anti-TNF-α biotin-conjugated (rabbit, polyclonal) | Thermo Fisher Scientific | Cat# 13-7341-81, RRID:AB_466950 | ELISA, detection antibody (1:150) |
| Antibody | Anti-phospho-Erk1/2 (rabbit, polyclonal) | Cell Signaling Technology | Cat# 9101, RRID:AB_331646 | WB (1:1000) |
| Antibody | Anti-Erk1/2 (rabbit, polyclonal) | Cell Signaling Technology | Cat# 9102, RRID:AB_330744 | WB (1:1000) |
| Antibody | Anti-phospho-IκB-α, (mouse, monoclonal) | Cell Signaling Technology | Cat# 9246, RRID:AB_2267145 | WB (1:1000) |
| Antibody | Anti-IκB-α, (rabbit, polyclonal) | Cell Signaling Technology | Cat# 9242, RRID:AB_331623 | WB (1:1000) |
| Antibody | Anti-NF-κB p65 (rabbit, polyclonal) | Biolegend | Cat# 622602, RRID:AB_315956 | WB (1:2000) |
| Antibody | Anti-IL-1β (mouse, polyclonal) | R and D Systems | Cat# AF-401-NA, RRID:AB_416684 | WB (1:800), ‘Mouse IL-1 beta/IL-1F2 antibody’ |
| Antibody | Anti-caspase-1 p10 (rabbit, polyclonal) | Santa Cruz | Cat# sc-514, RRID:AB_2068895 | WB (1:200) |
| Antibody | Anti-β-actin peroxidase- conjugated (mouse, monoclonal) | Sigma-Aldrich | Cat# A3854, RRID:AB_262011 | WB (1:50000) |
| Antibody | Anti-NF-κB p65 (rabbit, polyclonal) | Santa Cruz | Cat# sc-7151, RRID:AB_650213 | Microscopy (1:250) |
| Peptide, recombinant protein | IFN-γ | PeproTech | Cat# 315–05 | M1 polarization (50 ng/ml) |
| Peptide, recombinant protein | IL-4 | PeproTech | Cat# 214–14 | M2 polarization (20 ng/ml) |
| Peptide, recombinant protein | M-CSF | PeproTech | Cat# 315–02 | BMDM differentiation (20 ng/ml) |
| Peptide, recombinant protein | gp61-80 peptide (LCMV) | NeoMPS | Cat# SP990990 | Sequence: GLNGPDIYKGVYQFKSVEFD |
| Chemical compound, drug | Tamoxifen (TAM) | Sigma-Aldrich | Cat# T5648-1G | To delete Txnrd1 in Txnrd1fl/fl;Rosa26-CreERT2 mice |
| Chemical compound, drug | Lipopolysaccharides (LPS) | InvivoGen | Cat# tlrl-3pelps | TLR4 agonist |
| Chemical compound, drug | Imiquimod (R837) | Tocris Bioscience | Cat# 3700 | TLR7 agonist |
| Chemical compound, drug | CpG oligodeoxynucleotides | InvivoGen | Cat# tlrl-1826–1 | TLR9 agonist |
| Chemical compound, drug | Lipoteichoic (LTA) | InvivoGen | Cat# tlrl-slta | TLR2 agonist |
| Chemical compound, drug | Zymosan A | Sigma-Aldrich | Cat# Z4250-250MG | TLR2/Dectin-1 agonist |
| Chemical compound, drug | Nigericin (Nig) | Sigma-Aldrich | Cat# N7143 | NLRP3 inflammasome inducer |
| Chemical compound, drug | Adenosine triphosphate (ATP) | Sigma-Aldrich | Cat# A7699 | NLRP3 inflammasome inducer |
| Chemical compound, drug | Alu-Gel-S (Alum) | SERVA Electrophoresis | Cat# 12261.01 | NLRP3 inflammasome inducer |
| Chemical compound, drug | Monosodium urate (MSU) crystals | InvivoGen | Cat# tlrl-msu-25 | NLRP3 inflammasome inducer |
| Chemical compound, drug | DL-Buthionine-(S,R)-sulfoximine (BSO ) | Sigma-Aldrich | Cat# B2640-500MG | Glutathione synthesis inhibitor |
| Chemical compound, drug | Catalase-polyethylene glycol (Cat) | Sigma-Aldrich | Cat# C4963 | Antioxidant |
| Chemical compound, drug | L-Ascorbic acid | Sigma-Aldrich | Cat# A92902-25G | Antioxidant |
| Chemical compound, drug | Diphenyleneiodonium chloride (DPI) | Sigma-Aldrich | Cat# D2926-10MG | Antioxidant |
| Chemical compound, drug | DL-Dithiothreitol (DTT) | Sigma-Aldrich | Cat# 43815–5G | Antioxidant |
| Chemical compound, drug | N-Acetyl-L-Cysteine (NAC) | Sigma-Aldrich | Cat# A7250-10G | Antioxidant |
| Chemical compound, drug | DNase I | Sigma-Aldrich | Cat# 4716728001 | Tissue digestion (0.02 mg/ml) |
| Chemical compound, drug | Collagenase IV | Worthington | Cat# LS004189 | Tissue digestion (2 mg/ml) |
| Chemical compound, drug | Phorbol 12-myristate 13-acetate (PMA) | Sigma-Aldrich | Cat# P-8139 | T-cell restimulation (10−7 mol/L) |
| Chemical compound, drug | Ionomycin | Sigma-Aldrich | Cat# I-0634 | T-cell restimulation (1 μg/ml) |
| Chemical compound, drug | Monensin | Sigma-Aldrich | Cat# M5273 | Used at 2 μg/ml during T-cell restimulation |
| Commercial assay or kit | NF-κB p65 Transcription Factor Assay Kit | Abcam | Cat# ab133112 | |
| Commercial assay or kit | Nuclear Extraction Kit | Abcam | Cat# ab113474 | |
| Commercial assay or kit | Glutathione Assay Kit | Sigma-Aldrich | Cat# CS0260 | |
| Commercial assay or kit | Pierce BCA Protein Assay Kit | Thermo Fisher Scientific | Cat# 23225 | |
| Commercial assay or kit | Pierce LDH Cytotoxicity Assay Kit | Thermo Fisher Scientific | Cat# 88954 | |
| Software, algorithm | FlowJo Software (version 10.4.2) | Three Star | https://www.flowjo.com/ | |
| Software, algorithm | ImageJ (for image analysis) | NIH | https://imagej.nih.gov/ij/ | |
| Software, algorithm | Prism 8 (version 8.0.0) | GraphPad Software | https://www.graphpad.com/scientific-software/prism/ | |
| Other | DAPI | Sigma-Aldrich | Cat# D9542 | Microscopy, nuclei visualization (1:5000) |
| Other | Phalloidin, AF-647-conjugated | Thermo Fisher Scientific | Cat# A22287 | Microscopy, actin staining (1:1000) |
| Other | eFluor 780 | Thermo Fisher Scientific | Cat# 65-0865-14 | Live/Dead staining (1:2000) |
| Other | Zombie Aqua | Biolegend | Cat# 423101 | Live/Dead staining (1:400) |
| Other | Zombie Red | Biolegend | Cat# 423109 | Live/Dead staining (1:800) |
| Other | CM-H2DCFDA | Thermo Fisher Scientific | Cat# C6827 | General oxidative stress indicator (1:1000) |
| Other | Annexin-V APC-conjugated | Thermo Fisher Scientific | Cat# 88-8007-74 | Apoptosis detection (1:50) |
| Other | Streptavidin BV711-conjugated | BD Biosciences | Cat# 563262 | (1:1000) |
| Other | Dynabeads Protein G | Thermo Fisher Scientific | Cat# 10004D | For the ChIP experiment |
Additional files
-
Supplementary file 1
Sequences of primers used for RT-PCR.
- https://cdn.elifesciences.org/articles/53627/elife-53627-supp1-v2.docx
-
Transparent reporting form
- https://cdn.elifesciences.org/articles/53627/elife-53627-transrepform-v2.docx
Download links
A two-part list of links to download the article, or parts of the article, in various formats.
Downloads (link to download the article as PDF)
Open citations (links to open the citations from this article in various online reference manager services)
Cite this article (links to download the citations from this article in formats compatible with various reference manager tools)
Thioredoxin-1 distinctly promotes NF-κB target DNA binding and NLRP3 inflammasome activation independently of Txnip
eLife 9:e53627.
https://doi.org/10.7554/eLife.53627


