Transverse sinus injections drive robust whole-brain expression of transgenes
- Department of Neuroscience, Yale School of Medicine, United States
- University of Technology of Compiègne, France
- Department of Ophthalmology and Visual Science, Yale School of Medicine, United States
- Kavli Institute for Neuroscience, Yale School of Medicine, United States
Figures
Figure 1 with 2 supplements
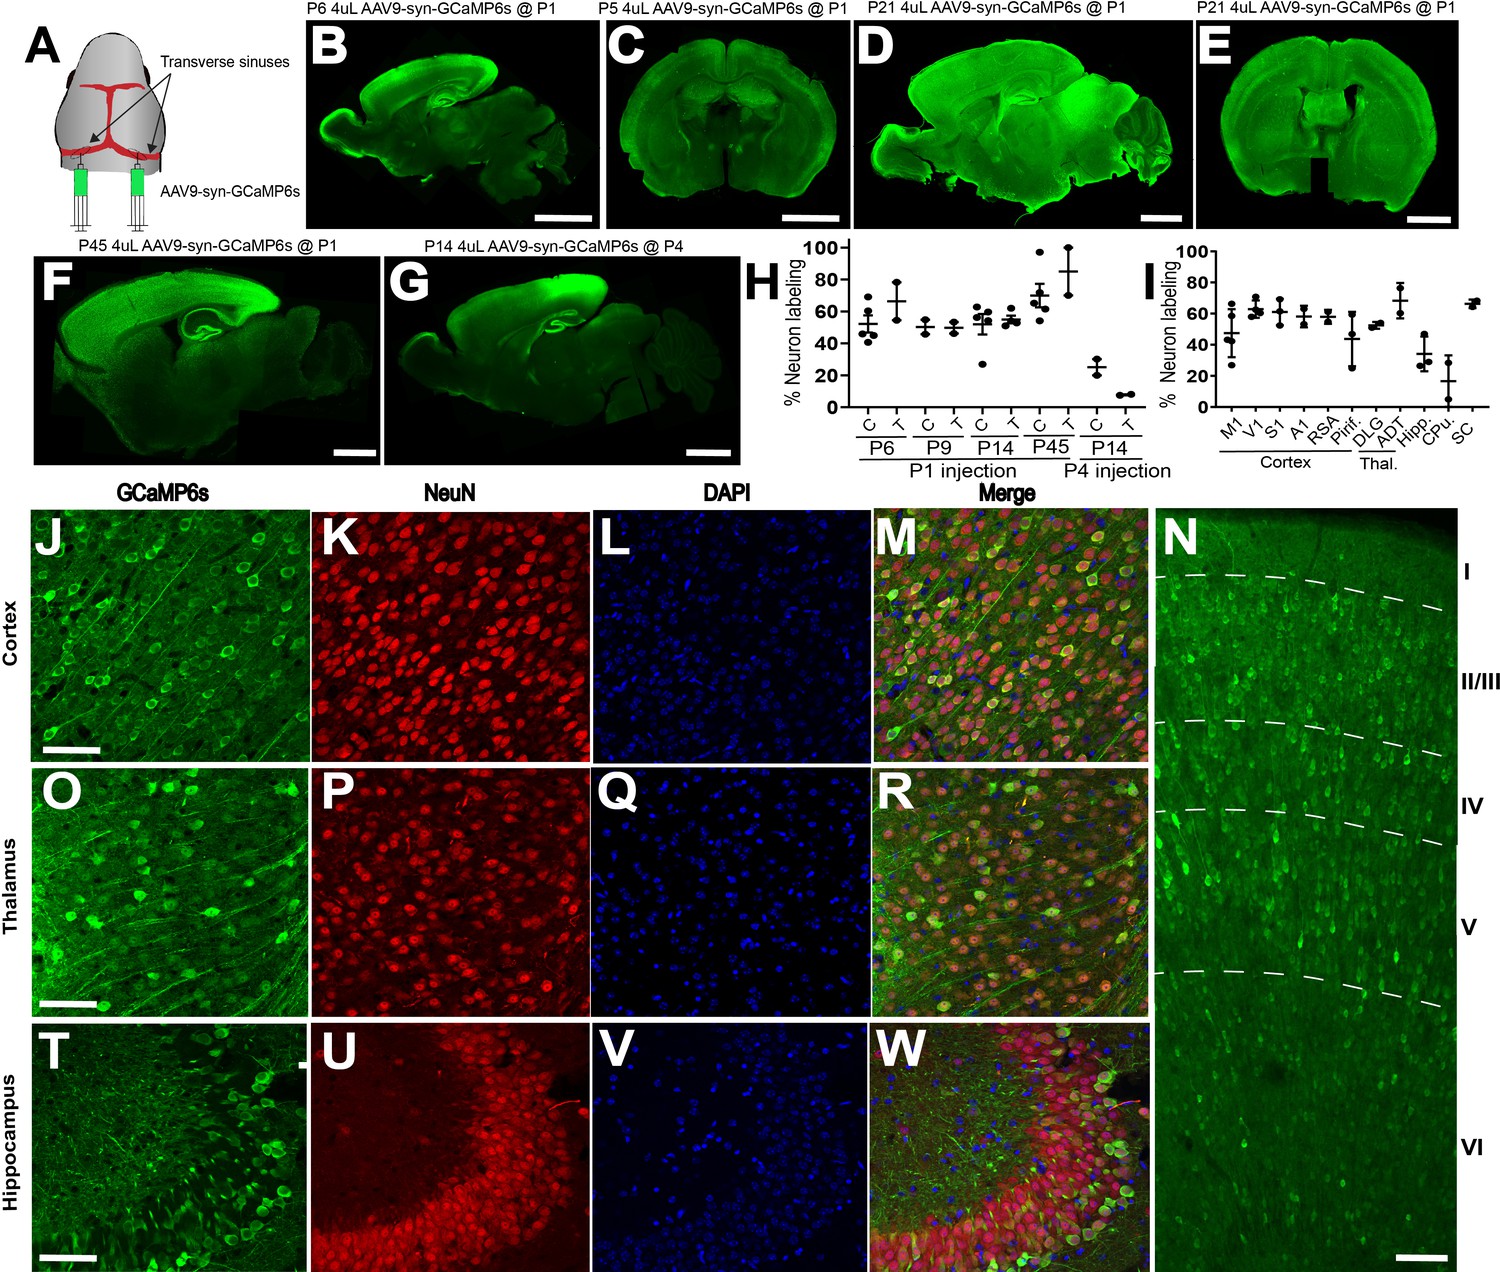
AAV9 n-SIM at P0-P1, but not at P4, leads to widespread neuronal transduction in the neonatal mouse brain.
(A) Schematic showing sites of viral injection at P1. (B,C) Example sagittal and coronal sections of P6 and P5 mouse brains, respectively, showing widespread expression of GCaMP6s across the cortex and several other brain regions including hippocampus, midbrain, and thalamus. Scale bar = 2 mm. Exposure time: 1000 ms. Minimum-Maximum display range in ImageJ (Unsigned 16-bit range): (B) 73–1200; (C) 0–4095. (D–E) Example sagittal and coronal sections at P21 showing that expression of GCaMP6s at P21 is brighter than at earlier ages. Exposure time: 1000 ms. Minimum-Maximum display range in ImageJ (Unsigned 16-bit range)=0–4095. (F) Sagittal section of P45 brain injected at P1 with 4 μL of AAV9 (1 × 10¹³ vg/mL. Exposure time: 500 ms. Minimum-Maximum display range in ImageJ (Unsigned 16-bit range)=73–3500. G: Sagittal section of P21 brain injected at P4 with 4 μL of AAV9 (1 × 10¹³ vg/mL. Exposure time: 1000 ms. Minimum-Maximum display range in ImageJ (Unsigned 16-bit range)=73–2000. (H) Quantification of cortical and thalamic neuron labeling at P6, P9, and P14 after P1 (P6, n = 5; P9, n = 2; P14, n = 5; P45, n = 5) or P4 (P14, n = 2) sinus injections. Each data point in the plot represents an individual brain. Horizontal lines represent the mean, and vertical lines represent the standard deviation. C = cortex, T = thalamus. (I). Quantification of neuron labeling at P14 in different cortical and thalamic regions, in addition to hippocampus and striatum. M1 = motor cortex (n = 5), V1 = visual cortex (n = 4), S1 = somatosensory cortex (n = 3), A1 = auditory cortex (n = 2), RSA = retrosplenial cortex (n = 2), Piri = piriform cortex (n = 3), DLG = dorsolateral geniculate nucleus (n = 2), ADT = anterodorsal thalamic nucleus (n = 1), Hipp = hippocampus (n = 3), CPu = caudate and putamen (n = 2), SC = superior colliculus (n = 2). Confocal images showing GCaMP6s expression in mouse cortex and thalamus (J–W) at P14 after transverse sinus injection of 4 μL of 1 × 10¹³ vg/mL AAV9-syn-GCaMP6s at P1. Panels (J), (O), (T) show abundant GCaMP6s expression in cortex, thalamus, and hippocampus, and localization with both NeuN and DAPI (M,R,W). Scale bar = 20 μm. (N). Confocal image of GCaMP6s revealing dense and widespread expression across all cortical layers at P14. Scale bar is 40 μm.
-
Figure 1—source data 1
Quantification of neuronal labeling achieved through different injection methods.
Percent cortical neurons labeled using AAV9 n-SIM, AAV1 n-SIM, AAV5 n-SIM, AAV-PHP.eB n-SIM, AAV9 ICV, AAV9 temporal vein. Mouse pup ages range from P6-P21, and injections were performed at P1.
- https://cdn.elifesciences.org/articles/53639/elife-53639-fig1-data1-v2.xlsx
-
Figure 1—source data 2
n-SIM neuronal labeling in different brain regions.
Quantification of neuronal labeling in various cortical and subcortical regions at postnatal day 14 (P14).
- https://cdn.elifesciences.org/articles/53639/elife-53639-fig1-data2-v2.xlsx
-
Figure 1—source data 3
n-SIM neuronal labeling in cortical layers.
Quantification of neuronal labeling from each cortical layer at P14.
- https://cdn.elifesciences.org/articles/53639/elife-53639-fig1-data3-v2.xlsx
-
Figure 1—source data 4
Quantification of neuronal labeling at different ages.
Percent cortical and thalamic neuron labeling at P6, P9, P14, P45 after P1 n-SIM, and P14 after P4 n-SIM.
- https://cdn.elifesciences.org/articles/53639/elife-53639-fig1-data4-v2.xlsx
Figure 1—figure supplement 1

Comparison of AAV9 n-SIM to other methods.
(A,B) Sagittal sections of P14 and P21 mouse brains with bilateral temporal vein injections of AAV9-syn-GCaMP6s at P1. (A) Exposure time = 2000 ms. Minimum-Maximum display range in ImageJ (Unsigned 16-bit range)=73–2500. (B) Exposure time = 1000 ms. Minimum-Maximum display range in ImageJ (Unsigned 16-bit range)=73–2500. (C) Sagittal sections of P14 mouse brains with AAV5 n-SIM at P1. Exposure time = 1000 ms. Minimum-Maximum display range in ImageJ (Unsigned 16-bit range)=73–2500. (D,E) Sagittal sections of P6 and P14 mouse brains labeled with GCaMP6s using AAV1 n-SIM at P1. Exposure time = 2000 ms. Minimum-Maximum display range in ImageJ (Unsigned 16-bit range)=73–2500. (F) Sagittal section of P11 brain injected with 8 μL of AAV-PHP.eB-syn-GCaMP6s (1 × 10¹³ vg/mL). Exposure time: 1000 ms. Minimum-Maximum display range in ImageJ (Unsigned 16-bit range)=73–500. (G) Quantification of cortical neuron labeling from injected mouse pups ranging from P6-P21 using AAV9 temporal vein injections at P1, AAV5 n-SIM at P1, AAV1 n-SIM at P1, AAV-PHP.eB n-SIM at P1, AAV9 ICV at P0-P1, and AAV9 n-SIM at P1. Note comparison to AAV9 n-SIM at P1 (also refer to Figure 1H). Scale bars are 2 mm.
Figure 1—figure supplement 2
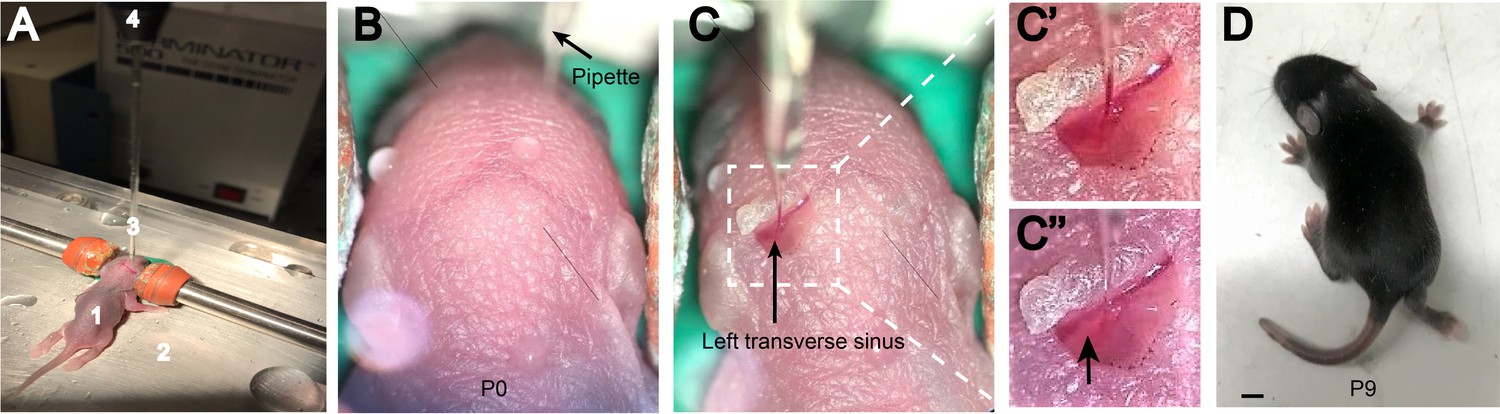
Neonatal transverse sinus injection method.
(A) Injection set-up showing P0 pup (1) on ice-cold plate (2) with glass pipette (3) and nanoject (4) positioned above site of injection. (B) View through the dissection microscope showing dorsal side of the head before any incisions are made. (C) After incision is made to expose the sinuses, the glass pipette is lowered through the skull such that the tip of pipette is within the lumen of the sinus. Once we begin the viral injection (C’), the correct depth of injection is verified by visualizing the viral solution plume within the blood stream of the sinus (Arrowhead in C’’). (D) P9 sinus-injected mouse showing good would healing around the site of injection. Scale bar = 2 mm.
Figure 2

Efficient labeling of multiple cell types in neonatal cortex using n-SIM.
(A) Schematic showing viral injection (AAV9-syn-GCaMP6s) into Nkx2.1-Cre;LSL-tdTomato, or Sst-IRES-Cre;LSL-tdTomato, or Vip-IRES-Cre;LSL-tdTomato to label excitatory and inhibitory neuron populations. 2-photon imaging setup is shown. (B–I) Simultaneous two-photon imaging of Nkx2.1, Sst, and Vip interneurons in V1 layers 2/3 along with surrounding pyramidal neurons as early as P4, showing efficient labeling of all interneuron subtypes. Traces adjacent to images show that all interneuron subtypes display calcium transients. (H,I) Deep-layer two-photon imaging of Sst interneurons and surrounding pyramidal neurons at P9, showing efficient labeling of deep cortical layers early in development. Note that for illustration purposes, only a subset of neurons have traces displayed in this figure. Scale bar is 20 μm.
Figure 3 with 1 supplement
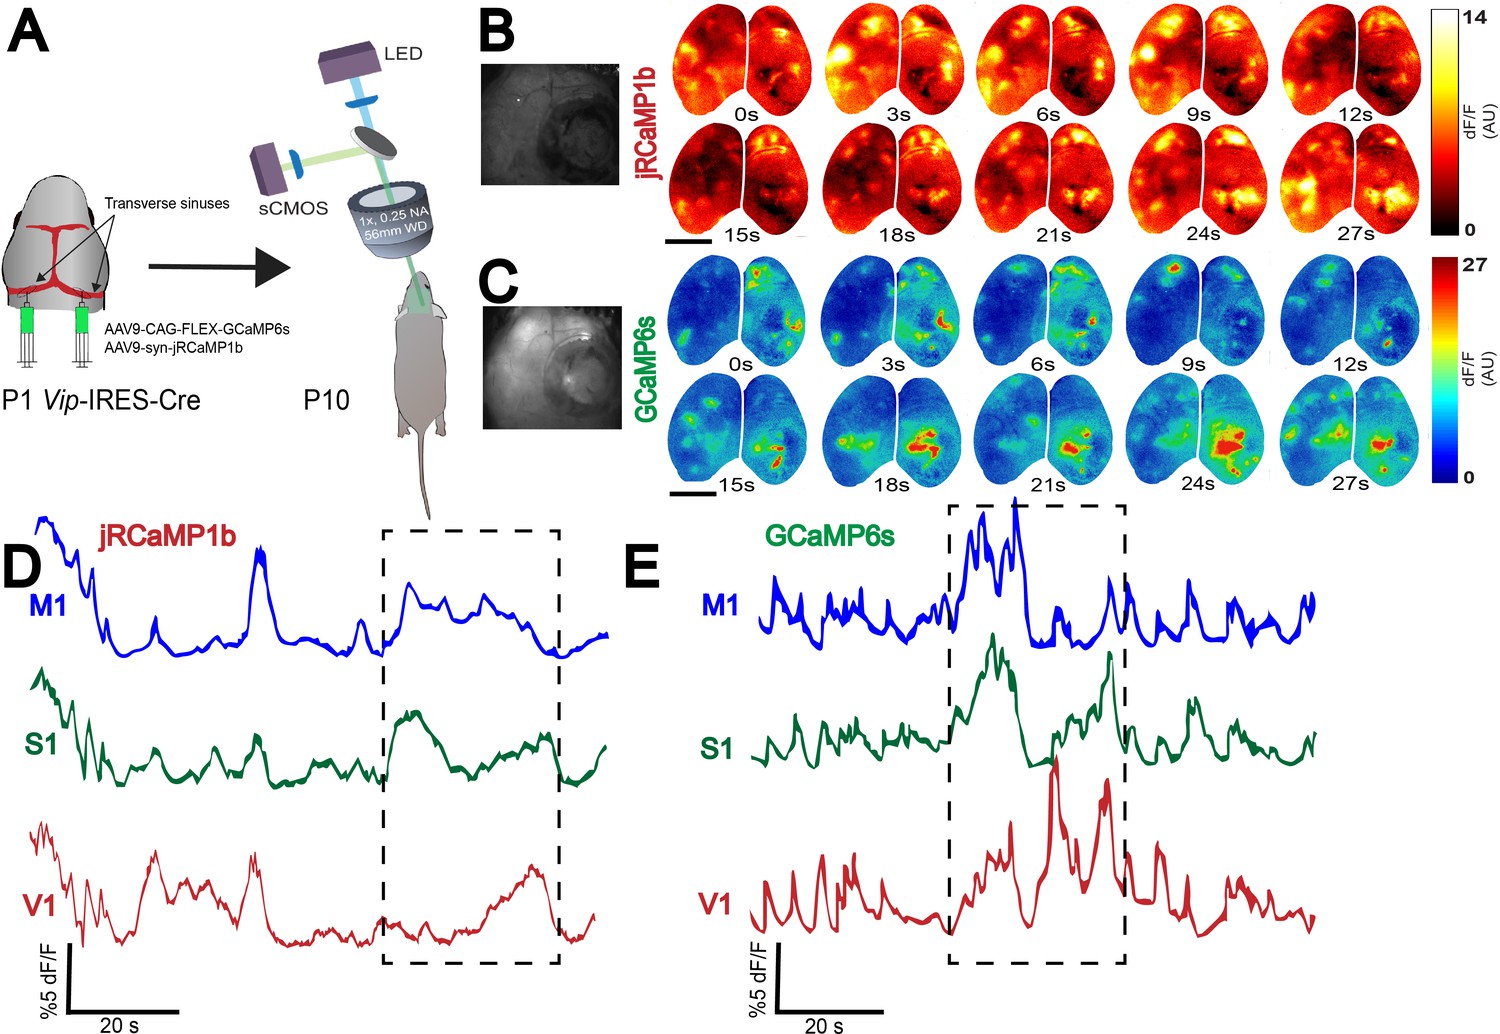
Whole-brain expression of multiple viral constructs in neonates.
(A) Schematic showing co-injection of two viruses (AAV9-syn-jRCaMP1b and AAV9-CAG-flex-GCaMP6s) into the transverse sinuses of Vip-IRES-Cre mice at P0-P1, and widefield imaging of two neural populations in the same brain at P10. Widefield imaging setup is shown in simplified schematic (see Methods section for details). (B,C) Montage of neural activity across cortex imaged using a widefield mesoscope. All neurons are labeled using jRCaMP1b, and only Vip interneurons are labeled using GCaMP6s. Notice that domains of neural activity are observed across the entirety of cortex in both the jRCaMP1b and GCaMP6s channels, demonstrating that functional viral expression is robust across the whole cortex. Photographs on the left represent example frames showing widefield imaging under yellow (B) and blue (C) illumination. (D,E). Traces represent time-series of spontaneous activity measured by calcium transients from motor cortex (M1), somatosensory cortex (S1), and visual cortex (V1). Boxed area of traces in D and E is shown as a montage in (B and C), respectively. Scale bar is 2 μm.
Figure 3—figure supplement 1

Whole-brain expression of a fluorescent glutamate indicator (iGluSnFr) and pan-neuronal jRCaMP1b via n-SIM.
(A) Schematic showing co-injection of two viruses (AAV9-syn-jRCaMP1b and AAV9-syn-iGluSnFr) into the transverse sinuses of a P1 mouse, and widefield imaging of glutamate release and neuronal activity in the same brain at P10. Widefield imaging setup is shown in a simplified schematic (see Methods section for details). (B,C) Montage of neural activity and glutamate release across cortex imaged using a widefield mesoscope. All neurons are labeled using jRCaMP1b, and glutamate release can be monitored via iGluSnFr. Notice that domains of neural activity are observed across the entirety of cortex in both the jRCaMP1b and GCaMP6s channels, demonstrating that functional viral expression is robust across the whole cortex. Photographs on the left represent example frames showing widefield imaging under yellow (B) and blue (C) illumination. (D,E). Traces represent time-series of spontaneous activity measured by calcium transients from motor cortex (M1), somatosensory cortex (S1), and visual cortex (V1). Boxed area of traces in D and E are shown as a montage in (B and C), respectively. Scale bar is 3 mm.
Figure 4
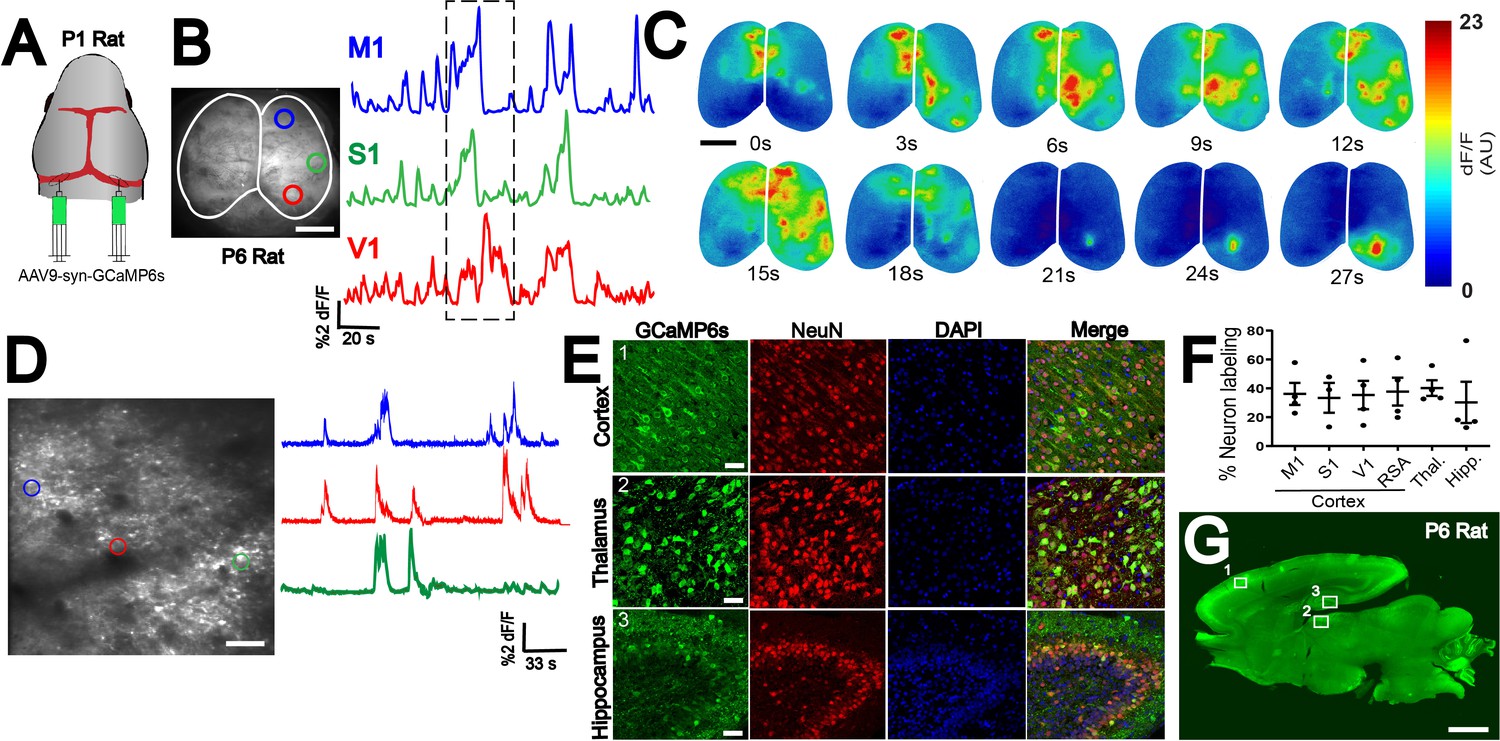
n-SIM compatibility in multiple species.
(A) n-SIM using 4-8 μL of AAV9-syn-GCaMP6s (1 × 10¹³ vg/mL) at P1 in rats yields whole-brain expression of GCaMP at P6 with strong functional signal across cortex as shown by widefield imaging (B). Traces represent time-series of spontaneous activity measured by calcium transients from motor cortex (M1), somatosensory cortex (S1), and visual cortex (V1). (C) Boxed area of traces in (A) shown in a montage. Scale bar is 4 μm. (D) Two-photon imaging of spontaneous cortical activity in V1 from a P6 rat with sample traces from individual neurons marked with color-matched circles. Scale bar is 50 μm. (E) Confocal images from boxed areas in F showing dense labeling of neurons in cortex, thalamus, and hippocampus at P6. Scale bar is 50 μm. (F) Quantification of neuronal labeling in rats ranging from P6-P9. (G) Sagittal sections of a P6 rat brain showing widespread rostral-caudal expression of GCaMP6 across the whole brain. Scale bar is 2 mm. Exposure time: 6000 ms. Minimum-Maximum display range in ImageJ (Unsigned 16-bit range)=73–2500.
-
Figure 4—source data 1
Quantification of neuronal labeling in the rat brain.
Percent neuronal labeling in various cortical regions, in addition to the thalamus and hippocampus. Rat brains were quantified at P6 and P9 after P1 n-SIM.
- https://cdn.elifesciences.org/articles/53639/elife-53639-fig4-data1-v2.xlsx
Figure 5

Comparison of ICV to n-SIM.
(A) Schematic showing sites of ICV injection of AAV9-syn-GCaMp6S at P0 and widefield imaging at P9. (B) Montage of neural activity across cortex imaged using a widefield mesoscope. Notice that domains of activity are brighter in the caudal parts of cortex relative to the anterior parts. This is supported by the time-series traces (C), where the amplitudes of calcium transients from M1 appear to have lower amplitudes than S1 and V1. Photograph on the left represent a frame showing widefield imaging under blue illumination. (D) Sagittal sections of P6 and P16 mouse brains with bilateral ICV injections of AAV9-syn-GCaMP6s at P0. P6 Exposure time = 1000 ms. Minimum-Maximum display range in ImageJ (Unsigned 16-bit range)=73–1200. P16 Exposure time = 1000 ms. Minimum-Maximum display range in ImageJ (Unsigned 16-bit range)=0–4500. (E) Confocal images from cortex showing neuronal labeling at P9. Scale bar is 50 μm. (F) Quantification of overall neuronal labeling from P6, P9, and P16 animals after ICV at P0-P1. Each data point in the plot represents an individual brain. Horizontal lines represent the mean, and vertical lines represent the standard error of the mean. M1 = motor cortex, S1 = somatosensory cortex, V1 = visual cortex, Thal. = thalamus, Hipp. = hippocampus. (G) Quantification of Nkx2.1 and non-Nkx2.1 neuronal labeling in mice ranging from P7-P14 injected using ICV or n-SIM at P0-P1. Error bars represent the standard error of the mean.
-
Figure 5—source data 1
Quantification of neuronal labeling in the mouse brain after ICV injections.
Percent neuronal labeling in various cortical regions, in addition to thalamus and hippocampus. Mouse brains were quantified at P6, P9, and P16. ICV injections were performed at P0.
- https://cdn.elifesciences.org/articles/53639/elife-53639-fig5-data1-v2.xlsx
-
Figure 5—source data 2
Quantification of Nkx2.1 neuron labeling using n-SIM and ICV.
Percent Nkx2.1 and non-Nkx2.1 neuron labeling at P7-P14 using n-SIM and ICV.
- https://cdn.elifesciences.org/articles/53639/elife-53639-fig5-data2-v2.xlsx
Tables
Key resources table
| Reagent type (species) or resource | Designation | Source or reference | Identifiers | Additional information |
|---|---|---|---|---|
| Genetic reagent (M. musculus) | C57BL/6J | The Jackson Laboratory Stock #000664 | IMSR Cat # JAX: 000664; RRID:IMSR JAX:000664 | |
| Genetic reagent (M. musculus) | Ai9(RCL-tdT) | The Jackson Laboratory Stock #007909 | IMSR Cat# JAX: 007909, RRID:IMSR JAX:007909 | |
| Genetic reagent (M. musculus) | Vip-IRES-cre | The Jackson Laboratory Stock # 010908 | IMSR Cat# JAX:010908, RRID:IMSR JAX:010908 | |
| Genetic reagent (M. musculus) | Nkx2.1-cre | The Jackson Laboratory Stock # 008661 | IMSR Cat# JAX: 008661, RRID:IMSR JAX:008661 | |
| Genetic reagent (M. musculus) | Sst-IRES-cre | The Jackson Laboratory Stock #013044 | IMSR Cat# JAX: 013044, RRID:IMSR JAX: 013044 | |
| Genetic reagent (R. norvegicus) | Long Evans rat | Charles River Stock # 006 | Strain Code: 006 | |
| Antibody | anti-GFP (Rabbit monoclonal, Alexa Fluor 488 conjugate) | Thermo Fisher | Thermo Fisher Scientific Cat# A-21311, RRID:AB_221477 | 1:500 |
| Antibody | anti-NeuN (Mouse monoclonal) | Millipore | Millipore Cat# MAB377, RRID:AB_2298772 | 1:500 |
| Antibody | Goat anti-mouse (Mouse polyclonal, Alexa Fluor 555 conjugate) | Thermo Fisher | Thermo Fisher Scientific Cat# A-21422, RRID:AB_2535844 | 1:250 |
| Recombinant DNA reagent | pAAV.Syn.GCaMP6s.WPRE.SV40 (AAV9) | PMID:23868258 | Addgene #100843; RRID:Addgene_100843 | |
| Recombinant DNA reagent | pAAV.CAG.Flex.GCaMP6s.WPRE.SV40 (AAV9) | PMID:23868258 | Addgene # 100842; RRID:Addgene_100842 | |
| Recombinant DNA reagent | pAAV.Syn.NES-jRCaMP1b.WPRE.SV40 (AAV9) | PMID:27011354 | Addgene # 100851; RRID:Addgene_100851 | |
| Recombinant DNA reagent | pAAV.hSyn.iFluSnFr.WPRE.SV40 (AAV9) | PMID:23314171 | Addgene # 98929; RRID:Addgene_98929 |
Additional files
Download links
A two-part list of links to download the article, or parts of the article, in various formats.
Downloads (link to download the article as PDF)
Open citations (links to open the citations from this article in various online reference manager services)
Cite this article (links to download the citations from this article in formats compatible with various reference manager tools)
Transverse sinus injections drive robust whole-brain expression of transgenes
eLife 9:e53639.
https://doi.org/10.7554/eLife.53639


