Primary and secondary anti-viral response captured by the dynamics and phenotype of individual T cell clones
- Shemyakin-Ovchinnikov Institute of Bioorganic Chemistry, Russian Federation
- Center for Precision Genome Editing and Genetic Technologies for Biomedicine, Pirogov Russian National Research Medical University, Russian Federation
- Center of Life Sciences, Skoltech, Russian Federation
- Institute of Immunology, Kiel University, Germany
- Institute of Clinical Molecular Biology, Kiel University, Germany
- Masaryk University, Central European Institute of Technology, Czech Republic
- V.I. Kulakov National Medical Research Center for Obstetrics, Gynecology and Perinatology, Russian Federation
- Moscow State University, Russian Federation
- Laboratoire de physique de l’École normale supérieure, ENS, PSL, Sorbonne Université, Université de Paris, and CNRS, France
Figures
Figure 1 with 2 supplements
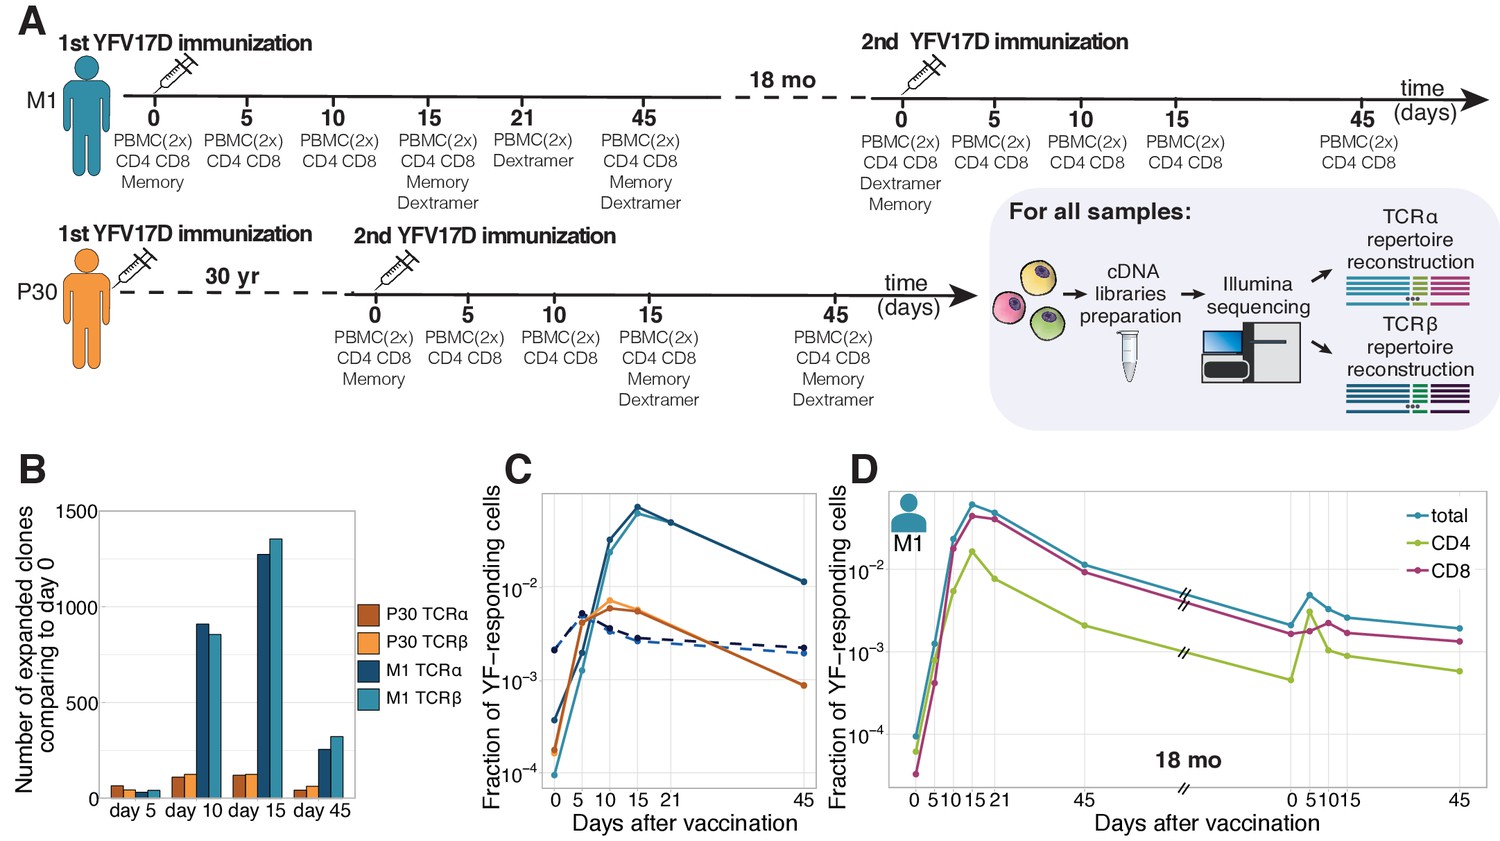
Primary and secondary response to yellow fever vaccination.
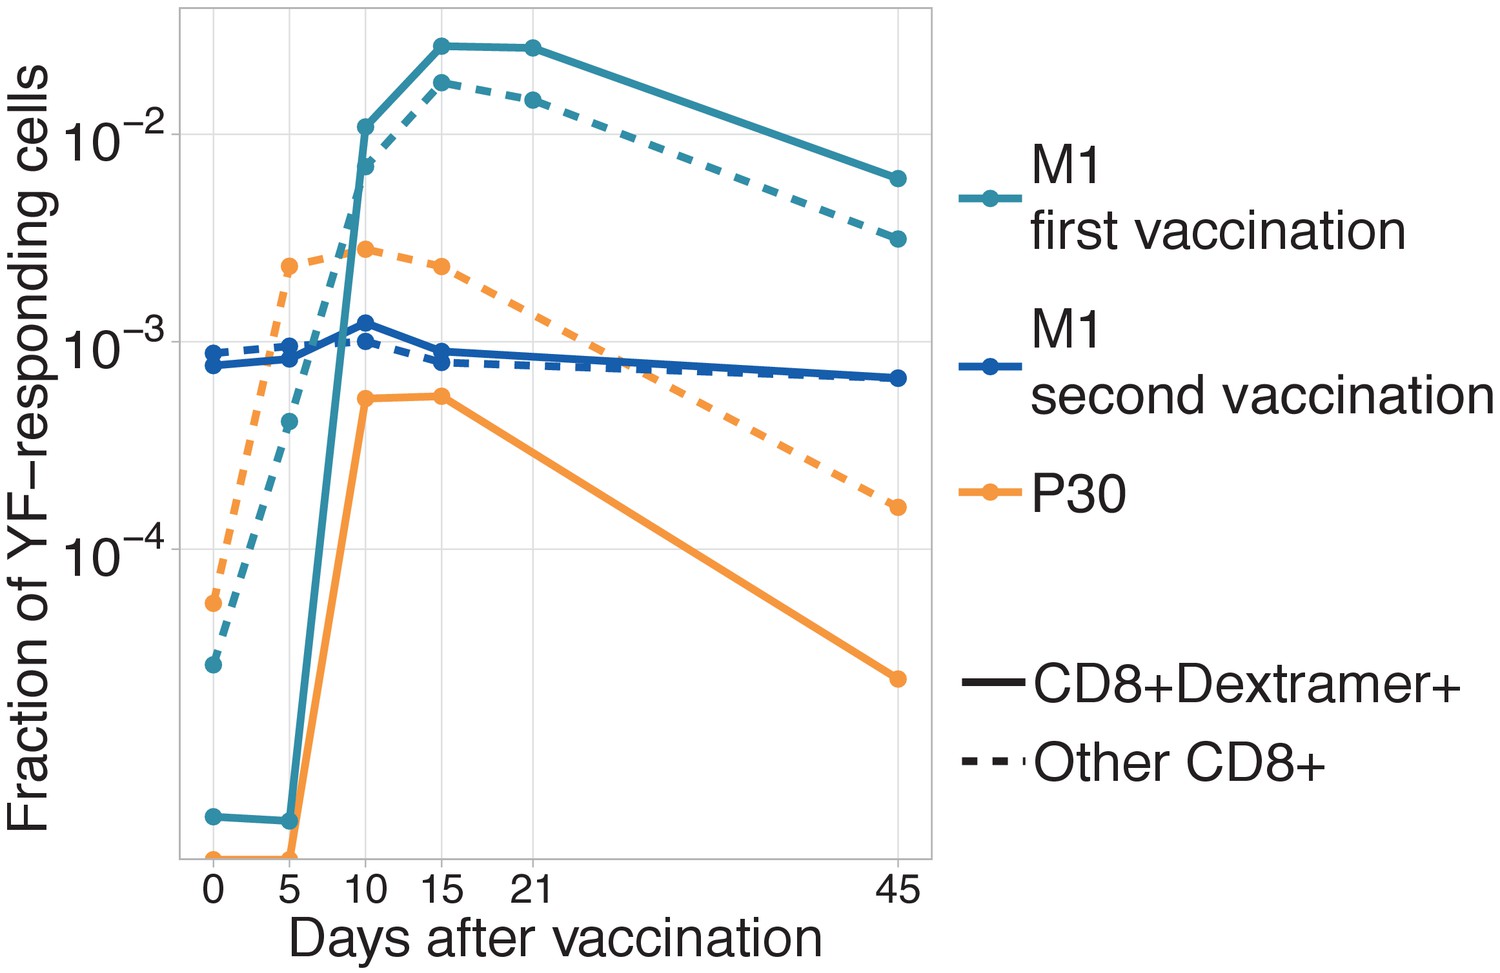
(A) Experiment design. Blood was taken at multiple timepoints before and after primary and secondary immunization against yellow fever virus. Two biological replicates of PBMCs and different cell subpopulations (indicated below each day of blood draw) were isolated at all timepoints. cDNA TCR alpha and TCR beta libraries were sequenced on Illumina platform. (B) The number of significantly expanded TCR alpha and TCR beta clonotypes for both donors in comparison to day 0. For donor P30 the number of significantly expanded clones is lower, than observed in primary vaccinations (see Figure 1—figure supplement 2). (C) The fraction of YF-responding cells as a proportion of all T-cells, measured by cumulative frequency of YF-responding TCR alpha and beta clonotypes of donor M1 after first (light blue and dark blue) and second immunization (dashed light blue and dark blue), and donor P30 (orange and yellow), which had a second immunization 30 years after the first. (D) The fraction of CD4+ and CD8+ YF-responding cells, as a proportion of all T-cells of donor M1 during the primary and secondary response to YFV17D. No novel major expansions were observed after secondary immunization, see Figure 1—figure supplement 1.
-
Figure 1—source data 1
List of all sequencing libraries with summary statistics.
- https://cdn.elifesciences.org/articles/53704/elife-53704-fig1-data1-v2.xlsx
-
Figure 1—source data 2
Number of significantly expanded TCR alpha and TCR beta clonotypes between in comparison to day 0.
- https://cdn.elifesciences.org/articles/53704/elife-53704-fig1-data2-v2.csv
-
Figure 1—source data 3
YF-responding TCR alpha and TCR beta clonotypes of donors M1 and P30 identified by edgeR.
- https://cdn.elifesciences.org/articles/53704/elife-53704-fig1-data3-v2.xlsx
Figure 1—figure supplement 1
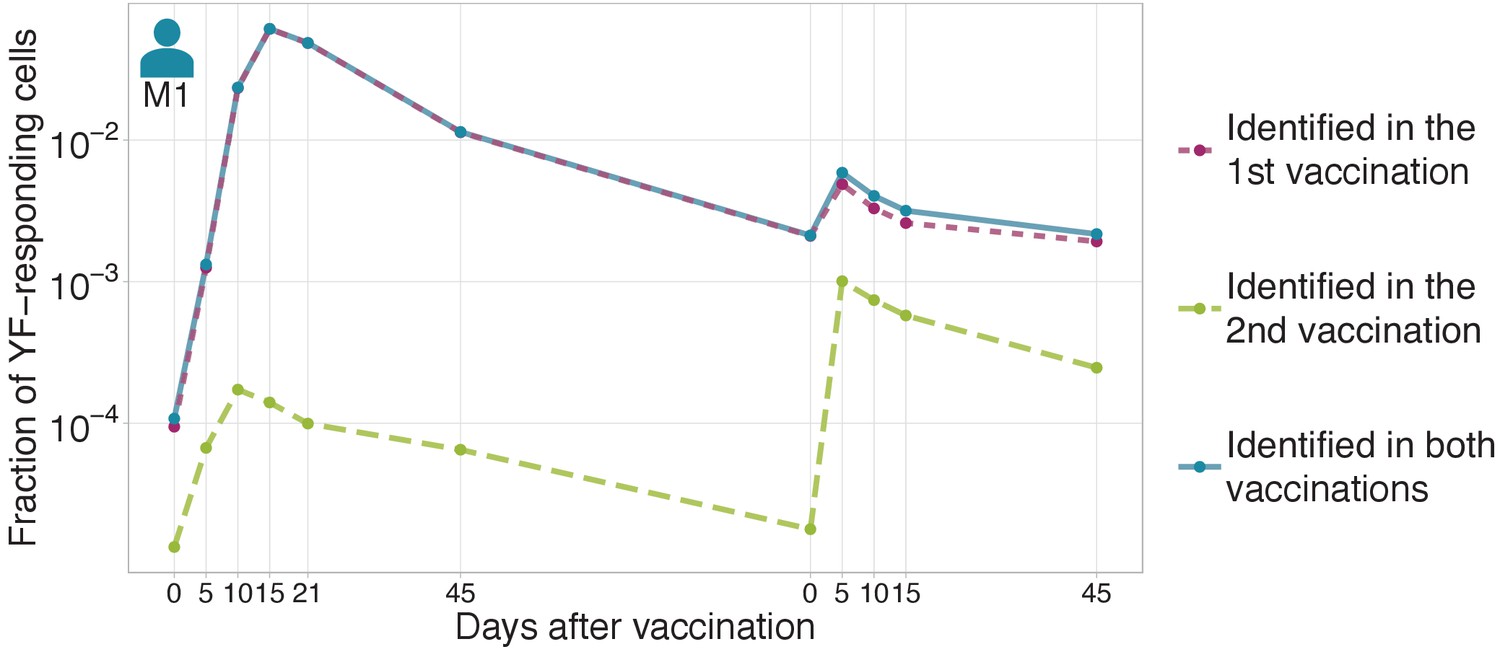
The magnitude of secondary response in donor M1 identified by edgeR.
The fraction of YF-responding cells as a proportion of all T-cells, measured by cumulative frequency of YF-responding TCR beta clonotypes of donor M1 identified by edgeR using timepoints after first vaccination (dashed purple), or after the second vaccination (dashed green). Solid blue line shows the sum of purple and green curves (clonotypes identified as expanded after first or after second immunization).
Figure 1—figure supplement 2
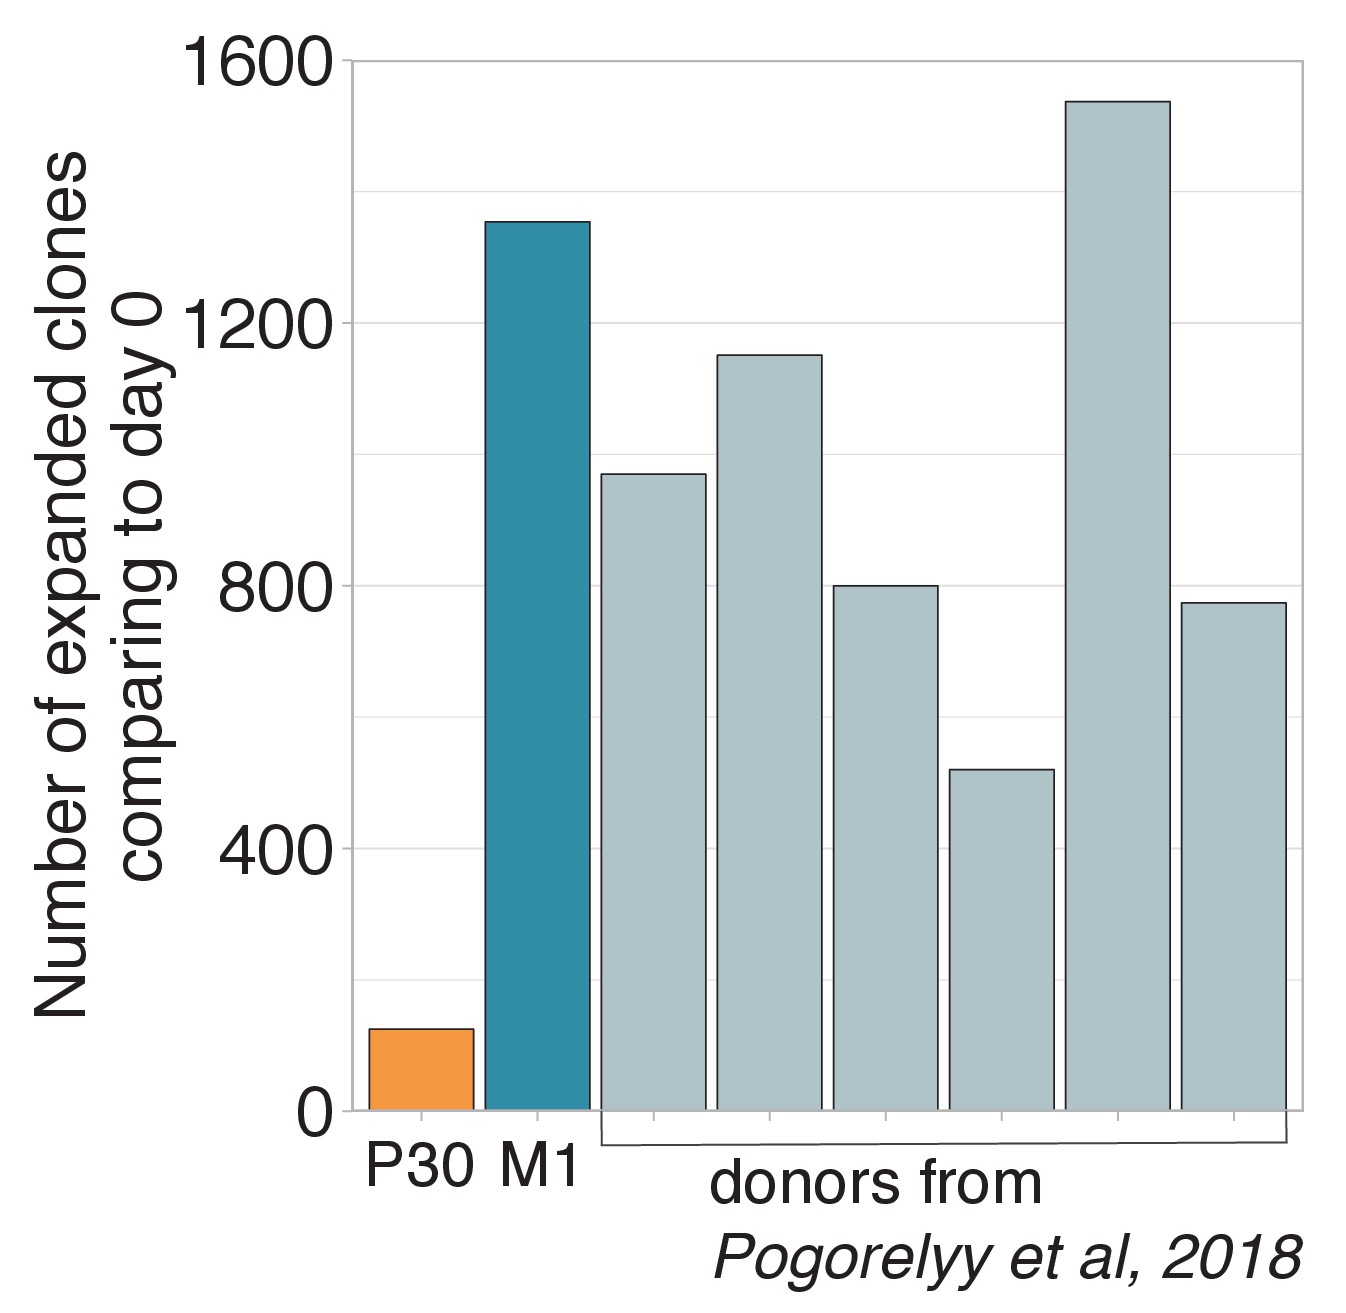
Number of expanded clones in donor P30.
Number of significantly expanded TCR beta clonotypes between day 0 and 15 identified by the edgeR software. The donor revaccinated 30 years after the primary immunization has significantly fewer expanded clonotypes than any primary vaccinee.
Figure 2 with 4 supplements

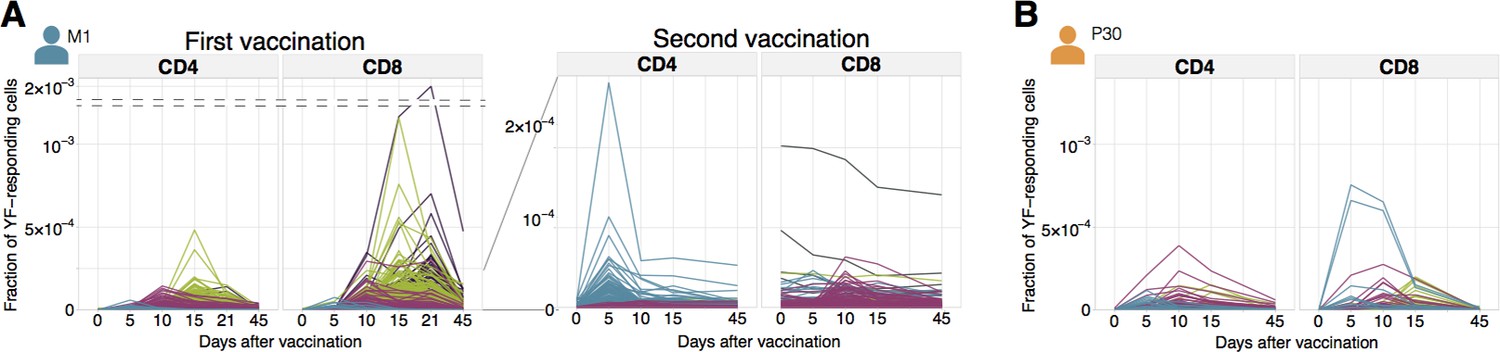
Diversity of individual clonal trajectories in primary and secondary responses.
(A, B) Frequency of each YF-responding clonotype in bulk TCR repertoire as a function of time. Individual clones show remarkable expansion after the primary response (A, left panel) and secondary response both 18 months (A, right panel) and 30 years (B) after the primary vaccination. The ten most abundant (by peak frequency) CD4+ and CD8+ YF-responding clonotypes are shown for each vaccination. Clonal traces for all YF-responding clonotypes are shown in Figure 2—figure supplement 1. Color indicates the time of the response peak for each clonotype: blue for a peak at day 5, pink at day 10, green at day 15 and purple at day 21. Despite overall heterogeneity in clonal traces, more clones peak at early timepoints during the secondary response. Heterogeneity in clonal traces allows for expanded clones identification and computational alpha-beta TCR pairing (Figure 2—figure supplement 4).
-
Figure 2—source data 1
Concentrations of YF-responding clonotypes for donor M1 on all timepoints.
- https://cdn.elifesciences.org/articles/53704/elife-53704-fig2-data1-v2.xlsx
-
Figure 2—source data 2
Concentrations of YF-responding clonotypes for donor P30 on all timepoints.
- https://cdn.elifesciences.org/articles/53704/elife-53704-fig2-data2-v2.csv
Figure 2—figure supplement 1
Time traces of all YF-responding clonotypes.
Individual clonal trajectories of all YF-responding clonotypes. Frequency of each YF-responding clonotype in bulk TCR repertoire as a function of time. Individual clones show remarkable expansion after the primary response (A, left panel) and secondary response both 18 months (A, right panel) and 30 years (B) after the primary vaccination. Color indicates the time of the response peak for each clonotype: blue for a peak at day 5, pink at day 10, green at day 15 and purple at day 21.
Figure 2—figure supplement 2
Decay of YF-responding clonotypes between primary and secondary immunization.
Decay of YF-responding clonotypes between primary and secondary immunization. Frequencies of YF-responding clones on day 45 of the primary immunization of donor M1 versus their frequencies 18 months later, before the second immunization). Diagonal line shows identity.
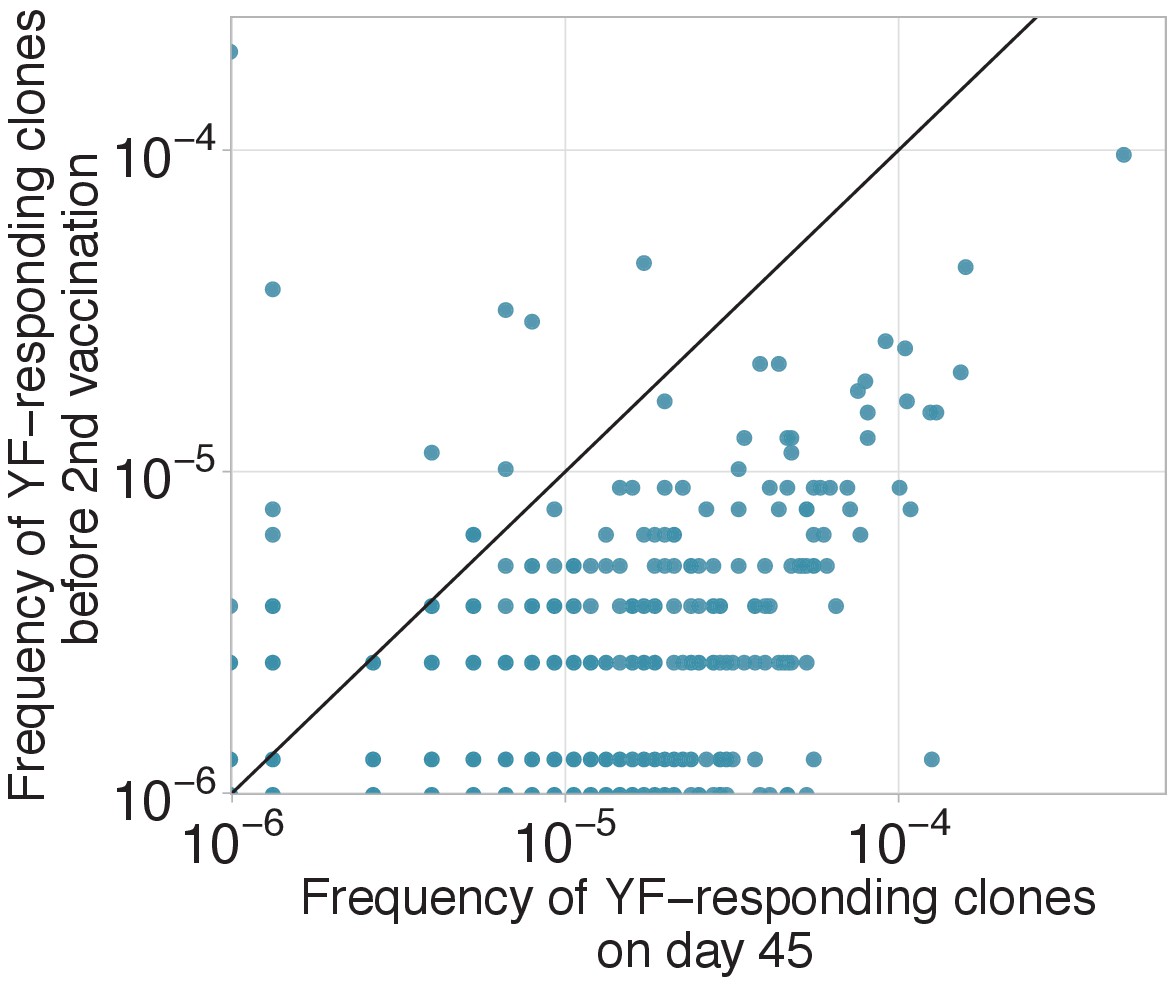
Figure 2—figure supplement 3
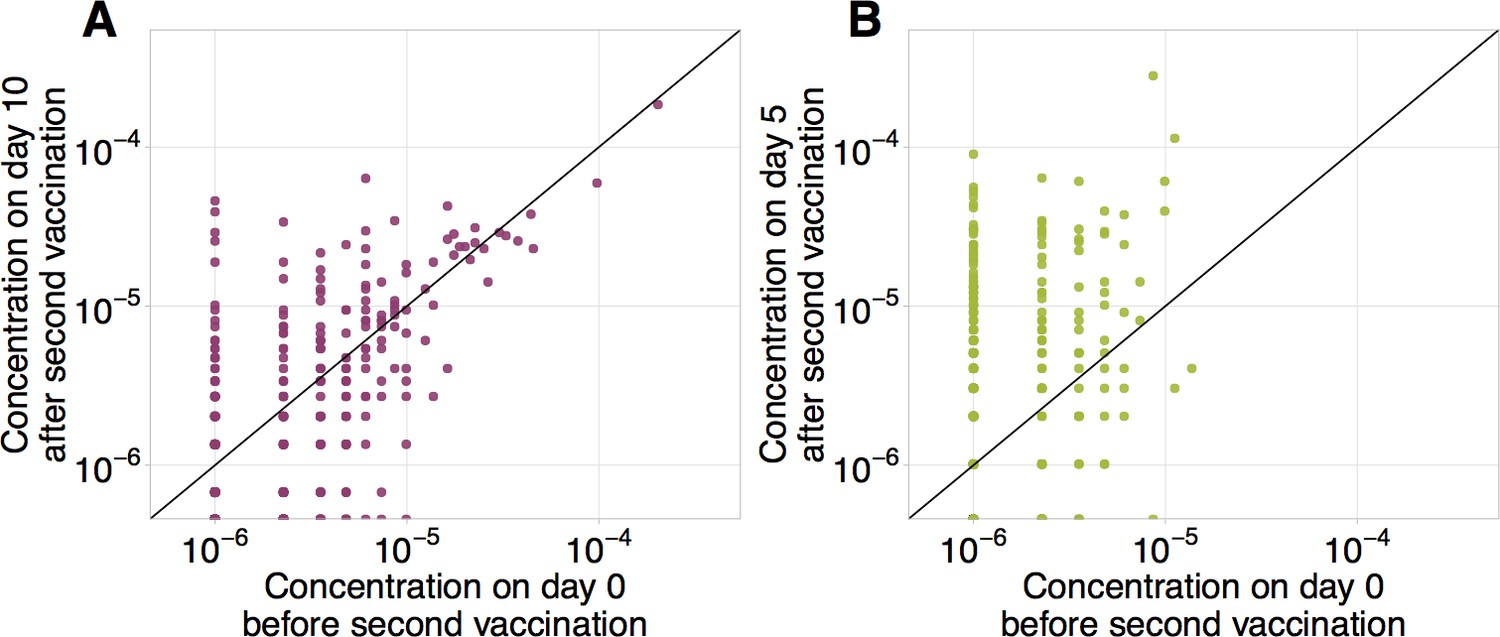
Frequencies of CD8+ and CD4+ YF-responding clonotypes before and after secondary immunization.
Frequencies of CD8+ (A) and CD4+ (B) clonotypes having responded to the primary YFV17D immunization in bulk before (x-axis) versus at the peak of the response to booster immunization (y-axis). Diagonal line shows identity.
Figure 2—figure supplement 4
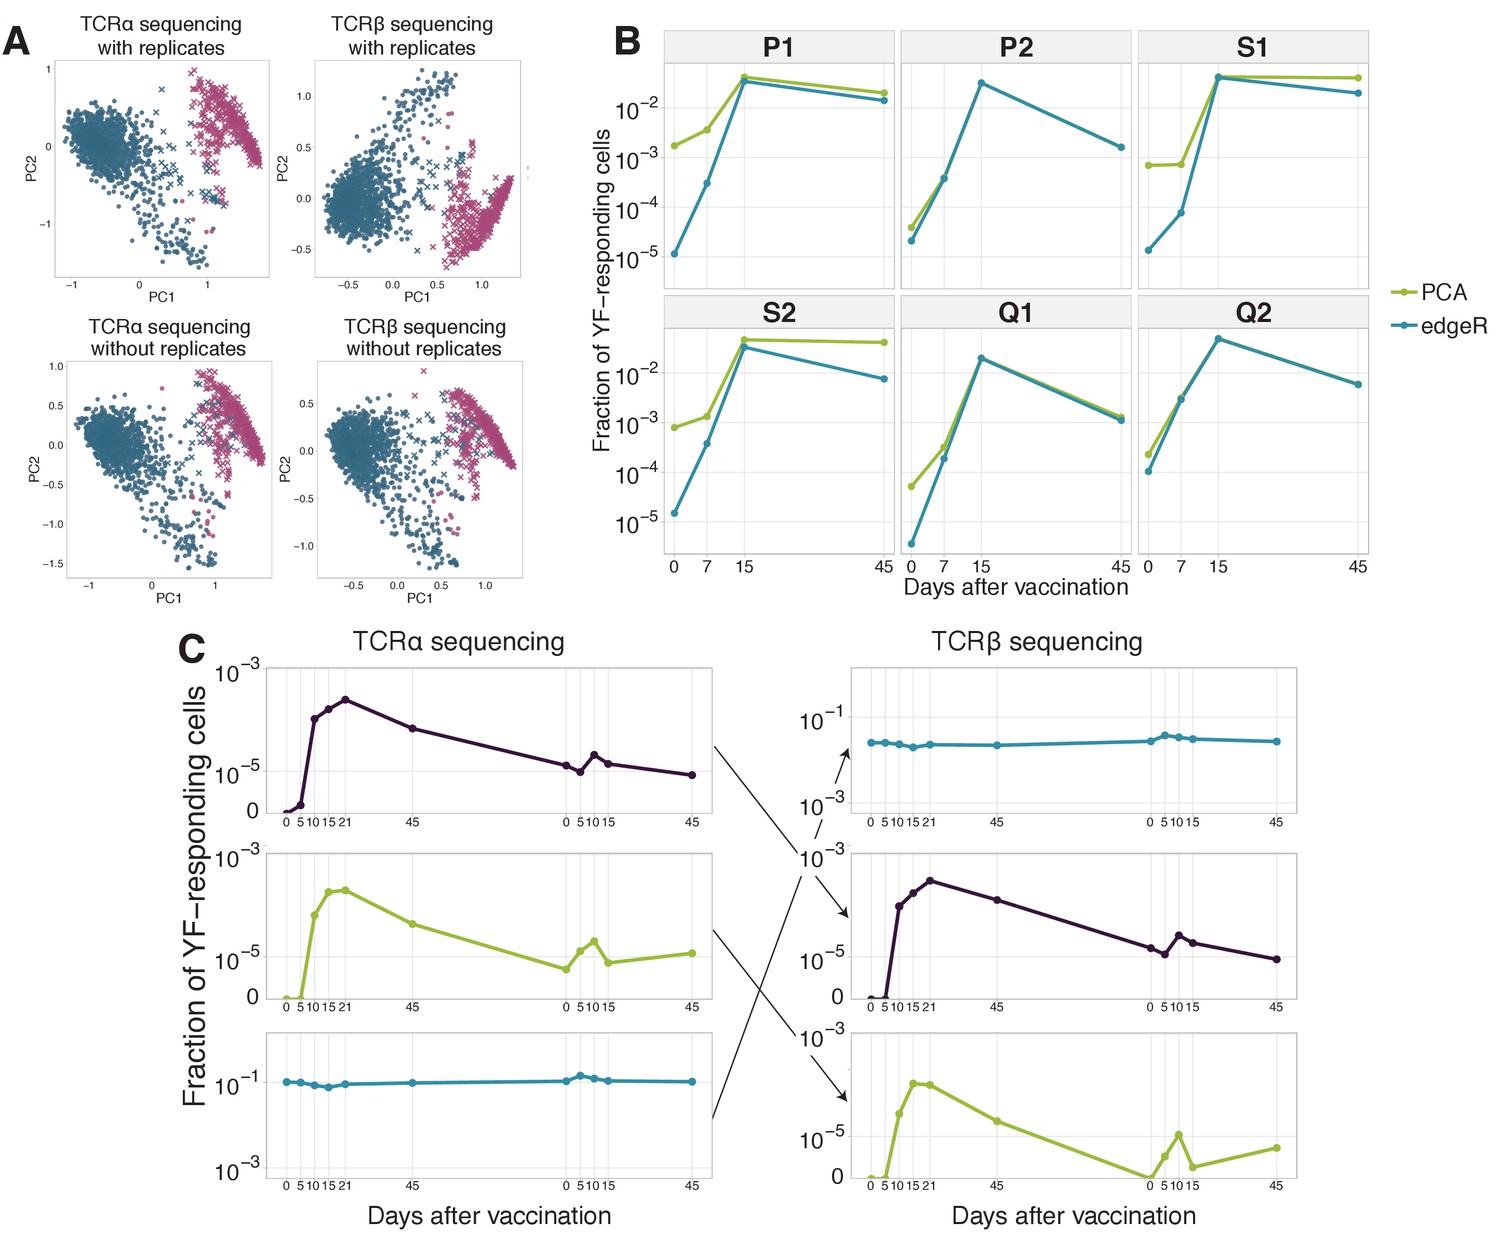
Clustering of time traces allows for expanded clones identification and computational TCR alpha-beta chain pairing.
(A) YF-responding clones identified using hierarchical clustering of clonal time traces with and without biological replicates. The plot shows two first principal components (x and y-axis) of the matrix, where rows are clonotypes and columns are normalized frequencies of these clonotypes on timepoints before and after primary immunization of donor M1. The frequency of each clonotype was normalized by its peak concentration. Pink color shows expanded clonotypes identified with edgeR. Two clusters (circles and crosses) were identified using hierarchical clustering. Similar results were obtained for both TCR alpha (left column) and TCR beta (right column) sequencing, with (top row) and without (bottom row) biological replicates for every timepoint. (B) Dynamics of YF-responding clonotypes after primary vaccination data from Pogorelyy et al. (2018). The cumulative frequency of YF-responding clonotypes defined as significantly expanded by edgeR is shown in blue. The green line indicates the cumulative frequency of responding clonotypes identified by hierarchical clustering of individual clonal trajectories. For the clustering procedure, only frequencies of biological replicate 1 of the bulk repertoire were used. (C) Examples of time traces for two YF-responding (purple and green) and one non-responding (blue) clonotypes in the TCR alpha repertoire (left), and their associated chain in TCR beta repertoire (right). The similarity of the alpha and beta traces of the same clone allows for computational alpha-beta pairing prediction. .
Figure 3 with 2 supplements
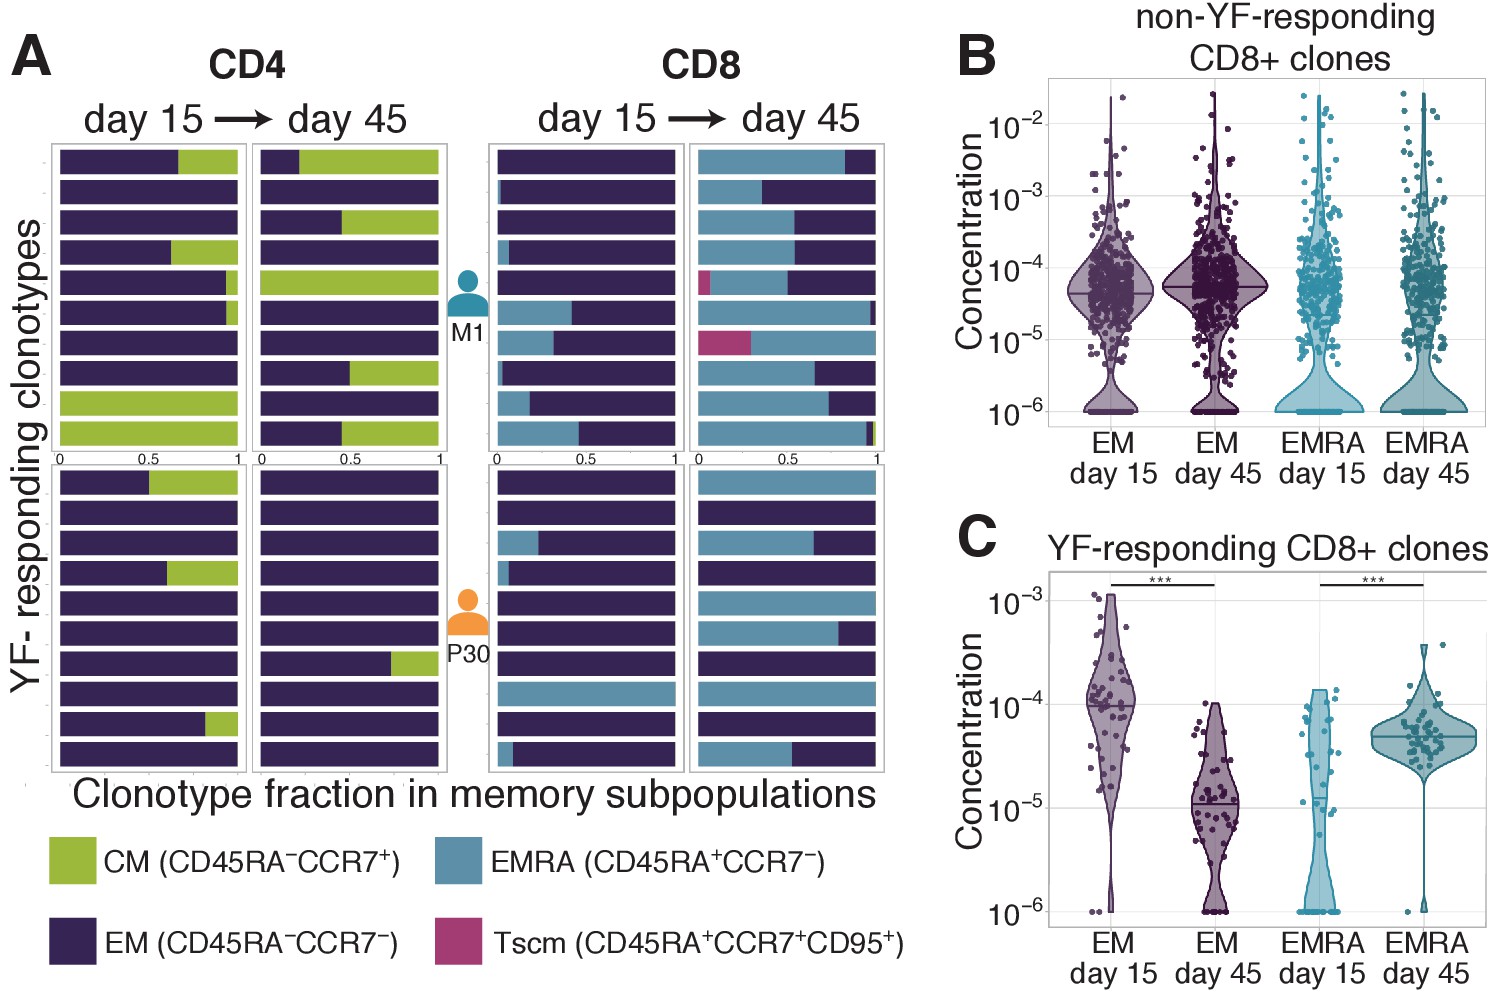
Distribution of clonotypes in memory subsets.
(A) Each color bar shows the estimated distribution of T-cell clones between memory subpopulations for a set of CD4+ (left panel) and CD8+ (right panel) clonotypes for donors M1 (top) and P30 (bottom) on day 15 and day 45. Each panel shows the 10 most abundant YF-responding clones in each donor on day 45, which are present in at least one memory subpopulation on both day 15 and day 45. (B) Estimated concentration of CD8+ clones with a given phenotype at different timepoints in the bulk PBMC repertoire, for non-YF-responding clonotypes and (C) YF-responding CD8+ clonotypes (Mann Whitney U-test, EM: p-value = 2.1 · 10-12, EMRA: p-value = 1.2 · 10-6). Only clones with 30 or more Unique Molecular Identifiers (see Materials and methods) in bulk repertoires on day 45 were used for the analysis.
-
Figure 3—source data 1
Distribution of 10 most abundant CD4+ and CD8+ YF-responding clonotypes from donors M1 and P30 between memory subsets.
- https://cdn.elifesciences.org/articles/53704/elife-53704-fig3-data1-v2.xlsx
-
Figure 3—source data 2
Concentrations of non-YF-responding CD8+ clones in EM and EMRA subsets on day 15 and day 45.
- https://cdn.elifesciences.org/articles/53704/elife-53704-fig3-data2-v2.csv
-
Figure 3—source data 3
Concentrations of YF-responding CD8+ clones in EM and EMRA subsets on day 15 and day 45.
- https://cdn.elifesciences.org/articles/53704/elife-53704-fig3-data3-v2.csv
Figure 3—figure supplement 1
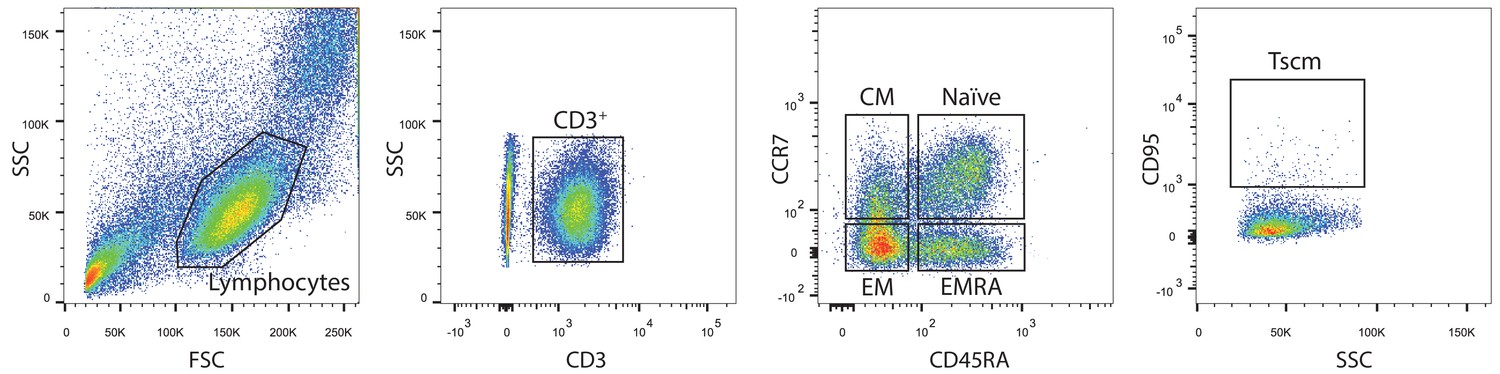
Gating strategy for memory subpopulations.
Central memory (CM) cells were defined as CD3+CCR7+CD45RA-. Effector memory (EM) cells were CD3+CCR7-CD45RA-. Terminally differentiated effector memory (EMRA) cells were CD3+CCR7-CD45RA+. Stem-cell like memory (Tscm) cells were CD3+CCR7+CD45RA+CD95+.
Figure 3—figure supplement 2
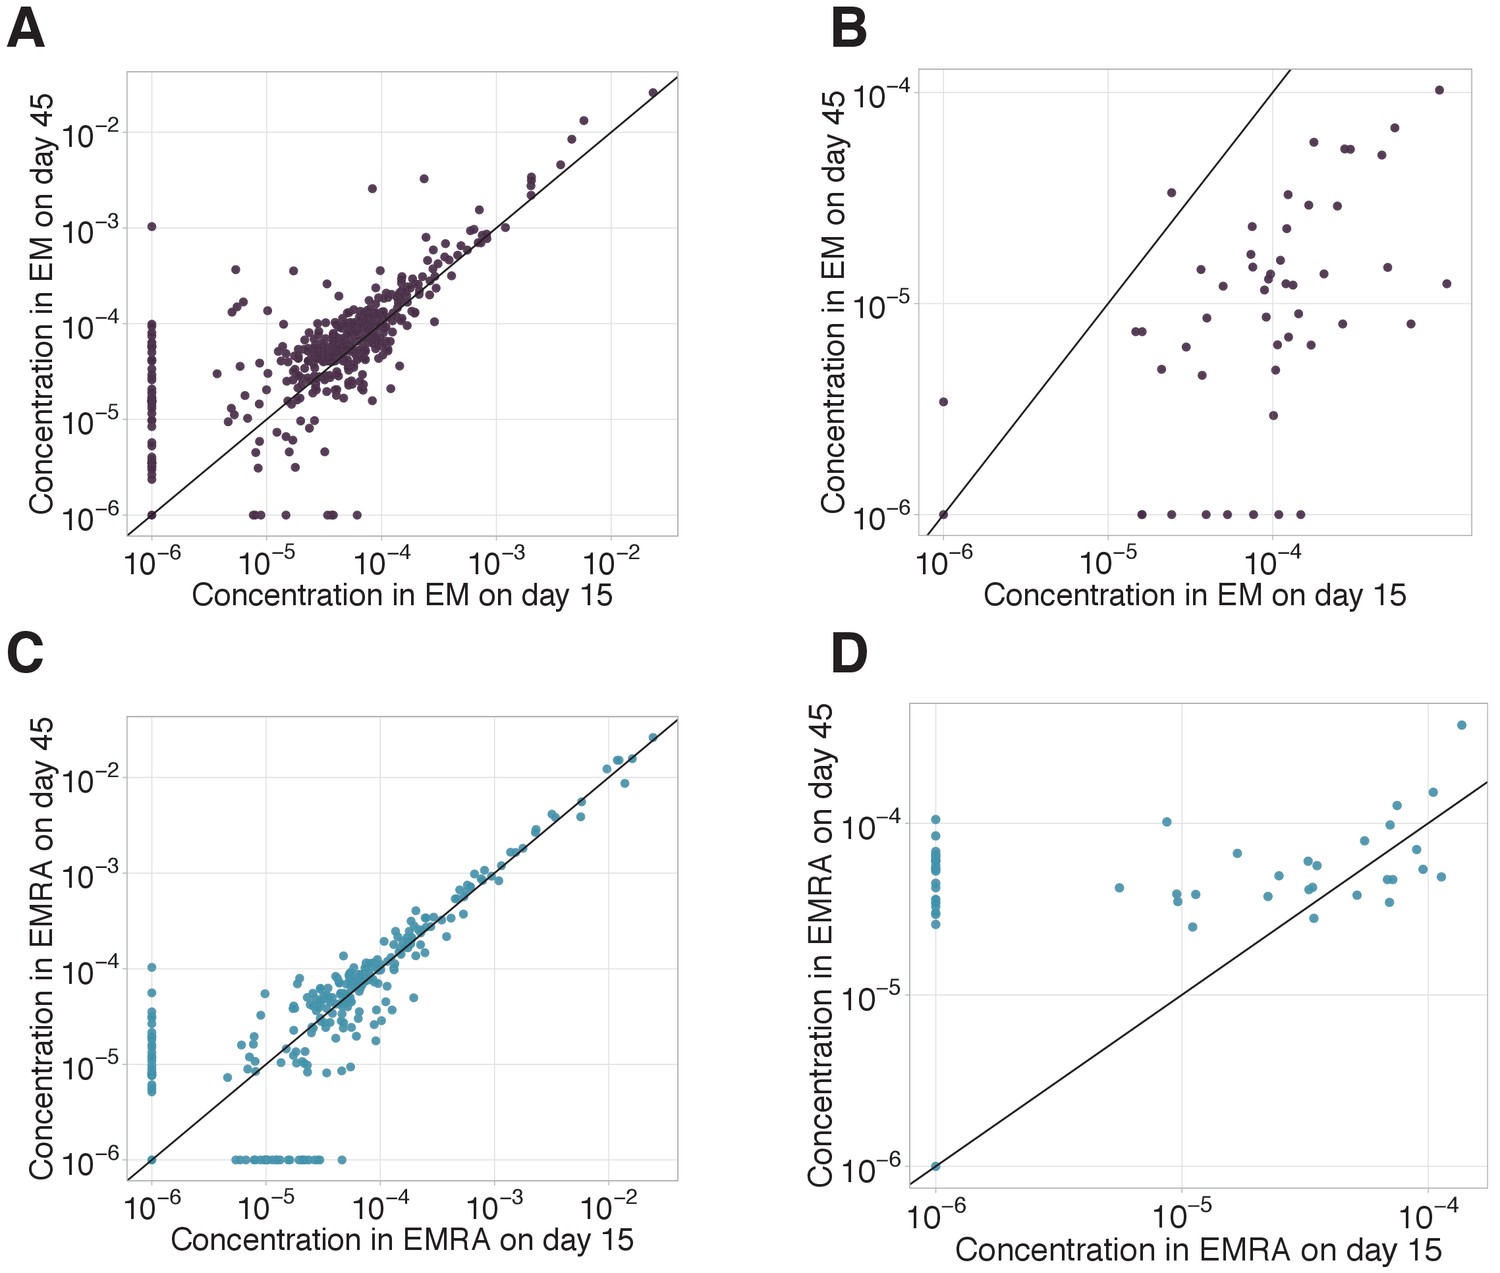
EM-EMRA transition and decay of CD8+ clones between day 15 and day 45.
EM-EMRA transition and decay of CD8+ clones between day 15 and day 45. We plot concentrations of EM (A, B) and EMRA (C, D) of CD8+ cells of each clone with ≥ 30 UMI on day 45 in the bulk repertoire for non-YF-responding (A, C) and YF-responding (B, D) CD8+ clones on day 15 (x-axis) versus day 45 (y-axis). Diagonal line shows identity.
Figure 4 with 4 supplements
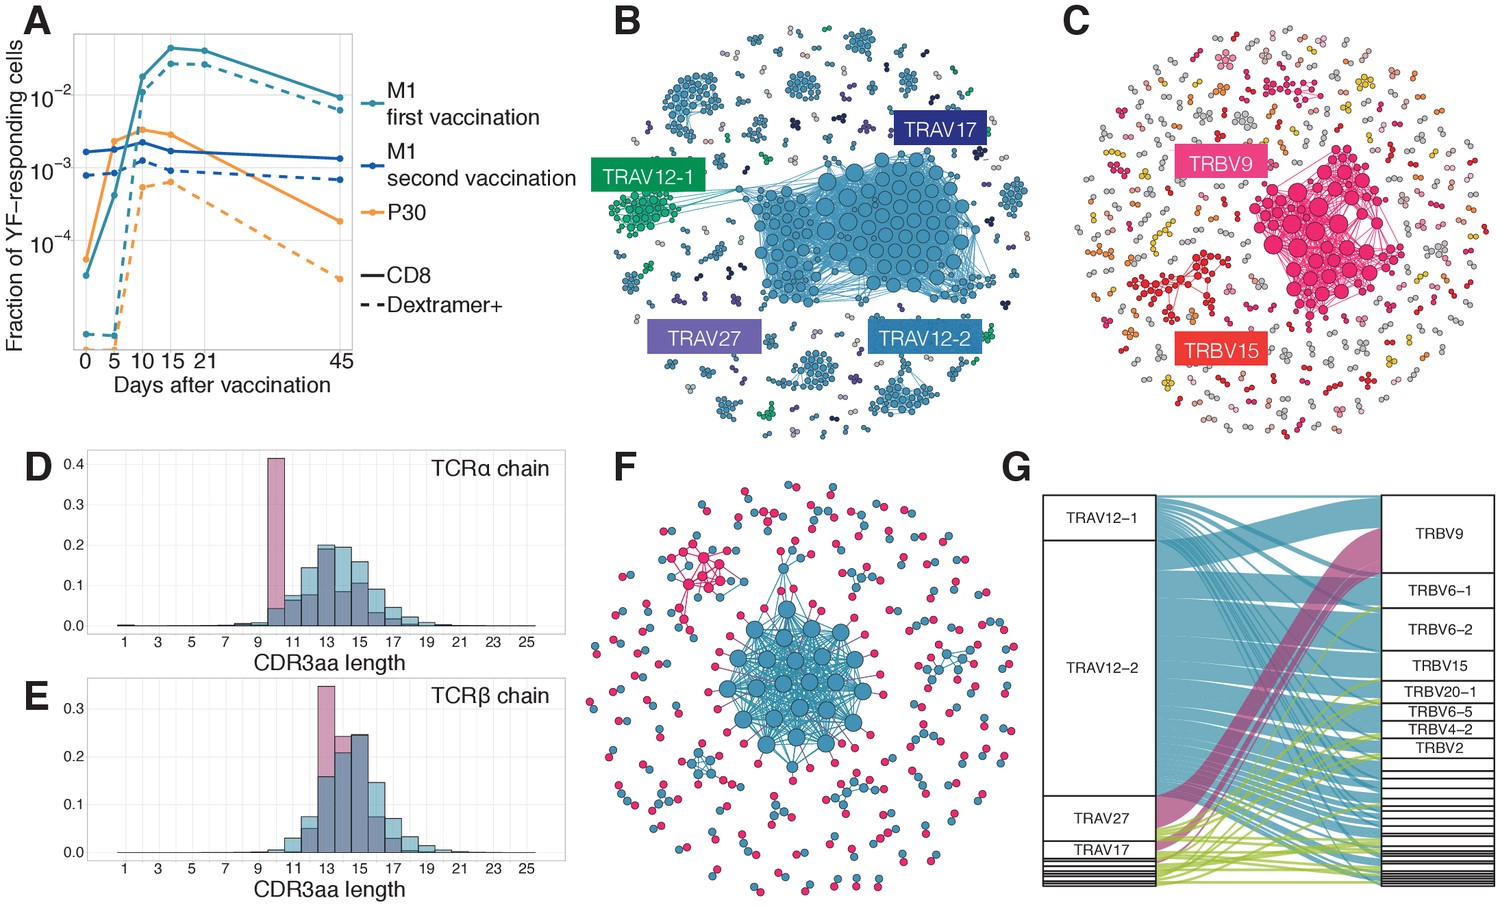
Response to the immunodominant yellow fever epitope NS4B214-222.
(A) Fraction of all T-cells corresponding to CD8+ YF-responding TCRβ clonotypes (solid lines) and CD8+NS4B-specific clonotypes (dashed lines) as a function of time post-vaccination (x-axis). Sequence similarity networks for TCR alpha (B) and beta (C) of NS4B-positive cells. Each vertex is a TCR amino acid sequence, connected with an edge if they differ by fewer than two mismatches. The size of the vertex indicates its degree. Vertices of zero degree are not shown. Color and text boxes indicate V-segments that are significantly enriched (exact Fisher test, Benjamini Hochberg adjusted ) in usage in epitope-specific cells compared to the bulk repertoire. NS4B-specific TCR alpha (D) and TCR beta (E) chains (red histograms) have biases in CDR3 length in comparison to bulk TCR repertoire of CD8+ cells (overlayed blue histograms). (F) Network of single-cell paired TCR alpha (blue) and TCR beta (red) of NS4B-specific TCRs. Vertices of the same color are connected if there are less than two mismatches in TCR chain amino acid sequence. An edge between vertices of different color represents the pairing of alpha and beta. The biggest alpha cluster (blue in the center) corresponds to the TRAV12-2 cluster on B, and it pairs with many dissimilar beta chains. The biggest beta cluster (top left in red) corresponds to the TRBV9 cluster of C. (G) Pairing of V-segments of TCR alpha (left) to V-segments of TCR beta (right) in scTCRseq of NS4B-specific T-cells. The height of each box is proportional to the number of unique clones with this V-segment. The width of ribbons is proportional to the frequency of TRAV-TRBV combination. NS4B-specific TCRs have two main binding modes, defined by TRAV12 segment family paired to almost any TRBV (blue) and by TRAV27 segment paired preferentially with TRBV9 (pink).
-
Figure 4—source data 1
NS4B-specific TCR alpha and TCR beta clonotypes from donors M1 and P30.
- https://cdn.elifesciences.org/articles/53704/elife-53704-fig4-data1-v2.xlsx
-
Figure 4—source data 2
Paired NS4B-specific alpha/beta TCR clonotypes.
- https://cdn.elifesciences.org/articles/53704/elife-53704-fig4-data2-v2.csv
Figure 4—figure supplement 1
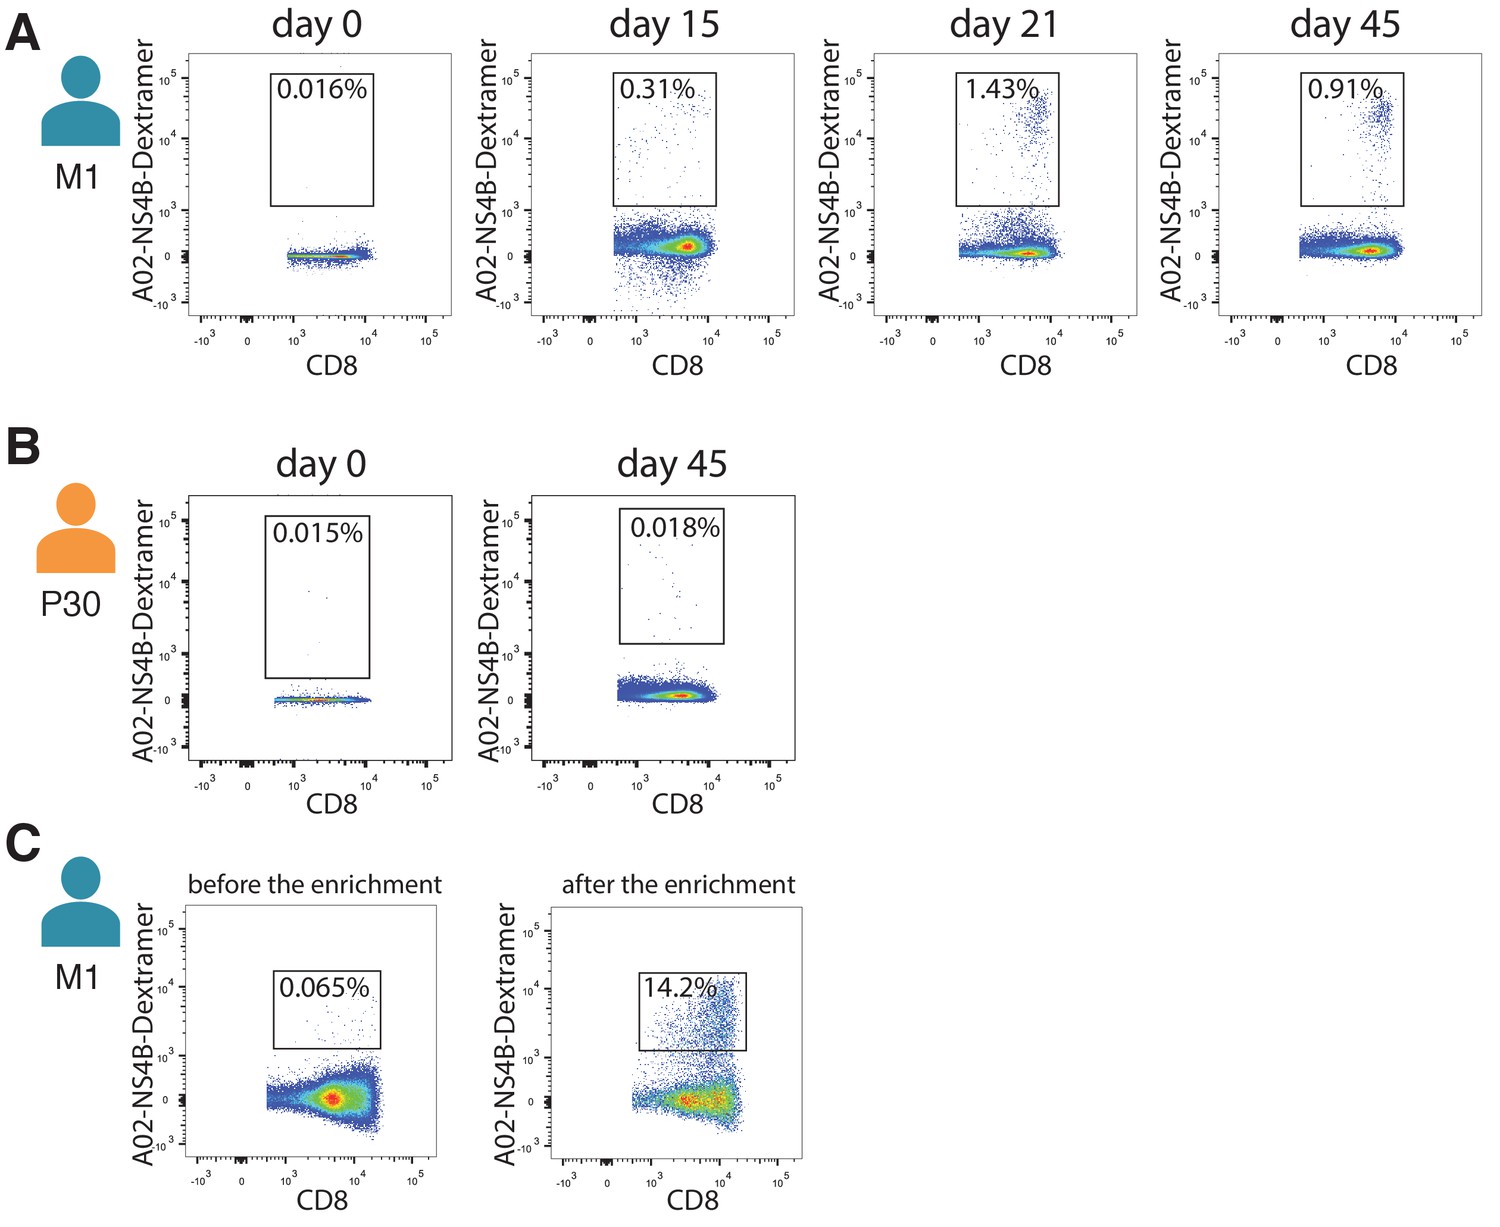
Isolation of NS4B-specific T-cells.
Isolation of NS4B-specific T-cells of donor M1 (A) and donor P30 (B) on different timepoints after YF vaccination. (C) Number of NS4B-dextramer-positive cells before (left) and after (right) enrichment on the magnetic beads. FACS was performed on donor M1 before the second immunization.
Figure 4—figure supplement 2
Dynamics of immunodominant response and other responses.
Dynamics of immunodominant response and other responses. Total frequency of YF-responding NS4B-dextramer positive (solid line) and other YF-responding CD8 clonotypes (dashed line) is plotted on different timepoints after immunization. All clonotypes are called YF-responding using edgeR. .
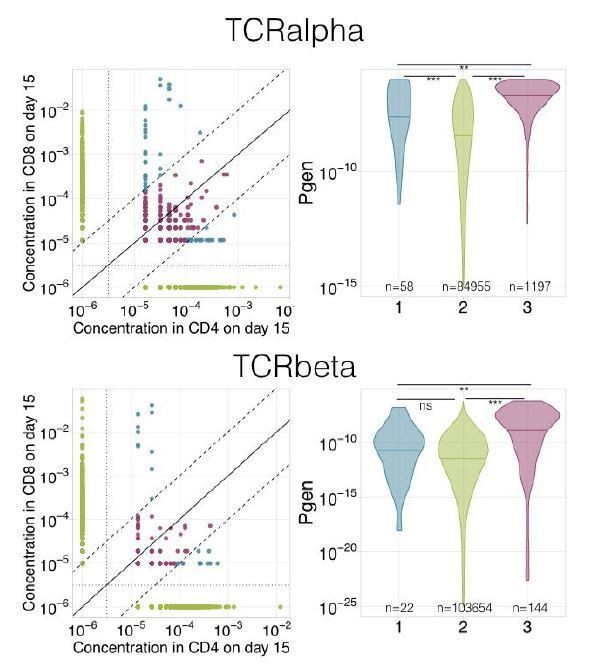
Figure 4—figure supplement 3
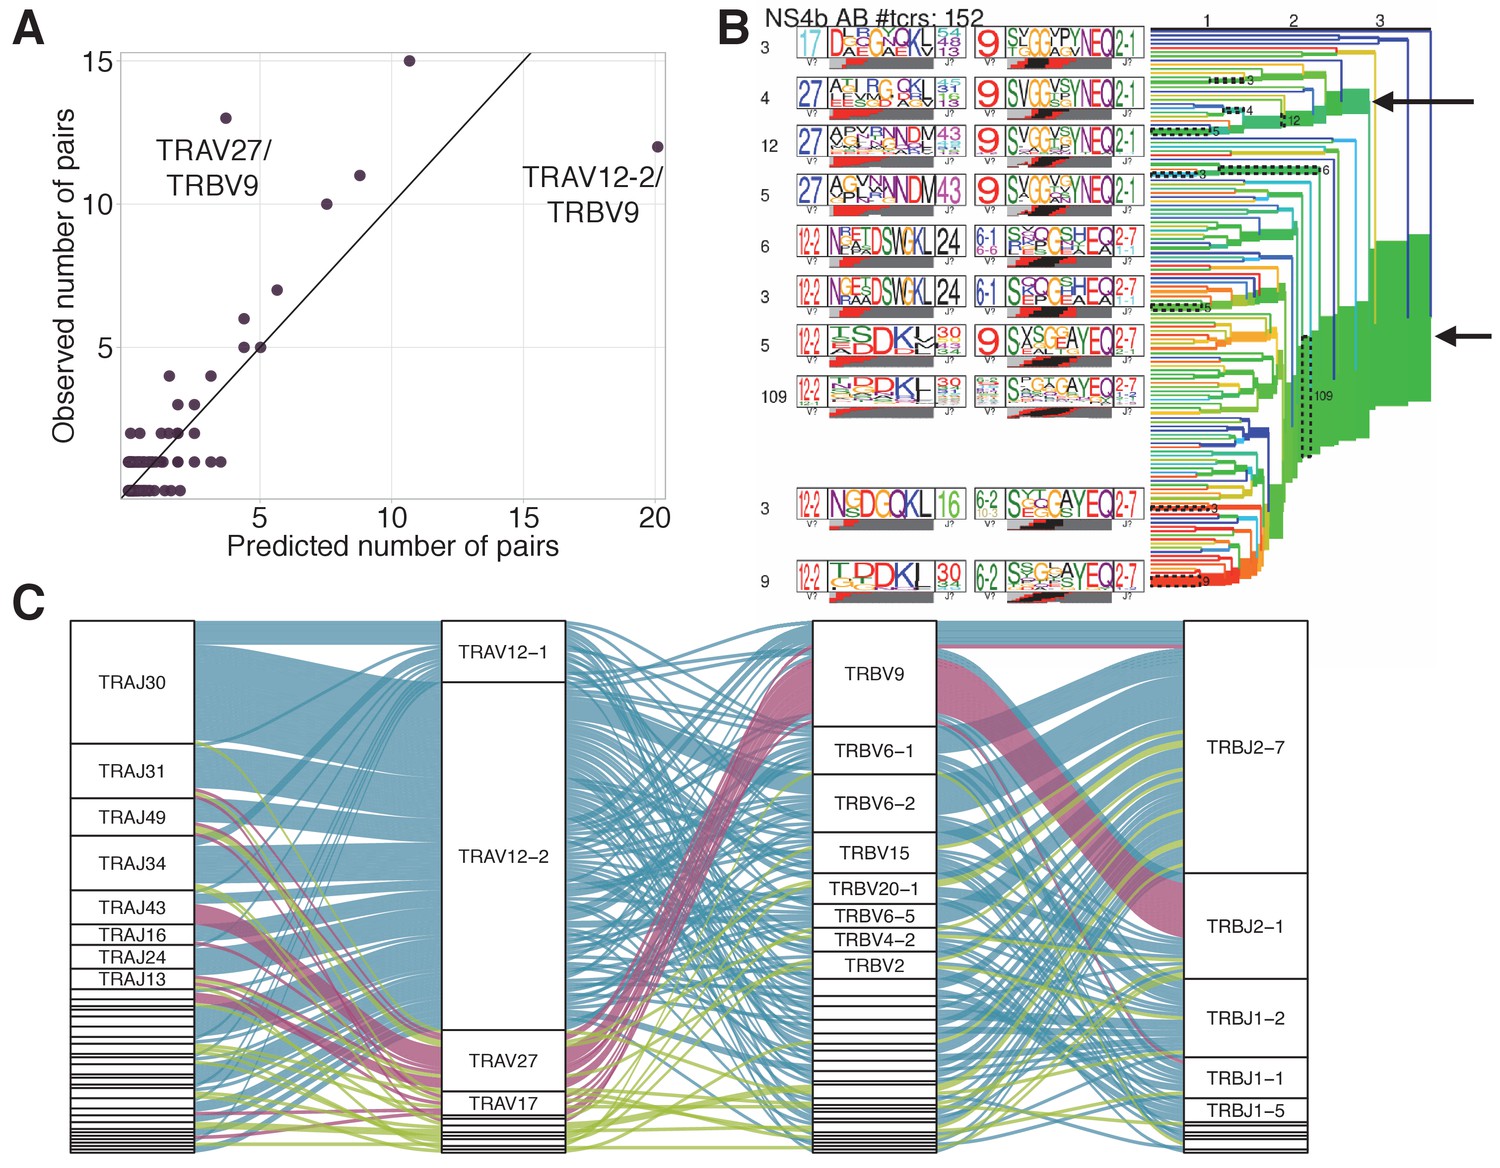
TRAV-TRBV pairing in NS4B-specific TCRs.
(A) TRAV-TRBV pairing in NS4B-dextramer-positive TCRs. Each dot shows TRAV-TRBV combination. The observed number of clonotypes using this combination in TCR is plotted against the number expected under random pairing from TRAV and TRBV frequencies. TRBV9 is expected to form more pairs with TRAV12-2 but pairs with TRAV27 instead, suggesting the existence of selective pressure on the choice of both chains. (B) Results of TCRdist hierarchical clustering of paired scTCR repertoire of NS4B-specific cells. The two largest branches indicated with arrows correspond to TRAV12-2 and TRAV27-TRBV9 motifs. (C)Pairings of J-segments and V-segments of TCR alpha (left) to V-segments and J-segments of TCR beta (right) in scTCRseq of NS4B-specific T-cells. The height of each box is proportional to the number of unique clones with a given gene segment. The width of the ribbons is proportional to the frequency of segment combinations. NS4B-specific TCRs have two main binding modes, defined by the TRAV12 segment family paired to almost any TRBV (blue) and by the TRAV27 segment paired preferentially with TRBV9 (pink). Other combinations are shown in green. .
Figure 4—figure supplement 4
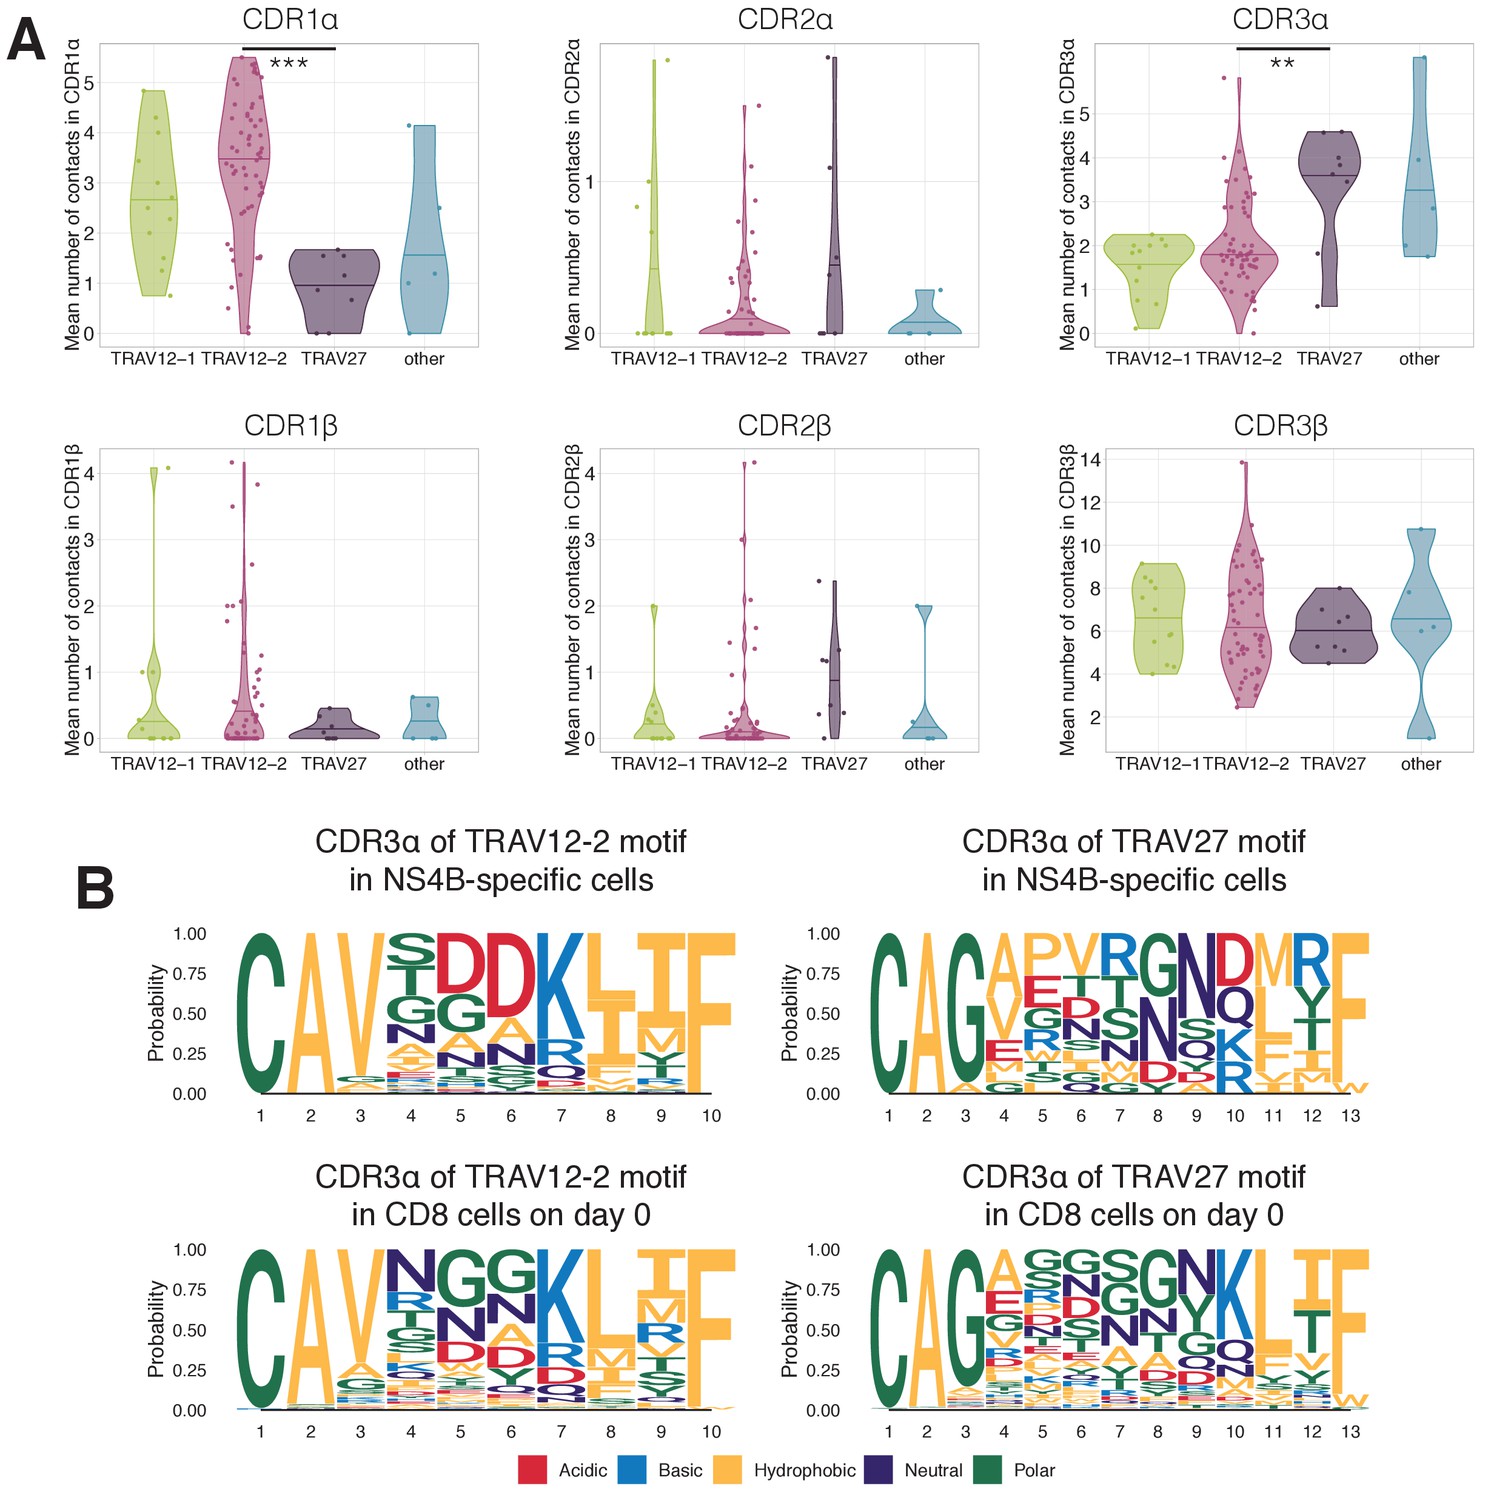
Structural motifs in NS4B-specific TCRs.
(A) Average number of contacts to the LLWNGPMAV peptide in complementary determining regions of TCR alpha (top) and TCR beta (bottom) chains. TCRs with TRAV12 segment (green and pink) have significantly more contacts ( Mann Whitney U-test p-value=0.00015) in CDR1α than TCRs with TRAV27 (purple). On the other hand TCRs with TRAV27 have more contacts in CDR3α than TRAV12-2 TCRs ( Mann Whitney U-test p-value=0.009). No significant difference in the number of contacts was observed for these binding modes in CDRs of the TCR beta chain. (B) Frequency of amino acids in CDR3s of clones with TRAV12-2 and TRAV27 V-segments in dextramer-sorted NS4B-specific clonotypes and bulk CD8 clonotypes prior to the vaccination. For TRAV12-2 motif frequency distribution for TRAV12-2 is close to observed in bulk, suggesting absence of strong selection for certain amino acids in certain positions. .
Figure 5 with 3 supplements
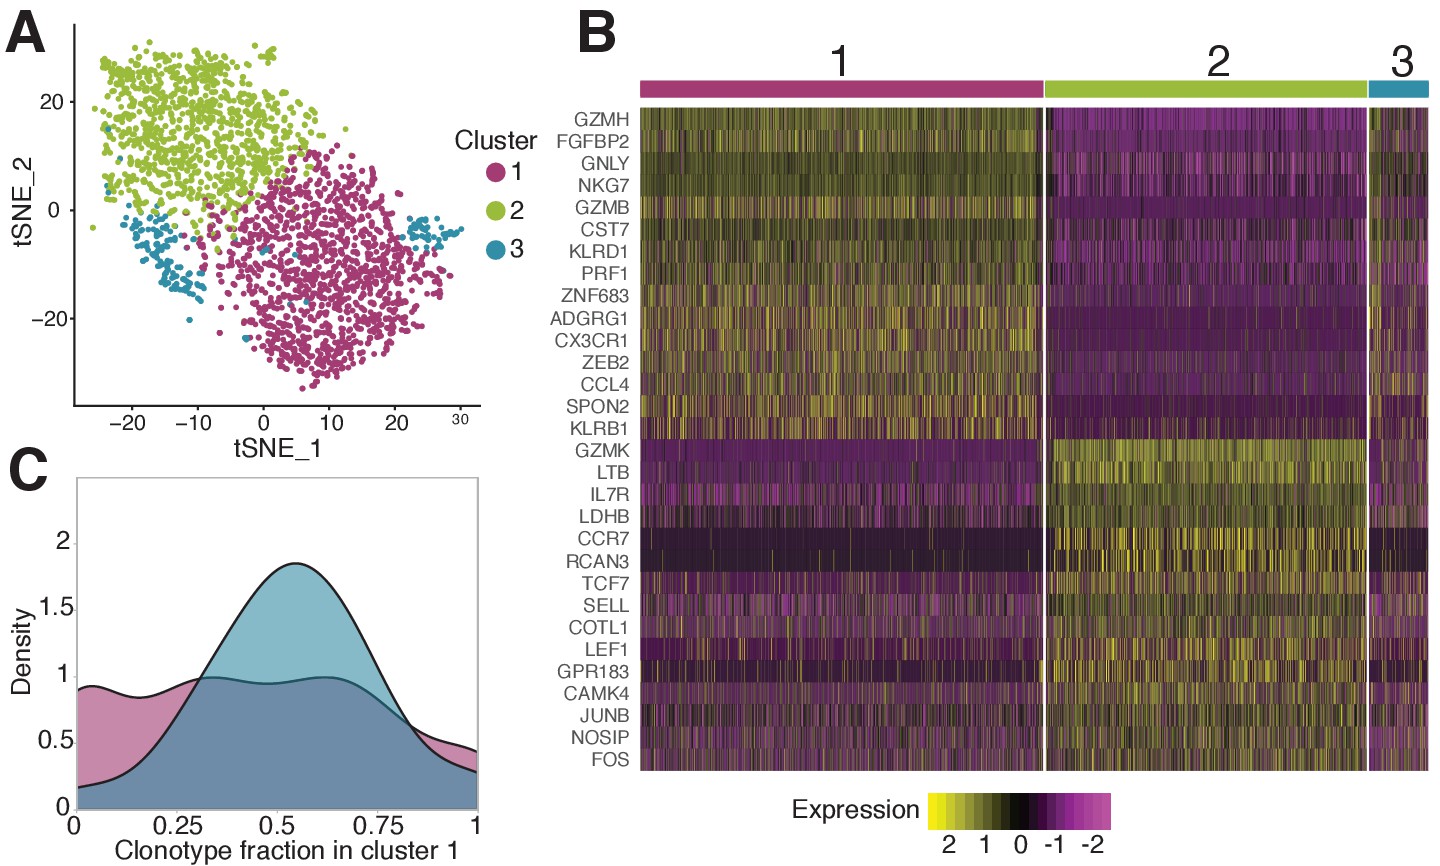
Phenotypic diversity of NS4B-specific cells 18 months after yellow fever immunization.
(A) 2D t-SNE visualization of unsupervised clustering (Seurat analysis) of RNAseq data based on 2000 most variable genes shows three distinct clusters of NS4B-specific cells. (B) The heatmap of top 15 significantly enriched genes of single cells in clusters 1 and 2 defined by the MAST algorithm. The panel above the heatmap identifies the cluster identity of the cells. (C) Gaussian kernel density estimate for the relative fraction of cells belonging to cluster one for each clonotype. Blue distribution shows the theoretical prediction under the null hypothesis: clonotype labels were shuffled between cells (1000 permutations). The observed distribution is flatter than the theoretical one, indicating the presence of clonotypes with either a minority or a majority of cells belonging to cluster 1 ( -test with MC-estimated p-value=0.0005).
-
Figure 5—source data 1
Differentially expressed genes between NS4B-specific cells 18 months after vaccination.
- https://cdn.elifesciences.org/articles/53704/elife-53704-fig5-data1-v2.csv
-
Figure 5—source data 2
Differentially expressed genes between NS4B-specific clonotypes 18 months after vaccination.
- https://cdn.elifesciences.org/articles/53704/elife-53704-fig5-data2-v2.csv
Figure 5—figure supplement 1
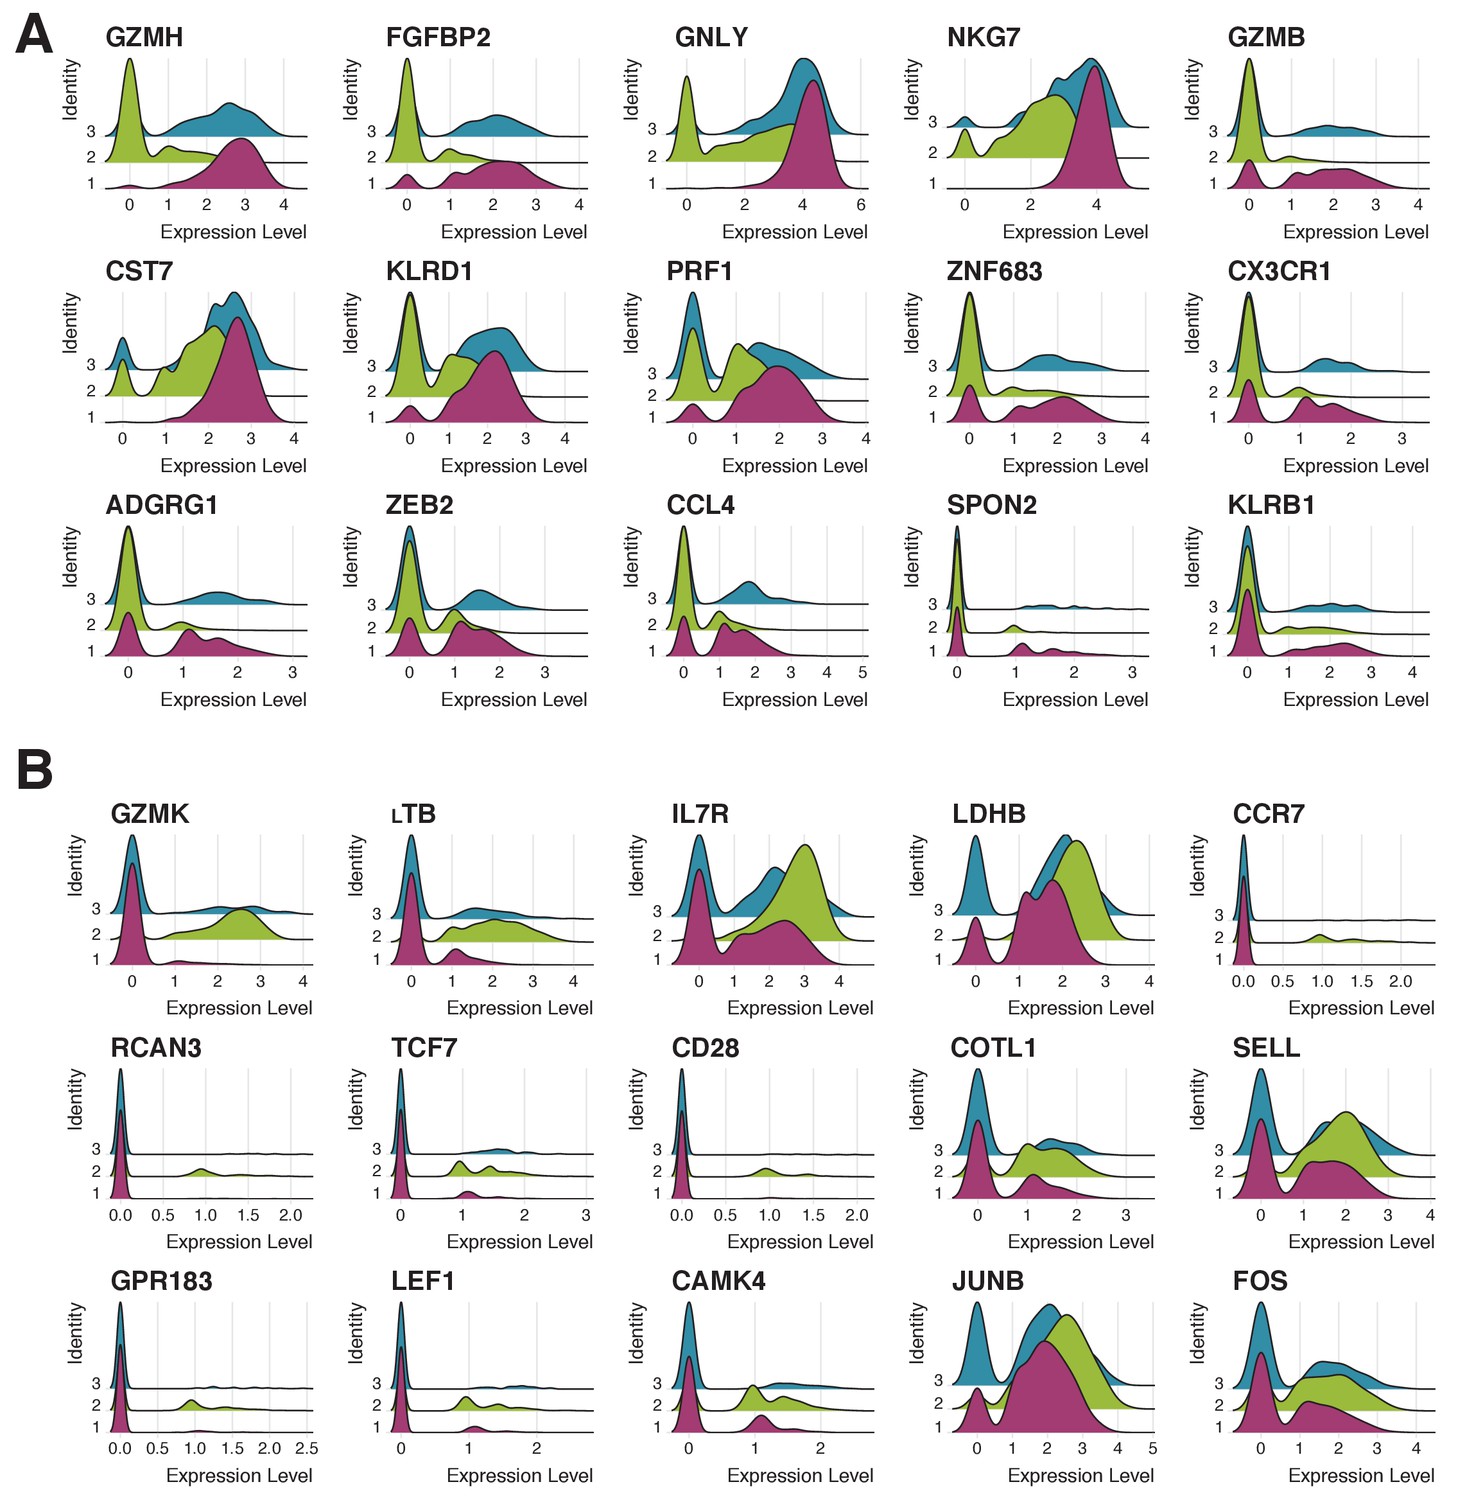
Expression patterns of 15 genes most characteristic of clusters 1 and 2.
(A) Expression of 15 genes most characteristic of cluster one in cells corresponding to clusters 1 (pink), 2 (green) and 3 (blue). Cluster three has the intermediate phenotype. (B) Expression of 15 genes most characteristic of cluster two in cells corresponding to clusters 1 (pink), 2 (green) and 3 (blue). Cluster three has the intermediate phenotype.
Figure 5—figure supplement 2
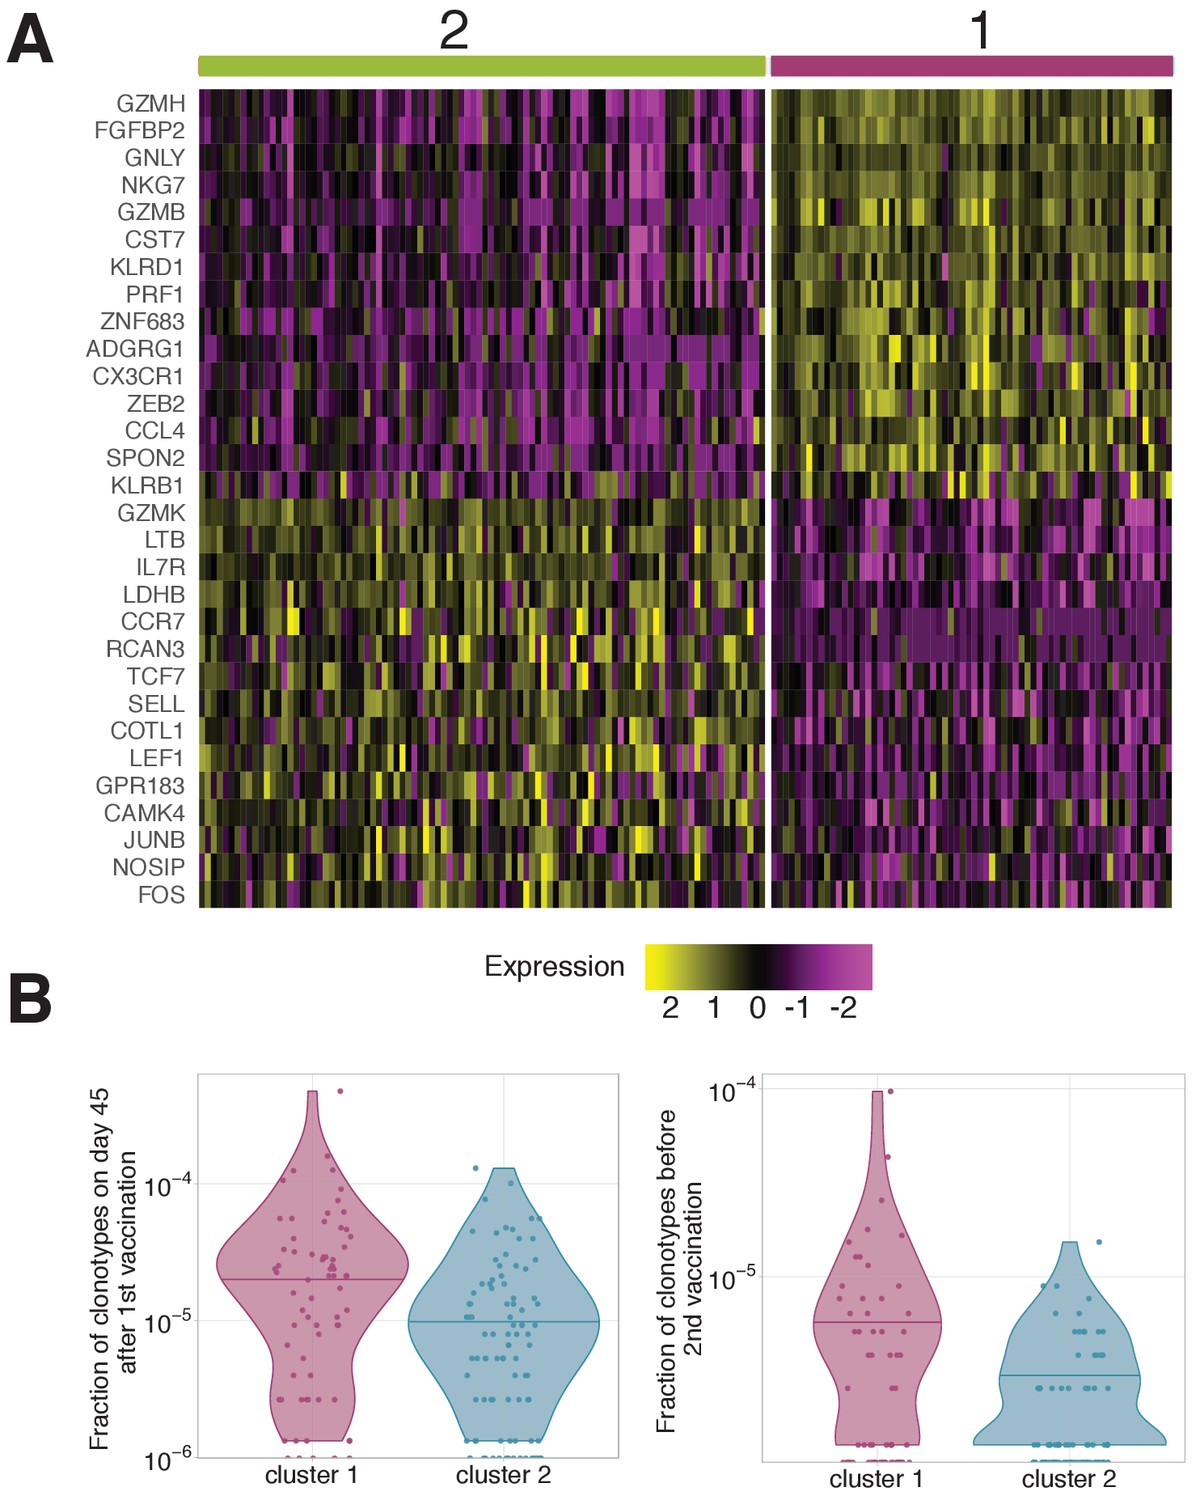
Gene expression patterns averaged by clonotypes.
(A) Genes differentially expressed between clonotypes. Gene expression in each cell was averaged over the clonotypes before differential gene expression analysis. Unsupervised clustering shows two clusters with very similar gene expression to clusters 1 and 2 observed on scRNAseq of individual cells (Figure 5B). (B) Frequency of clonotypes corresponding to cluster 1 and 2, after primary immunization (left), and 18 months later before the booster vaccination (right). Clonotypes associated to cluster one are significantly more abundant on both these timepoints (Mann Whitney U-test A: p-value=0.0003; B: p-value=0.02447 ). .
Figure 5—figure supplement 3
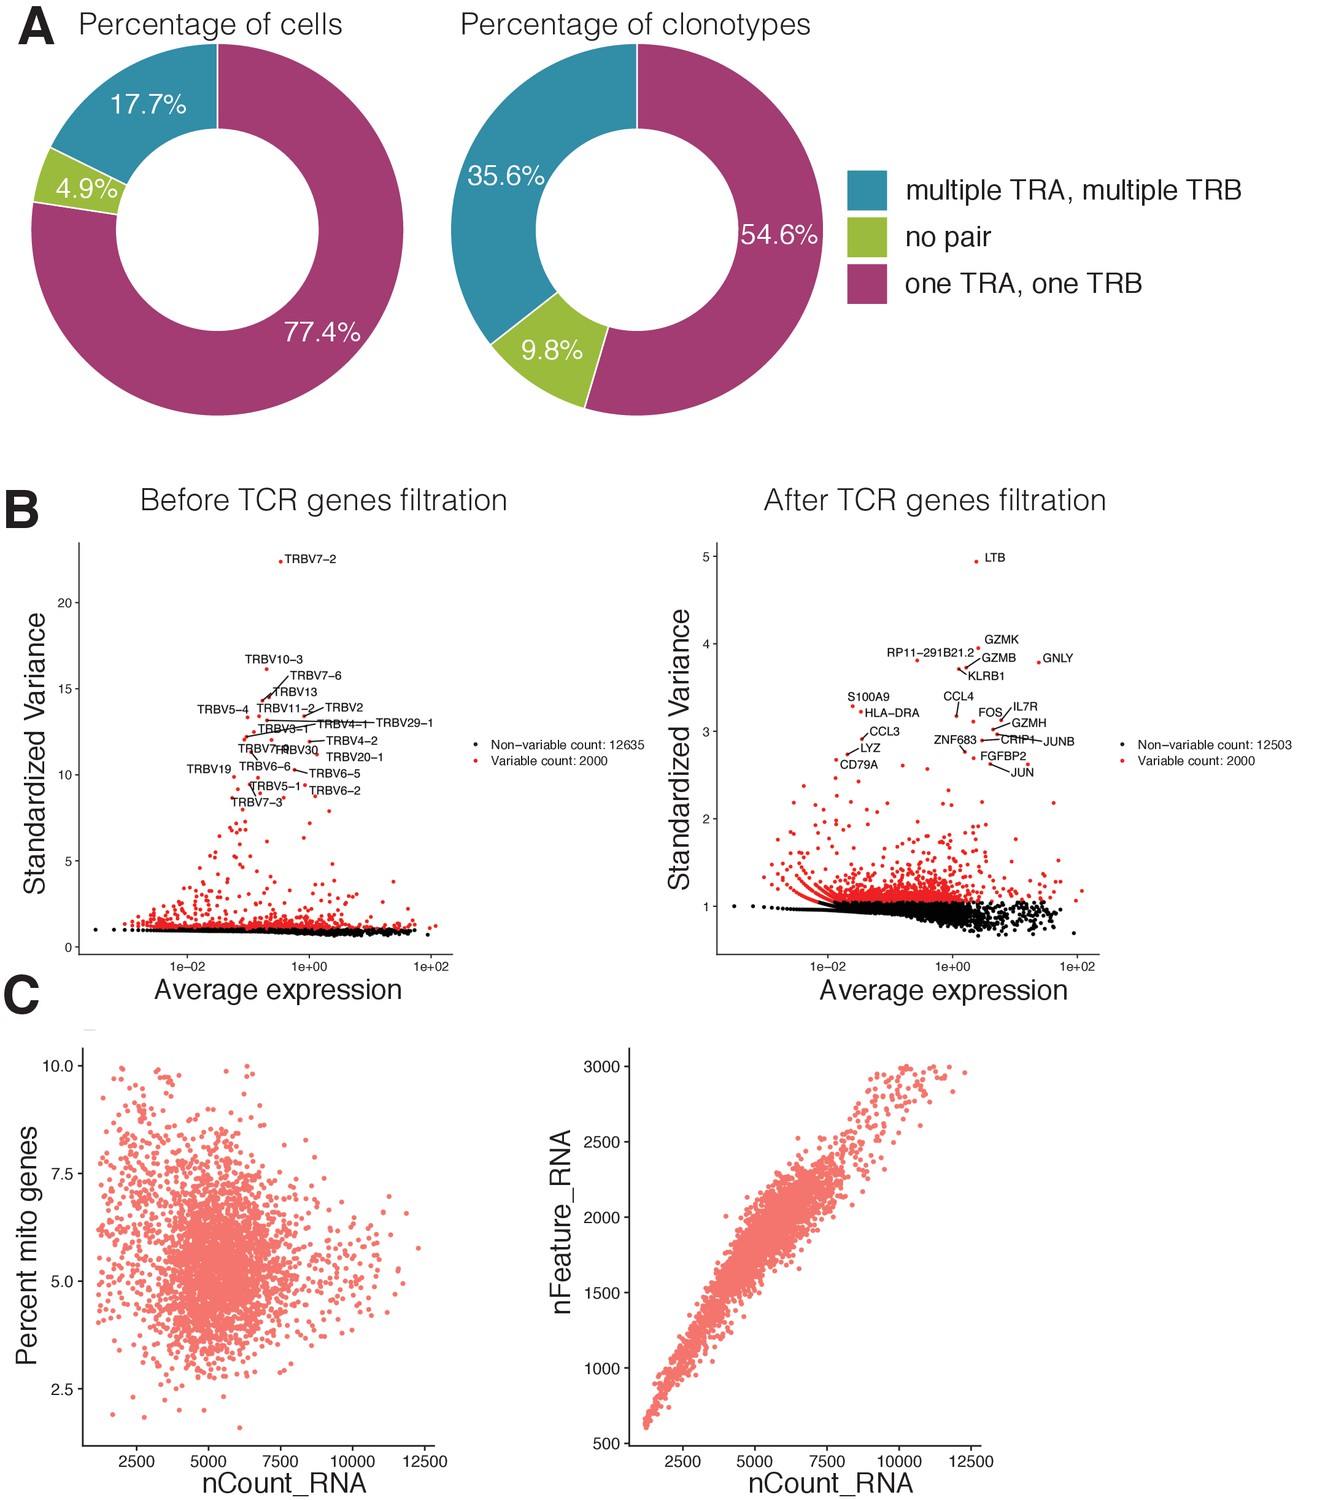
Single cell RNAseq and TCRseq quality control.
(A) Proportion of cells (left) and clonotypes (right) in single-cell TCR sequencing data carrying different numbers of TCR alpha and TCR beta chains. (B) Most variable genes in the dataset before (left) and after (right) the filtration of TCR related genes. TCR related genes were the source of unwanted variation in single-cell gene expression analysis and were removed from the data. (C) Visualization of quality control metrics in the single-cell gene expression experiment. The relationship between the number of RNAs inside the cell (x-axis) and the percentage of mitochondrial genes (y-axis) is shown on the left. The relationship between the number of RNAs inside the cell (x-axis) and the number of genes (y-axis) is shown on the right. Cells that had more than 8% of mitochondrial genes or more than 2700 total number of genes were discarded from further analysis. .
Author response image 1
Tables
Key resources table
| Reagent type | Designation | Source | Identifiers | Additional information |
|---|---|---|---|---|
| Antibody | Anti-CD3-FITC (Mouse monoclonal) | eBioscience | CAT# 11-0038-42 | FACS (5 ul per test) |
| Antibody | anti-CD45RA-eFluor450 (Mouse monoclonal) | eBioscience | CAT# 48-0458-42 | FACS (5 ul per test) |
| Antibody | anti-CCR7-AlexaFluor647 (Rat monoclonal) | BD Pharmingen | CAT# 560921 | FACS (5 ul per test) |
| Antibody | anti-CD95-PE (Mouse monoclonal) | eBioscience | CAT# 12-0959-42 | FACS (5 ul per test) |
| Antibody | anti-CD3-eFluor450 (Mouse monoclonal) | eBioscience | CAT# 48-0038-42 | FACS (5 ul per test) |
| Other | HLA-A*0201 (LLWNGPMAV) dextramer | Immudex | CAT# WB3584 | FACS (10 ul per test) |
| Commercial kit | Chromium Single Cell A Chip Kit | 10x Genomics | CAT# 1000009 | |
| Commercial kit | Chromium Next GEM 5’ Library and Gel Bead Kit | 10x Genomics | CAT# 1000014 | |
| Commercial kit | Chromium V(D)J Enrichment Kit, Human T Cell | 10x Genomics | CAT# 1000005 | |
| Commercial kit | Chromium Single Cell 5’ Library Construction Kit | 10x Genomics | CAT# 1000020 | |
| Commercial kit | Chromium i7 Multiplex Kit | 10x Genomics | CAT# 120262 | |
| Commercial kit | Dynabeads CD4 Positive Isolation Kit | Invitrogen | CAT# 11331D | |
| Commercial kit | Dynabeads CD8 Positive Isolation Kit | Invitrogen | CAT# 11333D |
Table 1
HLA-typing results for donors M1 and P30.
| Locus | M1 | P30 |
|---|---|---|
| A | 02:01:01/24:02:01 | 02:01:01/31:01:02 |
| B | 15:01:01/39:01:01 | 35:01:01/48:01:01 |
| C | 03:04:01/12:03:01 | 04:01:01/08:01:01 |
| DQB1 | 02:01:01/03:02:01 | 03:01:01/03:01:01 |
| DRB1 | 03:01:01/04:01:01 | 11:01:01/12:01:01 |
| DRB3 | 02:02:01 | 01:01:02/02:02:01 |
| DRB4 | 01:03:01 | - |
Additional files
Download links
A two-part list of links to download the article, or parts of the article, in various formats.
Downloads (link to download the article as PDF)
Open citations (links to open the citations from this article in various online reference manager services)
Cite this article (links to download the citations from this article in formats compatible with various reference manager tools)
Primary and secondary anti-viral response captured by the dynamics and phenotype of individual T cell clones
eLife 9:e53704.
https://doi.org/10.7554/eLife.53704


