A small protein encoded by a putative lncRNA regulates apoptosis and tumorigenicity in human colorectal cancer cells
- Regulatory RNAs and Cancer Section, Genetics Branch, Center for Cancer Research (CCR), National Cancer Institute (NCI), National Institutes of Health (NIH), United States
- Developmental Therapeutics Branch, CCR, NCI, NIH, United States
- Molecular Epidemiology Section, Laboratory of Human Carcinogenesis, CCR, NCI, NIH, United States
- Protein Characterization Laboratory, Cancer Research Technology Program, Frederick National Laboratory for Cancer Research, Leidos Biomedical Research, Inc, United States
- Department of Cell and Developmental Biology, Cancer Center at Illinois University of Illinois at Urbana-Champaign, United States
- Molecular Genetics and Carcinogenesis Section, Laboratory of Human Carcinogenesis, CCR, NCI, NIH, United States
- Laboratory of Genetics and Genomics, National Institute on Aging Intramural Research Program, NIH, United States
- Laboratory of Cancer Biology and Genetics, CCR, NCI, NIH, United States
- Laboratory of Cell Biology, CCR, NCI, NIH, United States
- Molecular Genetics Section, Genetics Branch, CCR, NCI, NIH, United States
- Genome Modification Core, Frederick National Lab for Cancer Research, National Cancer Institute, United States
- National Center for Biotechnology Information, National Library of Medicine, NIH, United States
- Pancreatic Cancer Unit, Laboratory of Human Carcinogenesis, CCR, NCI, NIH, United States
Figures
Figure 1 with 3 supplements
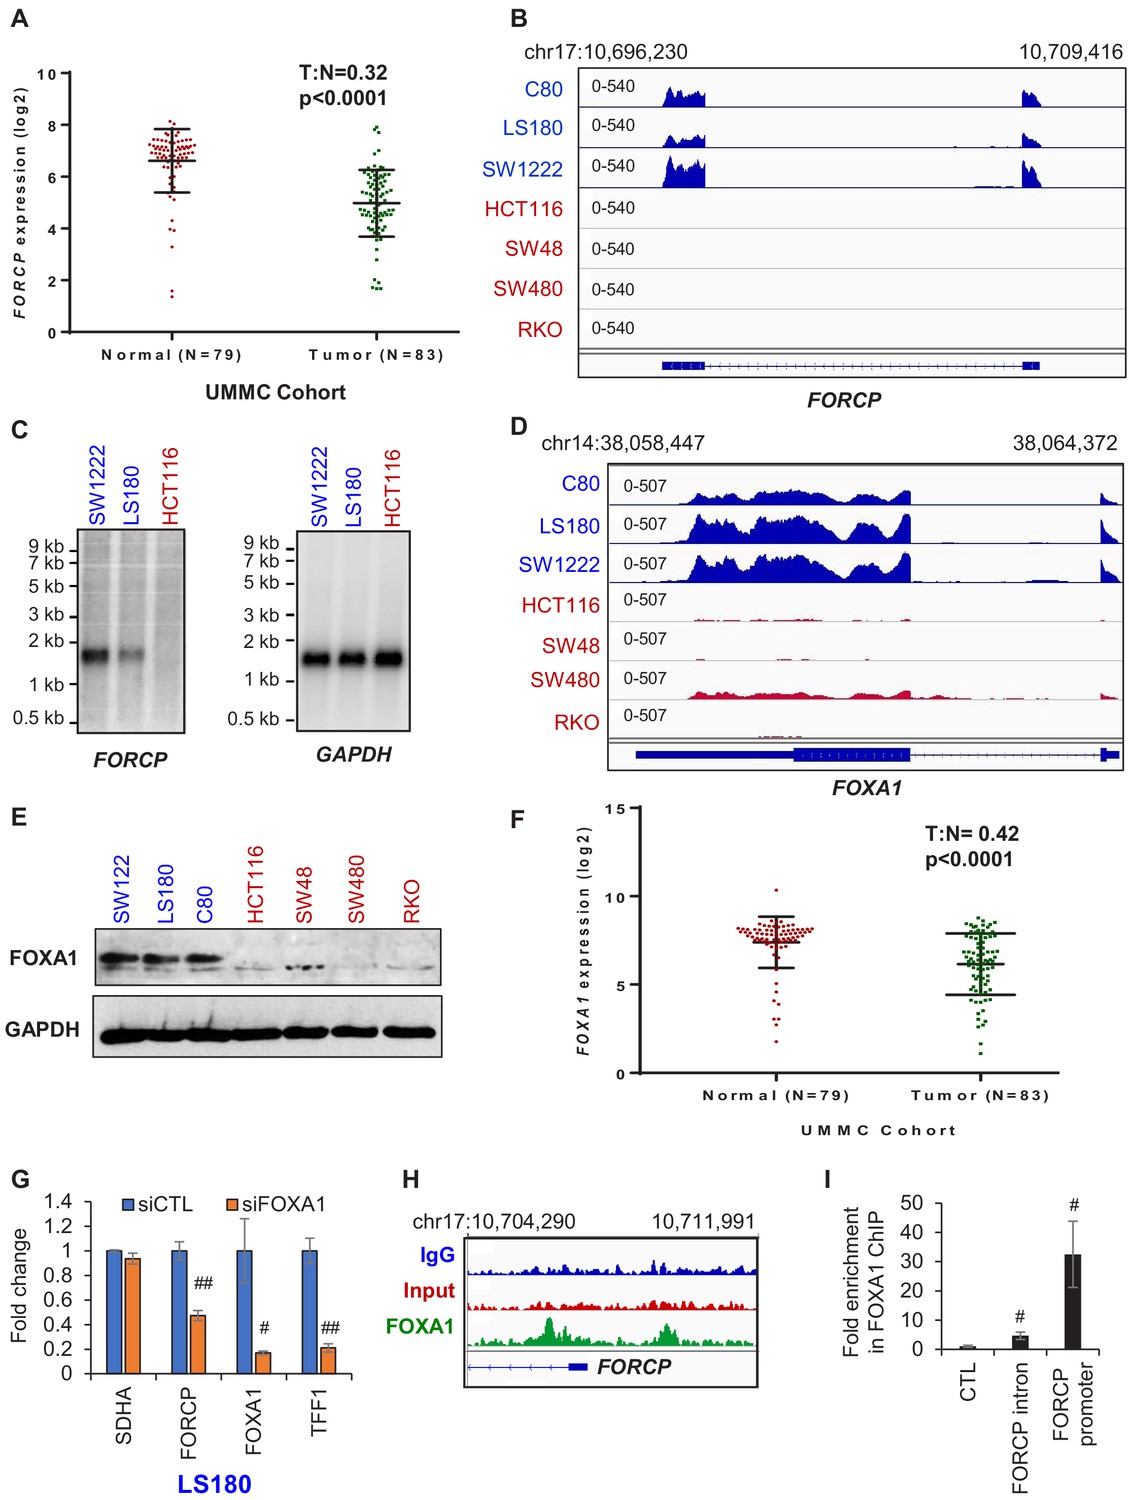
FORCP expression is restricted to well-differentiated CRC cells and is controlled by FOXA1.
(A) Analysis of FORCP expression in CRC patient samples and matched normal colon in the UMMC cohort from which we performed lncRNA microarrays from 83 CRC patient samples and 79 matched normal tissue (Schetter et al., unpublished). T refers to tumors and N refers to normal human colon tissue. There were 79 and 83 samples for N and T, respectively. UMMC refers to University of Maryland Medical Center Cohort. (B) IGV snapshot from our RNA-seq shows robust FORCP expression in well-differentiated CRC cell lines (blue) and undetectable FORCP expression in poorly differentiated CRC lines (red). (C) Northern blot analysis was performed for FORCP RNA and the loading control GAPDH mRNA in well-differentiated (SW1222 and LS180) and poorly differentiated CRC cells (HCT116). (D, E) IGV snapshot from our RNA-seq (D) and immunoblotting (E) demonstrating higher expression of FOXA1 in well-differentiated (blue) compared to poorly differentiated (red) CRC cell lines. GAPDH served as a loading control (E). (F) Decreased FOXA1 expression in CRC tumor samples compared to normal samples in the UMMC cohort is shown. (G) qRT-PCR analysis following FOXA1 knockdown in LS180 cells demonstrates efficient knockdown of FOXA1, and decreased FORCP and TFF1 levels. qRT-PCR was normalized to GAPDH. SDHA served as a negative control. (H) IGV snapshot from FOXA1 ChIP-seq from LS180 cells shows two FOXA1 peaks located in the intronic and promoter region of FORCP, respectively. (I) Association of FOXA1 with the intronic and promoter region of FORCP was validated by ChIP-qPCR. Error bars in (G) and (I) represent standard deviation from three experiments. Error bars in panels G and I represent standard deviation (SD) from three experiments. #p<0.01, ##p<0.001.
-
Figure 1—source data 1
FOXA1 and GAPDH immunoblots for Figure 1E.
- https://cdn.elifesciences.org/articles/53734/elife-53734-fig1-data1-v2.docx
Figure 1—figure supplement 1
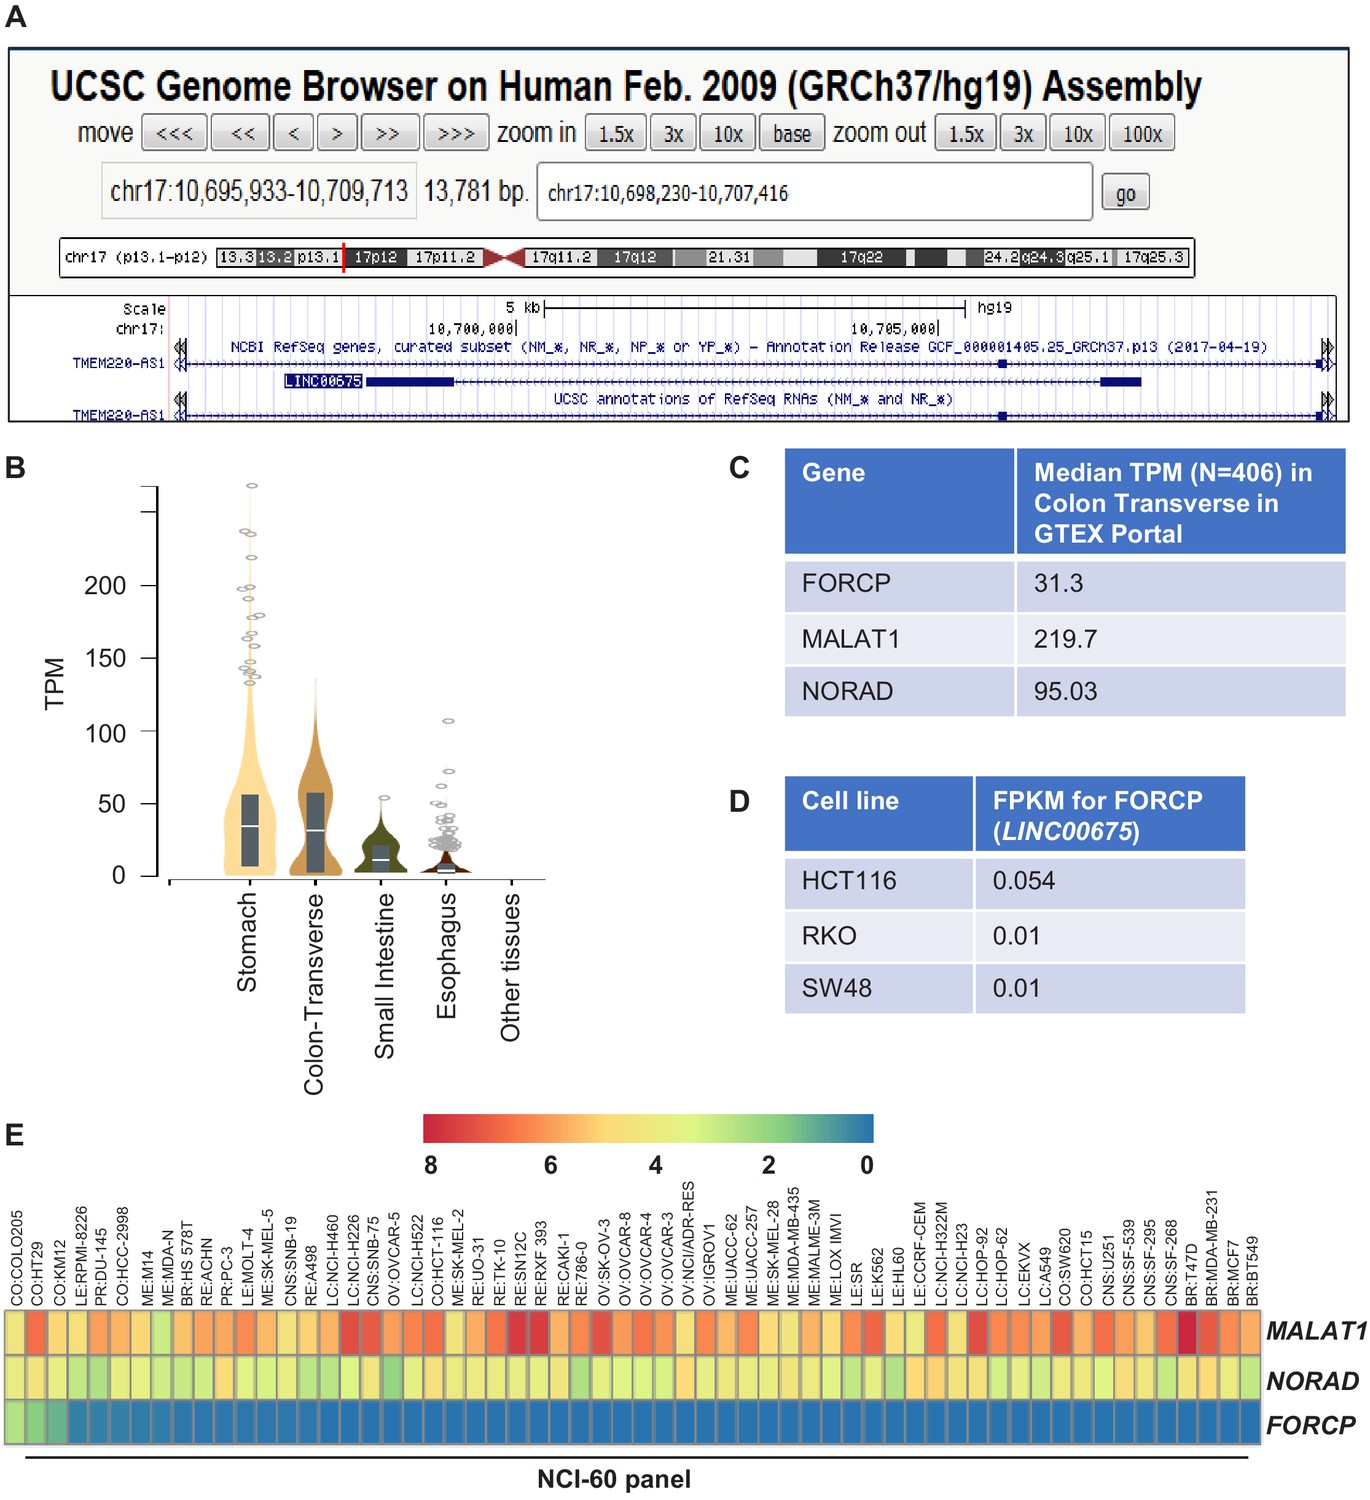
FORCP expression in cell lines and normal human tissues.
(A) Snapshot of UCSC genome browser shows that FORCP (LINC00675) locus overlaps with the TMEM220-AS1 intron transcribed from the opposite strand. (B) FORCP expression in RNA-seq across normal human tissues (data from GTExPortal). TPM refers to transcripts per kilobase million. (C) Expression of FORCP, MALAT1, and NORAD in RNA-seq from normal human tissues (data from GTEX Portal). (D) Expression of FORCP in poorly differentiated CRC lines HCT116, RKO, and SW48 is shown. See Supplementary file 2 for more details. FPKM refers to fragments per kilobase of exon model per million reads mapped. (E) Heat map showing the expression pattern of FORCP and the abundant lncRNAs MALAT1 and NORAD in the NCI-60 panel of cell lines. See Supplementary file 1 for more details.
Figure 1—figure supplement 2
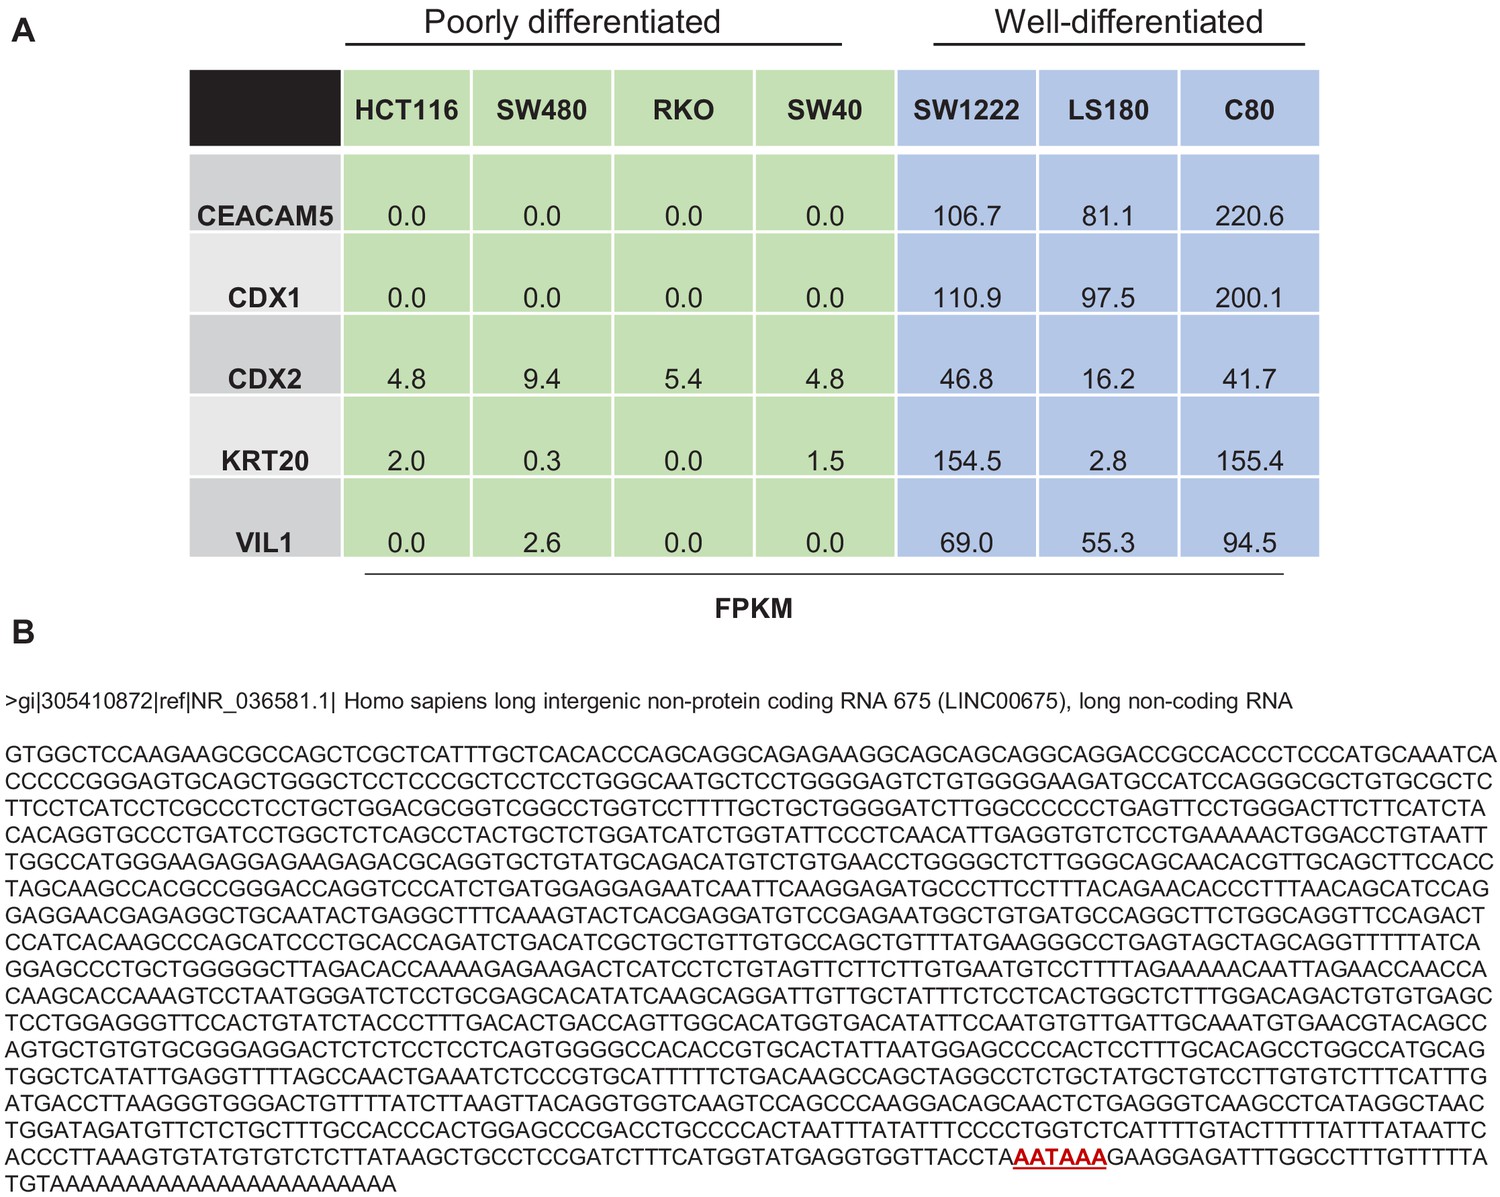
Expression of specific gens in CRC cell lines.
(A) RNA-seq was used to determine the expression of specific pro-differentiation genes in poorly differentiated CRC lines (green) vs well-differentiated CRC lines (blue). See Supplementary file 2 for more details. (B) Sequence of FORCP transcript annotated as LINC00675 by Refseq is shown. Polyadenylation signal (AATAAA) is shown in red near the 3′ end of the transcript.
Figure 1—figure supplement 3
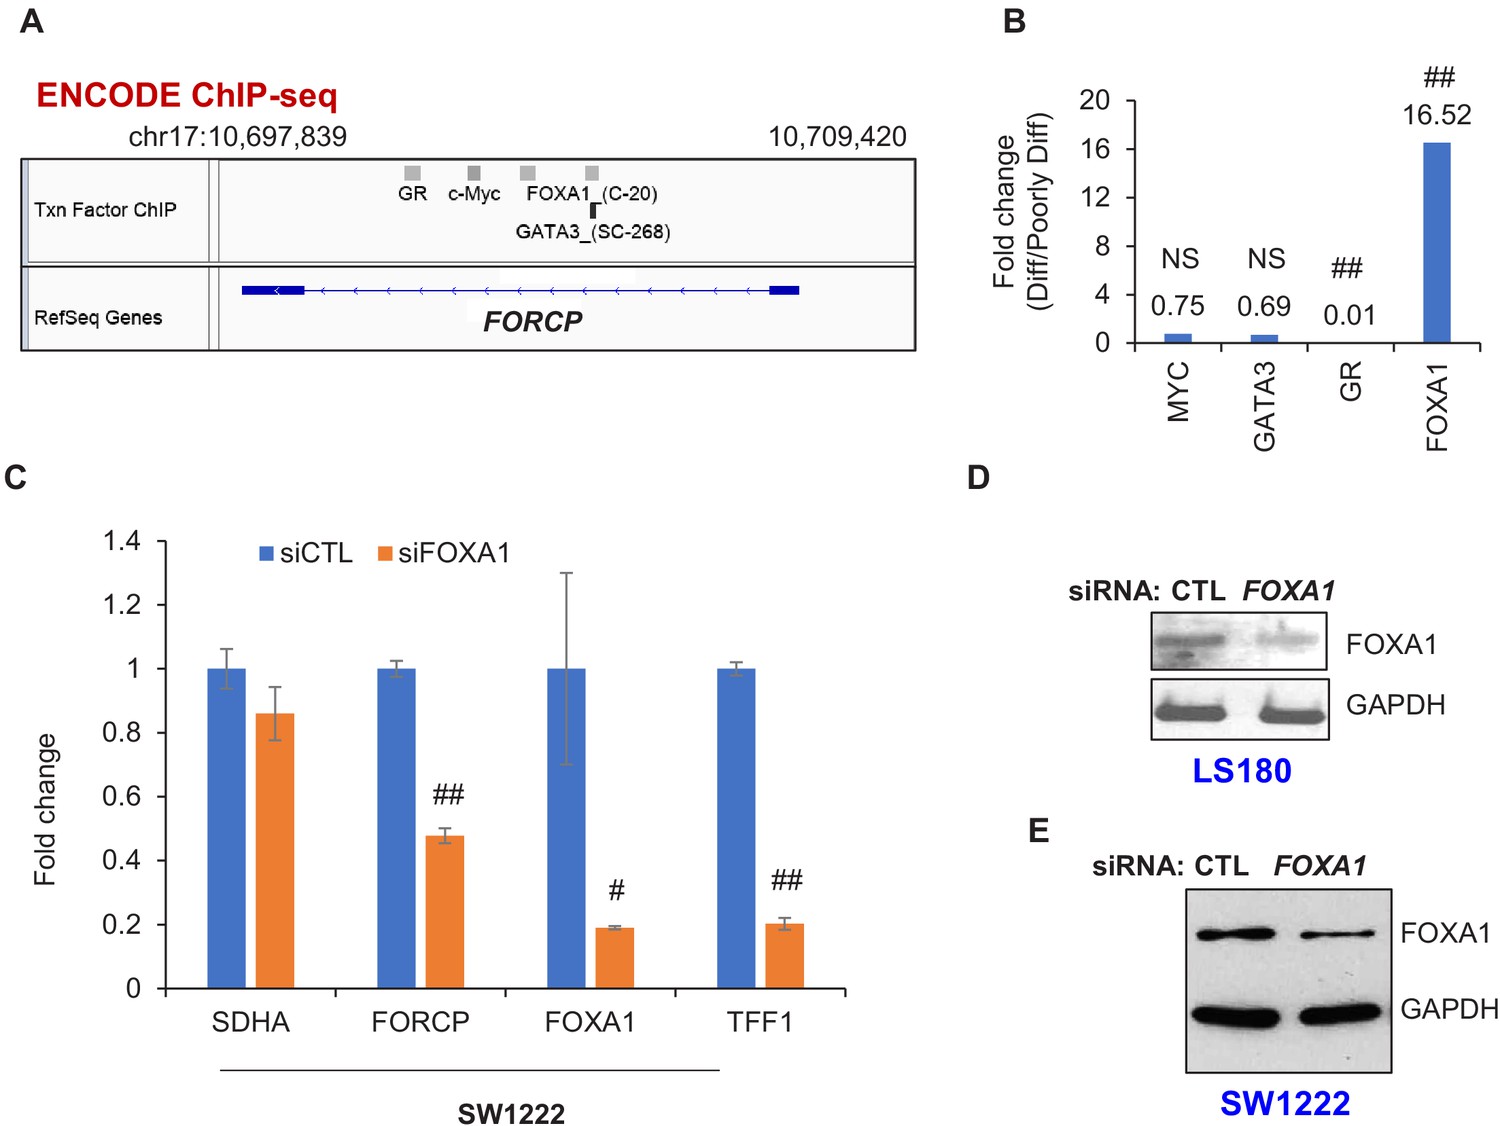
FOXA1 regulates FORCP expression.
(A) IGV snapshot of ENCODE ChIP-seq data depicting ChIP-seq peaks of FOXA1, GR, c-Myc, and GATA3 at the FORCP locus. (B) Relative abundance of FOXA1, GR, MYC, and GATA3 in well-differentiated (Diff) vs poorly differentiated (Poorly Diff) CRC lines was assessed by RNA-seq (also see Supplementary file 2). (C) qRT-PCR analysis normalized to GAPDH is shown from SW1222 cells transfected with CTL siRNA or FOXA1 siRNAs for 48 hr. (D, E) Immunoblotting from whole cell lysates was performed from LS180 (D) and SW1222 cells (E) transfected with CTL siRNA or FOXA1 siRNAs for 48 hr. GAPDH was used was loading control. Error bars in panel C represent SD from three experiments. #p<0.01, ##p<0.001.
-
Figure 1—figure supplement 3—source data 1
FOXA1 and GAPDH immunoblots for Figure 1—figure supplement 3D and E.
- https://cdn.elifesciences.org/articles/53734/elife-53734-fig1-figsupp3-data1-v2.docx
Figure 2 with 3 supplements

FORCP transcript is predominantly cytoplasmic and is translated to a naturally occurring 79 amino acid protein.
(A) Single-molecule RNA-FISH was performed for FORCP from SW1222, LS180 and HCT116 cells. DNA was counterstained with DAPI. (B) Maximum CSF (maxCSF) scores for FORCP, GAPDH (protein-coding) and NEAT1 (non-coding) transcripts were determined by PhyloCSF analysis. (C) Mass spectrometry from SW1222 tryptic digests identifies six out of eight fragment ions (y ions shown in green) from a N-terminal fragment of FORCP protein corresponding to the peptide sequence MLLGSLWGR. (D, E) Detection of overexpressed FORCP protein in 293 T cells and endogenous FORCP protein in SW1222 (NT) by immunoblotting using an anti-FORCP antibody. FORCP protein was not detected in 293 T cells transduced with the empty lentiviral expression vector (EV) or in SW1222 cells following FORCP knockdown with siRNAs. Histone H3 served as a loading control. (F) Detection of FORCP-FLAG in HCT116 cells transduced with empty vector (pLVX), pLVX-WT FORCP, or pLVX-Mutant FORCP by immunoblotting using anti-FLAG antibody. GAPDH served as loading control. (G) Cell viability assays were performed from HCT1116 cells transduced with empty vector (pLVX), pLVX-WT FORCP, or pLVX-Mutant FORCP. Error bars in panel H represent SD from three experiments. *p<0.05, **p<0.05, ##p<0.001.
-
Figure 2—source data 1
FORCP and histone H3 immunoblots for Figure 2D.
- https://cdn.elifesciences.org/articles/53734/elife-53734-fig2-data1-v2.docx
-
Figure 2—source data 2
FORCP and histone H3 immunoblots for Figure 2E.
- https://cdn.elifesciences.org/articles/53734/elife-53734-fig2-data2-v2.docx
-
Figure 2—source data 3
FORCP-FLAG and GAPDH immunoblots for Figure 2F.
- https://cdn.elifesciences.org/articles/53734/elife-53734-fig2-data3-v2.docx
Figure 2—figure supplement 1
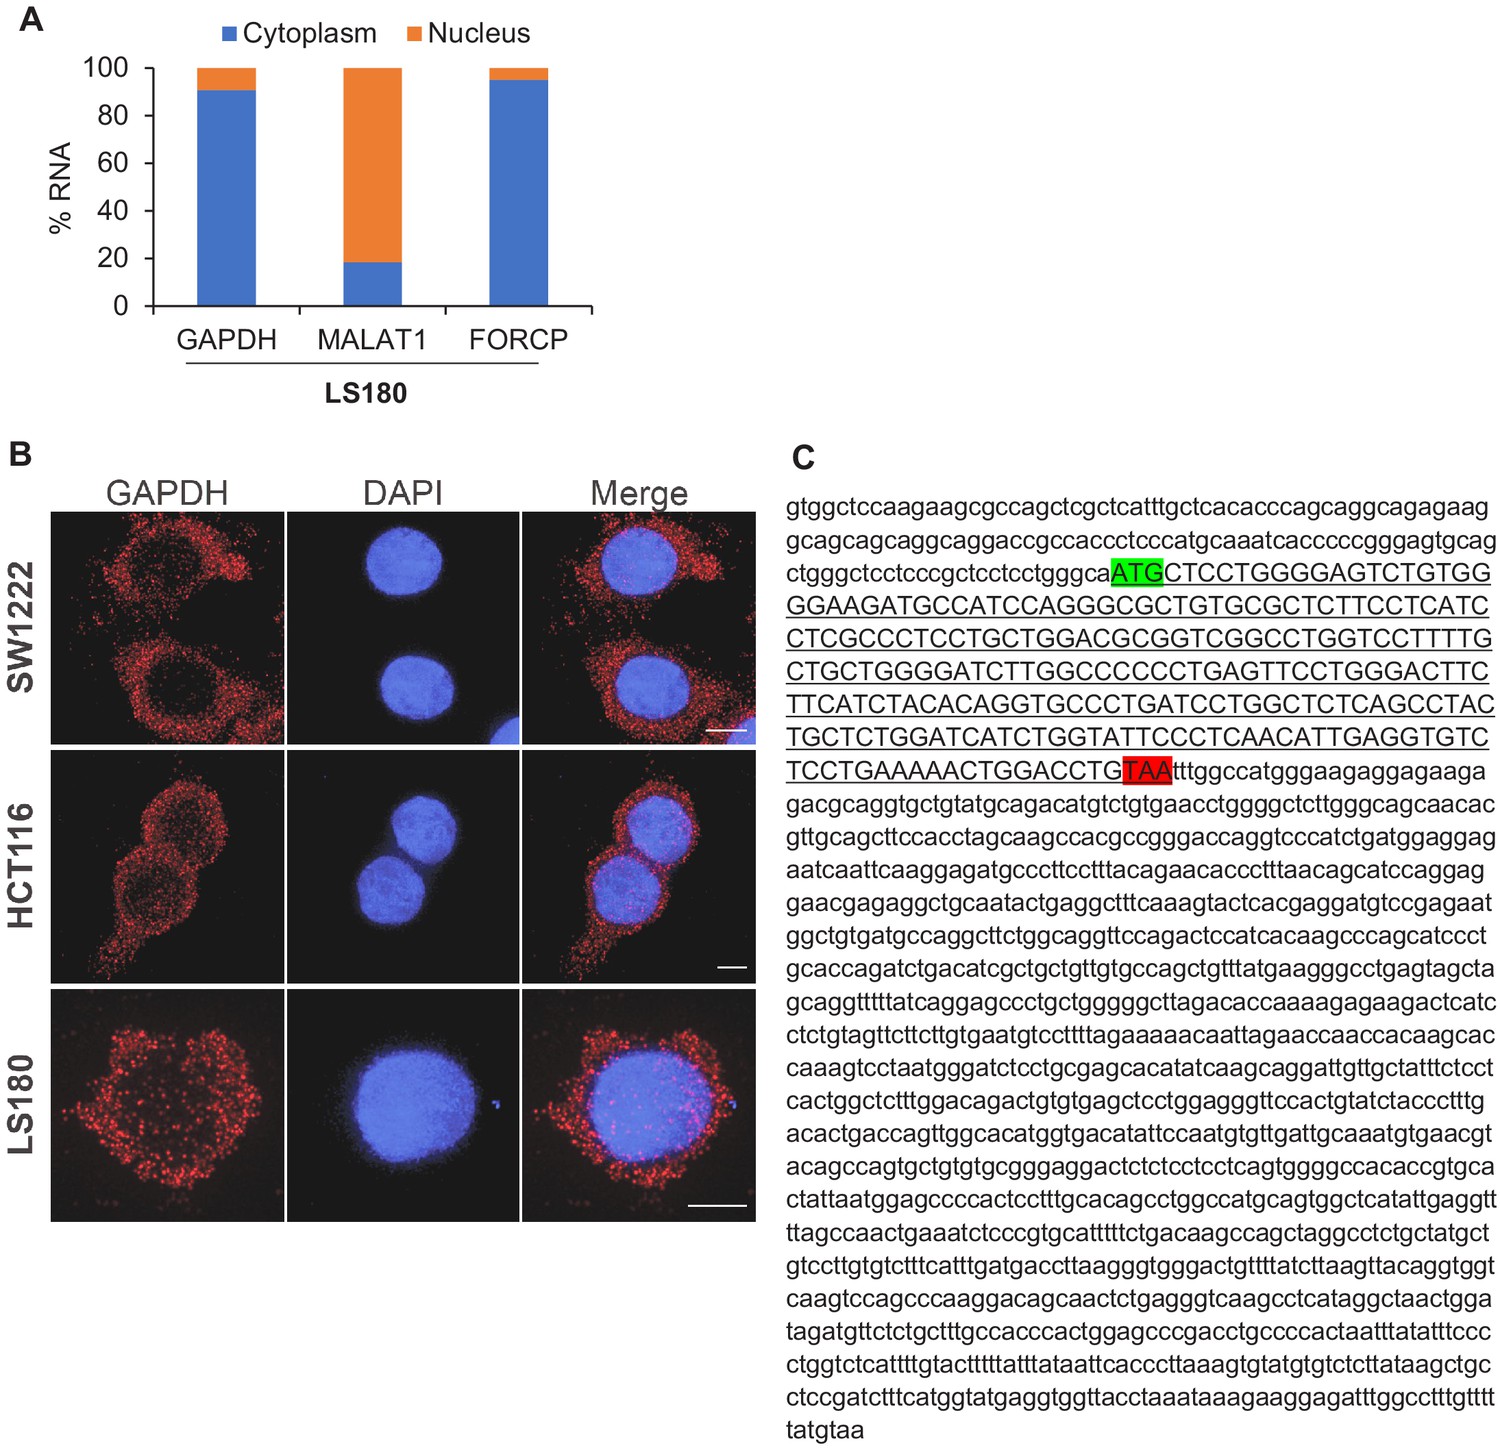
FORCP RNA is predominantly cytoplasmic and harbors a short ORF.
(A) qRT-PCR analysis was performed for FORCP, GAPDH (positive control for cytoplasmic RNA), and MALAT1 (positive control for nuclear RNA) from nuclear or cytoplasmic fractions of LS180 cells. (B) Single-molecule RNA-FISH was performed for GAPDH from SW1222, LS180, and HCT116 cells. DNA was counterstained with DAPI. (C) Sequence of human FORCP transcript and the 240 nt ORF (underlined sequence in upper case) with the start codon (green) and stop codon (red) is shown.
Figure 2—figure supplement 2
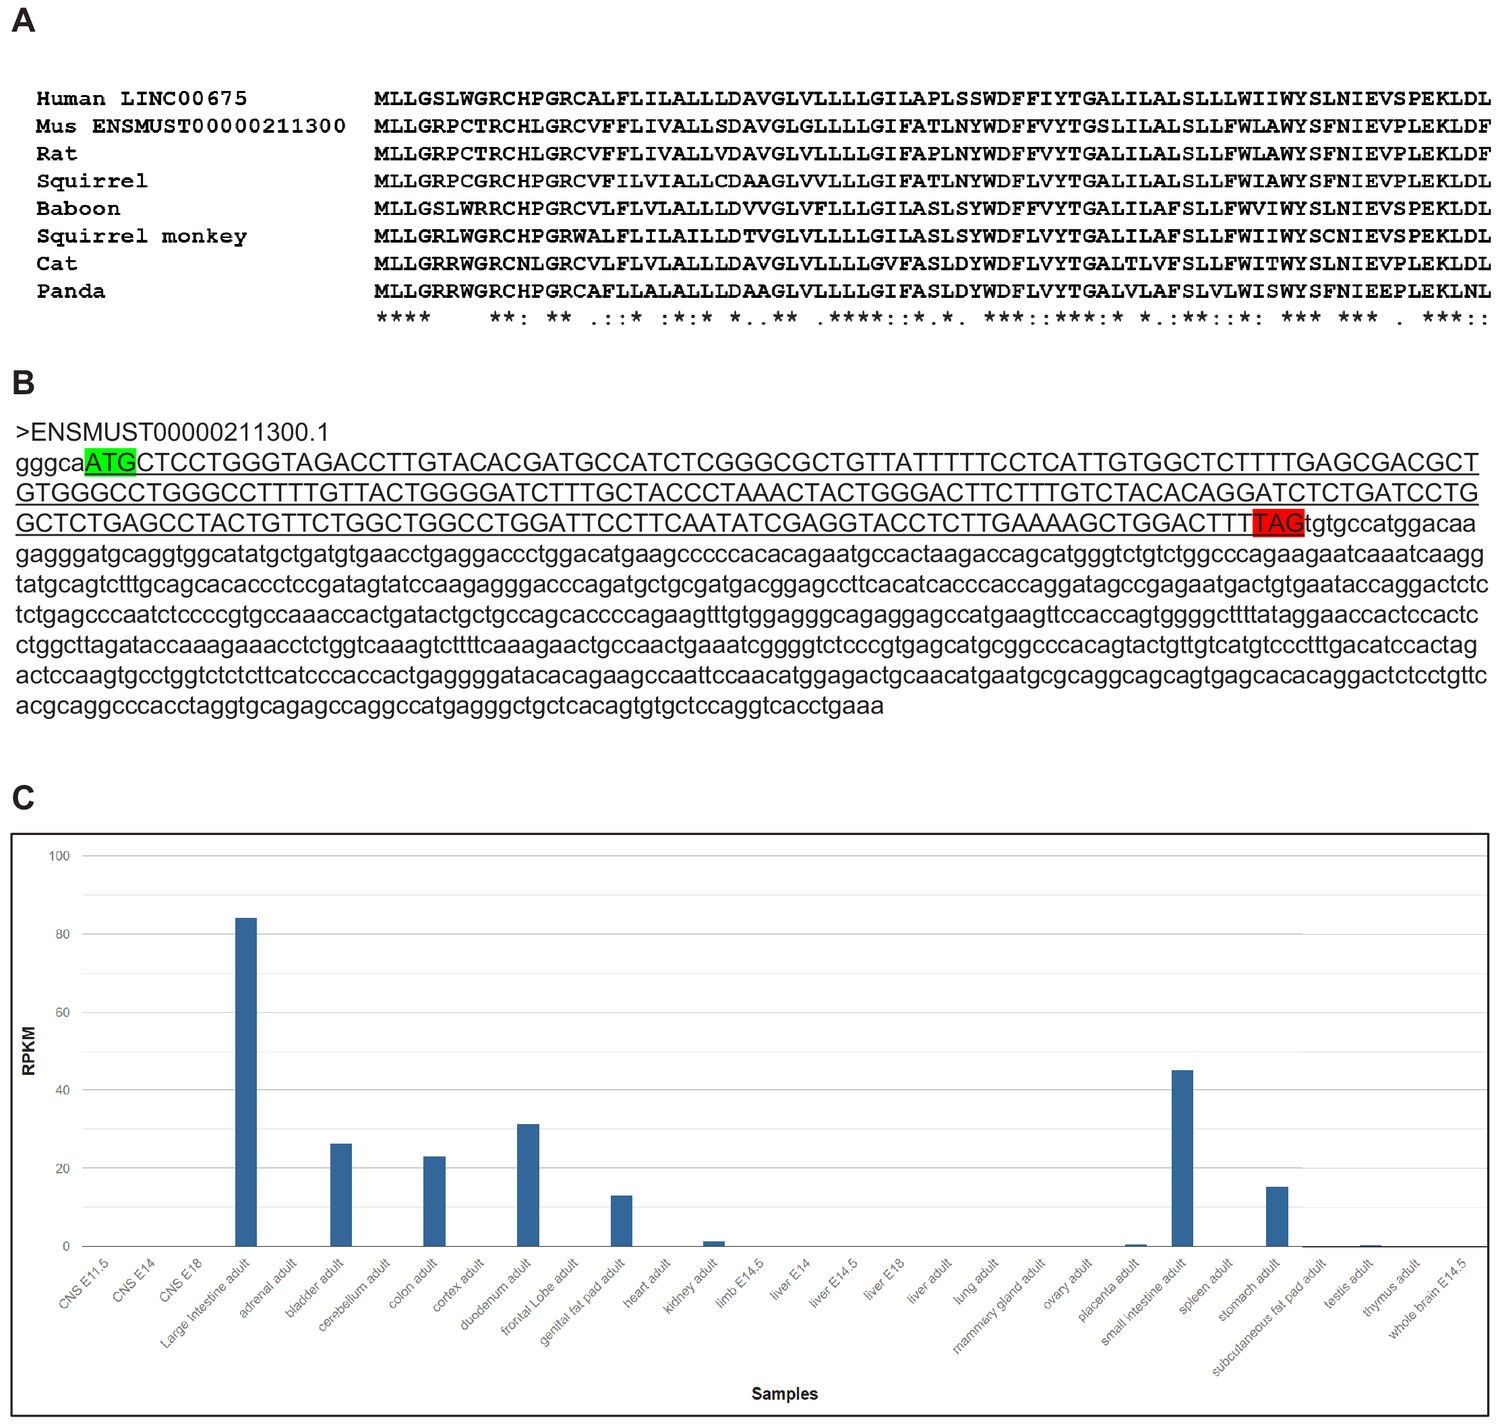
Mammalian conservation of FORCP.
(A) Sequence of the 79 amino acid FORCP protein and its conservation in mammals is shown. (B) Sequence of the mouse homolog of FORCP transcript and the 240 nt ORF (underlined sequence in upper case) with the start codon (green) and stop codon (red) is shown. (C) In mouse ENCODE transcriptome data obtained from https://www.ncbi.nlm.nih.gov/gene/71576#gene-expression, the mouse homolog of FORCP (also known as Tmem238l or 9130409J20Rik) shows biased expression in large intestine adult (RPKM 84.1), small intestine adult (RPKM 45.2) and five other tissues.
Figure 2—figure supplement 3
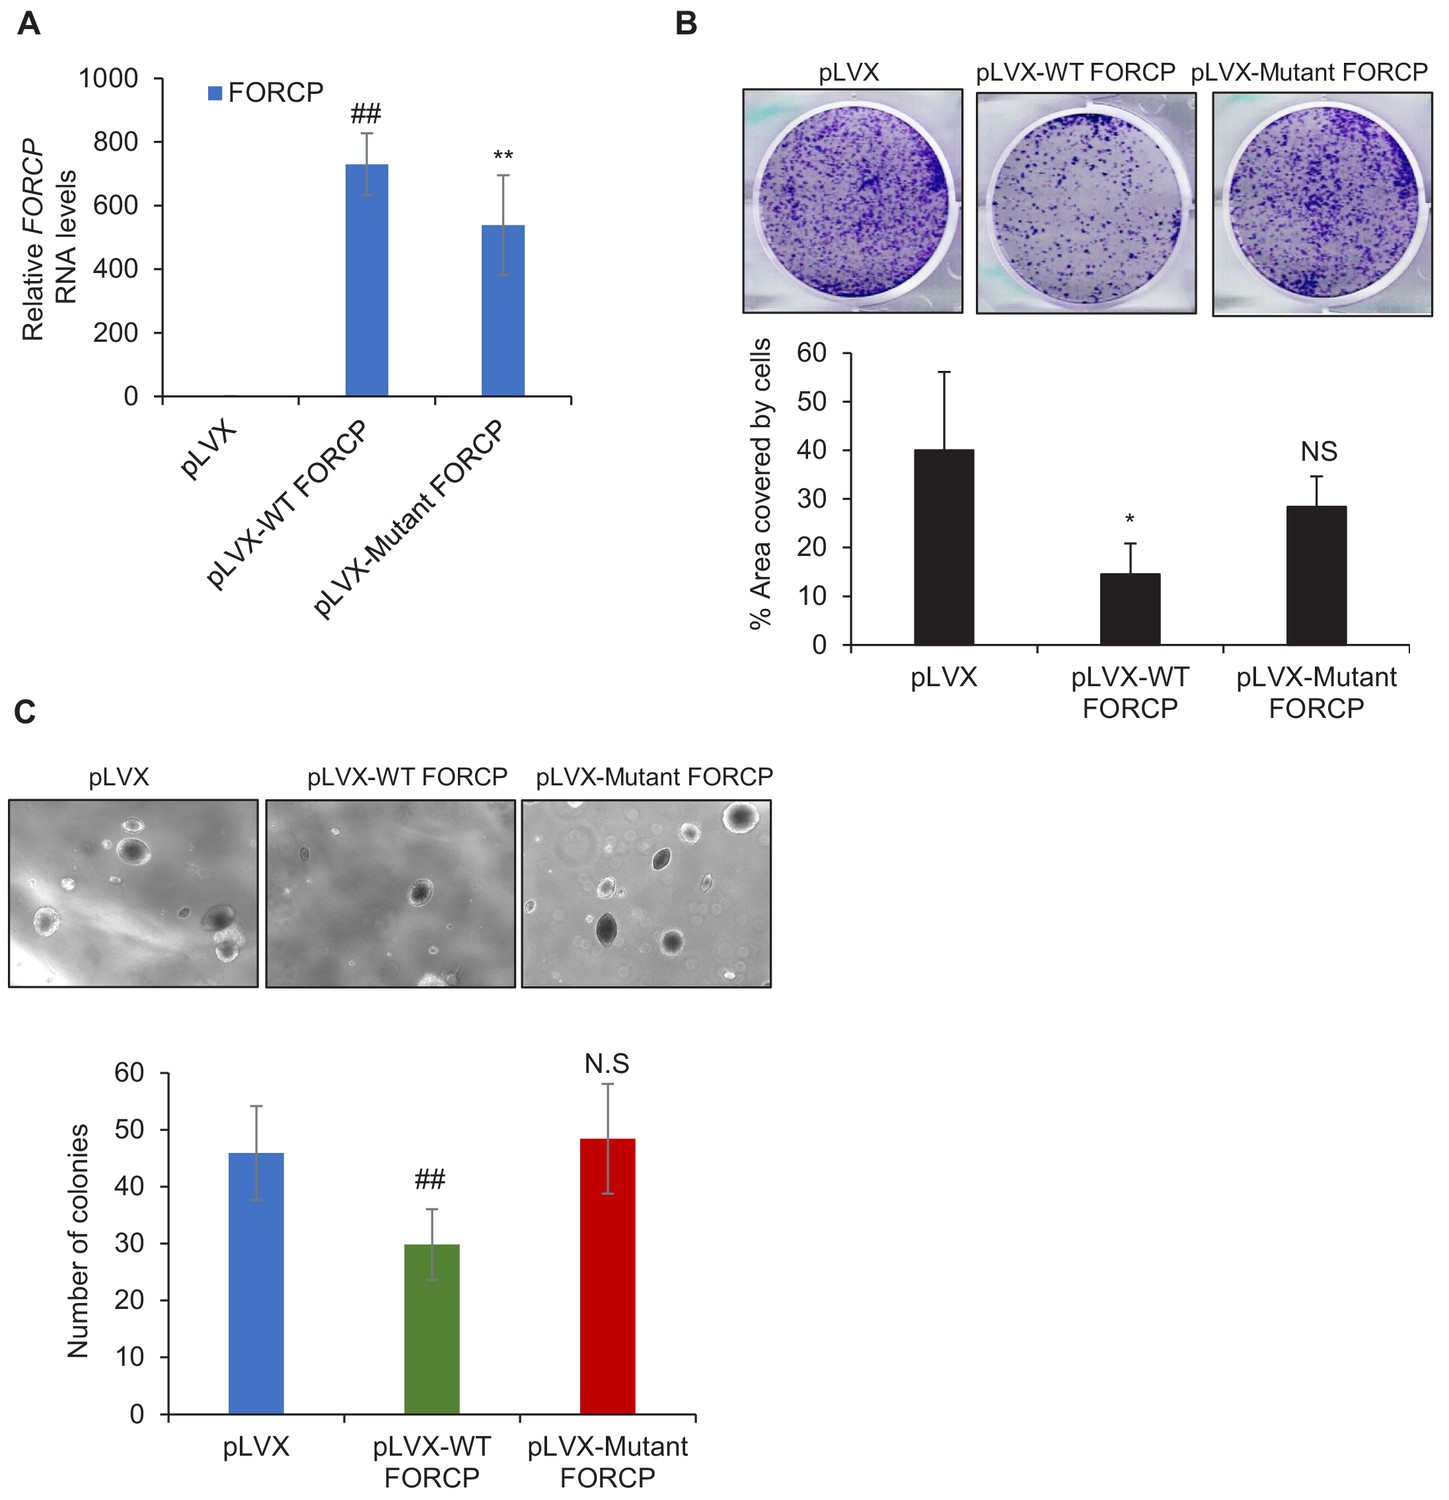
Overexpression experiments suggest that FORCP may not be a bifunctional gene.
(A) qRT-PCR analysis shows FORCP RNA overexpression upon stable transduction of HCT116 cells with WT- or Mutant-FORCP. pLVX is the empty vector. (B, C) Colony formation assays on plastic (B) and soft agar colony formation assays (C) were performed following overexpression of WT FORCP or Mutant FORCP in HCT116 cells. Error bars represent SD from three experiments. *p<0.05, **p<0.005, ##p<0.001.
Figure 3 with 2 supplements

FORCP protein is localized to the endoplasmic reticulum and its knockdown leads to growth advantage.
(A, B) Confocal microscopy was performed following transfection of 293 T cells with GFP wt, GFP with mutated ATG (GFP mut), or FORCP-GFP mut. Immunostaining for the ER marker PDI (B) shows colocalization of FORCP-GFP mut with PDI. DNA was counterstained with DAPI. (C) Confocal microscopy (left panel) following immunostaining of LS180 cells with anti-FORCP and anti-PDI antibodies shows colocalization of endogenous FORCP with the ER marker PDI. DNA was counterstained with DAPI. Colocalization of FORCP and PDI (right panel) was analyzed using ZEISS ZEN Desk microscope software from 100 individual cell images and converted to percentage co-localization. (D–H) The effect of FORCP knockdown in SW1222 cells on proliferation and tumorigenicity was assessed by Incucyte live cell proliferation assays (D), colony formation assays (E–G) and mouse xenograft experiments (H). Image from a representative colony formation on plastic experiment is shown in panel E and the data from three experiments is quantitated in panel F. For mouse xenograft experiments ‘N’ refers to the number of tumors 18 days after injecting the mice with SW1222 cells that were transfected for 48 hr with CTL or FORCP siRNAs. Error bars in panels D, F, and G represent SD from three experiments. *p< 0.05, **p< 0.005.
Figure 3—figure supplement 1
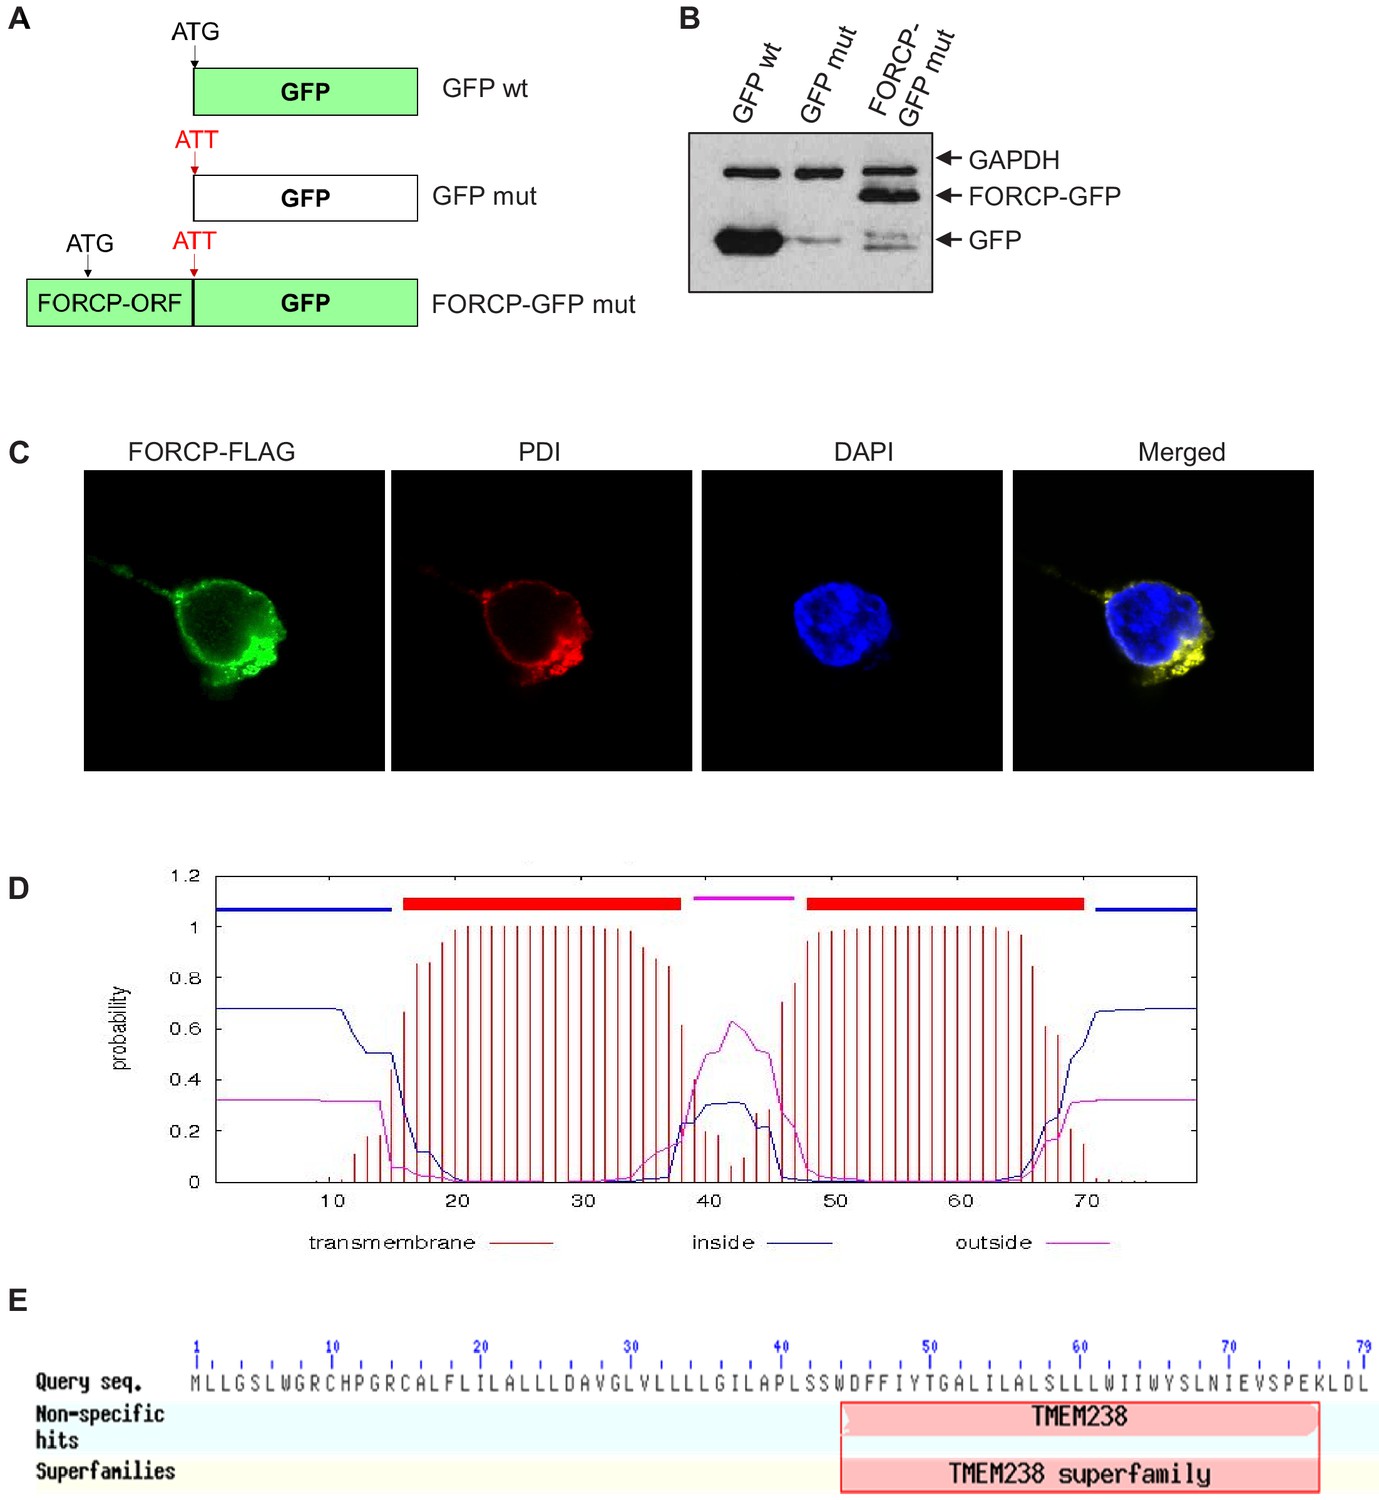
Tagged FORCP protein is localized to the ER.
(A) GFP constructs used for confocal microscopy experiments to examine subcellular localization of FORCP protein. (B) Immunoblotting was performed using anti-GFP antibody shows robust expression of the FORCP-GFP and GFP protein upon transient transfection of GFP wt, GFP mut, or FORCP-GFP mut in 293 T cells. GAPDH was used as loading control. (C) Confocal microscopy was performed following transfection of 293 T cells with FORCP-FLAG and immunostaining for the ER marker PDI, using anti-FLAG or anti-PDI, respectively. DNA was counterstained with DAPI. (D) Predicted transmembrane domains in FORCP protein are shown. (E) The C-terminus of FORCP shows homology to TMEM238 superfamily.
-
Figure 3—figure supplement 1—source data 1
GFP and GAPDH immunoblots for Figure 3—figure supplement 1B.
- https://cdn.elifesciences.org/articles/53734/elife-53734-fig3-figsupp1-data1-v2.docx
Figure 3—figure supplement 2
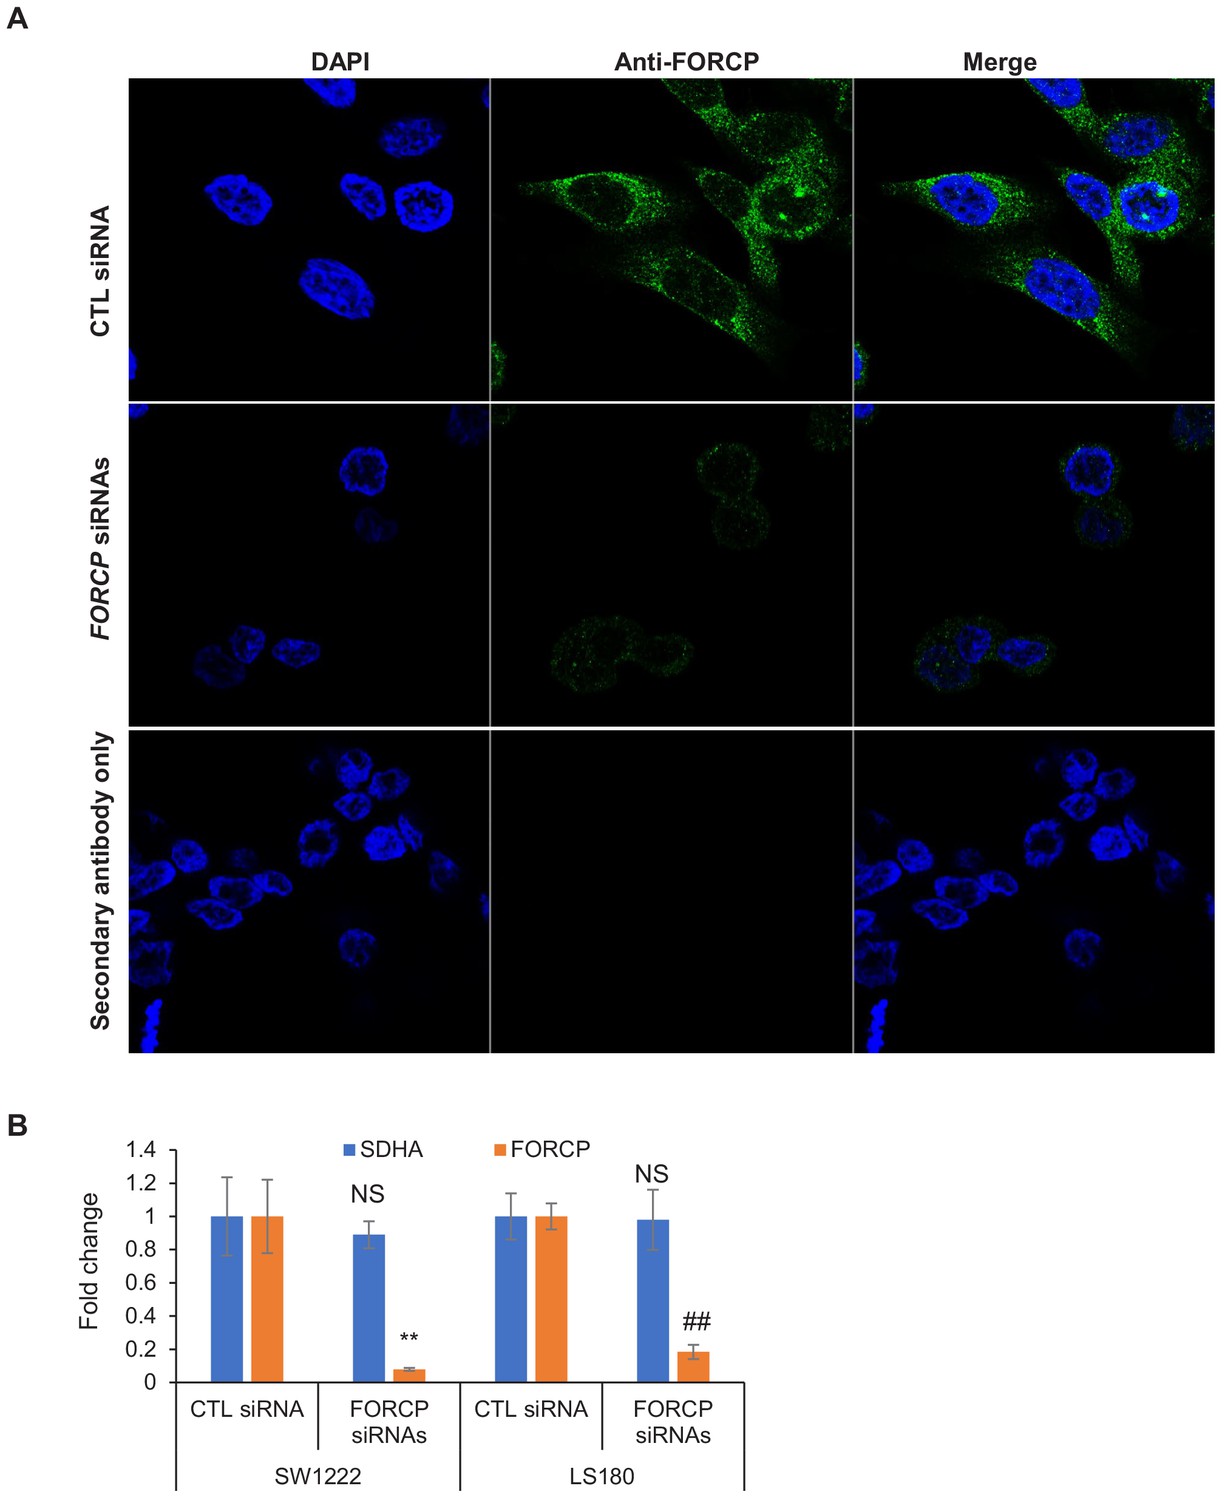
Immunostaining experiments show specificity of the FORCP antibody.
(A) Immunostaining was performed for endogenous FORCP using the anti-FORCP antibody 48 hr after transfection of LS180 cells with CTL siRNA or FORCP siRNAs. DNA was stained with DAPI. Secondary antibody alone was used as negative control. (B) FORCP knockdown using smartpool siRNAs was assessed by qRT-PCR 48 hr after transfection of SW1222 and LS180 cells with CTL siRNA or FORCP siRNAs. Housekeeping gene SDHA was used as negative control. Data was normalized to GAPDH. Error bars represent SD from three experiments. **p<0.005, ##p<0.001.
Figure 4 with 4 supplements

FORCP inhibits apoptosis in response to ER stress and interacts with BRI3BP.
(A) PI staining and FACS analysis was performed from LS180 cells transfected for 48 hr with CTL siRNA or FORCP siRNAs and then left untreated (Untr) or treated with DTT for 2 hr or allowed to recover for 6 hr after DTT treatment. The Sub-G1 population from three independent experiments is shown in panel A. Analysis was performed using FlowJo software. (B) LS180 cells were transfected for 48 hr with CTL siRNA or FORCP siRNAs and then left untreated or treated with DTT for 2 hr followed by immunoblotting from whole cell lysates for the apoptosis marker cleaved caspase-3. GAPDH was used as loading control. (C) Immunoblotting for the apoptosis marker cleaved caspase-3 was performed from whole cell lysates prepared from FORCP-WT cells and the FORCP-KO LS180 cells untreated (Untr) or treated with DTT for 2 hr. GAPDH was used as loading control. (D) PI staining and FACS analysis was performed from FORCP-WT and isogenic FORCP-KO cells untreated (Untr) or treated with DTT for 2 hr or Tunicamycin (TM) for 6 hr. (E) Colony formation assays were performed 10 days after seeding FORCP-WT cells and the FORCP-KO cells in six-well plates. (F) HCT116 cells were transduced with empty vector (pLVX) or pLVX-FORCP-FLAG expressing FORCP-FLAG. Immunoblotting for FORCP-FLAG and Histone H3 was performed from lysates (input), unbound material (unbound) and the material from two consecutive elutions (#1 and #2). (G) Table shows the list of seven proteins that were identified in four biological replicates of anti-FLAG pulldowns followed by mass spectrometry from HCT116 cells transduced with pLVX-FORCP-FLAG (FORCP-FLAG IP) or empty vector (Untagged control IP). The range for percentage coverage for each protein in the four experiments is shown. The CRAPOME column shows the number of experiments in which these proteins were pulled down in 411 experiments listed in CRAPOME. ‘ND’ refers to undetermined. (H) 293 T cells were transfected with empty vector or co-transfected with constructs expressing BRI3BP-FLAG-Myc and FORCP-FLAG for 48 hr. Immunoblotting was performed using anti-FLAG antibody from whole cell lysates (Input) or material eluted following IP using IgG or anti-Myc antibody. (I) PI staining and FACS analysis was performed from LS180 cells transfected for 48 hr with CTL siRNA or BRI3BP siRNAs and then left untreated (Untr) or treated with DTT for 2 hr. Medium containing drug was removed and the cells were allowed to recover for 6 hr in fresh medium. The Sub-G1 population from three independent experiments is shown in panel I. Analysis was performed using FlowJo software. Error bars represent SD from three experiments. #p<0.01, **p<0.05, ##p<0.001. Figure legends for figure supplements.
-
Figure 4—source data 1
Cleaved caspase-3 and GAPDH immunoblots for Figure 4B.
- https://cdn.elifesciences.org/articles/53734/elife-53734-fig4-data1-v2.docx
-
Figure 4—source data 2
Cleaved caspase-3 and GAPDH immunoblots for Figure 4C.
- https://cdn.elifesciences.org/articles/53734/elife-53734-fig4-data2-v2.docx
Figure 4—figure supplement 1
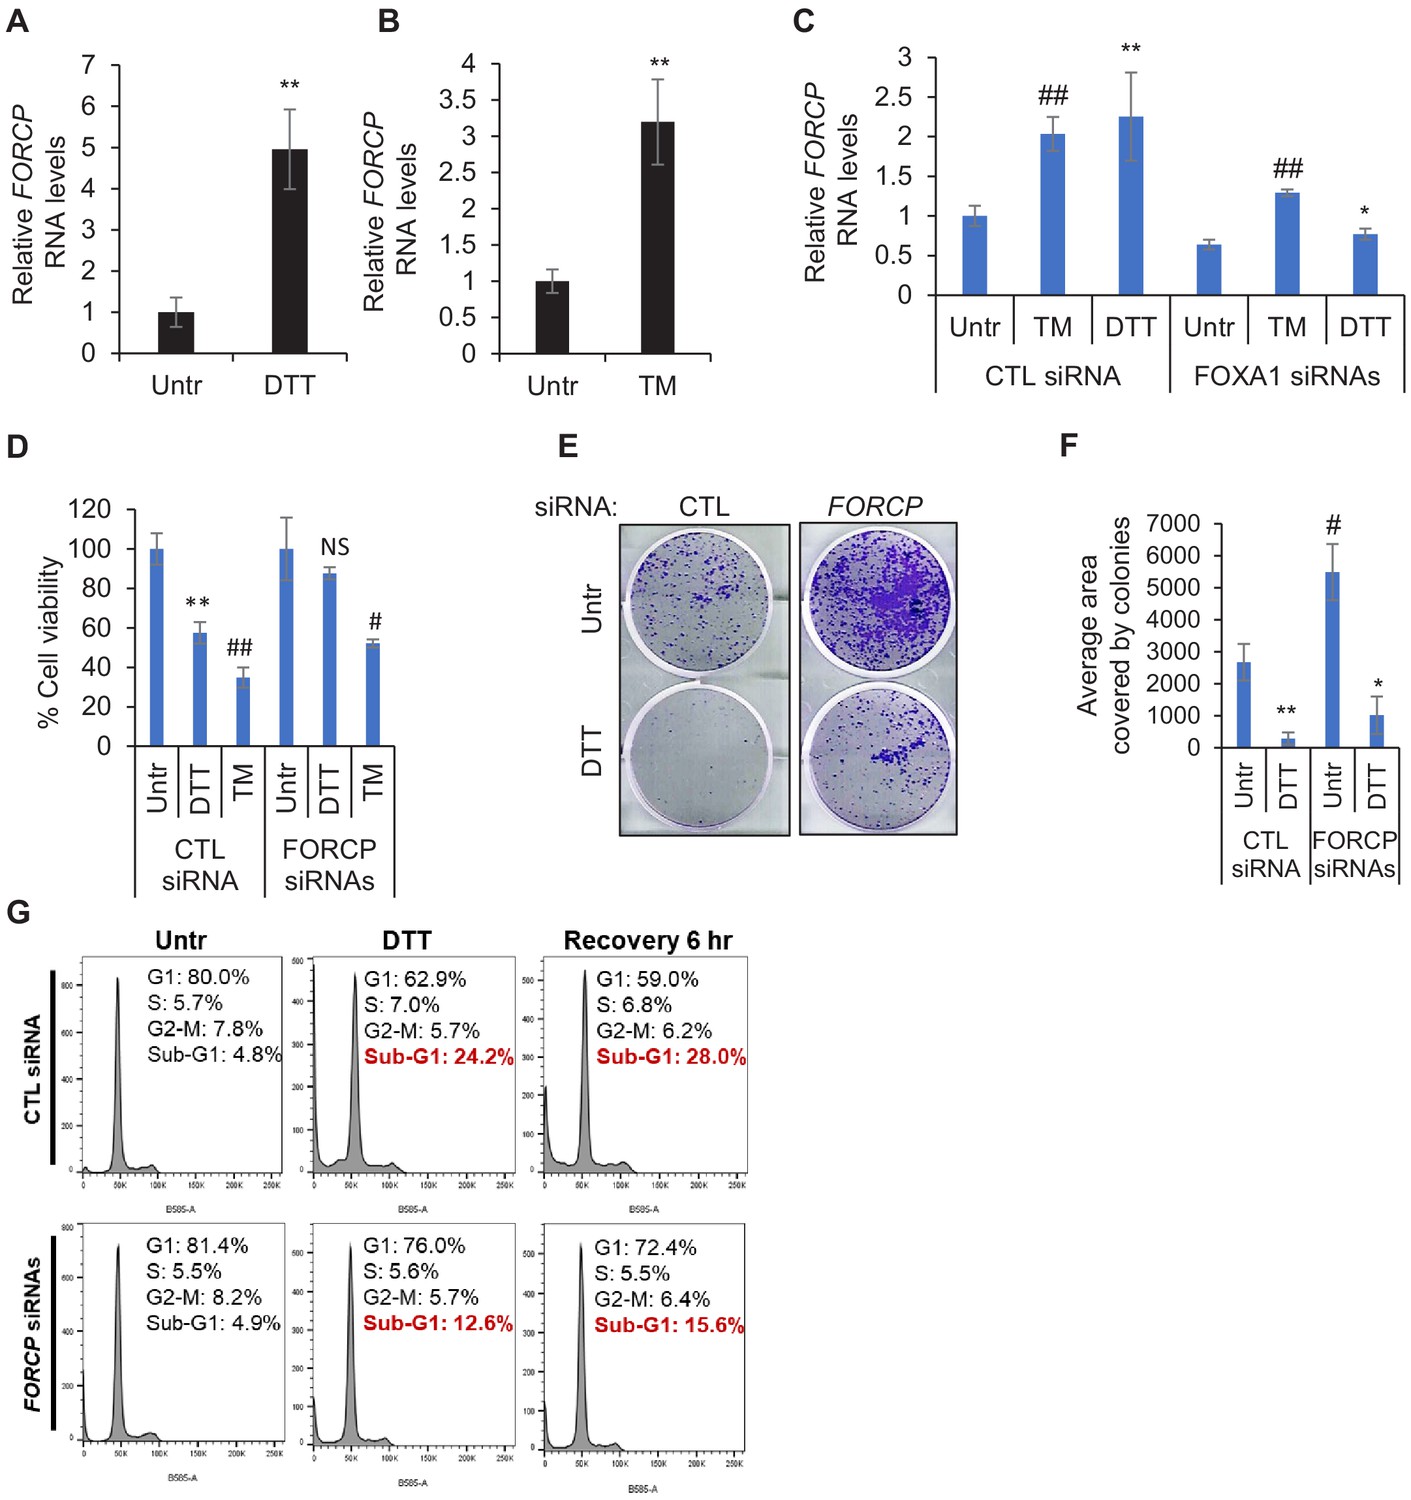
FORCP is upregulated upon ER stress to induce apoptosis.
(A, B) qRT-PCR was performed from LS180 cells after induction of ER stress using 0.5 mM DTT (A) or 4 µg/ml TM (B) to determine the effect of ER stress on FORCP RNA levels. Data were normalized with GAPDH. (C) The effect of FOXA1 knockdown on FORCP induction upon ER stress was determined by qRT-PCR after transfection of LS180 cells with CTL siRNA or FOXA1 siRNAs for 48 hr followed by treatment with DTT for 2 hr. (D) Cell viability assays were performed from LS180 cells transfected with CTL siRNA or FORCP siRNAs under untreated (Untr), DTT treated or Tunicamycin (TM)-treated conditions. Cell viability was measured using CCK-8 assay. p-Values were calculated by comparing DTT or TM-treated samples with untreated (Utr). (E, F) Colony formation on plastic assays were performed from LS180 cells following FORCP knockdown and treatment with ER-stress inducing agents (DTT or TM). Quantification of colonies was performed using ImageJ software. (G) PI staining and FACS analysis was performed from SW1222 cells transfected for 48 hr with CTL siRNA or FORCP siRNAs and then left untreated or treated with DTT for 2 hr or after 6 hr recovery from DTT treatment. Error bars represent SD from three experiments. *p<0.05, #p<0.01, **p<0.005, ##p<0.001.
Figure 4—figure supplement 2
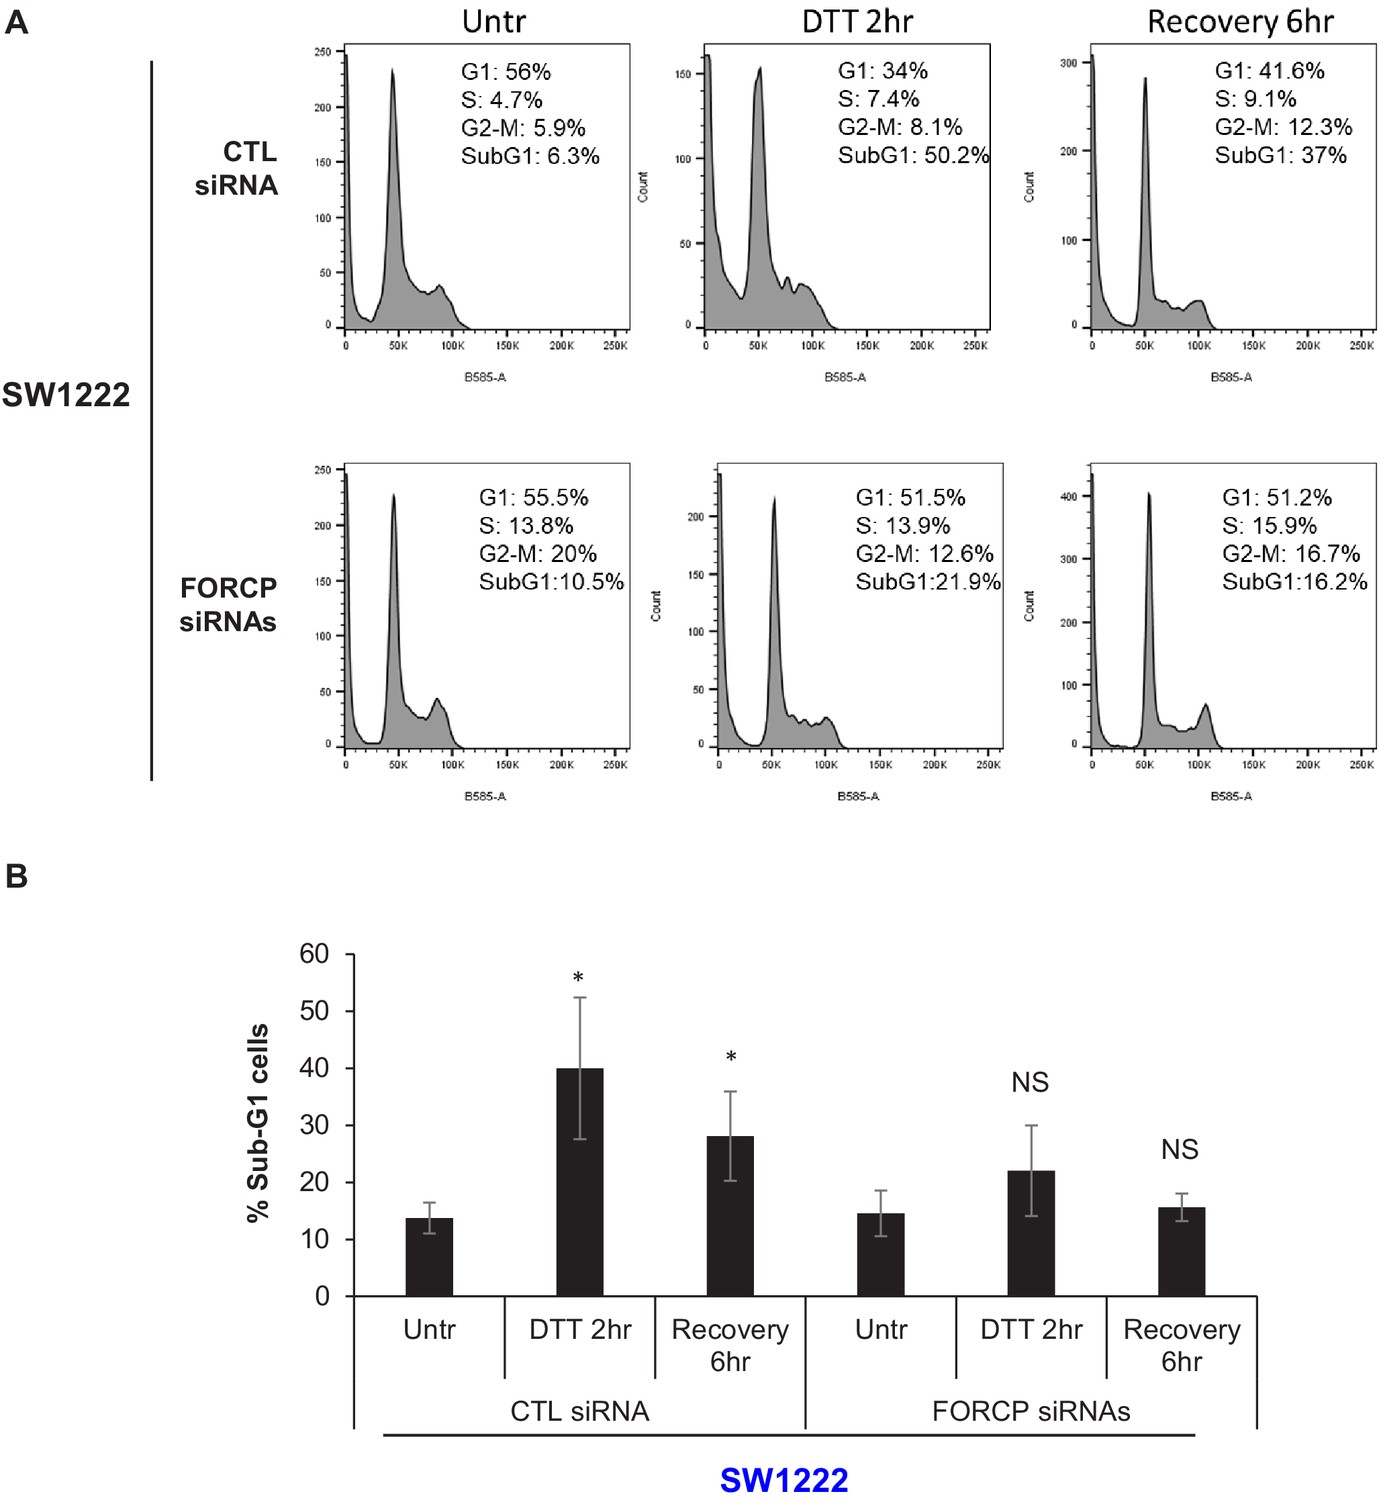
FORCP induces apoptosis upon ER stress in SW1222 cells.
(A–B) PI staining and FACS analysis was performed from SW1222 cells transfected for 48 hr with CTL siRNA or FORCP siRNAs and then left untreated or treated with DTT for 2 hr or after 6 hr recovery from DTT treatment (A). The Sub-G1 population from three independent experiments in panel A, is shown. *p<0.05. NS refers to not significant.
Figure 4—figure supplement 3
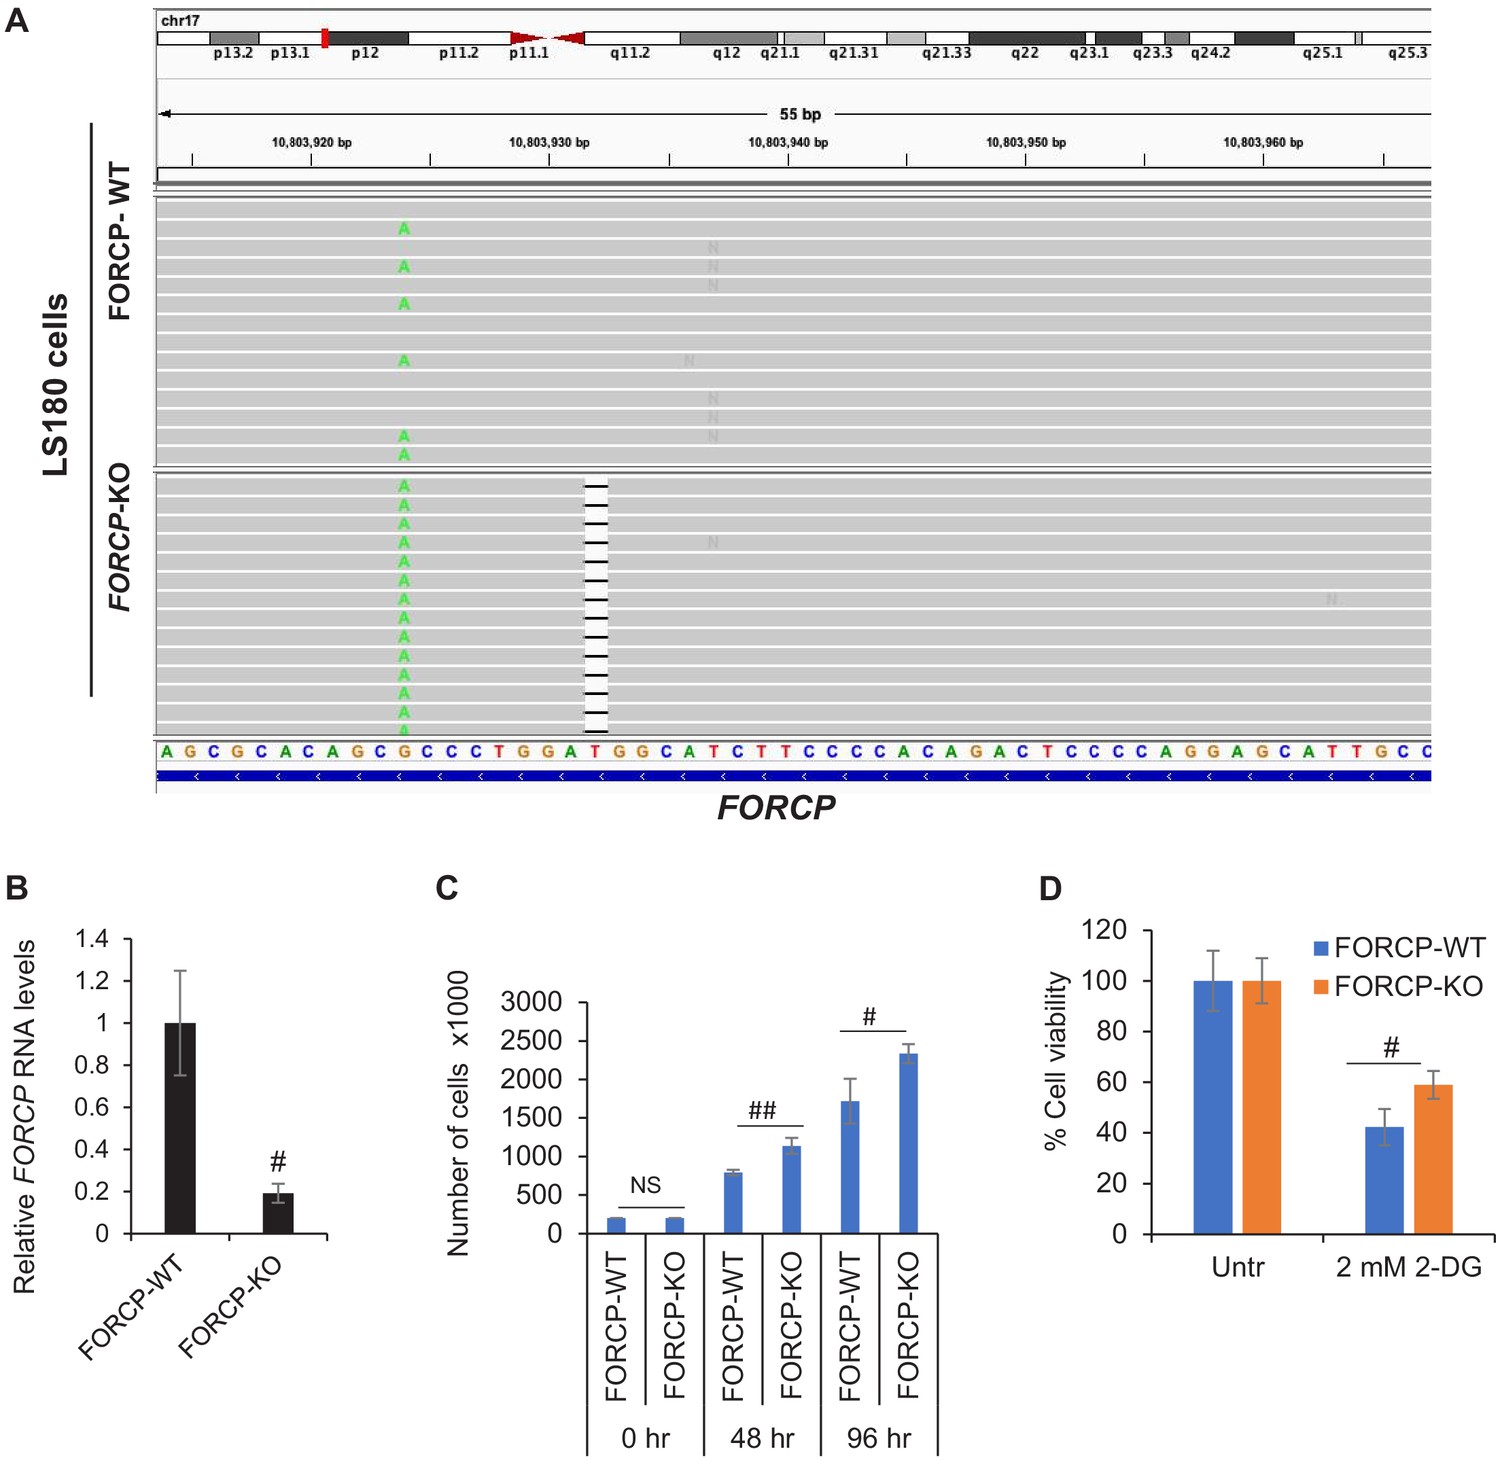
Targeted deletion of FORCP using CRISPR/Cas9.
(A) IGV visualization of targeted amplicon sequencing data from FORCP wild-type (WT) and isogenic FORCP-KO (knockout) LS180 cells. In the FORCP-KO cells, a 1 bp deletion is observed in one of the alleles within the sgRNA target site while it is likely that a large deletion was generated in the other allele which had removed the PCR primer binding sites. (B) qRT-qPCR was performed from FORCP-WT and FORCP-KO LS180 cells. GAPDH was to normalize the data. #p<0.005, ##p<0.001. (C) FORCP-WT cells and FORCP-KO cells were seeded in six-well plates and trypan blue exclusion cell count assays were performed at the time of seeding (0 hr) and after growing the cells for 48 and 96 hr, respectively. (D) Cell viability assays were performed from FORCP-WT and FORCP-KO LS180 cells that were left untreated or treated with 2-DG to inhibit glycolysis. Error bars represent SD from three experiments. #p<0.01, ##p<0.001.
Figure 4—figure supplement 4
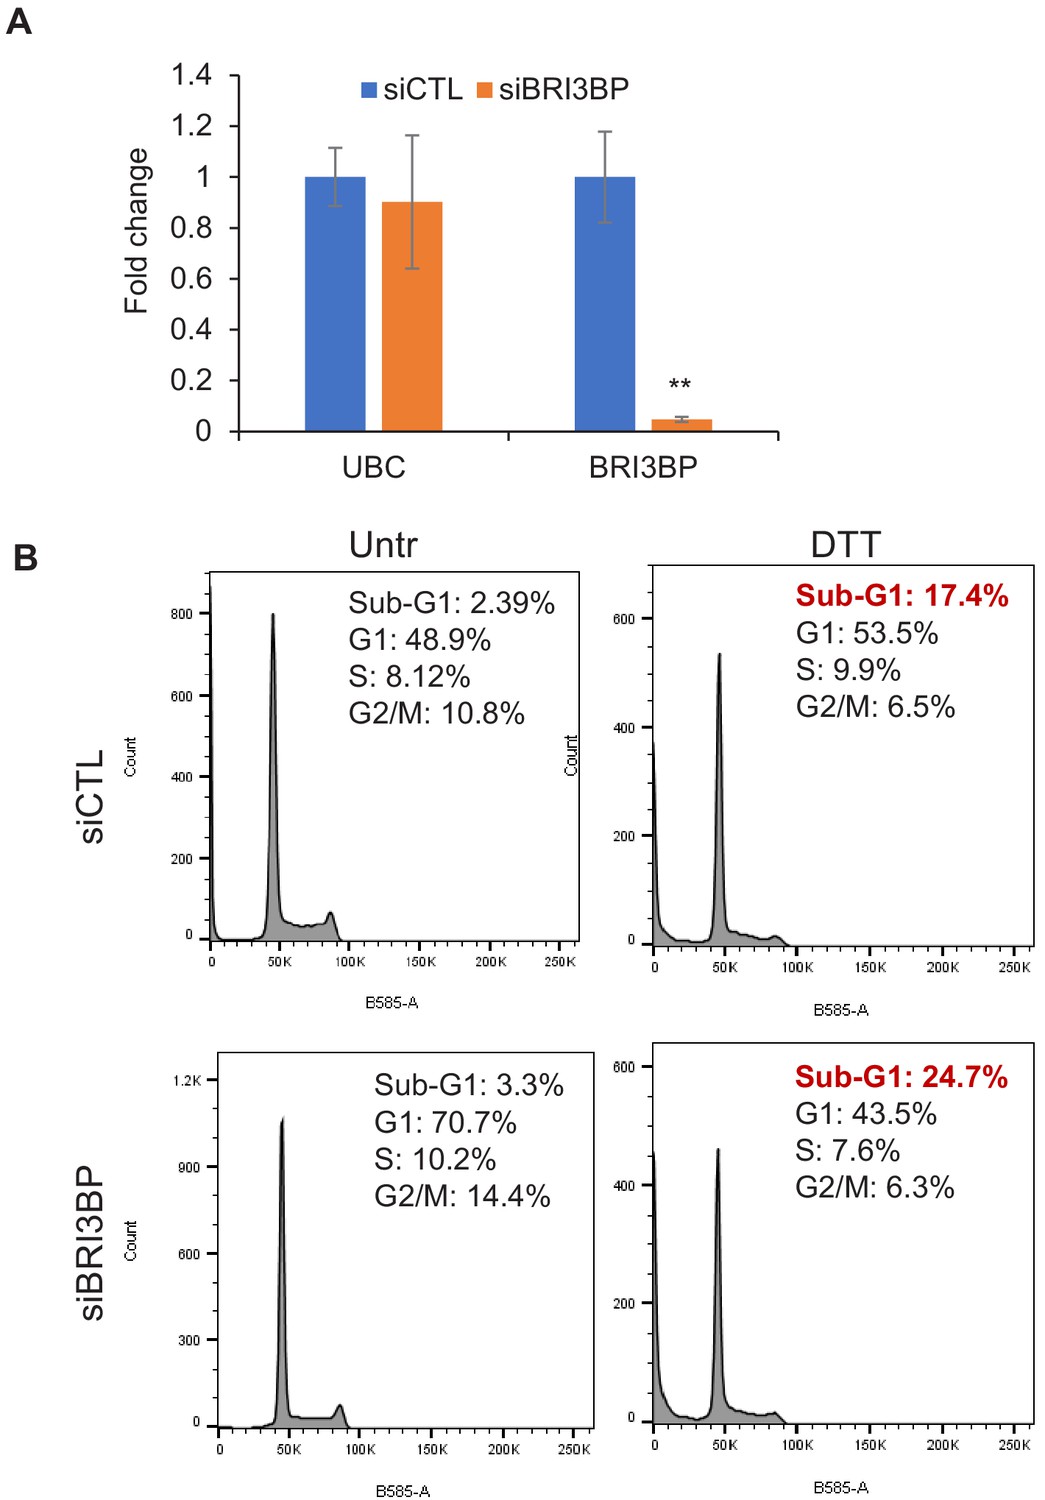
BRI3BP knockdown results in increased apoptosis upon ER stress.
(A) qRT-qPCR was performed from LS180 cells transfected for 48 hr with control siRNAs (siCTL) or BRI3BP siRNAs Smartpool (siBRI3BP). GAPDH was used to normalize the data and UBC was used as negative control. (B) PI staining and FACS analysis was performed from LS180 cells transfected for 48 hr with control siRNAs (siCTL) or BRI3BP siRNAs and then treated with DTT for 2 hr. Error bars represent SD from three experiments. **p<0.005.
Additional files
-
Supplementary file 1
FORCP, NORAD and MALAT1 expression from previously published RNA-seq data (Reinhold et al., 2019) from the NCI-60 panel of cell lines is shown.
- https://cdn.elifesciences.org/articles/53734/elife-53734-supp1-v2.xls
-
Supplementary file 2
RNA-seq was performed from 7 CRC lines.
Poorly differentiated CRC lines are shown in yellow. Well-differentiated CRC lines are shown in blue. Data for FORCP (LINC00675) is shown in green.
- https://cdn.elifesciences.org/articles/53734/elife-53734-supp2-v2.xlsx
-
Supplementary file 3
Sequences of primers, gRNAs and siRNAs used in this study.
- https://cdn.elifesciences.org/articles/53734/elife-53734-supp3-v2.xlsx
-
Supplementary file 4
List of proteins that were found to interact with FORCP-FLAG in IPs followed by mass spectrometry.
- https://cdn.elifesciences.org/articles/53734/elife-53734-supp4-v2.xlsx
-
Transparent reporting form
- https://cdn.elifesciences.org/articles/53734/elife-53734-transrepform-v2.docx
Download links
A two-part list of links to download the article, or parts of the article, in various formats.
Downloads (link to download the article as PDF)
Open citations (links to open the citations from this article in various online reference manager services)
Cite this article (links to download the citations from this article in formats compatible with various reference manager tools)
A small protein encoded by a putative lncRNA regulates apoptosis and tumorigenicity in human colorectal cancer cells
eLife 9:e53734.
https://doi.org/10.7554/eLife.53734


