Intermediate progenitors support migration of neural stem cells into dentate gyrus outer neurogenic niches
- Center for Integrative Brain Research, Seattle Children’s Research Institute, United States
- Department of Neurological Surgery, University of Washington, United States
- Institute of Experimental and Clinical Pharmacology and Toxicology, Germany
- Signaling Research Centers BIOSS and CIBSS, Faculty of Medicine, University of Freiburg, Germany
- Department of Pediatrics, University of Washington, United States
Figures
Figure 1 with 3 supplements
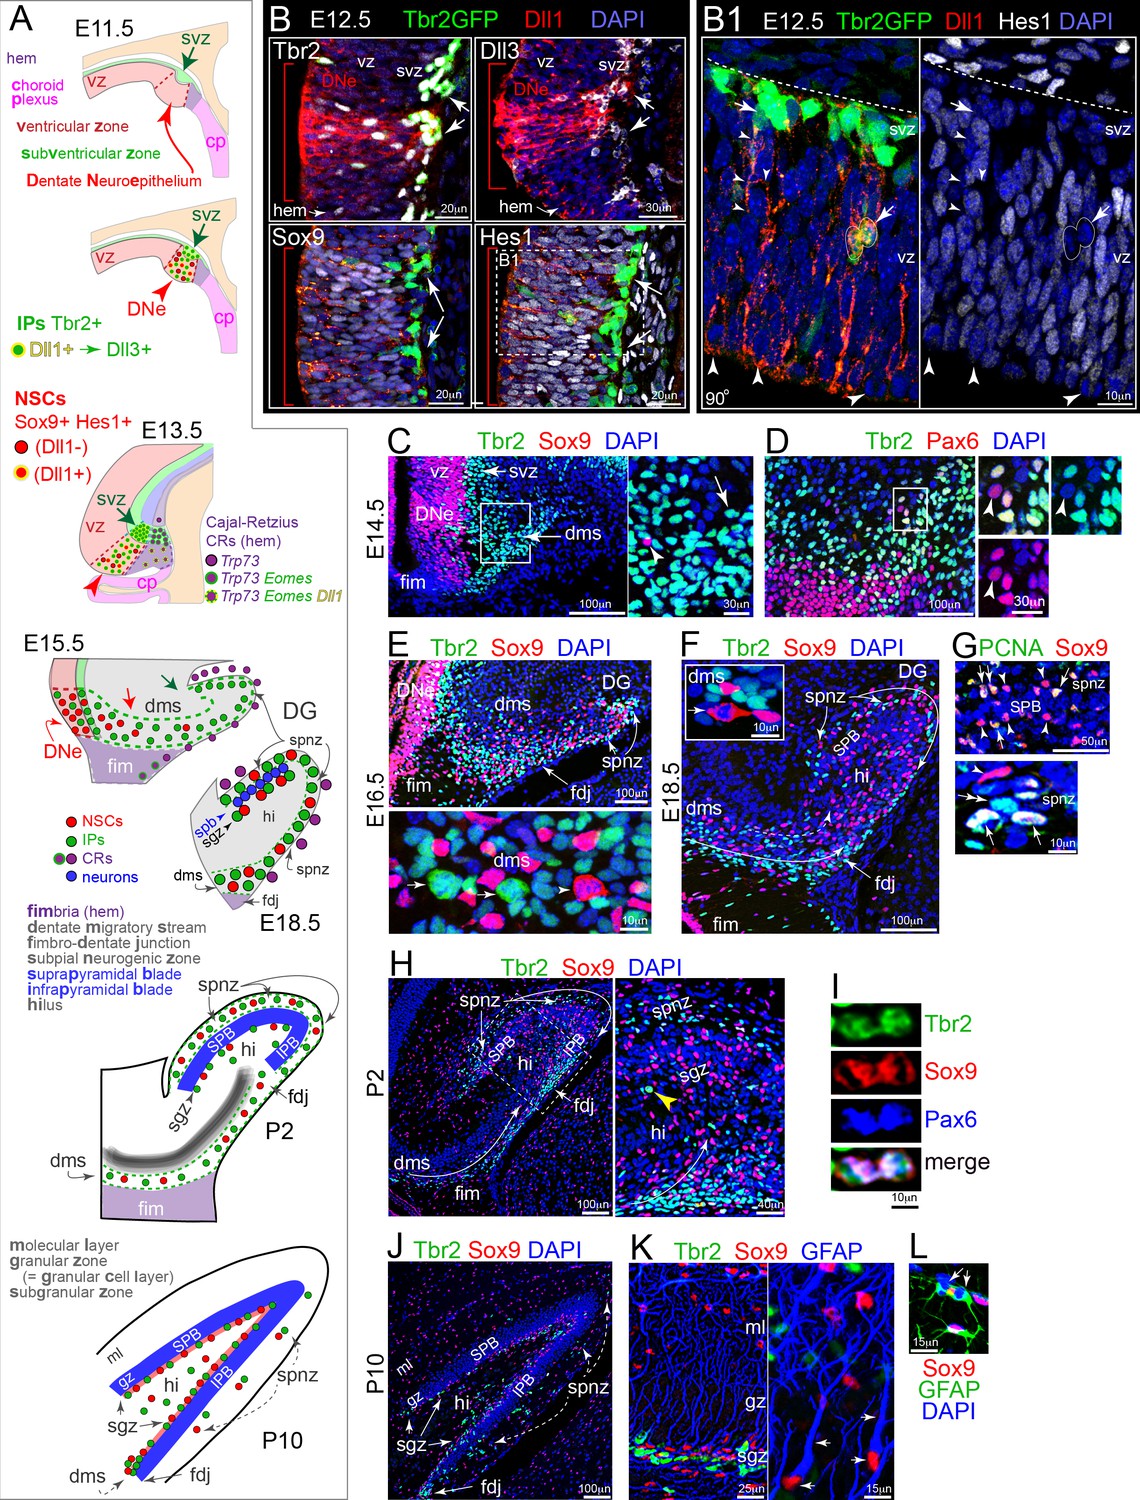
Development of DG: Notch activation and sequential IP-NSC migrations.
(A) Schematics of DG development and cell migrations (see also Figure 1—figure supplement 1). (B) E12.5 coronal sections immunolabeled for Dll1 and IP and NSC markers: the DNe is marked by intense Dll1+ immunoreactivity (red arrowheads and brackets) with increased IPs (top: Dll1+,Tbr2+, Dll3+, Tbr2GFP+ TG) and Notch active NSCs (bottom: Sox9+ Hes1+). (B1) Boxed region from Hes1 rotated 90o shows Dll1+/Hes1-/GFP+ IPs dividing in basal VZ and extending long-range branched processes from SVZ into VZ (arrows), and mitotic-Hes1low NSCs at the VZ surface encased by neighboring Dll1 puncta (arrowheads). (C) On E14.5, Tbr2+ IPs pioneered the DMS (inset arrow) in advance of Sox9+ NSCs (inset arrowhead). (D) Most cells in E14.5 DMS were IPs (Tbr2+); NSCs (Pax6+/Tbr2-) were sparse (inset arrowhead). (E) By E16.5, the DMS contained Sox9+ NSCs, as well as Tbr2+ IPs: the FDJ and SPNZ had developed and likewise contained both progenitor types. Bottom panel: mitotic Tbr2+ IPs (arrows) and Sox9+ NSC (arrowhead) in the DMS. (F) By E18.5, transient neurogenic niches (DMS→FDJ→SPNZ,Hi) were well defined and the SPB was visible. Note Sox9+ mitosis in DMS (inset). (G) The E18.5 SPB (top panel) was delimited by rows of NSCs (Sox9+) in the SPNZ and nascent SGZ. Some NSCs were proliferative (PCNA+), others quiescent (PCNA-). PCNA+/Sox9- proliferative IPs (bottom panel, double arrow) were also seen in E18.5 SPNZ. (H) On P2, Tbr2+ IPs and Sox+ NSCs were abundant in the DMS, SPNZ, Hi, and FDJ; and IPB formation was apparent. Boxed area shown at higher magnification in right panel. Note mitotic Tbr2+ IP in the nascent SGZ (yellow arrowhead). (I) Rare triple-labeled Tbr2+/Sox9+/Pax6+ mitotic figure in the FDJ, in transition from NSC to IP. (J) By P10, the SGZ contained abundant Tbr2+ IPs and Sox9+ NSCs (arrows). Transient niches (SPNZ, FDJ, Hi) were declining. Sox9+ astrocytes were scattered in the Hi and molecular layer (ML). (K) In P10 SGZ, Tbr2+ IPs clustered near Sox9+ NSCs with GFAP+ radial processes (arrows). (L) GFAP+/Sox9+ astrocytes, including mitotic forms (arrows), were also present (shown in ML).
Figure 1—figure supplement 1
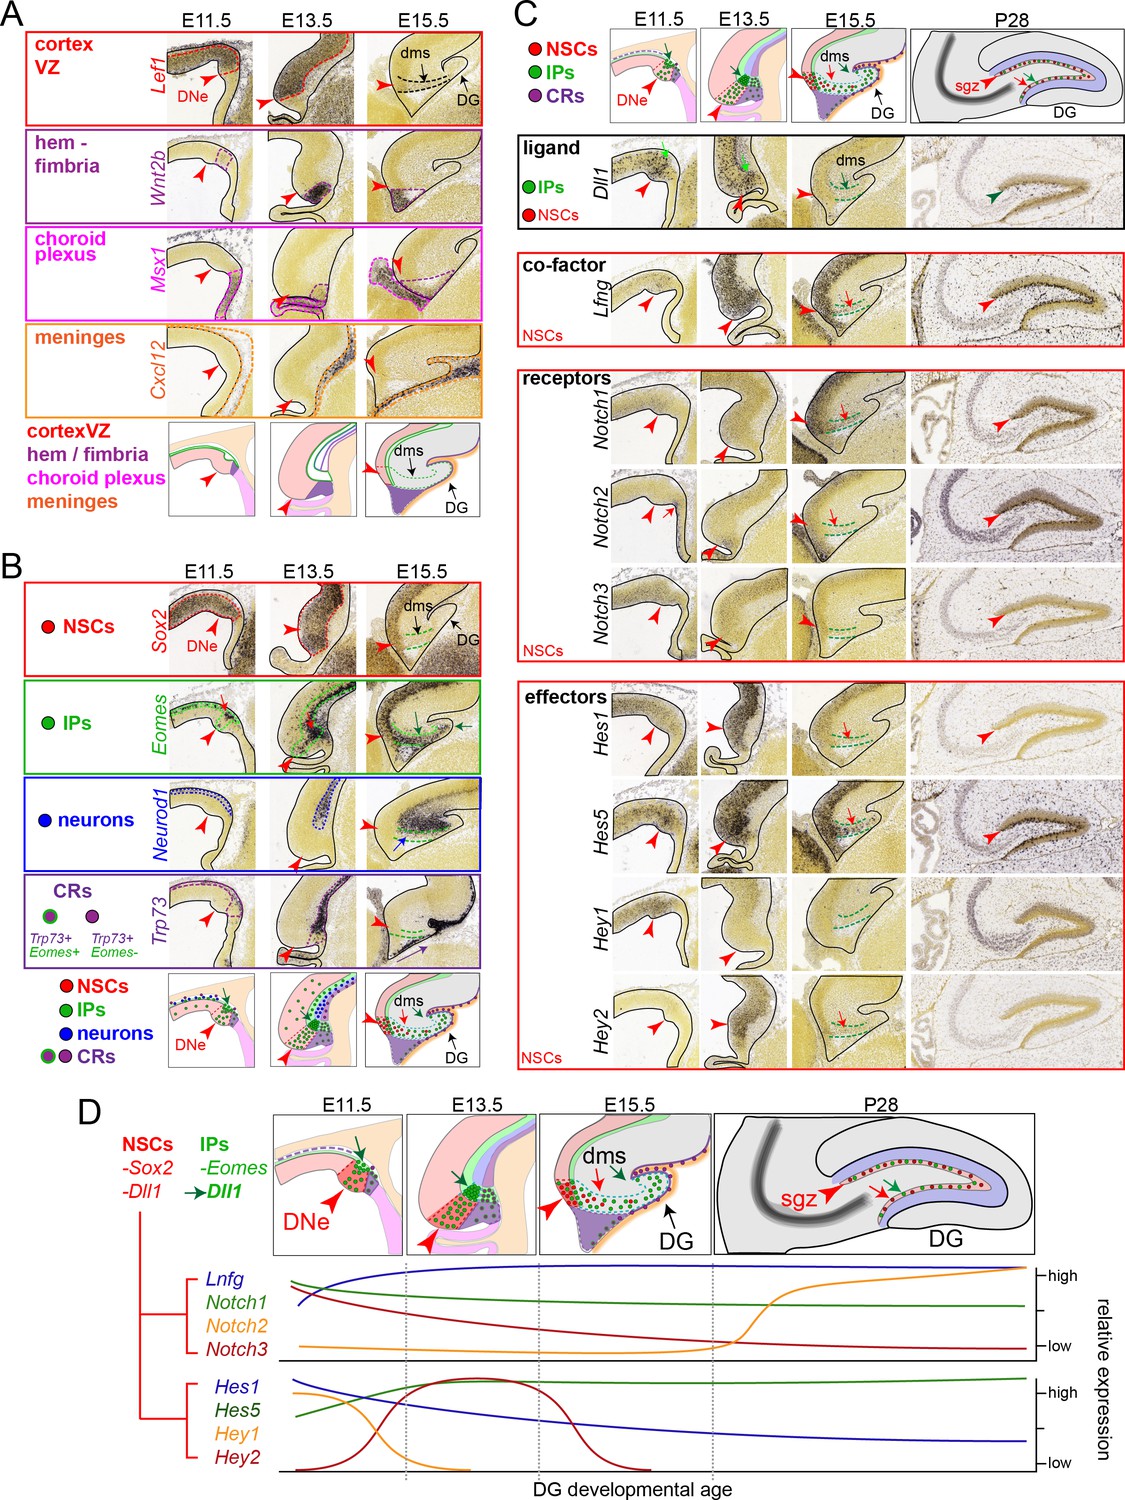
IPs, NSCs and Notch signaling during DNe formation, developmental migrations, and adult DG expression.
Analysis of public in situ hybridization (ISH) gene expression database (Allen Developing Mouse ISH Atlas, 2008 http://developingmouse.brain-map.org/) defines early regional boundaries, cell types, and relationship to Notch signaling changes during subsequent development and morphogenic steps of DG formation at E11.5, E13.5, E15.5 and P28 stages. (A) Regional boundaries during early DG formation: Lef1 marks cortical ventricular zone, Wnt2b marks hem/fimbria, Msx1 marks choroid plexus, Cxcl12 marks meningeal mesenchyme: red arrow marks the dentate neuroepithelial (DNe) stem zone. (B) Cell-type specific markers: Sox2 marks NSCs, Eomes marks IPs, Neurod1 marks CA field neurons, Trp73 marks Cajal-Retzius cells (CRs). Increased Eomes+ IPs are already evident in the early E11.5 DNe, with numerous IPs arising from the ventricular surface and accumulating in outer basal regions, demarking the nascent SVZ, compared to other cell type markers: note a few hem-derived CRs are evident with transient co-expression of Emoes and Trp73, which continues to mark differentiated CR cells that also eventually express Reln (not shown) and migrate subpially towards the hippocampal fissure underneath Cxcl12 expressing meninges distinct from DNe pioneering Emoes expressing IPs, as is evident from E11.5-E13.5-E15.5 images. (C) High combinatorial Notch expression defines early DG formation: At E11.5, Notch1/3, Hes1, Hey1 and especially Lfng and Hes5 are strongly expressed in the early DNe, whereas Notch2 marks the choroid plexus and hem region, and Hey2 is not evident. By E13.5, increased Hes5 expression continues to mark the DNe, whereas Hey1 is progressively downregulated as Hey2 is transiently upregulated. Similarly, while Notch1 expression remains constant, Notch3 expression in the VZ is gradually replaced by increased Notch2 expression through E15.5: note Notch expressing NSCs appear in the DMS after Eomes and Dll1 expressing IPs. By P28 adult stages, Notch1 and especially Notch2 mark NSCs in the SGZ, along with Lfng and Hes5. (D) Summary of relative spatial-temporal expression levels during DG formation. Early DG formation is defined by increased IP production and high combinatorial Notch signaling transitions in NSCs, which follow IP migrations through transient outer zones to establish the adult SGZ neurogenic niche.
Figure 1—figure supplement 2
The DNe is molecularly and spatially distinct from the early hem/fimbria.
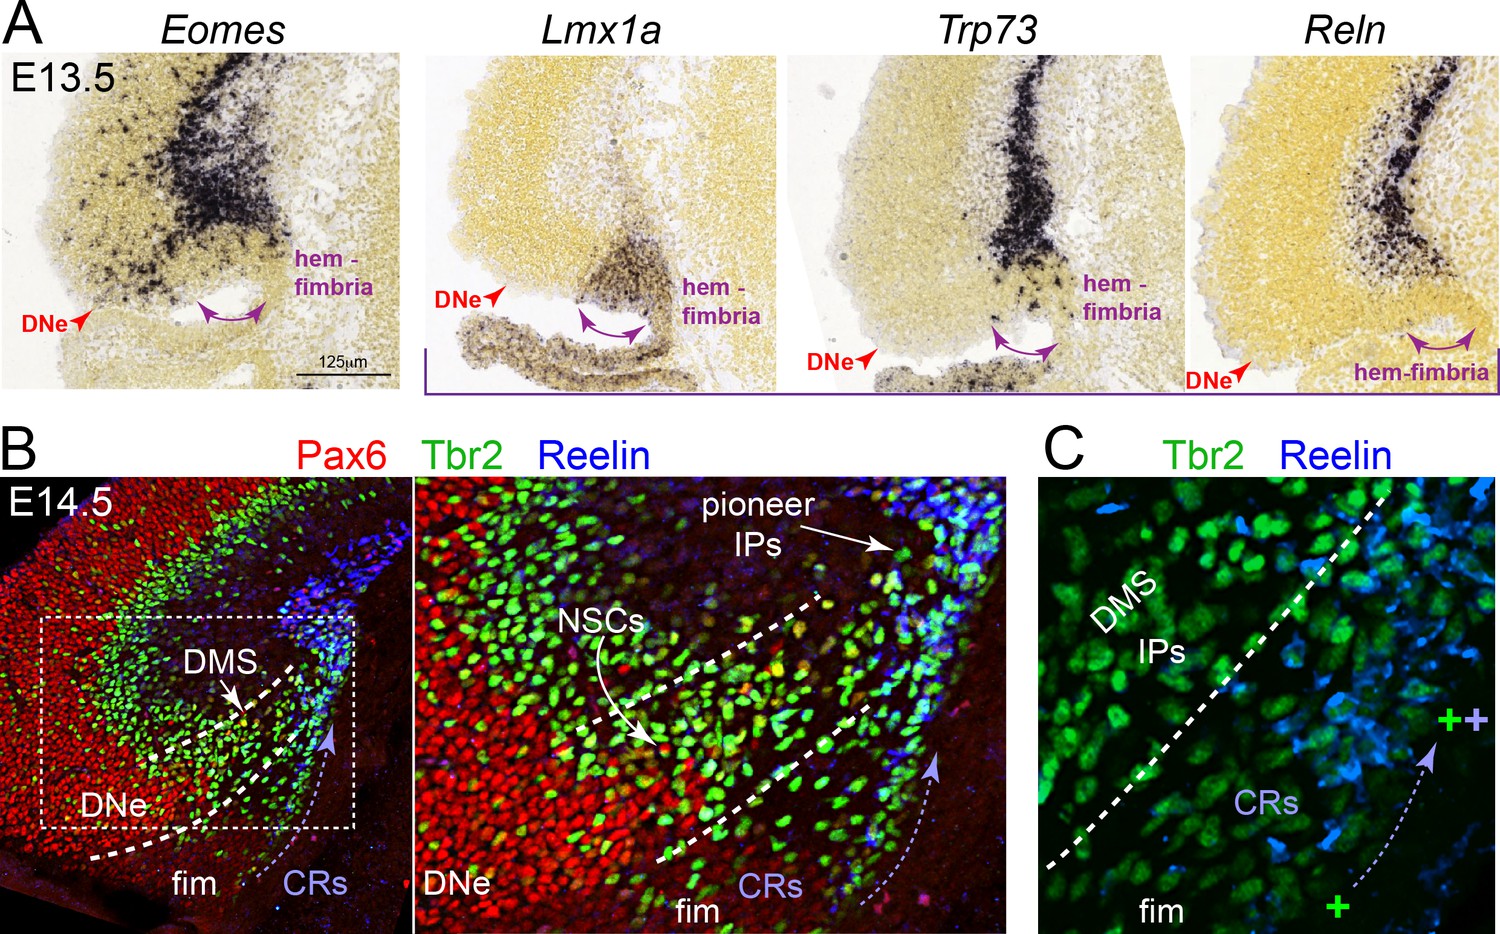
Analysis of public in situ hybridization (ISH) gene expression database (Allen Developing Mouse ISH Atlas, 2008 http://developingmouse.brain-map.org/)and validation by immunofluorescence defines the DNe versus the hem/fimbria. (A) High power in situ hybridization analyses at E13.5 reveals that the discrete Eomes+ IP stream in the DNe is distinct from the more medial Lmx1a+ fimbria/hem, which generates Trp73+ Reln+ Cajal-Retizius cells (CRs): note that CR’s also transiently express Eomes during their differentiation into mature Trp73+ Reln+ CRs. (B) By E14.5, triple immunolabeling with Pax6/Tbr2/Reelin clearly distinguishes subpial Tbr2+ IPs pioneering the DMS followed by NSCs, distinct from overlying Tbr2+ Reelin+ CRs emerging from the hem/fimbria; see also Anstötz and Maccaferri (2020); Hodge et al. (2013).
Figure 1—figure supplement 3
Progenitors are distributed throughout transient outer niches by mid-to-late embryonic stages.
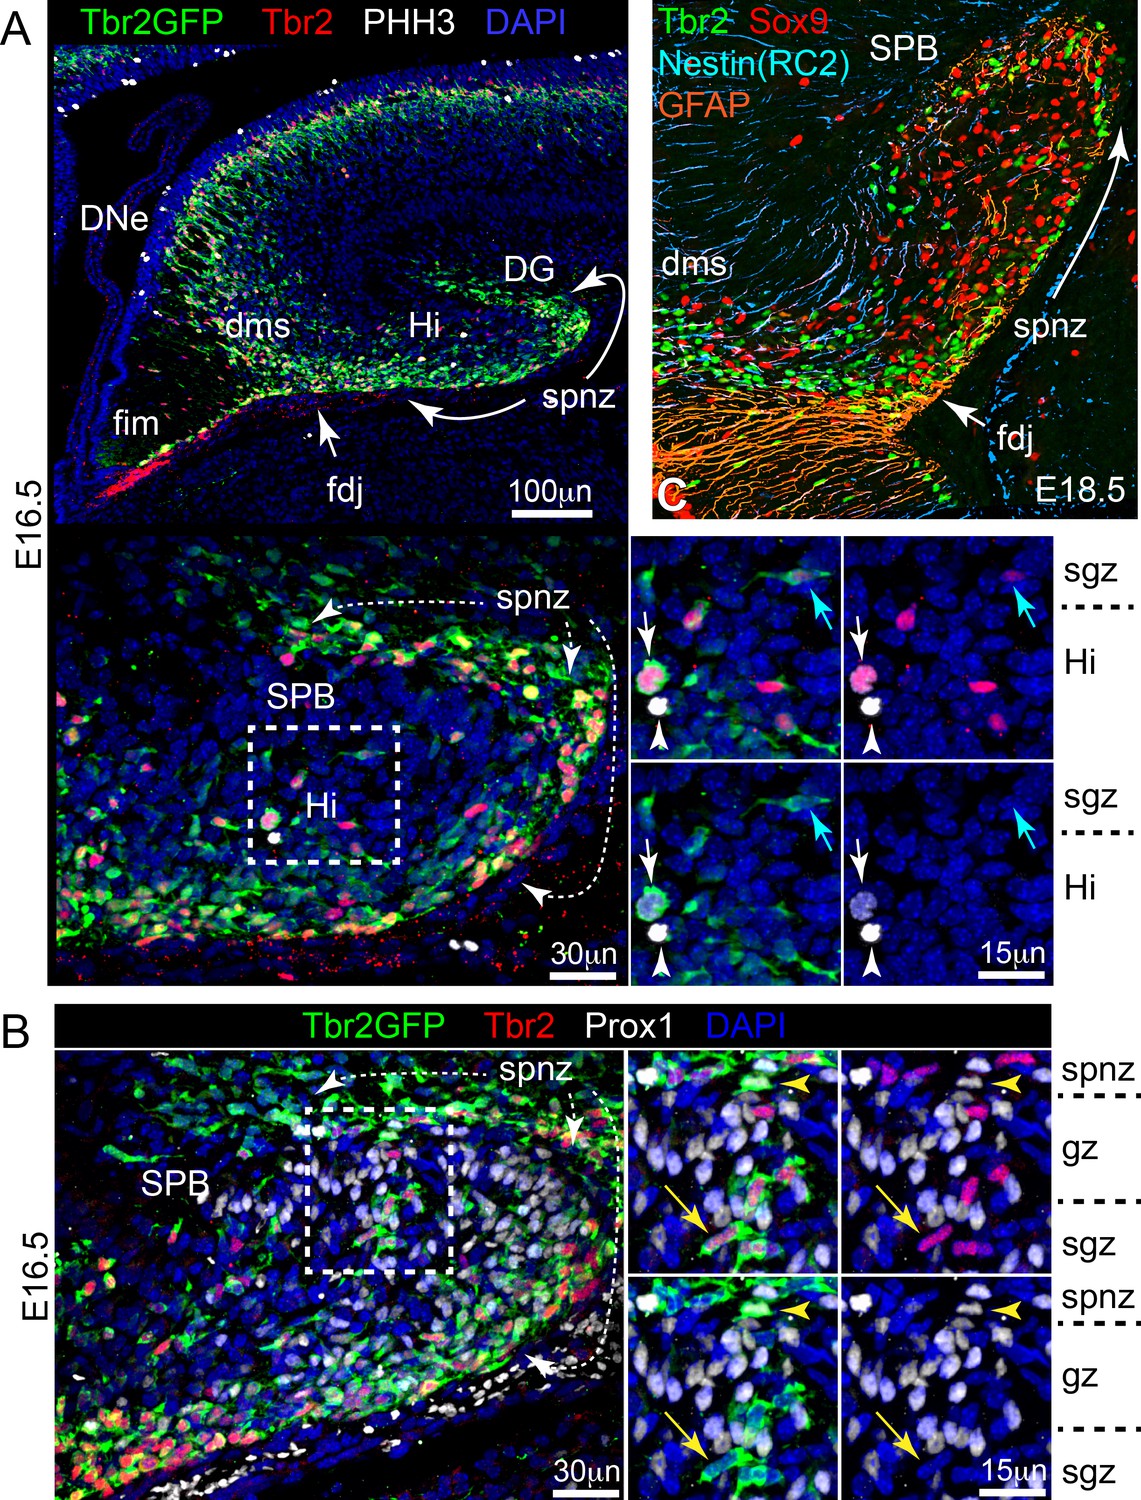
(A) By E16.5, a continuous DNe-DMS-FDJ-SPNZ/Hi transient niche with proliferating IPs (Tbr2GFP+/Tbr2+/PHH3+ white arrow) and NSCs (Tbr2GFP-/Tbr2-/PHH3+, white arrowhead) are apparent, and the nascent SGZ is identified by horizontally aligned Tbr2+/Tbr2GFP+ IPs (A, cyan arrow) under the newly forming the SPB (Dapi+ nuclei under the SPNZ) (Tbr2GFP KI). (B). By E16.5, horizontally aligned IPs (Tbr2GFP+/Tbr2+/Prox1 yellow arrow) are present in the nascent SGZ under newborn GNs (Tbr2GFP-/Tbr2-/Prox1+) forming the SPB: note rare later-stage IPs (Tbr2GFP+/Tbr2+/Prox1+) were also apparent (yellow arrowhead) (Tbr2GFP KI). (C). At E18.5, overlay of adjacent sections immunostained for Tbr2+ IPs (green), Sox9+ NSCs (red) were enriched in areas contained by radial glial fibers (GFAP orange, Nestin cyan): less mature radial fibers expressed Nestin (RC2 antigen), while few fibers expressed both GFAP and Nestin (pink or white due to orange/blue overlap).
Figure 2

Dll1-expressing IPs form a migrating niche for maintaining Notch active NSCs.
(A) Schematics of DG development and Notch signaling (see also Figure 1—figure supplement 1). (B) E14.5: Hes5GFP+ coronal sections show high reporting in fimbria, with mosaic Notch activation and Pax6 labeling in DNe (dashed lines): (B1-3) higher power views of boxed regions. (B1) Mosaic Pax6+ and/or Hes5GFP+ (high/low) NSCs dividing at the ventricular surface (NSCs 1–3) near Dll1+ puncta, including asymmetric divisions (NSC 3, Dll1+). (B2) Outer NSC (Hes5GFP+/Pax6+/Dll1-, arrowhead) contacting a Dll1+ IP (Pax6+/Hes5GFP-, arrow) in the SVZ/DMS border. (B3) Sparse mosaic Hes5GFP+ and Pax6+/- NSCs (arrowheads) in the proximal DMS near Dll1+ IPs (Pax6+/HesGFP-, arrows). (C) Abundant Dll1+ IPs (Tbr2+, arrows; and some older Tbr1+, arrowheads) in the SVZ-DMS boundary: note some Tbr2+ Dll1+ Hes5GFP+ IPs (inset) can be observed in the initial DMS that runs just below Cajal-Retzius cell (CRs: Tbr2+/Tbr1+, dashed arrows). (D) E15.5: Hes5GFP+ NSCs had long processes (arrowheads) and migrated into the DMS. (E) E16.5: Dll1+ puncta were present on Tbr2GFP+ IPs in the DNe, DMS, FDJ and DG (arrows): E1 higher power view of Dll1+ IPs in the SPNZ and nascent SGZ (arrows). (F) E16.5: Some NesGFP+ cells, including NSCs and IPs, exhibited Dll1 and/or Dll3 labeling (F1-4). (F5) NesGFP+ cells, presumably NSCs, with processes aligned radially through the SPB (paired asterisks-arrowheads). Their radial processes (all Dll1-/Dll3-) reached the SPNZ (asterisks-arrowheads). (G) P35: NesGFP+ NSCs with radial and horizontal morphologies were seen in the SGZ; some horizontal NSCs expressed Dll1 (arrowheads). (H) P35: Tbr2GFP+ IPs expressed Dll1 and/or Dll3 (arrowheads).
Figure 3 with 1 supplement
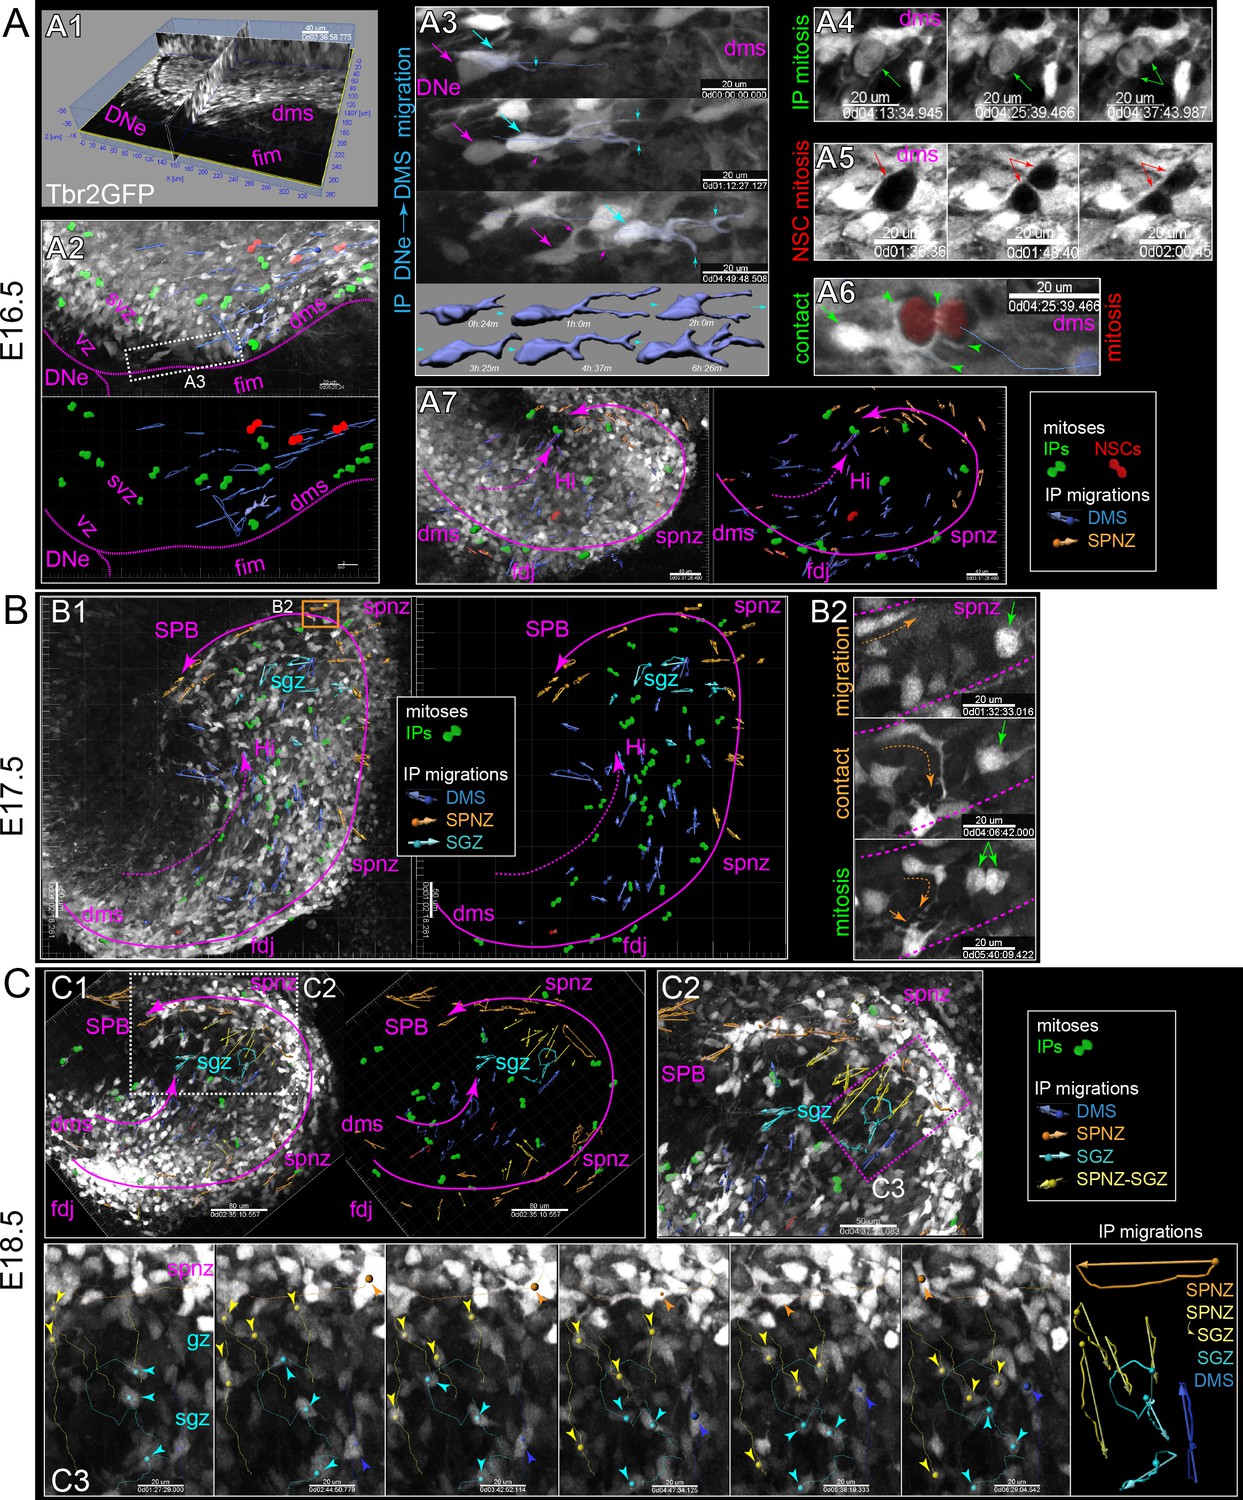
Live IPs divide and migrate through developing DG niches.
(A) Multiphoton live-cell imaging of Tbr2GFP+ IPs in E16.5 brain slice culture (see also Video 1, Source data 1). (A1) Grayscale orthoslice view (DNe→DMS). (A2) Volume view of all IPs in DNe→DMS in A1 overlaid with all live IP mitoses (rendered green cells) and trackable migrations (blue vectors): bottom panel summary vector map, some isolated IP cell morphological changes during migration rendered (blue cells). (A3) High power view of sequentially migrating IPs from the DNe SVZ→DMS: note the growth and elaboration of migrating IP leading process (cyan) followed by a second IP with similar migration morphology and dynamics (magenta); bottom shows individual IP cell dynamics. (A4) Live IP mitosis in DMS (green arrows). (A5) Live GFP- mitosis (likely NSC) in DMS (red arrows/asterisks). (A6) Live GFP- NSC mitosis in DMS encapsulated by multiple IP targeting processes (green arrow/arrowheads). (A7) E16.5 IP mitoses and migrations occurred in outer DMS→FDJ→SPNZ (Tbr2GFP TG). (B) Low power view of Tbr2GFP+ IPs at E17.5 (B1) overlaid with IP mitoses and migration summary vectors: note while IPs migrated in the SPNZ over the SPB, IPs in the DMS→Hi increased and directionally migrated towards SPNZ-derived IPs, and along the nascent SGZ (color coded vectors). (B2) High-power live view of a single IP in the SPNZ migrating backwards, turning inward towards the SPB (orange dashed arrow), and interacting with a multipolar IP (solid orange arrow) near a mitotic IP (green arrows) (Tbr2GFP KI): See also Video 2. (C) By E18.5, many Tbr2GFP+ IPs were present in the DMS→FDJ→SPNZ, and IPs migrating directly along the DMS→FDJ→hilus internal route increased (C1-2). (C2) Multiple IP migration routes converge at the nascent SGZ. (C3) Higher power time series of converging IPs at the nascent SGZ (Tbr2GFP KI); see also Video 3.
Figure 3—figure supplement 1

Multiphoton live-cell imaging reveals morphogenesis during early stages of DG formation in vitro.
Low-power multiphoton live-cell imaging reveals growth and rotation of embryonic DG in slice cultures resembling morphogenic gyrification. For each pair, initial boundaries are shown with blue lines, and final boundaries with gold lines. Apparent directions of growth are indicated with dashed lines.
Figure 4 with 1 supplement
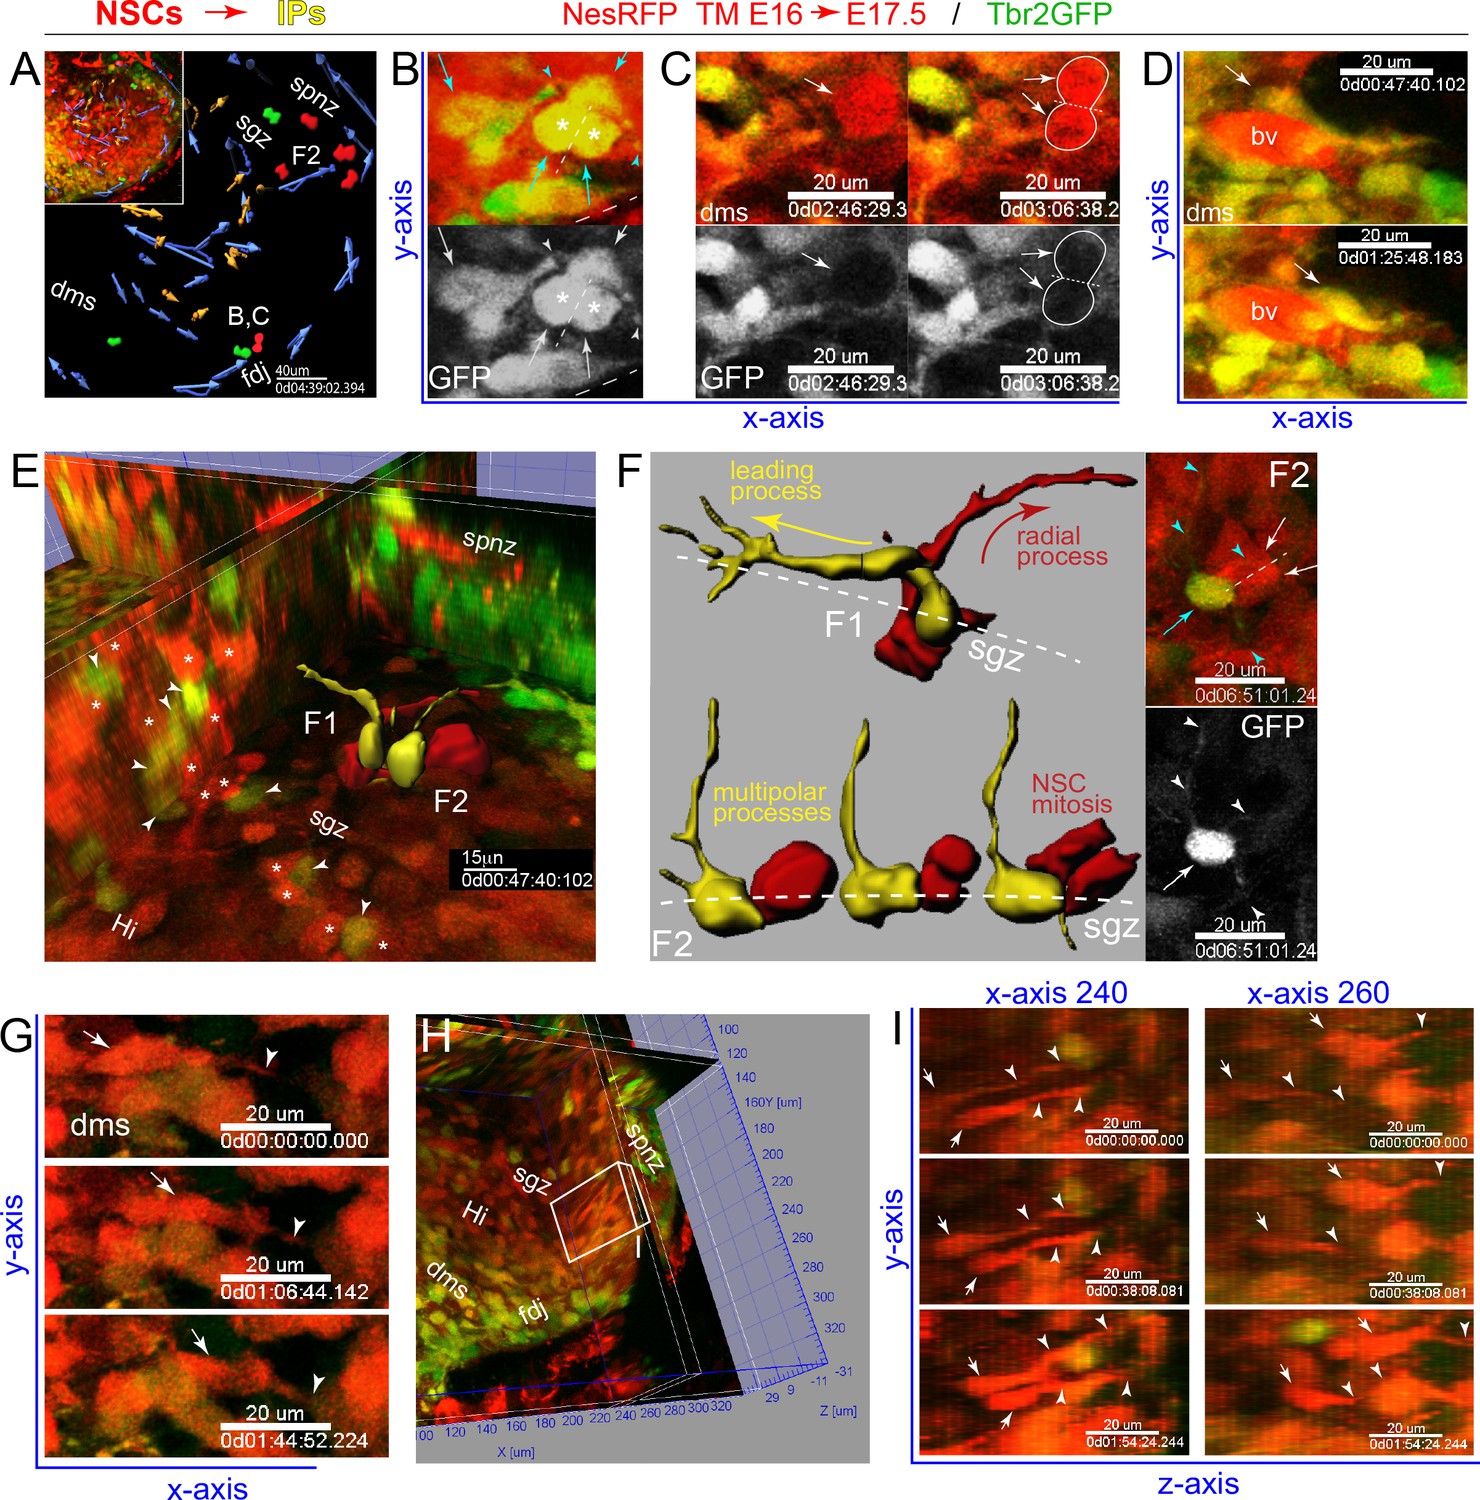
IPs and NSCs dynamically interact in developing DG.
(A) Summary map of 2-color multiphoton live imaging of genetically labeled NSCs (RFP) and IPs (GFP) at E17.5 (A-G, see also Video 4). (B) High power single optical section views of live migrating GFP+/RFP+ IP with leading process and stationary multi-polar IP (cyan arrows/arrowheads), both interacting with a mitotic IP (asterisks) in the DMS: bottom panel GFP only. (C) Two frames showing GFP+/RFP+ IP and leading process dynamically contacting mitotic NSC (RFP+/GFP-, arrows and outline) in the DMS; bottom panel GFP only. (D) Two frames showing IPs contacting and migrating near a blood vessel (bv). (E) Orthoslice angled to view extensive network of highly juxtaposed IP-NSC cell bodies within the nascent SGZ (IPs, arrowheads; NSCs, asterisks): two IP-NSC cell body pair interactions and dynamics were rendered over time and overlaid in 3D view (F1, F2). (F) Rendered IP-NSC cell body pairs isolated and viewed head-on: IPs pseudo-colored yellow (GFP+/RFP+); NSCs pseudo-colored red (GFP-/RFP+). (F1) Cell-cell interactions and IP migration occur in nascent SGZ with NSC extending radial process. (F2) Multi-polar IP with long-range dynamic processes contacting nearby mitotic NSC in nascent SGZ: top right panel, single optical section 2-color live image with IP (cyan arrow/arrowheads) and NSC division (white arrows, dashed line cleavage plane); bottom panel GFP only revealing additional fine processes not captured in rendering (white arrowheads). (G) Three frames showing RFP+ NSC with leading process (arrows/arrowheads) horizontally migrating through the DMS→FDJ. (H) Orthoslice view along the Y-Z axis within the nascent Hi-SGZ interior of the DG. (I) Some RFP+ NSCs with leading processes (arrows and arrowheads) migrated along the Y-Z axis in a coordinated posterior-to-anterior manner (H-I, see also Figure 4—figure supplement 1 and Video 5).
Figure 4—figure supplement 1
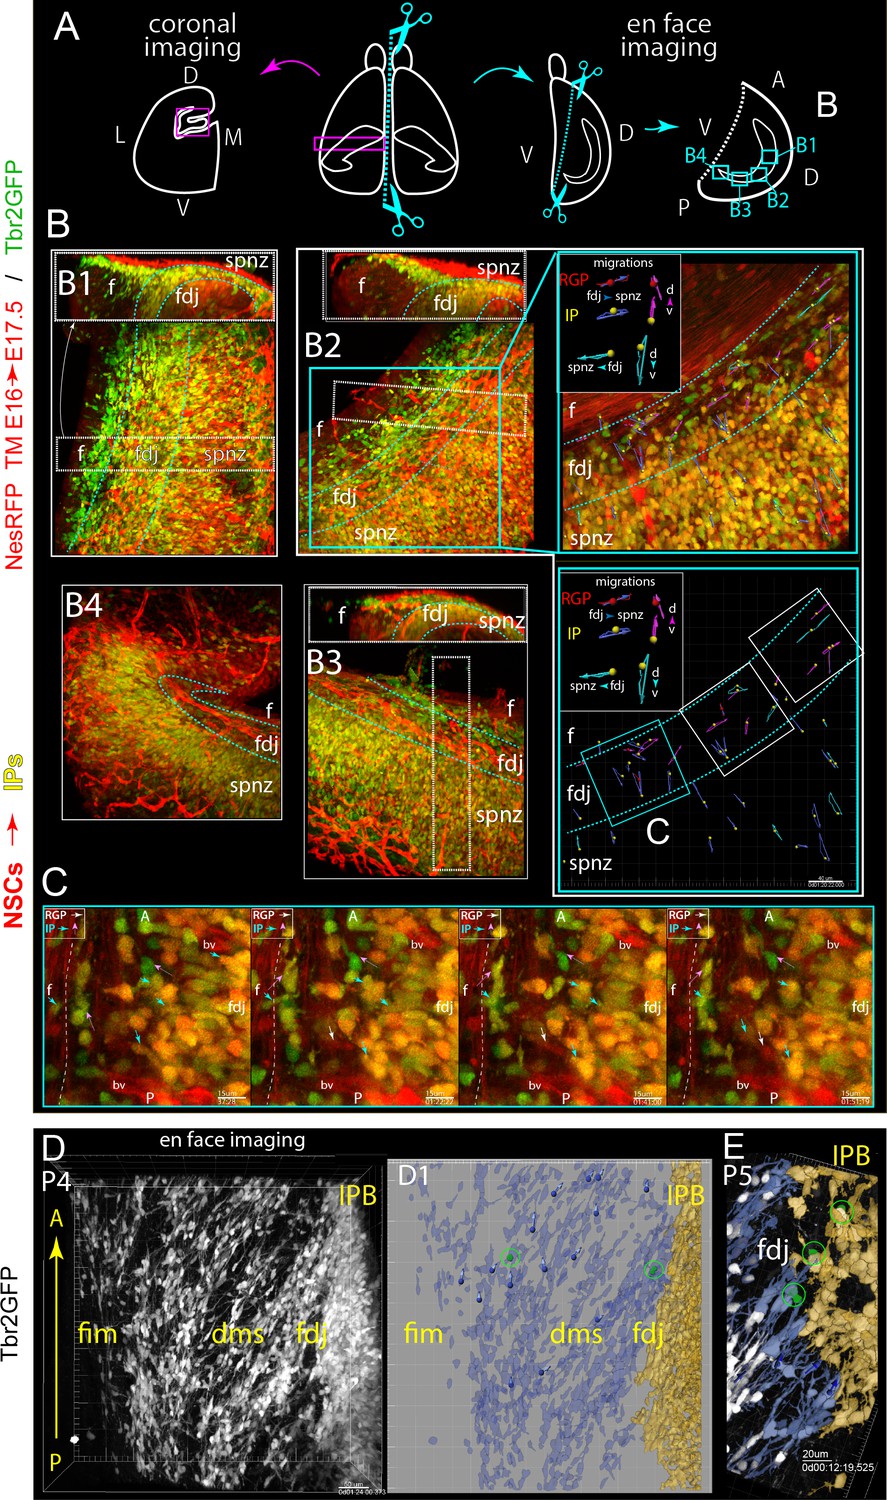
Multiple progenitor migration routes contribute to mosaic DG formation.
(A) Coronal versus en face 2-color multiphoton live-imaging DG along the anterior/dorsal-posterior/ventral (septal-temporal) axis (see also Video 5). (B) Low-power 3D volume views mapping 4 different regions (B1-4) along the fimbria-DMS-FDJ-IPB axis (left to right in most panels), along with an orthoslice view (top panels, B1-3) for reference to more standard coronal viewpoint (upside down). (B2) Blue box highlights a sub-region chosen for higher power 4D imaging, with a selected timepoint and corresponding cell migration summary maps: note that in addition to observing IPs and NSCs migrating along the standard Fim→DMS→FDJ route, additional IPs and NSCs migrating along the dorsal-ventral (septo-temporal) longitudinal axis near the DMS/FDJ region. Also note a dense vasculature bed marked by NesRFP+ pericytes in the overlying pia. (C) Higher-power single-optical sections and timepoints from region marked C (from B2) showing some details of multiple migration routes. (D–E) En face imaging of migrating P4-5 IPs in the later DMS/FDJ boundary near the midpoint (similar to B1) showing the change in orientation (ventral to dorsal) of Tbr2GFP+ IPs from the Fim to the FDJ. (D1) Live imaging summary map of rendered and pseudo-colored IPs migrating (blue) along the ventral-dorsal orientation to the FDJ and beginning of the IPB (yellow), note the cell tracks and live IP mitoses even at P5 (E).
Figure 5
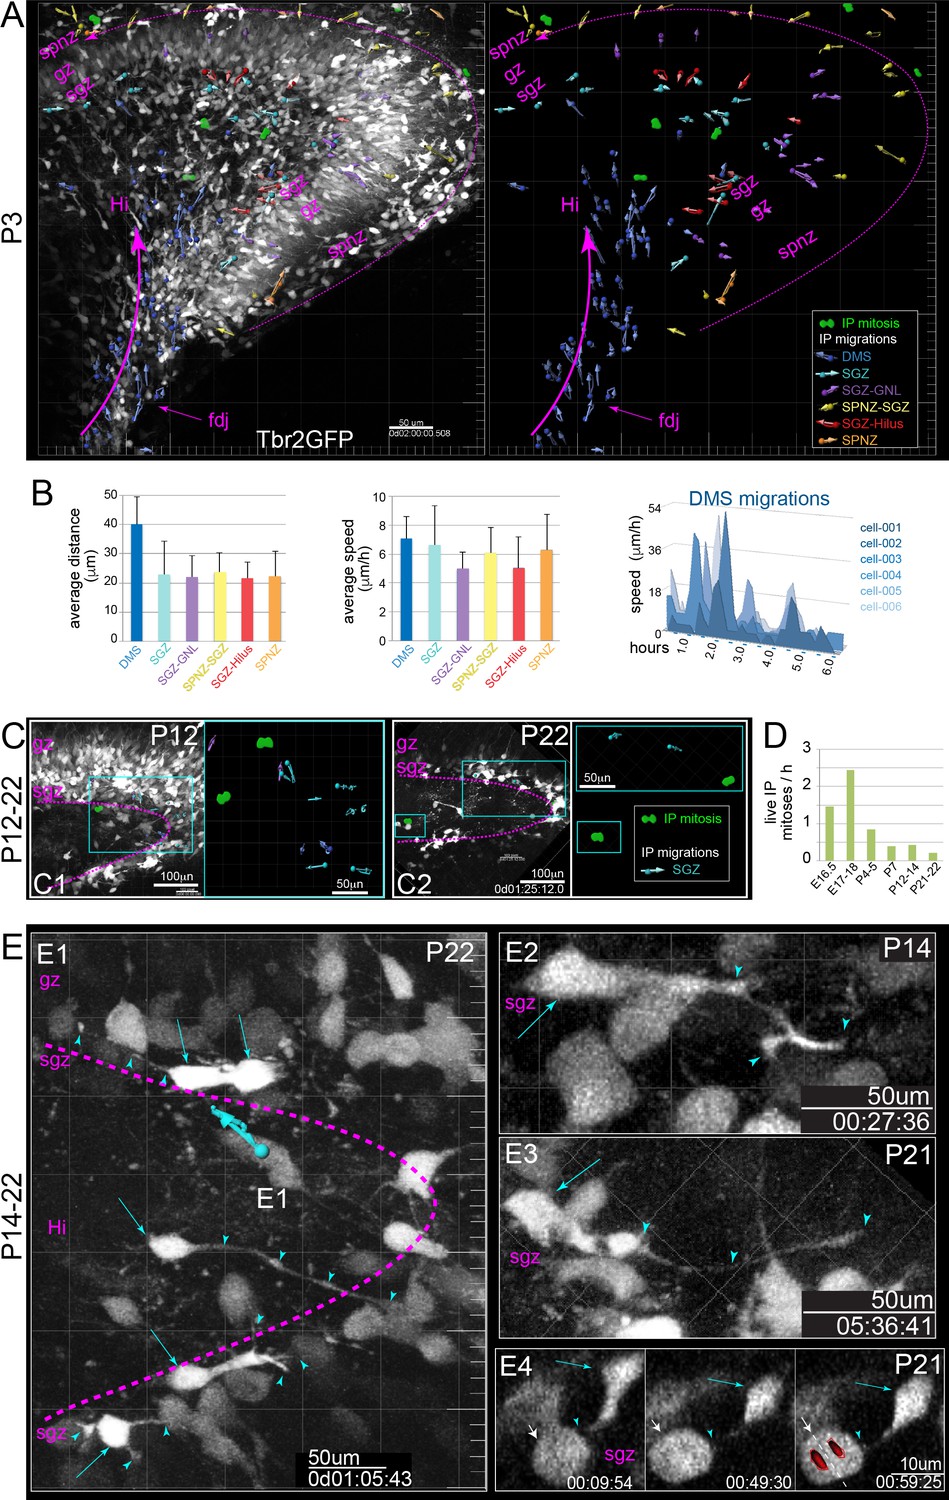
IP extensively divide and migrate in postnatal DG.
(A) Multiphoton live-cell imaging of P3 Tbr2GFP+ brain slices in culture reveal peak period of IP migrations from DMS→FDJ→Hi, extensive IP migrations within the SGZ, and remnants of IP SPNZ→SGZ migrations. IP mitoses were observed within the Hi-SGZ region and remaining SPNZ. Note that maturing GNs in the SPB and IPB remain visible due to high transgenic levels of GFP expression, confirming postnatal Tbr2+ IP→GN lineage (Tbr2GFP TG); see also Video 6. (B) Quantitation of average IP migration track lengths (left graph) and speed (right graph) through different migration routes at P3: IPs in the late DMS→FDJ→Hi route exhibited sustained and coordinated directionality; individual IPs in the DMS→FDJ→Hi exhibited stop-and-go migration kinetics, consistent with leading process navigation. (C) By P12 (C1) and P22 (C2), IP migrations and mitoses are confined to the SGZ. (D) Quantitation of all live IPs mitoses per hour across time points reveal age-related decline. (E) High power views of IP migrations and dynamics in the late postnatal and young adult SGZ. (E1–E4) Bright GFP+ IPs (cyan arrows) extend dynamic long-range branching filopodia (cyan arrowheads) contacting many cells throughout the SGZ, including neighboring mitotic IPs (E4, white arrow) (see also Video 7).
Figure 6
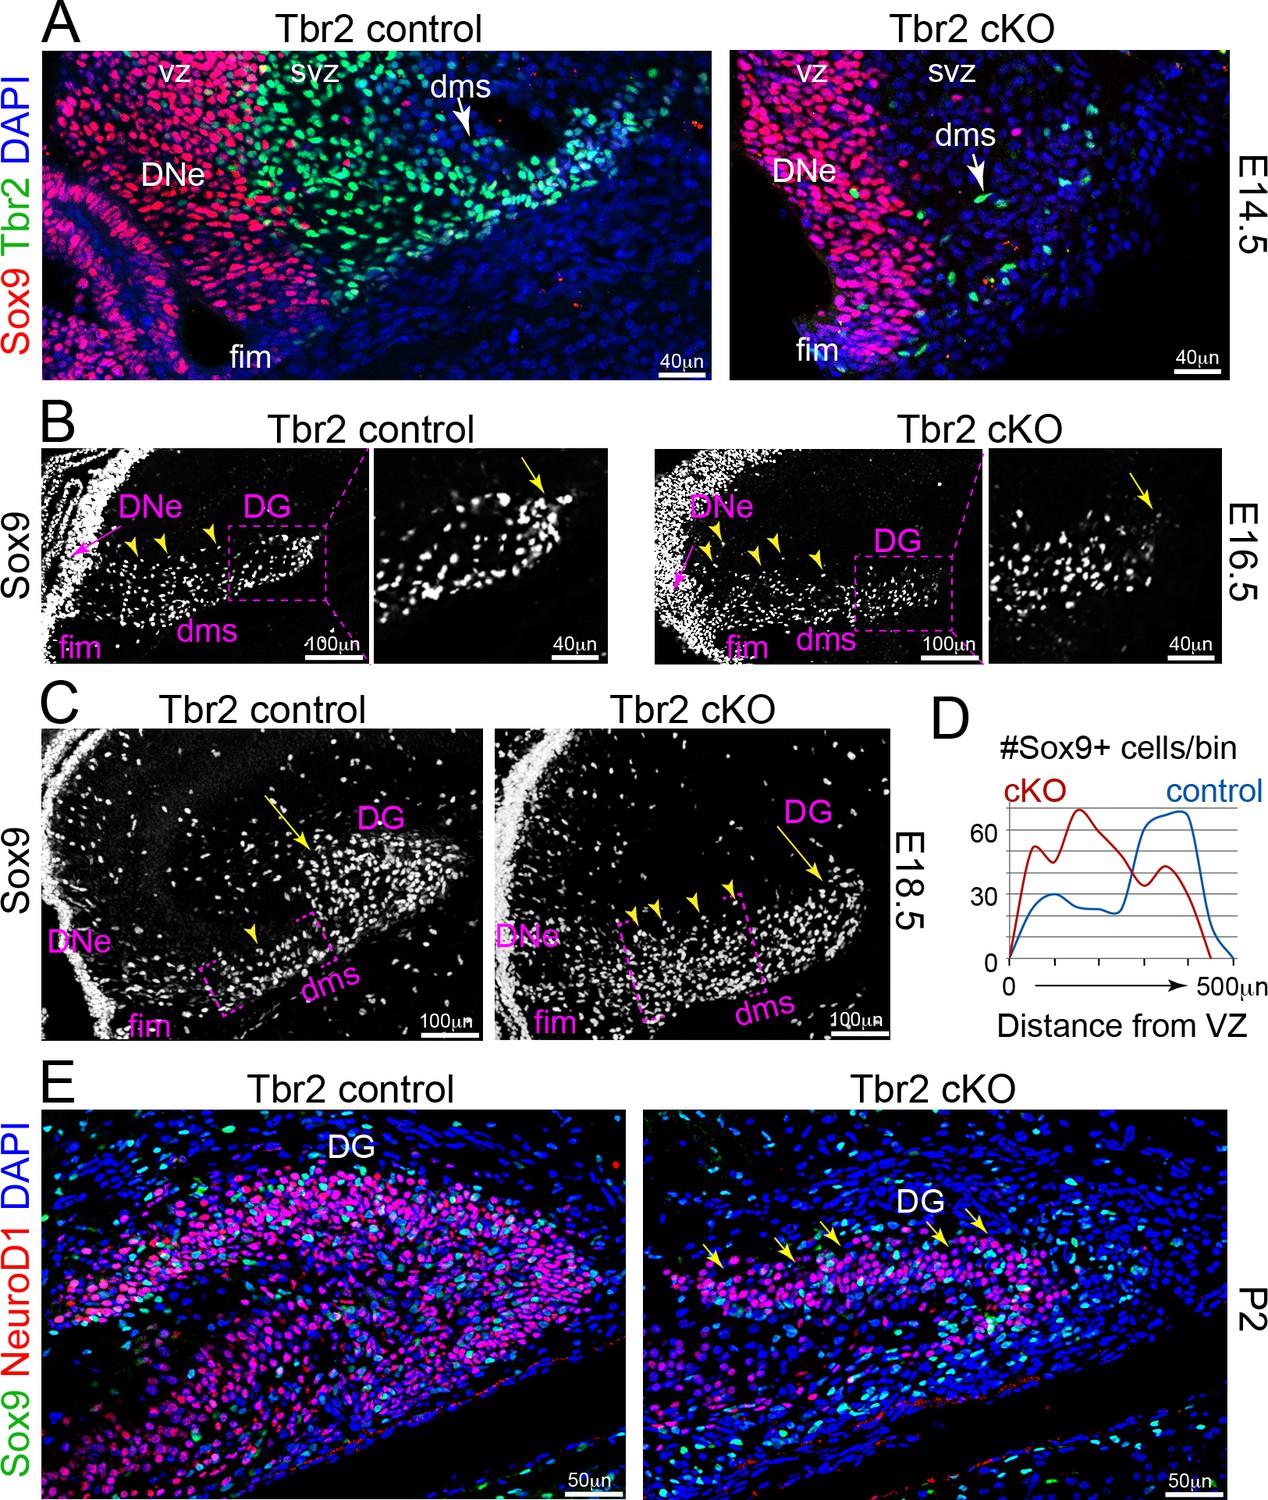
IP defects impair NSC migrations and GCL growth in Tbr2 cKO DG.
(A) Genetic ablation of IPs: Tbr2 conditional knockout (cKO) versus littermate controls. At E14.5, abundant pioneer Tbr2+ IPs migrated into the initial DMS in controls compared to the few Tbr2+ IPs escaping Tbr2 ckO recombination timing (arrows), while Sox9+ NSCs had yet to emerge from the DNe. (B) By E16.5, Sox9+ NSCs migrated from DNe→DMS, although NSCs in the DNe VZ (arrow), while Sox9+ NSCs in the proximal DMS appeared more dispersed in Tbr2 ckO compared to controls and were less distributed distally (arrow). (C) By E18.5, many Sox9+ NSCs have already migrated to the DG in controls compared to Tbr2 ckO (arrows), which exhibited many more Sox9+ NSCs especially backed up in the proximal DNe→DMS region (arrowheads). (D) Quantification of Sox9+ NSC numbers and migration distance of along the DNe→DMS→DG route reveals impairment in Tbr2 ckO animals. (E) By P2, the Tbr2 ckO DG was severely hypoplastic compared to controls, Sox9+ NSCs and NeuroD1+ new GNs were severely reduced, the SPB GCL remnant was highly dysmorphic (arrows and arrowhead), and the IBP was essentially absent.
Figure 7
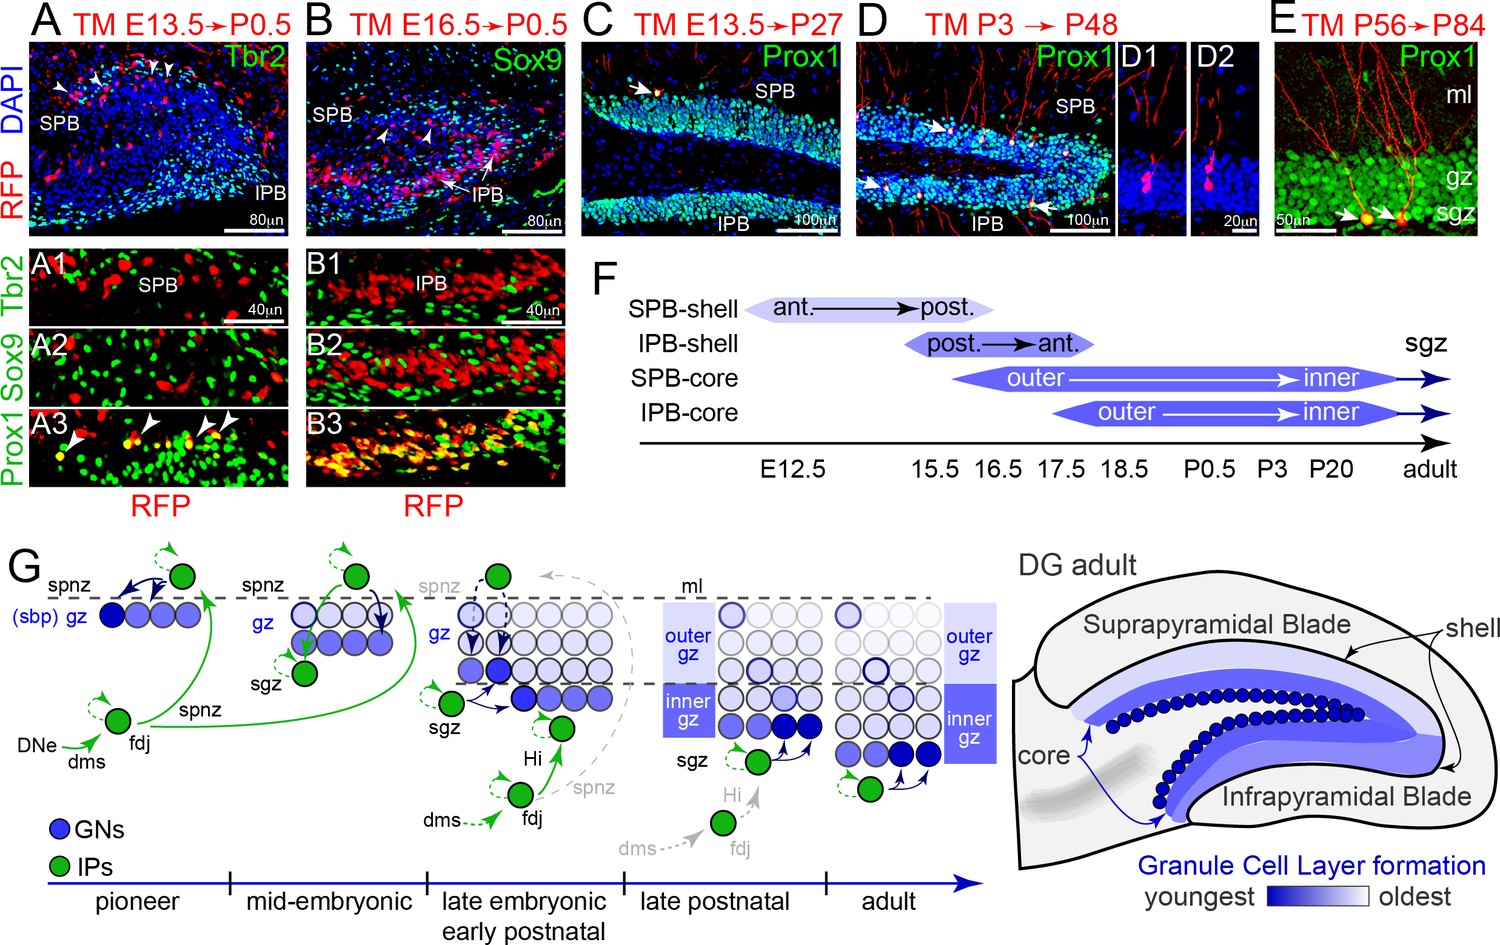
Tbr2+ IP cohorts generate GCL shell and core neurons sequentially.
(A) Pioneer IP cell fates were permanently tracked using single-dose tamoxifen (TM) injection into RFP lineage mouse lines (EomesCreERT2x Gt(ROSA)26Ai14) timed matings at E13.5, followed by immunolabeling for cell type specific markers and position in the DG at P0.5 (sagittal section; left-right, anterior-posterior orientation). Pioneering E13-14 RFP+ IPs were located in the anterior region of outer shell of the P0.5 SPB, and were Tbr2-/Sox9-/Prox1+ GNs (A1-3 arrowheads). (B) TM injection at E16.5 labeled some RFP+ GNs in the inner region of the SPB at P0.5 (top panel, arrowheads), and abundant Tbr2-/Sox9-/Prox1+ GNs in the IPB (B1–B3) in a posterior-anterior manner. (C) GNs (Prox1+) generated from pioneering E13-14 RFP+ IPs maintained position in the outermost anterior SPB, and exhibited mature GN dendritic arbors and morphologies in the mature P27 DG (arrow). (D) GNs (Prox1+) generated from P3 TM-labeled RFP+ IPs occupied middle and outer regions along the P48 adult SPB-IPB, and exhibited mature morphologies (arrowheads): examples of possible sister pairs of GNs (D1–D2). (E) Adult RFP+ IPs generated Prox1+ GNs with mature morphologies in the SGZ along inner core edge of the SPB and IPB (arrows). (F) Summary of genetic lineage IP→GN cell fate tracing and position in the granule cell layer of the DG. (G) Model depicting how pioneering IPs seed GNs in the forming SPB, and how sequentially migrating IP streams converge with new resident IPs at the SGZ to add layers in an outside-inside fashion. (H) Generalized granule cell layer birth order and timing from F overlaid onto adult DG schematic.
Figure 8
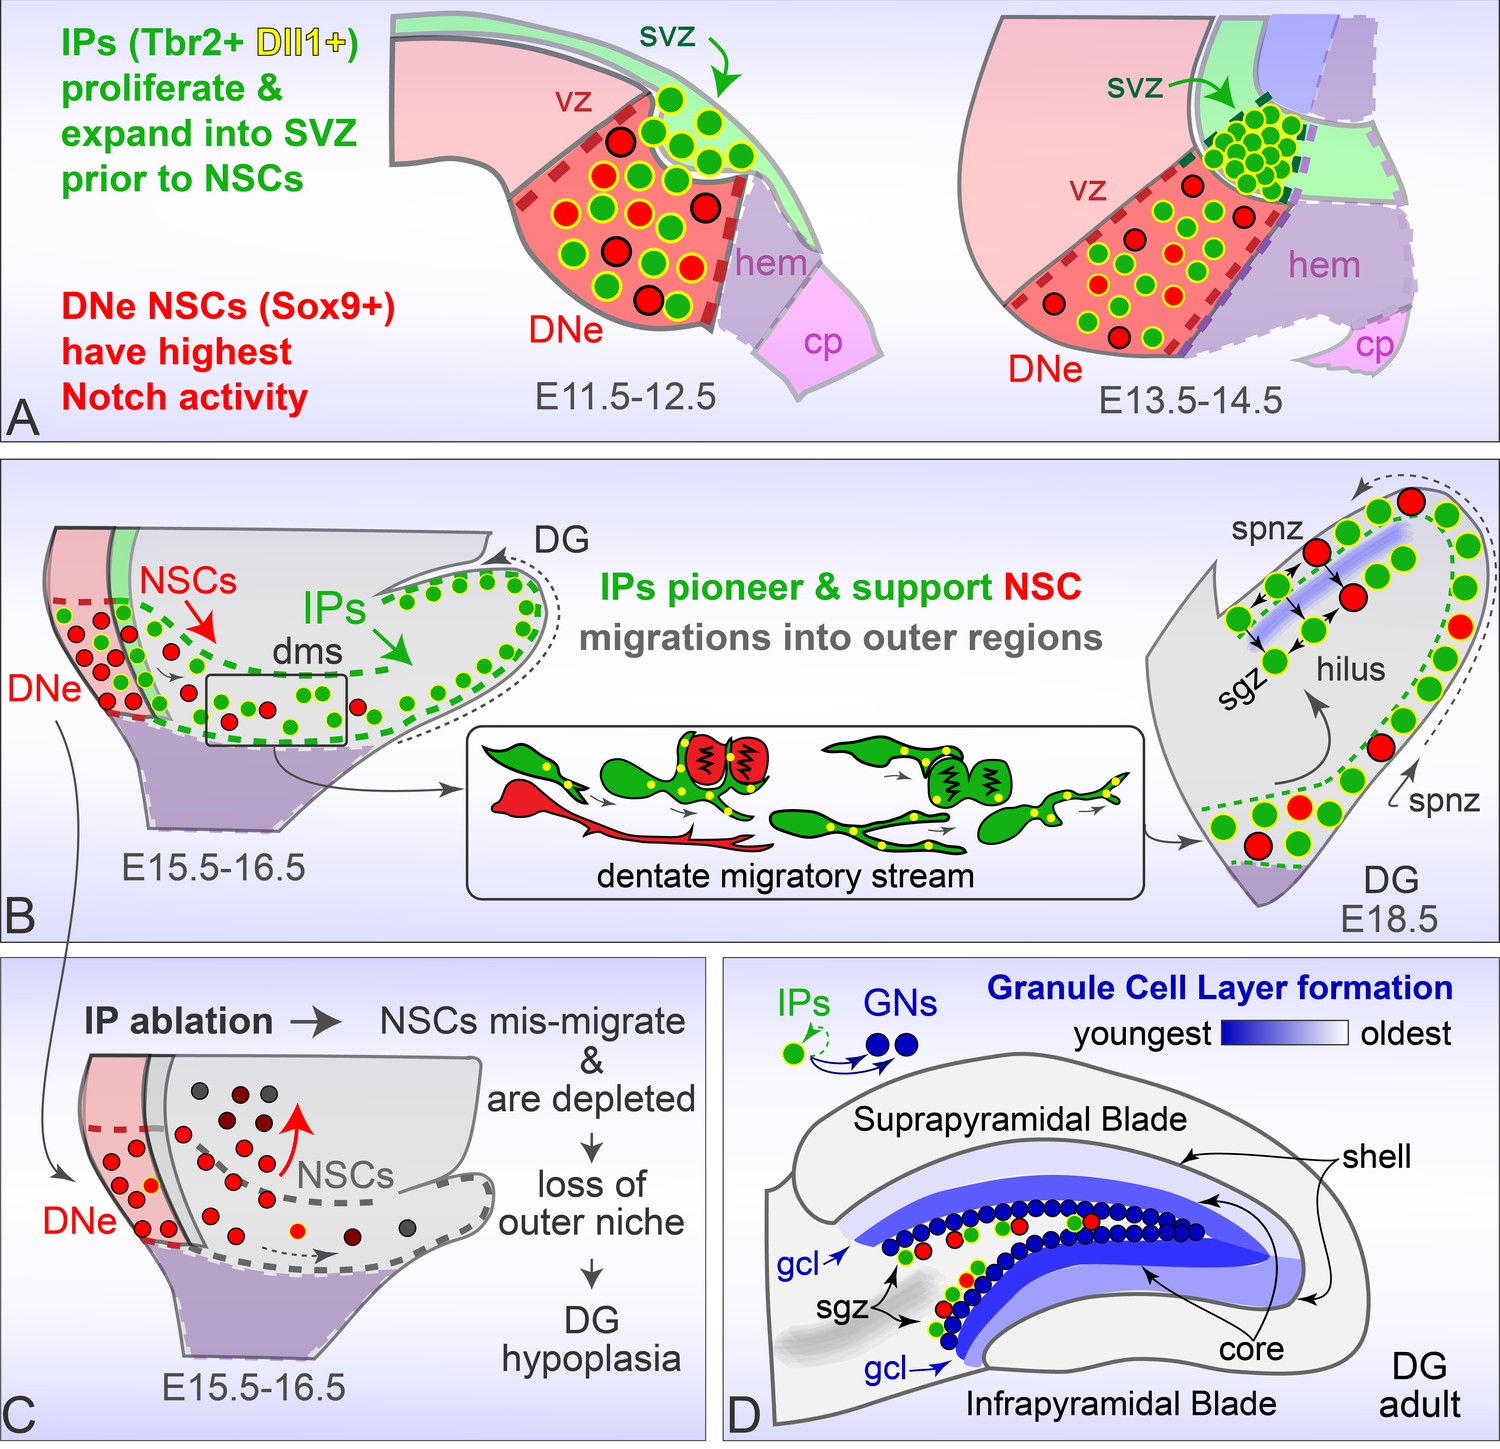
Rodent Dentate Gyrus formation.
(A) Prior to migration, Tbr2+ Dll1+ IPs proliferate and expand into the DNe SVZ, while Sox9+ NSCs are distinguished by high combinatorial Notch activity. (B) Dll1+ IPs pioneer migration into outer niches, and target dynamic processes to mitotic neighbors to create a supportive niche for later emigrating NSCs maintenance and guidance. (C) Genetic ablation of IPs leads to NSC accumulation and mis-migrations in the proximal DMS, accompanied by rapid NSC depletion in outer regions leading to DG hypoplasia. (D). Timed genetic lineage tracing reveals IPs exclusively generate GNs at all ages, and together with multiphoton live imaging reveal how IPs born at different ages transition through different migration routes to converge and layer GNs in a defined spatiotemporal manner.
Videos
Video 1
Emigration from DNe into DMS E16.5 Tbr2GFP+ coronal slices live-imaged during in vitro culture show how typical imaging session is conducted and analyzed, as well as high-power examples of isolated IPs emigrating from the DNe into the proximal DMS, and dynamic IP cell characteristics during migrations, including leading process branching dynaimcs and contacts with neighboring mitotic IPs and NSCs (GFP- visible due to high contrast from IPs) (Tbr2GFP TG).
(1) orthoslice view of individual slices in volume (2) volume view of all IPs (3) Isolated IPs migrating from DNe into DMS (4) IPs dividing in DMS and SPNZ (5) NSCs (Tbr2GFP-) dividing in the DMS and SPNZ (6) migrating IPs contact dividing NSCs.
Video 2
Morphogenesis in vitro Low-power views of early embryonic.
DG slices live-imaged during in vitro culture show morphogenic movements analogous to ‘gyrification’ in vivo, including large-scale rotations and cell migrations (see also Figure 3—figure supplement 1). (1) E16.5 Tbr2GFP TG coronal slice (2) E17.5 Tbr2GFP KI coronal slice.
Video 3
SGZ convergence E18.5 Tbr2GFP KI coronal slices live-imaged during in vitro culture reveal how multiple different developmentally born IP cohorts migrating though transient niches converge and dynamically settle within the late embryonic SGZ.
(1) DMS-FDJ-SPNZ-SGZ (2) DMS-FDJ-Hilus-SGZ.
Video 4
2-color multiphoton live imaging: IP – NSC migrations and interactions.
Timed matings with TM injection at E16.0 and 2-color multiphoton live-imaging of NSCs (RFP+) and IPs (GFP+) in coronal slices revealed extensive IP-NSC interactions throughout transient niches and in the nascent SGZ: Tbr2GFP KI X NesRFP. (1) DG: low-power volume view (2) DMS - FDJ: migrating IPs contact dividing IPs (3) DMS - FDJ: migrating NSCs (4) DMS - FDJ - SPNZ: migrating IPs contact dividing NSCs (5) SGZ: IPs support NSC (6) IPs contact/migrate near BVs.
Video 5
Additional IP and NSC migration routes contribute to mosaic DG formation −2 color live imaging of IPs and NSCs.
Timed matings with TM injection at E16.0 and 2-color multiphoton live-imaging of NSCs (RFP+) and IPs (GFP+) in coronal slices and en face whole-mounts live-imaged reveal additional IPs and NSCs subpopulations longitudinally oriented along anterior/dorsal-posterior migration routes near the DMS-FDJ-hilus/SPNZ contribute to mosaic DG formation: Tbr2GFP KI X NesRFP. (1) coronal slice: additional NSC migrations (2) coronal slice versus en face whole-mount imaging (3) region B1 (anterior FDJ-SPNZ): new view of IP migrations (4) region B2 (posterior FDJ -SPNZ): new IP and NSC migrations -high power example 1 -high power example 2 (5) IPs migrate near blood vessels (6) postnatal IP migration trajectories (DMS-FDJ-SPNZ).
Video 6
Postnatal DG development: migration shifts, contacts and layering.
Early postnatal Tbr2GFP+ coronal slices live-imaged during in vitro culture reveal predominate shift to the more direct DMS-FDJ-Hilus-SGZ route from earlier DMS-FDJ-SPNZ-SGZ route, and high power views show how IPs dynamically settle within the SGZ (Tbr2GFP TG). (1) IP migrations shift from FDJ-SPNZ to FDJ-Hilus -low power view: multiple migration routes (2) IPs maintain embryonic cell characteristics -long-range branching processes and cell contacts (3) Individual IPs dynamically settle in the SGZ.
Video 7
Young adult DG: maintenance of developmental phenotypes Late postnatal and young adult Tbr2GFP coronal slices live-imaged during in vitro culture reveal cell biological characteristics observed in embryonic and early postnatal DG continue in adult IPs (Tbr2GFP TG).
(1) IPs in the late DMS contact mitotic IPs (2) IPs in the adult niche maintain embryonic characteristics -low power view: dynamics and migrations -isolated IPs and long-range branching processes -IPs contact mitotic IPs.
Tables
Key resources table
| Reagent type (species) or resource | Designation | Source or reference | Identifiers | Additional information |
|---|---|---|---|---|
| Gene (Mus musculus) | Eomes | Eomes→ Tbr2 | ||
| Antibody | anti-Tbr2 (Rat monoclonal) | Thermo Fisher Scientific | Cat# 14-4875-82, RRID:AB_11042577 | IF (1:250) |
| Antibody | anti-Tbr2 (mouse monoclonal) | Thermo Fisher Scientific | Cat# 14-4877-80, RRID:AB_2572881 | IF (1:500) |
| Antibody | anti-Prox1 (rabbit polyclonal) | EMD Millipore | Cat# ABN278, RRID:AB_2811075 | IF (1:500) |
| Antibody | anti-Sox9 (rabbit ployclonal) | EMD Millipore | Cat# AB5535 | IF (1:1000) |
| Antibody | anti-PCNA (mouse monoclonal) | EMD Millipore | Cat# MAB4076, RRID:AB_95029) | IF (1:500) |
| Antibody | anti-Hes1 (rabbit polyclonal) | Gift from Dr. Nadean Brown (Nelson et al., 2013) | IF (1:1000) | |
| Antibody | anti-Pax6 (rabbit ployclonal) | Biolgend (Covance) | Cat# 901301 | IF (1:1000) |
| Antibody | anti-Pax6 (mouse monoclonal) | DSHB | supernatent | IF (1:50) |
| Antibody | anti-NeuroD1 (goat polyclonal) | Santa Cruz | Cat# (N-19): sc-1084 | IF (1:400) |
| Antibody | ranti-GFAP (rabbit polyclonal) | Dako | Cat# GA524, RRID:AB_2811722 | IF (1:1000) |
| Antibody | anti-Nestin (mouse monoclonal) | DHSB | RC2 | IF (1:50) |
| Antibody | anti-Histone H3 (phospho S28) (rat monoclonal) | Abcam | Cat# ab10543 | IF (1:500) |
| Antibody | anti-Reelin (mouse monoclonal) | EMD Millipore | Cat# MAB5364 | IF (1:1000) |
| Antibody | anti-GFP (chicken polyclonal) | Abcam | Cat# ab13970, RRID:AB_300798 | IF (1:500) |
| Antibody | anti-Dll1 (sheep polyclonal) | R and D | Cat# AF5026 | IF (1:100) |
| Antibody | anti-Dll3 (rabbit polyclonal) | Santa Cruz | Cat# sc-67269 | IF (1:100) |
| Antibody | Donkey anti-rabbit ALEXA 488/568/647 | Thermo Fisher Scientific | Cat# R37118, A10042 , A-31573 | IF (1:500) |
| Antibody | Donkey anti-rat ALEXA 488/594 | Thermo Fisher Scientific | Cat# A-21208, A-21209 | IF (1:500) |
| Antibody | Donkey ant-mouse ALEXA 488/568/647 | Thermo Fisher Scientific | Cat# R37115, A10037, A-31571 | IF (1:500) |
| Antibody | Donkey anti-chicken ALEXA 488 | Jackson | Cat# 703-545-155 | IF (1:500) |
| Antibody | Donkey anti-sheep ALEXA 568 | Thermo Fisher Scientific | Cat# A-21099 | IF (1:500) |
| Chemical compound, drug | DAPI 4',6-diamidino-2- phenylindole | Invitrogen | Cat# D1306 | IF (1:10,000) |
| Other | Fluoromout-G | Southern Biotech | Cat# 0100–01 | |
| Chemical compound, drug | tamoxifen (TM) | Sigma | T5648 | |
| Other | NeuroBasal media | Invitrogen | Cat# 21103049 | |
| Other | N2 supplement | Invitrogen | Cat# 17502048 | |
| Other | B27 supplement | Invitrogen | Cat# 17504044 | |
| Other | Pen/Strep | Invitrogen | Cat# 15140122 | |
| Other | FBS | Invitrogen | Cat# 16000044 | |
| Other | HBSS | Invitrogen | Cat # 14025076 | |
| Genetic reagent Mus musculus | EomesGFP | (Arnold et al., 2009) | Tbr2GFP KI | Knockin Tbr2GFP reporter |
| Genetic reagent Mus musculus | Tg(Eomes-EGFP)DQ10Gsat | (Kwon and Hadjantonakis, 2007) | Tbr2GFP TG | BAC transgenic Tbr2GFP reporter |
| Genetic reagent Mus musculus | Eomesflox/flox | (Intlekofer et al., 2008) | Tbr2 cKO | Cross to Cre lines for inducible and/or conditional knockout |
| Genetic reagent Mus musculus | EomesCreERT2 | (Pimeisl et al., 2013) | Inducible CreT2 for tracking IP lineage | |
| Genetic reagent Mus musculus | Gt(ROSA)26Ai14 | (Madisen et al., 2012) | Ai14 | lox-stop-lox tdTomato reporter |
| Genetic reagent Mus musculus | Nes-GFP | (Mignone et al., 2004) | NesGFP | Transgenic NesGFP reporter |
| Genetic reagent Mus musculus | Nes-Cre | (Tronche et al., 1999) | Transgenic NesCre driver | |
| Genetic reagent Mus musculus | Nes-CreERT2 | (Imayoshi et al., 2006) | Transgenic NesCre driver | |
| Genetic reagent Mus musculus | Hes5-GFP | (Basak and Taylor, 2007) | Hes5GFP | Transgenic Hes5GFP reporter |
| Other | FIJI | NIH | ||
| Other | Photoshop, Illustrator | Adobe | ||
| Other | Imaris 7.4 | Bitplane | ||
| Other | Filmora9 | Wondershare | ||
| Other | Allen Developing Mouse Brain Atlas (2008) | http://developingmouse.brain-map.org/ |
Additional files
-
Source data 1
Live-cell multiphoton 4D datasets of embryonic, postnatal, and adult IPs and NSCs in the Dentate Gyrus.
- https://cdn.elifesciences.org/articles/53777/elife-53777-data1-v3.docx
-
Transparent reporting form
- https://cdn.elifesciences.org/articles/53777/elife-53777-transrepform-v3.docx
Download links
A two-part list of links to download the article, or parts of the article, in various formats.
Downloads (link to download the article as PDF)
Open citations (links to open the citations from this article in various online reference manager services)
Cite this article (links to download the citations from this article in formats compatible with various reference manager tools)
Intermediate progenitors support migration of neural stem cells into dentate gyrus outer neurogenic niches
eLife 9:e53777.
https://doi.org/10.7554/eLife.53777


