Wings and halteres act as coupled dual oscillators in flies
- Department of Biology, University of Washington, United States
- Department of Physics, Azim Premji University, India
- National Centre for Biological Sciences, Tata Institute of Fundamental Research, India
Figures
Figure 1
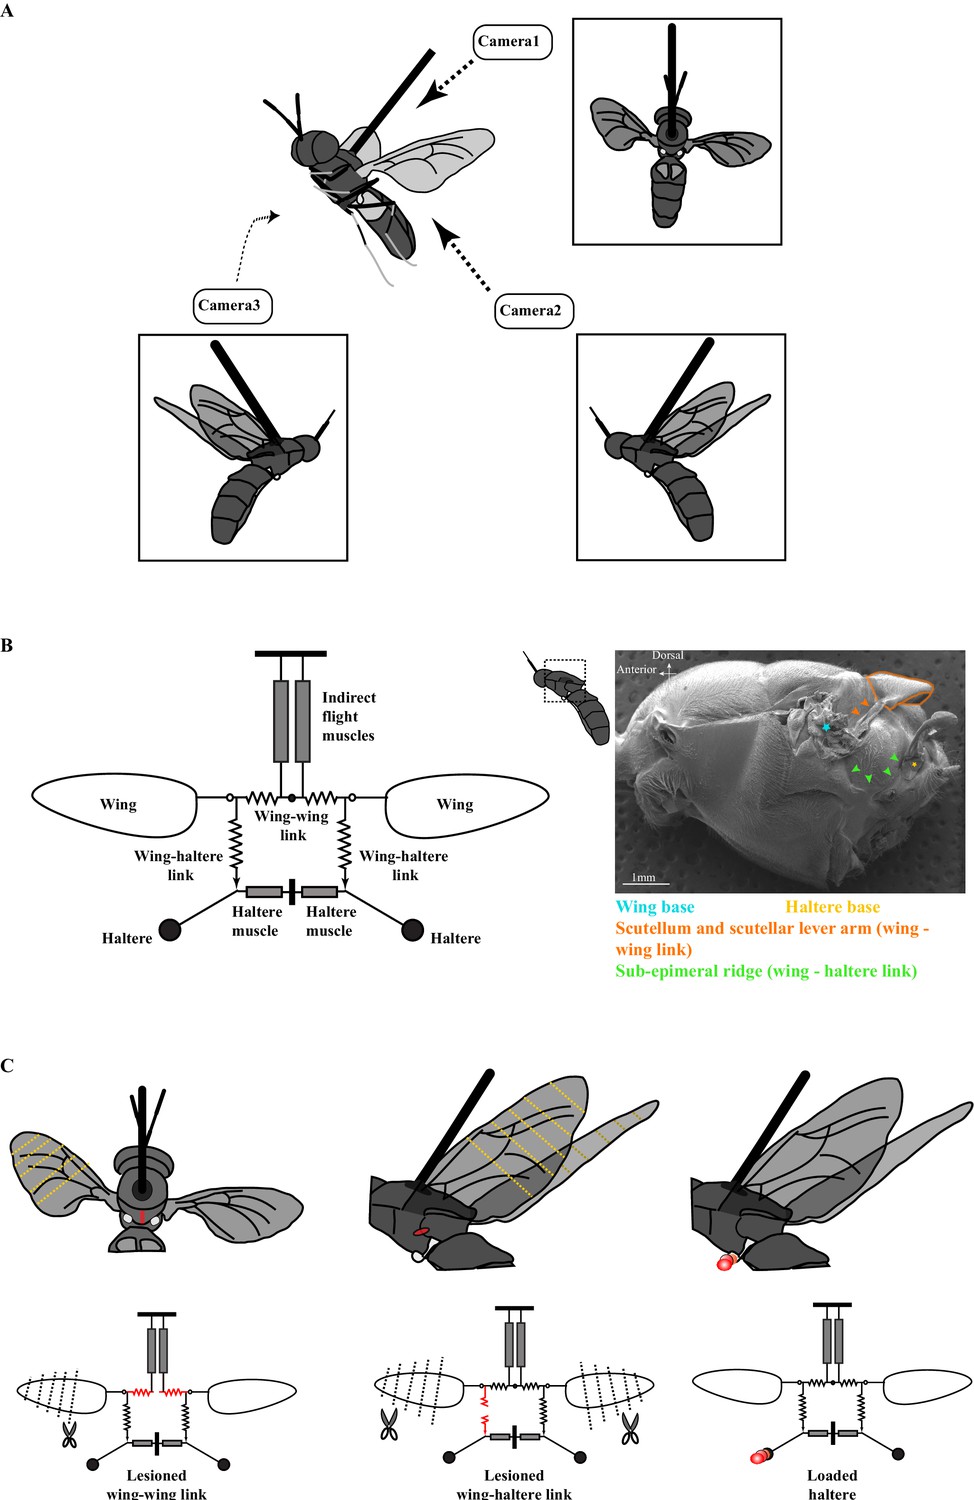
The experimental setup.
(A) Schematic of a tethered fly showing the position of the three high-speed cameras. Insets show the three different camera views. (B) Mechanical model of the Dipteran thorax modified from an earlier work (left, Deora et al., 2015). This model excludes the clutch and gearbox from the previous figure (represented here by an open circle at the wing joint), focusing instead on the wing-wing and wing-haltere linkages that are the focus of the experiments described here. (Right) SEM image of the solder fly thorax in the lateral view highlighting the various linkages. (C) A schematic (top) and model (bottom) illustrating the experimental treatments. The treatments (red) included lesioning the scutellum or wing-wing link (left panel), lesioning sub-epimeral ridge or wing-haltere link (middle panel) and haltere loading (right panel). The clipped wings are also indicated with dotted lines. The same treatments are also shown in the model schematic and used as insets in later figures. Figure 1B has been adapted from Figure 4G from Deora et al., 2015.
Figure 2 with 4 supplements

The frequency of the two wings is synchronized by the scutellum.
Wingbeat frequency (A, B) and amplitude (C, D) of intact (gray boxes) and clipped (red boxes) wing as a function of clipped wing length for intact thorax (A, C) and slit scutellum (B, D). Insets show schematic for treatments. Each dot represents an individual fly. (A) Flies with intact thorax flap their wings at identical frequencies, whereas (B) the scutellum-lesioned flies flap at different frequencies. (C) In intact, tethered flies, the clipped wing moves through a smaller amplitude compared with the intact wing. (D) In scutellum-lesioned flies, both wings move erratically, with no consistent trend in wingbeat amplitude.
Figure 2—figure supplement 1
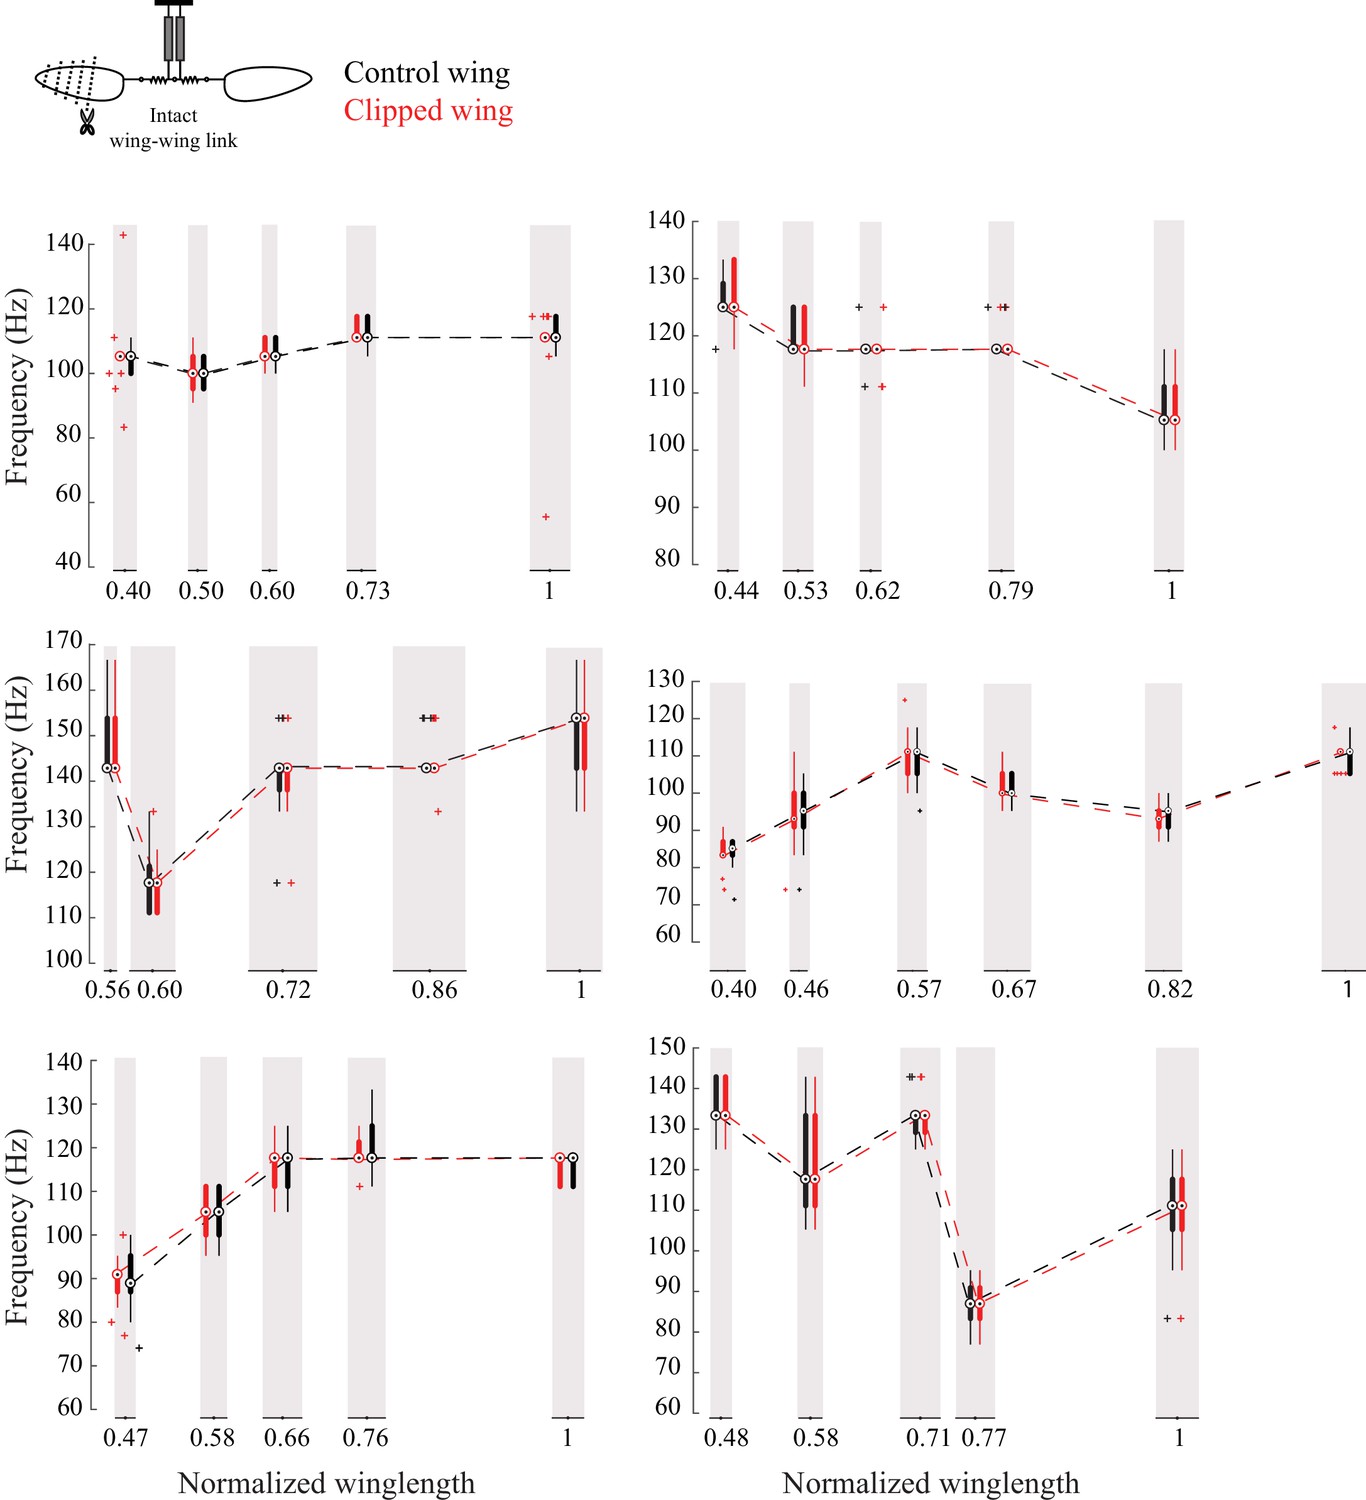
The frequencies of the two wings are coupled in intact flies.
Frequency of the intact (black) and clipped (red) wing plotted as compact box plot as a function of the clipped wing length for six individual flies showing that flies always flap the wings at the same frequency.
Figure 2—figure supplement 2
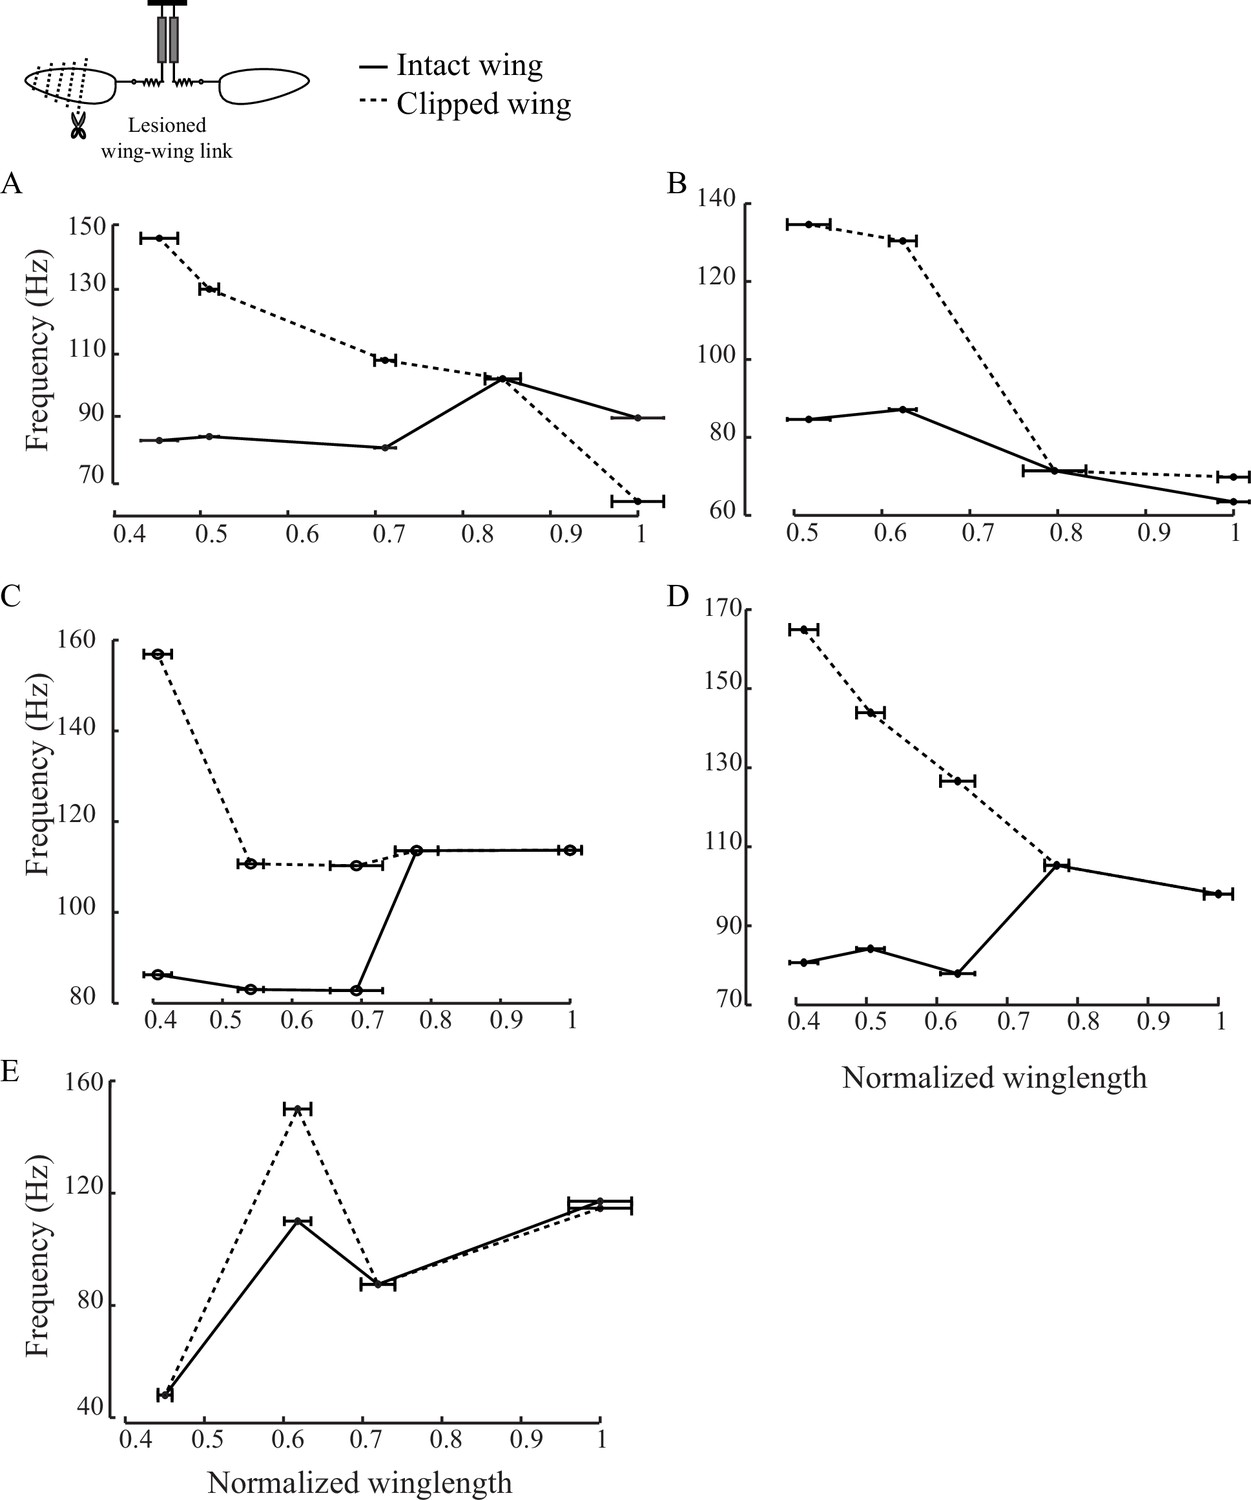
Scutellum synchronizes the frequencies of the two wings.
(A - E) Individual plots show the peak wingbeat frequency for intact (black solid) and clipped (black dotted) wing as a function of the length of the clipped wing for five individual flies.These plots show that lesioning the scutellum disrupts the synchrony of the two wings and causes them to flap at different frequencies if the length of one is altered.
Figure 2—video 1
Left and top views of a soldier fly with left wing clipped and right wing intact (Figure 2).
Video captured at 2000 fps and played back at 10 fps.
Figure 2—video 2
Right and top views of the soldier fly whose wing-wing link (scutellum) has been severed.
The right clipped wing flaps at higher frequency as compared to the left intact wing (Figure 2). Video captured at 2000 fps and played back at 10 fps.
Figure 3 with 3 supplements
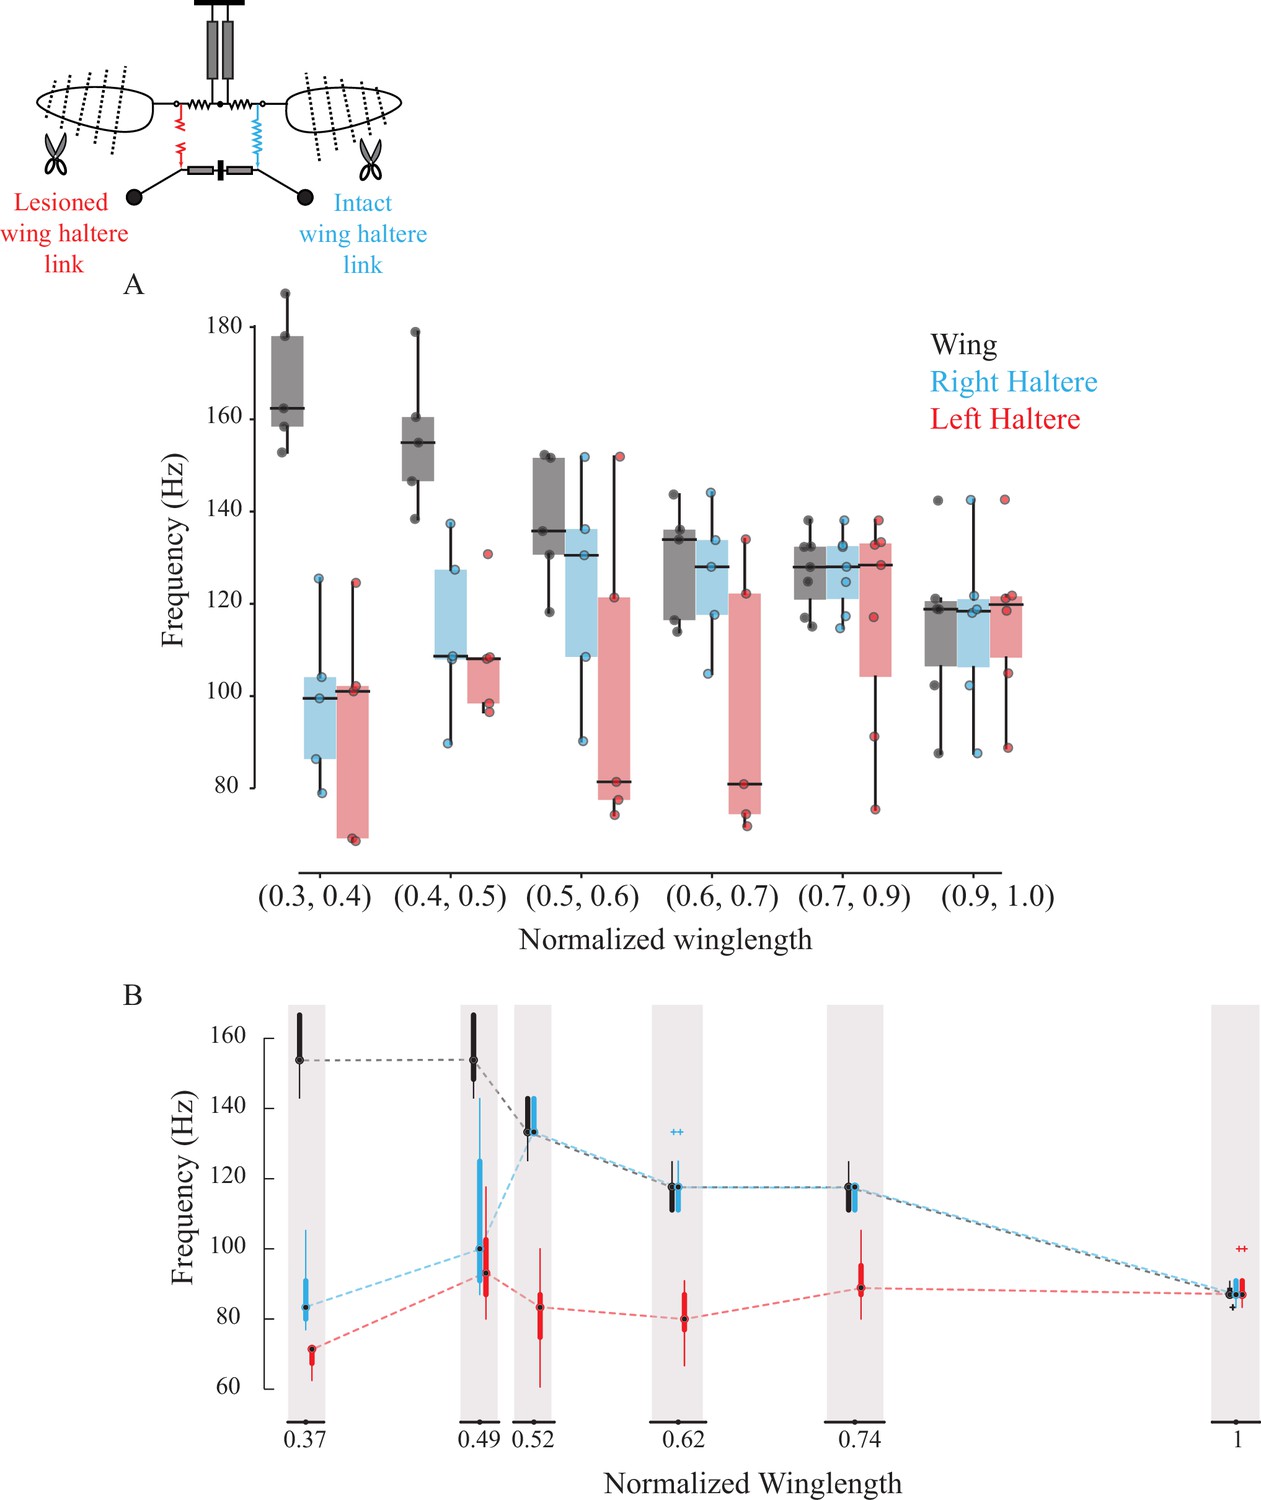
Sub-epimeral ridge couples the frequency of wings and halteres.
Frequency of wing (gray), control haltere (blue), and haltere with the sub-epimeral ridge lesioned (red) as a function of wing length across all flies (A) and one representative fly (B). Inset shows the schematic for treatments. Each dot in (A) is an individual fly. Additional data for individual flies can be found in Figure 3—figure supplement 1.
Figure 3—figure supplement 1
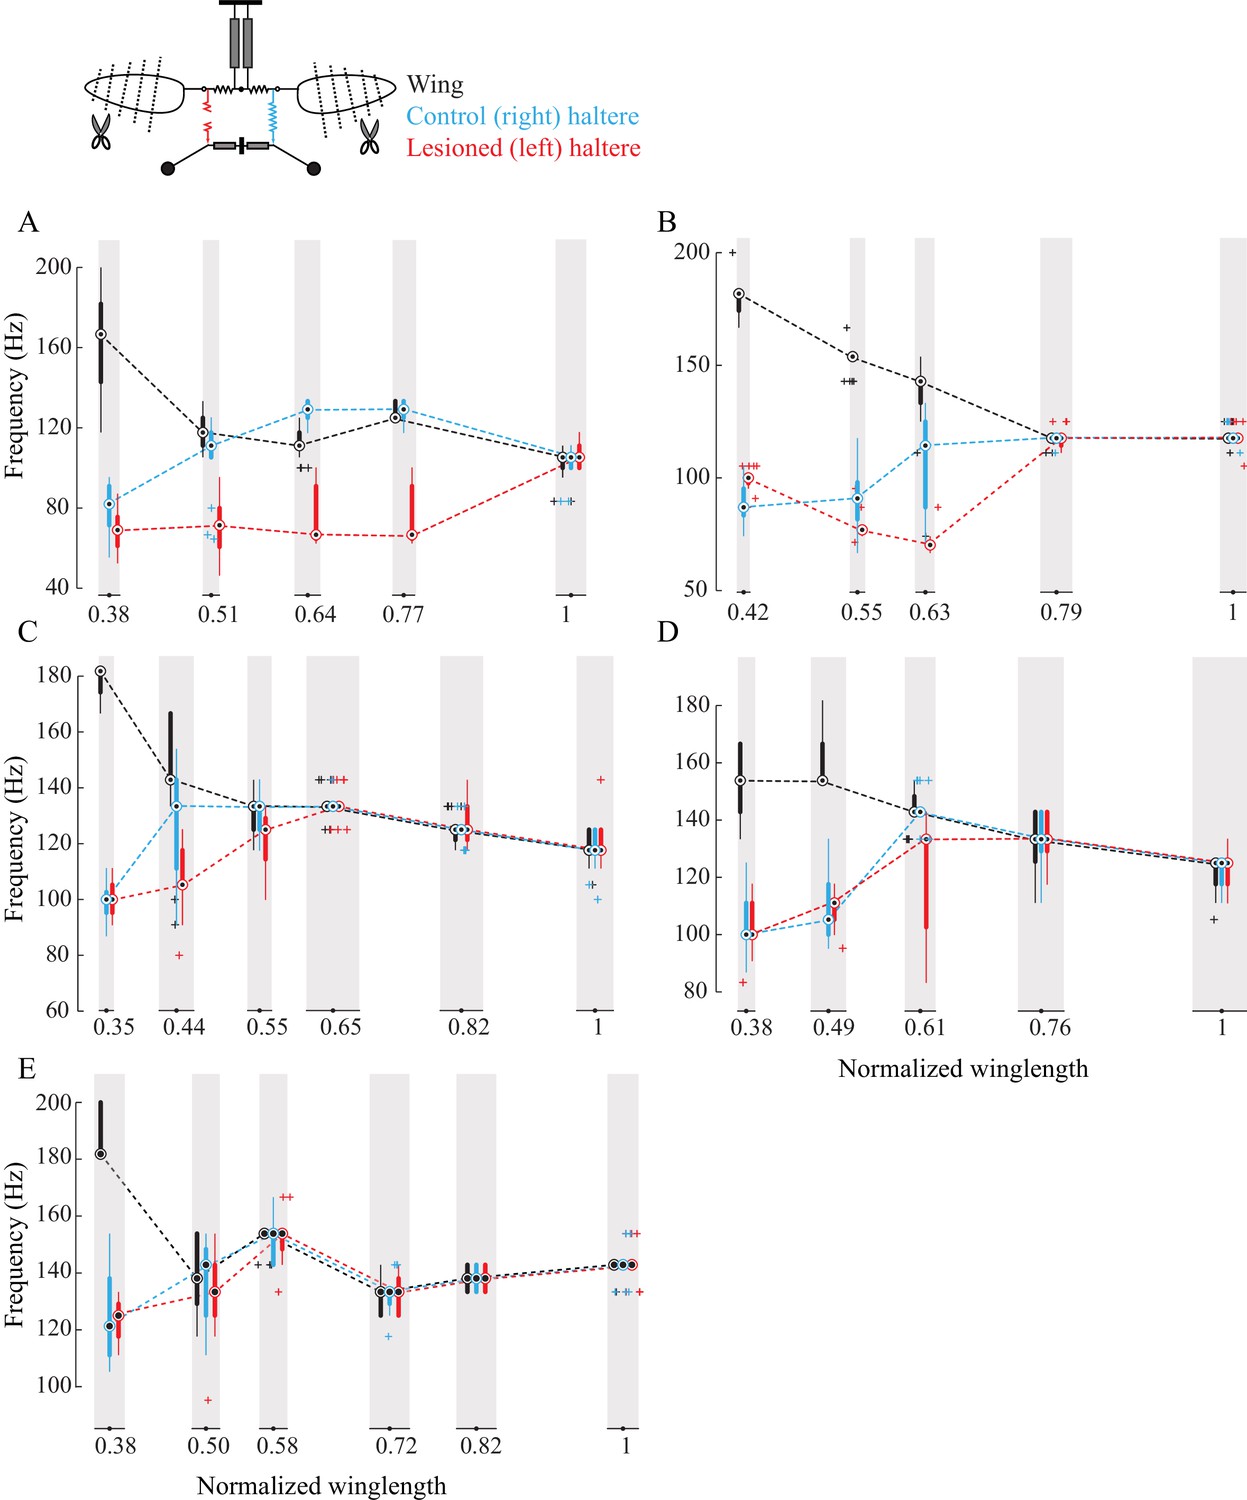
Sub-epimeral ridge couples the frequency of wings and halteres.
(A–E) Frequency of wing (black), control haltere (blue), and haltere with the sub-epimeral ridge lesioned (red) plotted as compact box plot as a function of wing length for five individual flies.
Figure 3—figure supplement 2
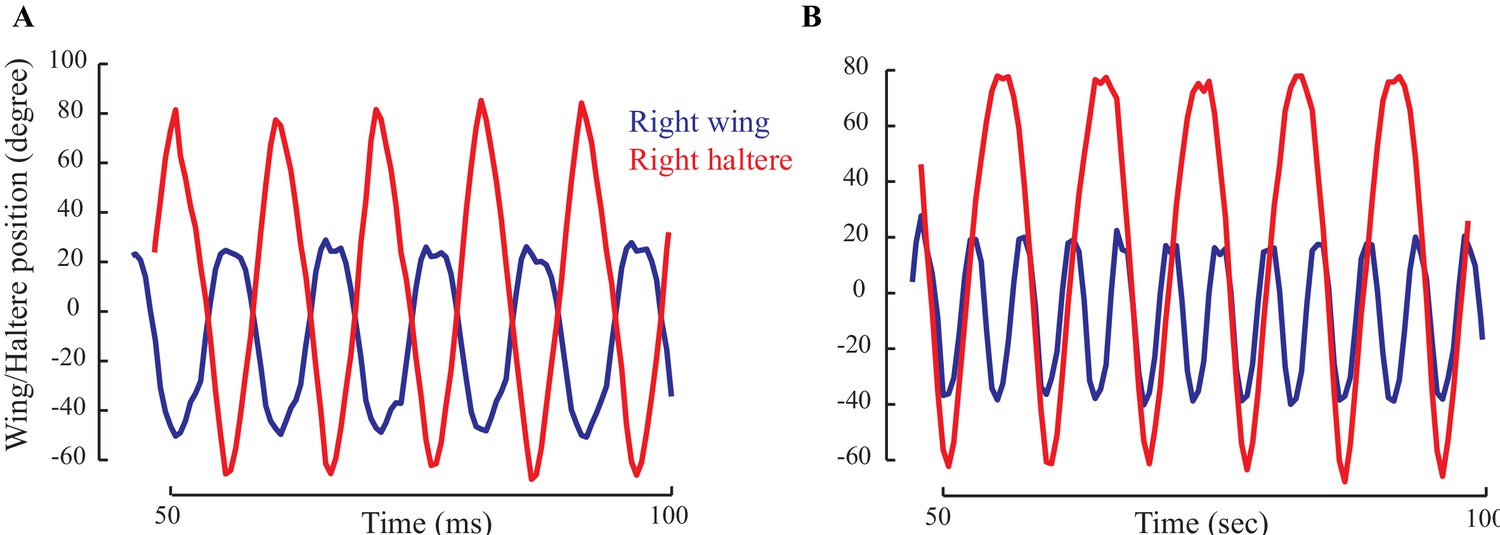
The positions of wing (blue) and haltere (red) showing their relative phase for a representative fly with intact wings (A) and wings cut (B).
(A) When the wing and haltere frequencies are matched, they are perfectly antiphase. (B) However, when the beat frequency increases, the haltere cycles through different phases relative to the wing.
Figure 3—video 1
Left and top views of the soldier fly with a severed left wing-haltere link (sub-epimeral ridge).
The left haltere flaps at lower frequency as compared to the symmetrically clipped wings and right haltere (Figure 3). Video captured at 2000 fps and played back at 10 fps.
Figure 4

Sub-epimeral ridge lesions alter the resonant properties of the thorax.
Individual box plots show the difference in wingbeat frequency between intact wing and at the shortest wing lengthin different treatment groups. Clipping wings of flies in which one or both sub-epimeral ridges are lesioned results in a smaller increase in wingbeat frequency as compared to flies with intact sub-epimeral ridges. In contrast, reducing wing length in flies in which both halteres are ablated increases wingbeat frequency significantly more than in flies with lesioned sub-epimeral ridges (p-value<0.05, non-parametric Kruskal–Wallis ANOVA followed by a Tukey–Kramer post hoc multi-comparison test, n; eight intact flies, six flies for the other three treatments). Insets under each group show the schematic for the four treatments: flies with an intact thorax, flies with one lesioned sub-epimeral ridge, flies with both sub-epimeral ridge lesioned and flies with both halteres ablated.
Figure 5 with 5 supplements
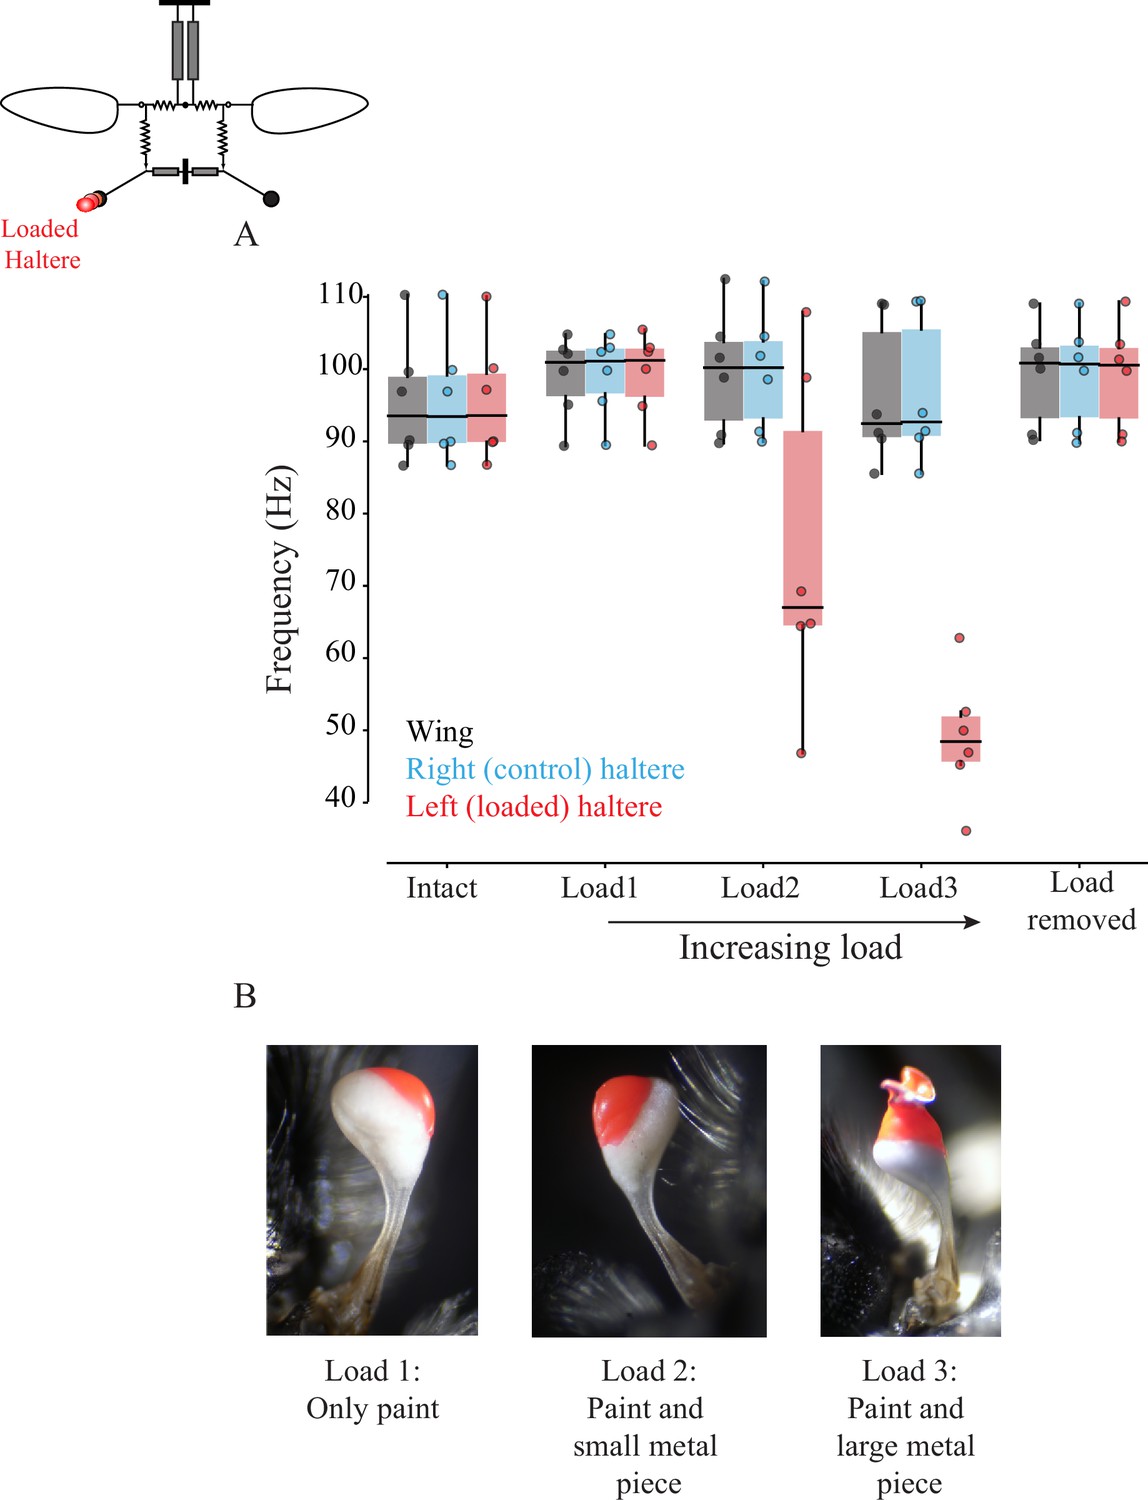
Wing-haltere linkage is unidirectional because changing haltere frequency does not alter wingbeat frequency.
(A) Frequency of wing (gray), control haltere (blue), and loaded haltere (red) across all flies. Each dot represents a single individual fly. The haltere frequency drops as the haltere is loaded but the wingbeat frequency remains unaltered, showing that wing-haltere coupling is unidirectional. Inset shows the schematic for the treatment. Data for individual flies can be found in Figure 5—figure supplement 2. (B) Representative images of the haltere loaded with different amounts of load (also see Figure 4).
Figure 5—figure supplement 1
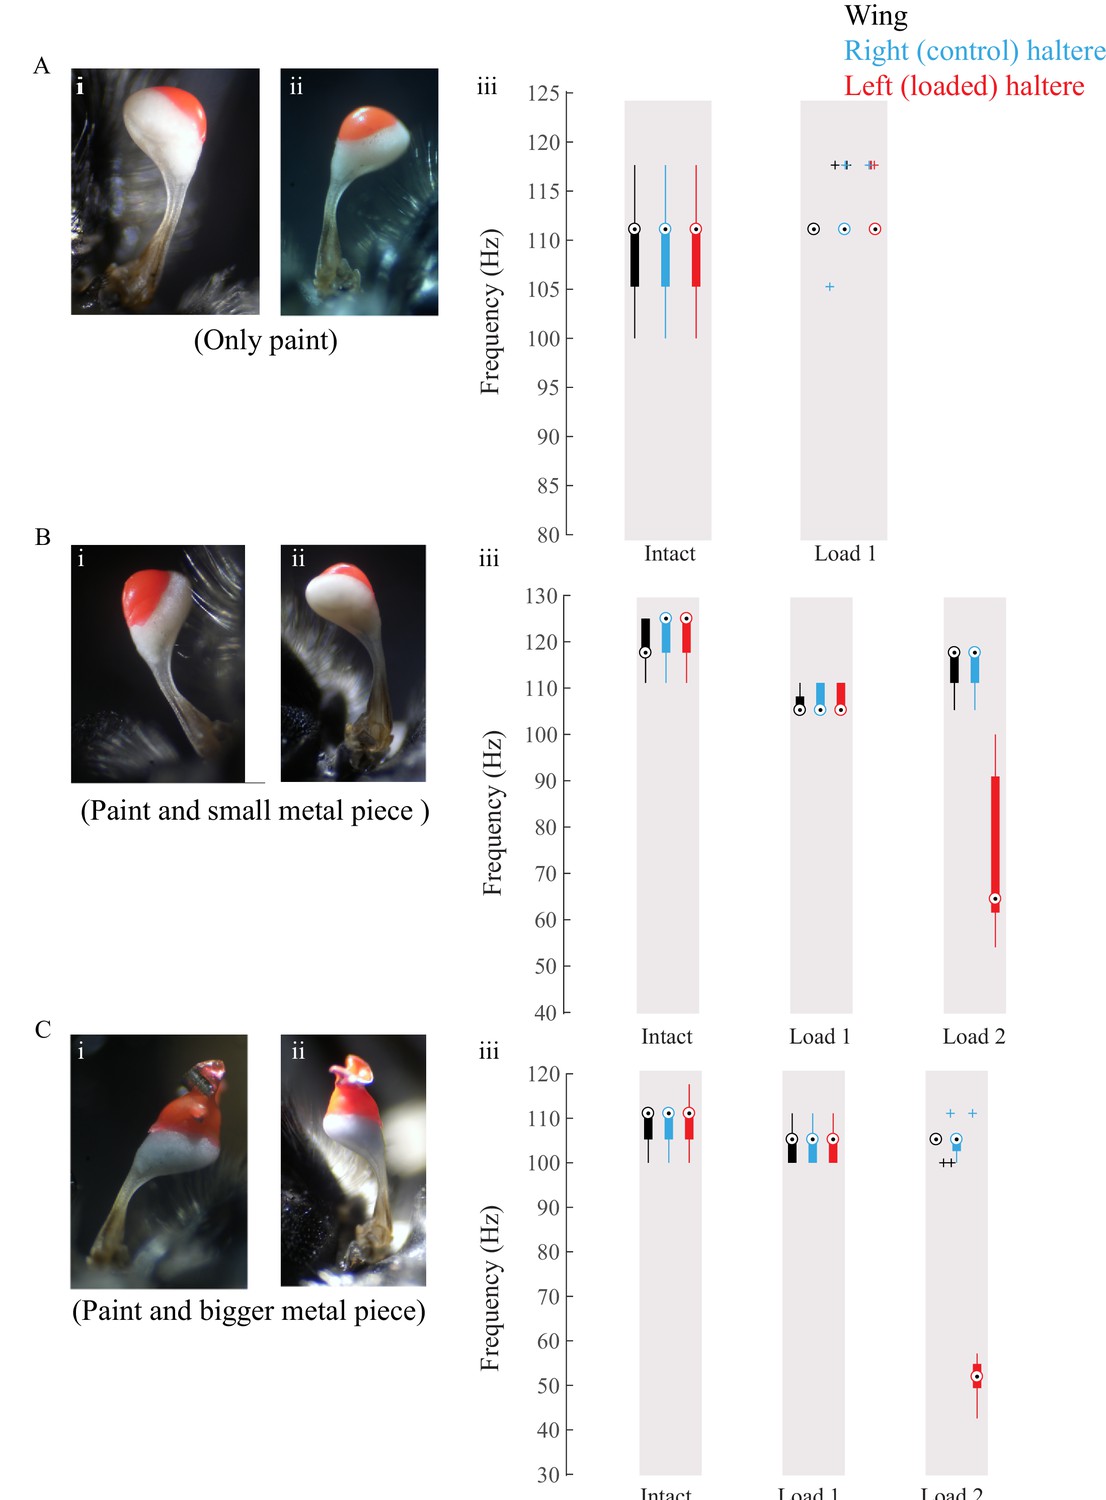
Increasing amounts of glue, paint, and metal shavings were added to load halteres.
(A–C) Data for individual flies showing loaded haltere (load visible in red) in the dorsal (i) and ventral (ii) views and the corresponding wing (black), control right haltere (blue), and loaded left haltere (red) frequency.
Figure 5—figure supplement 2
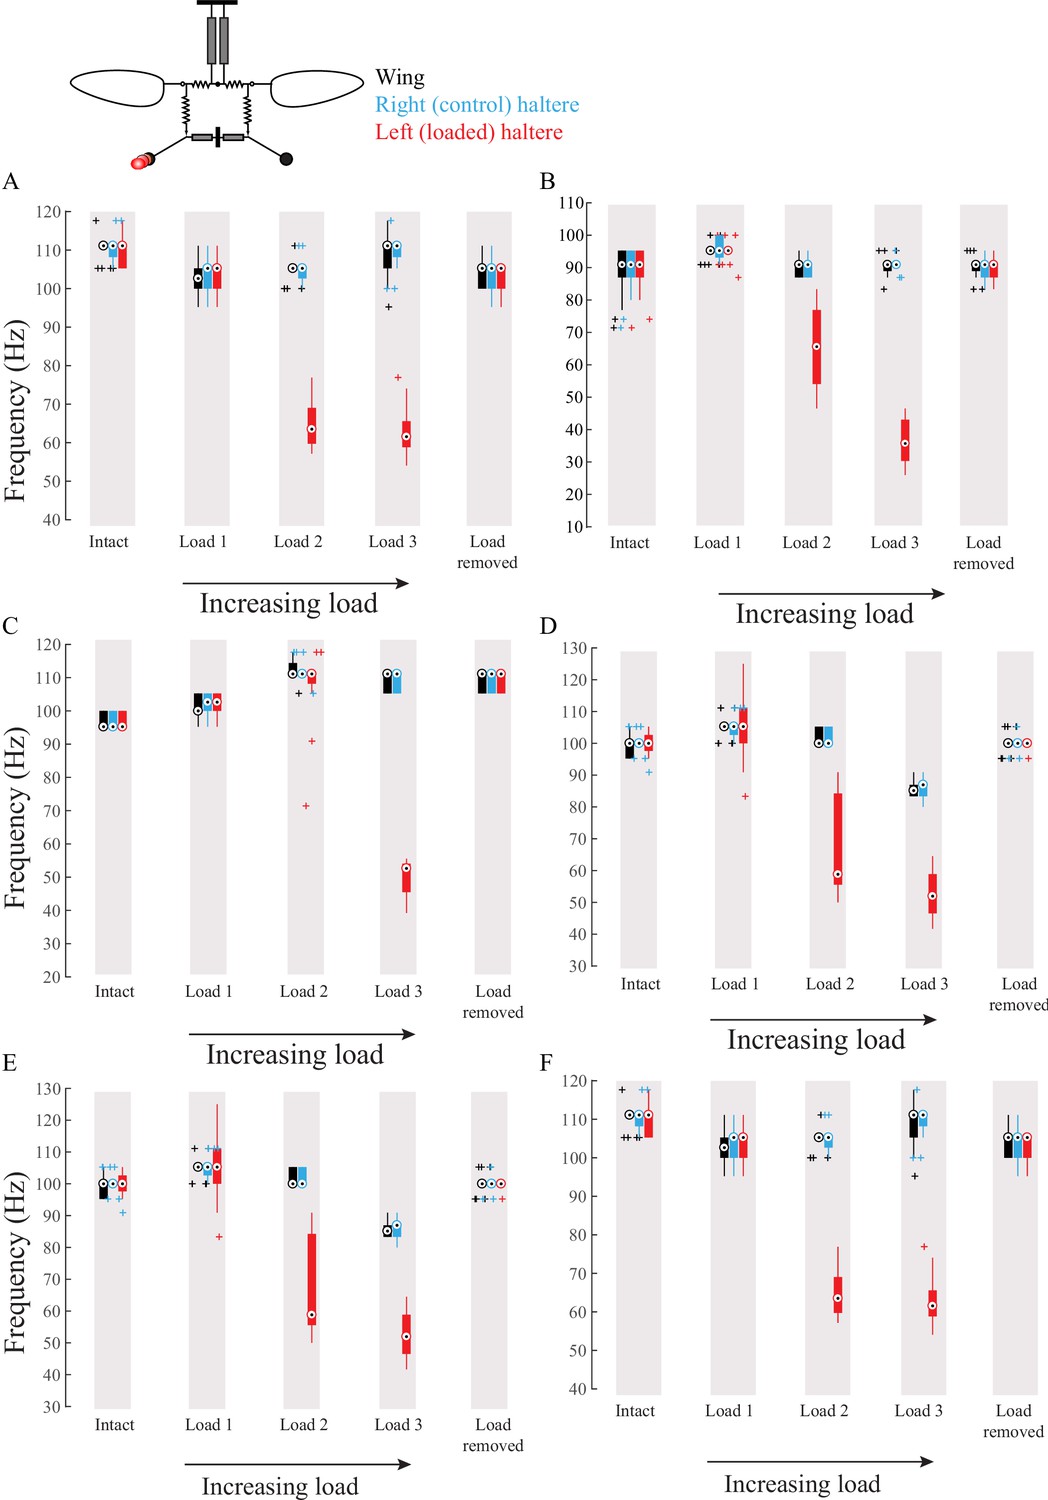
Wing haltere coupling acts unidirectionally such that changing haltere frequency does not influence wing frequency.
(A–F) Frequency of wing (black), control haltere (blue), and loaded haltere (red) plotted as compact box plot for six individual flies. The haltere frequency drops as the haltere is loaded but in the wing the frequency remains the same, showing that wings and halteres coupling works in a unidirectional manner.
Figure 5—figure supplement 3
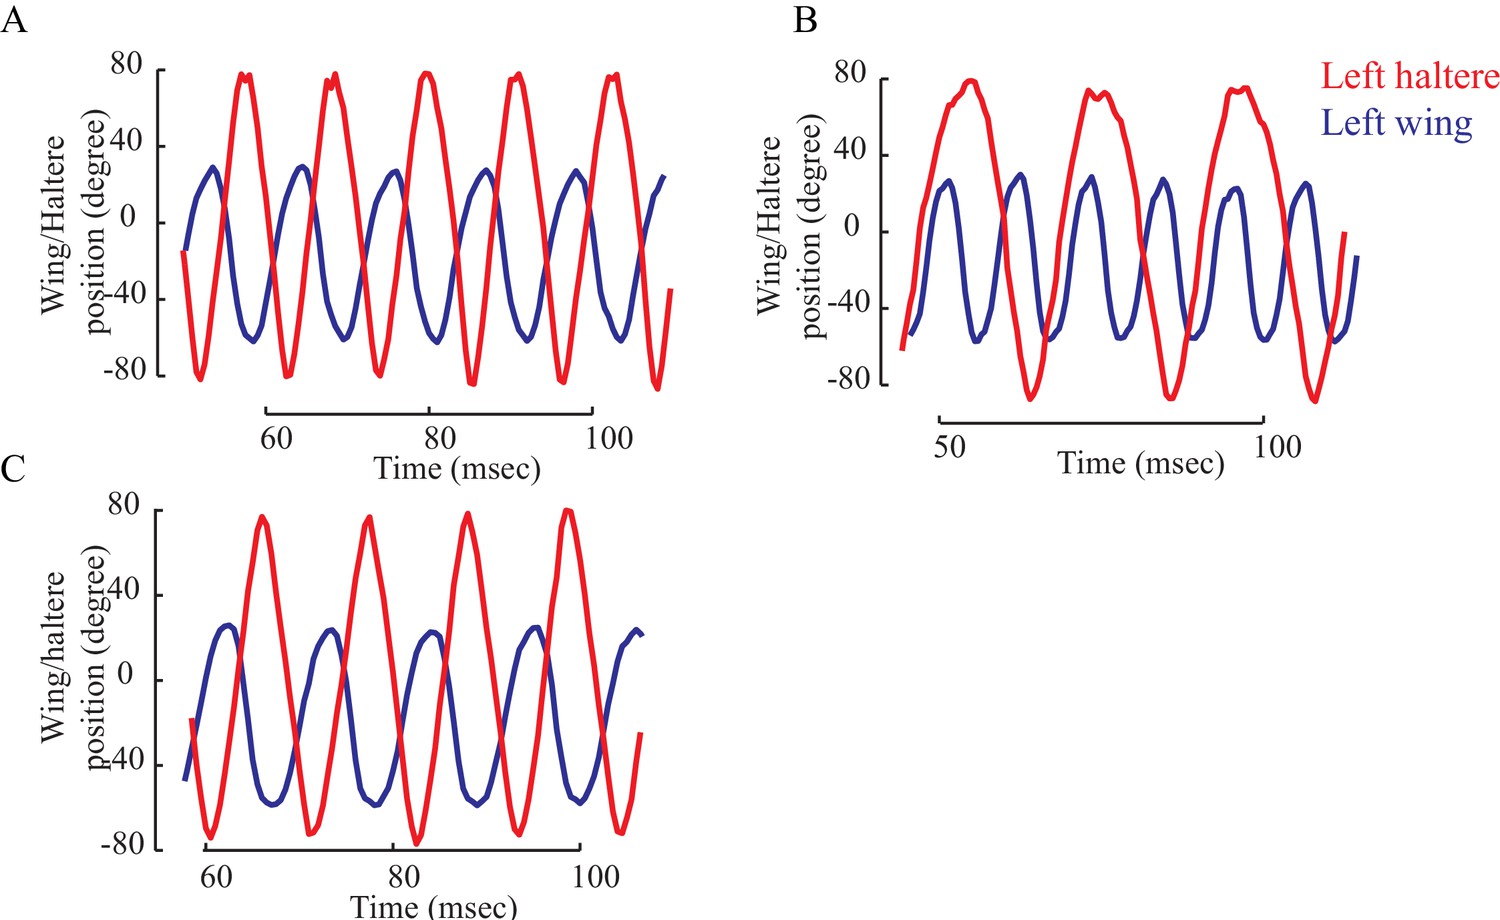
The wing (blue) and haltere (red) position showing their relative phase for a representative fly with intact halteres (A), loaded halteres (B), and the load removed (C).
(A) The wing and haltere oscillate antiphase when their frequencies matches (A, C), but haltere cycles through different phases relative to the wing when the haltere frequency drops.
Figure 5—figure supplement 4
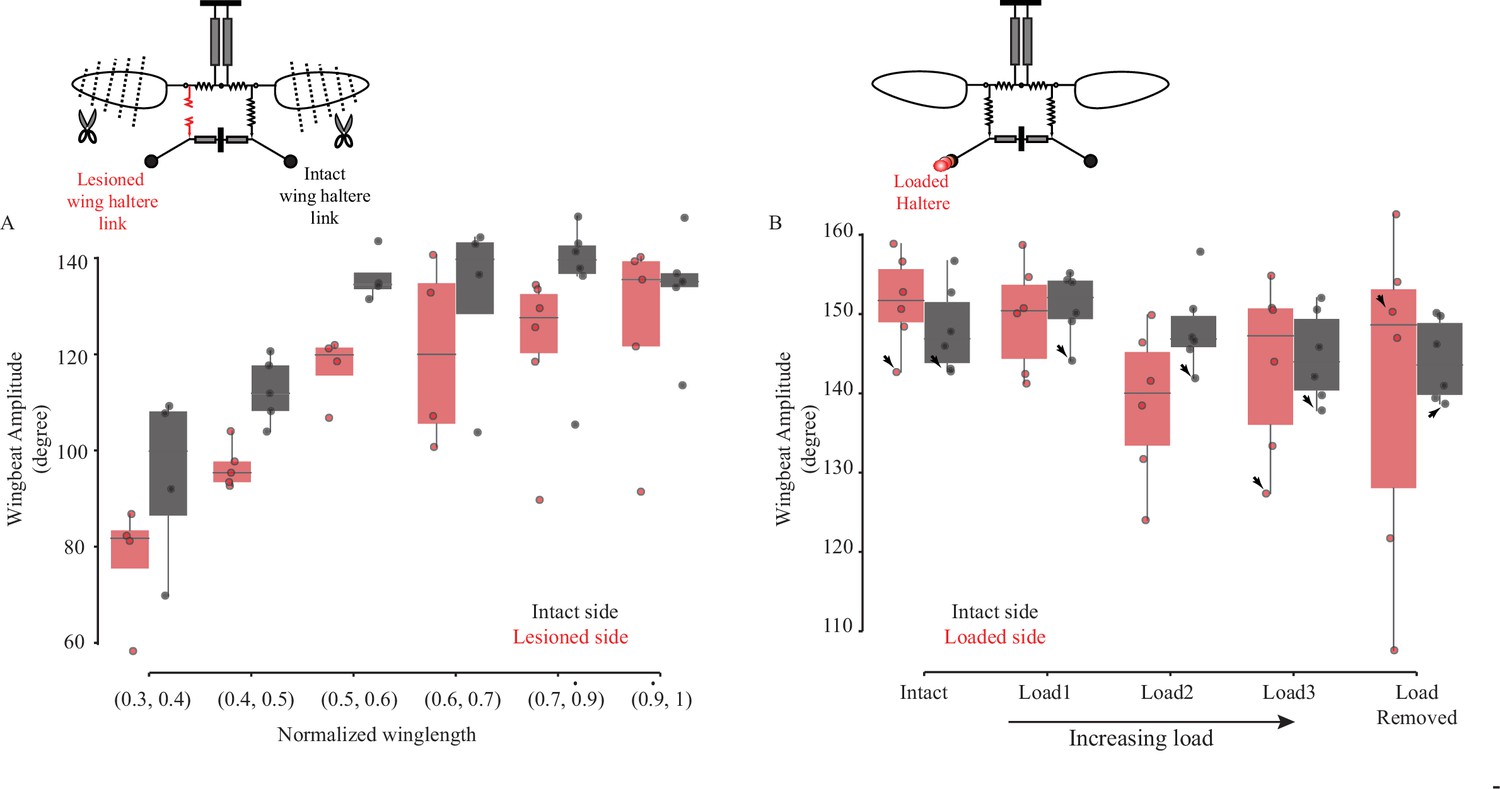
Aberrant haltere feedback causes reduction in wingbeat amplitude, although these results are not consistent across experiments.
Wingbeat amplitude for the contralateral, intact (black), and ipsilateral, lesioned-epimeral ridge (A, in red) or loaded haltere side (B, in red). Black arrows mark flight bouts where the fly legs physically limit wing downstroke by holding the leg near the wing base.
Figure 5—video 1
Top view of soldier fly with left haltere loaded.
The loaded haltere flaps at reduced frequency as compared to the wings and right haltere (Figure 5). Video captured at 2000 fps and played back at 10 fps.
Appendix 1—figure 1
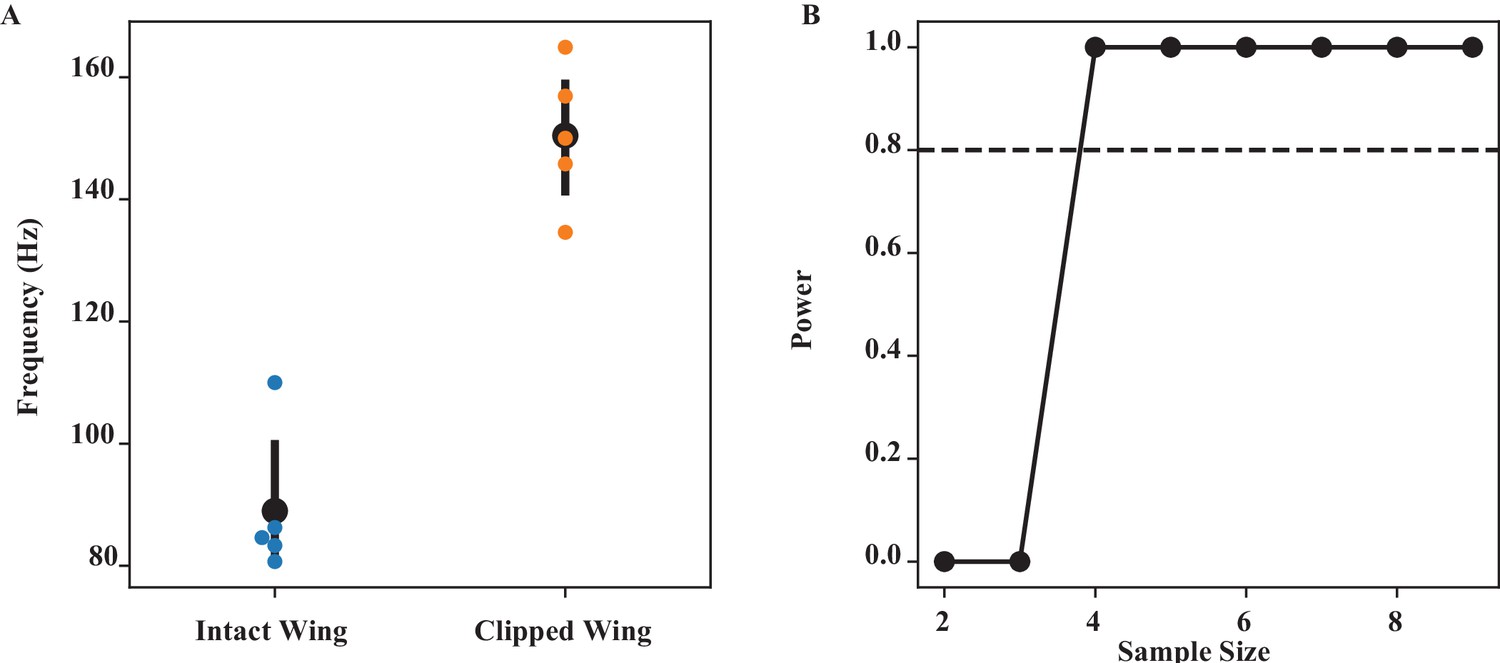
Wing coordination by scutellum (Figure 2).
(A) The frequency of intact and clipped wing (at the wing length that has the largest difference) is significantly different (Wilcoxon signed-rank test, p=0.0215). (B) Power analysis for different sample sizes. Our sample size of 5 is greater than the minimum sample size (= 4) needed to have 80% confidence level (dashed line).
Appendix 1—figure 2
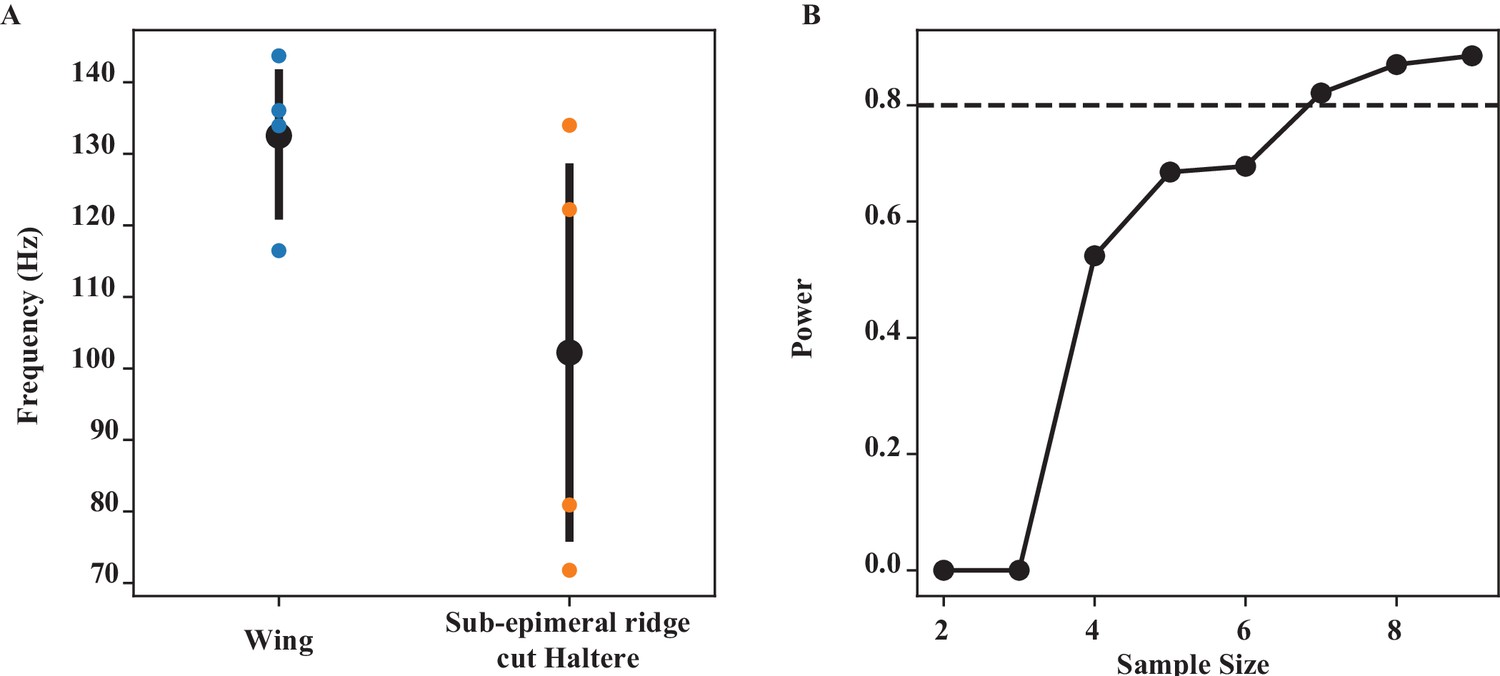
Wing-haltere coordination by sub-epimeral ridge (Figure 3).
(A) The frequency of wing and epimeral ridge cut haltere at wing length bin of (06–0.7), which has the largest difference, is significantly different (Wilcoxon signed-rank test, p=0.039). (B) Power analysis for different sample sizes. At our current sample size of 5 at that wing length, we have a power of 0.693, that is, we have a 69.3% chance of picking up a significant difference.
Appendix 1—figure 3

Loading haltere (Figure 5).
(A) The frequency of wing and loaded haltere at maximum loading (‘load3’) is significantly different (Wilcoxon signed-rank test, p=0.014). (B) Power analysis for different sample sizes. Our sample size of 6 is greater than the minimum sample size (= 4) needed to have 80% confidence level (dashed line).
Appendix 1—figure 4

Integrity of sub-epimeral ridge is essential for thoracic resonance (Figure 4).
For one-way Kruskal–Wallis test, our sample size n = 8 for control and 6 for the three treatments groups each. We used a similar bootstrapping method, simulating our data based on our group mean and SD, and calculating the power at difference sample sizes. To detect a significant difference at 80% chance, we require a minimum of nine samples. With our current sample size (n = 6), we have a substantial type II error: that is, a 42% chance of not detecting a difference if they were indeed different.
Additional files
-
Supplementary file 1
Tables of p-values for one-sided Wilcoxon signed-rank sum tests.
- https://cdn.elifesciences.org/articles/53824/elife-53824-supp1-v2.docx
-
Transparent reporting form
- https://cdn.elifesciences.org/articles/53824/elife-53824-transrepform1-v2.pdf
Download links
A two-part list of links to download the article, or parts of the article, in various formats.
Downloads (link to download the article as PDF)
Open citations (links to open the citations from this article in various online reference manager services)
Cite this article (links to download the citations from this article in formats compatible with various reference manager tools)
Wings and halteres act as coupled dual oscillators in flies
eLife 10:e53824.
https://doi.org/10.7554/eLife.53824


