Cancer systems immunology
- Department of Pathology, Stanford University School of Medicine, United States
- Division of Immunology and Rheumatology, Department of Medicine, Stanford University School of Medicine, United States
- Stanford Cancer Institute, Stanford University, United States
Figures
Figure 1
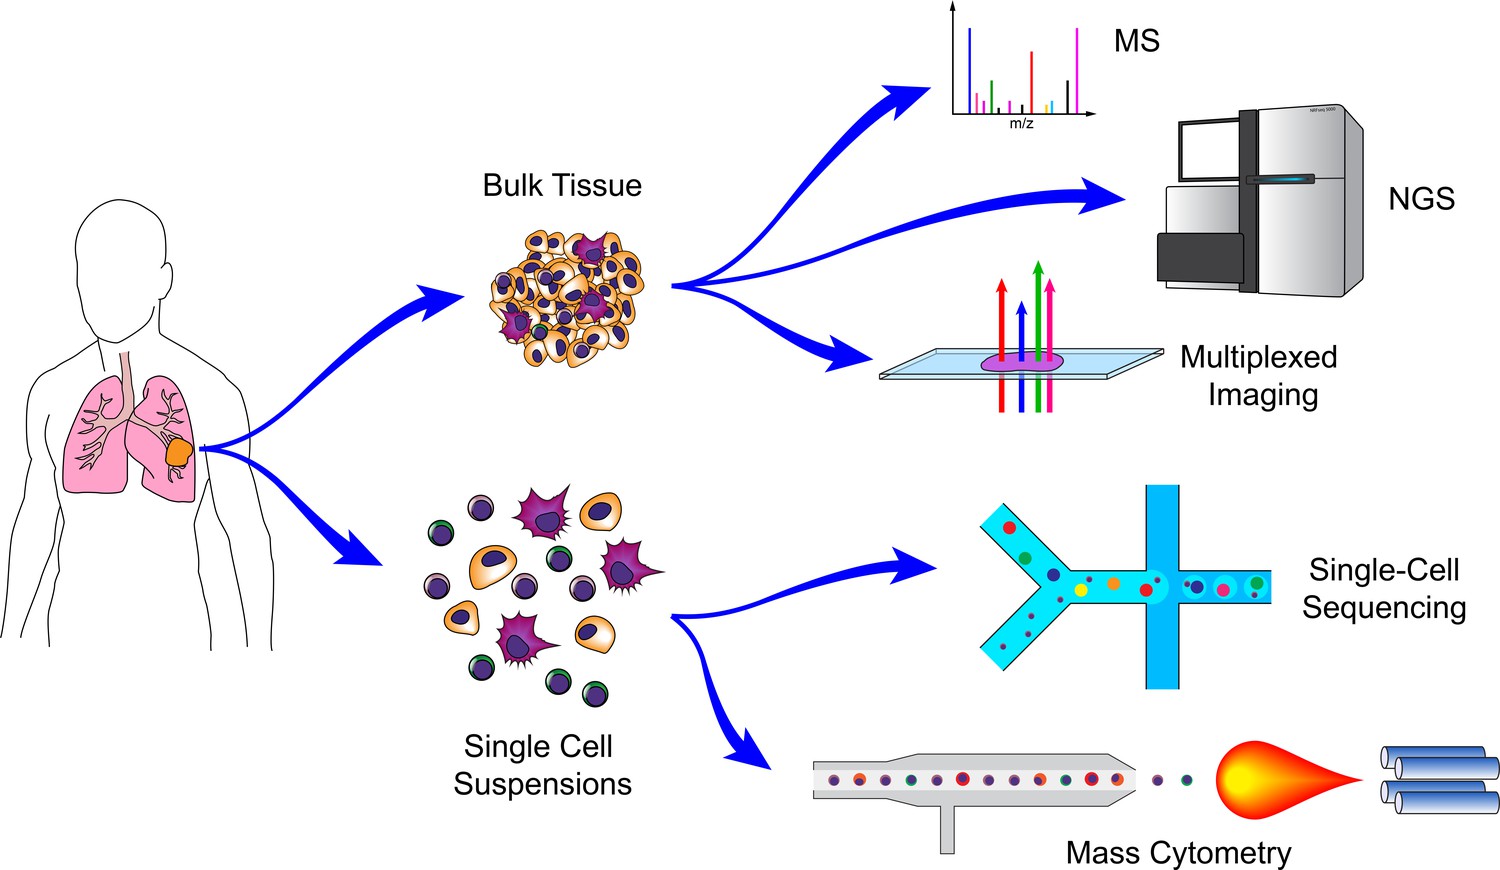
Technologies for cancer systems immunology.
Technologies used in cancer systems immunology operate either on bulk tissue samples or single-cell suspensions. Conventional MS, NGS, and imaging platforms do not require tissue dissociation (although histology provides single-cell resolution). Droplet-based microfluidics and mass cytometry, in contrast, require cell suspensions, but generate high-dimensional data for individual cells.
Figure 2
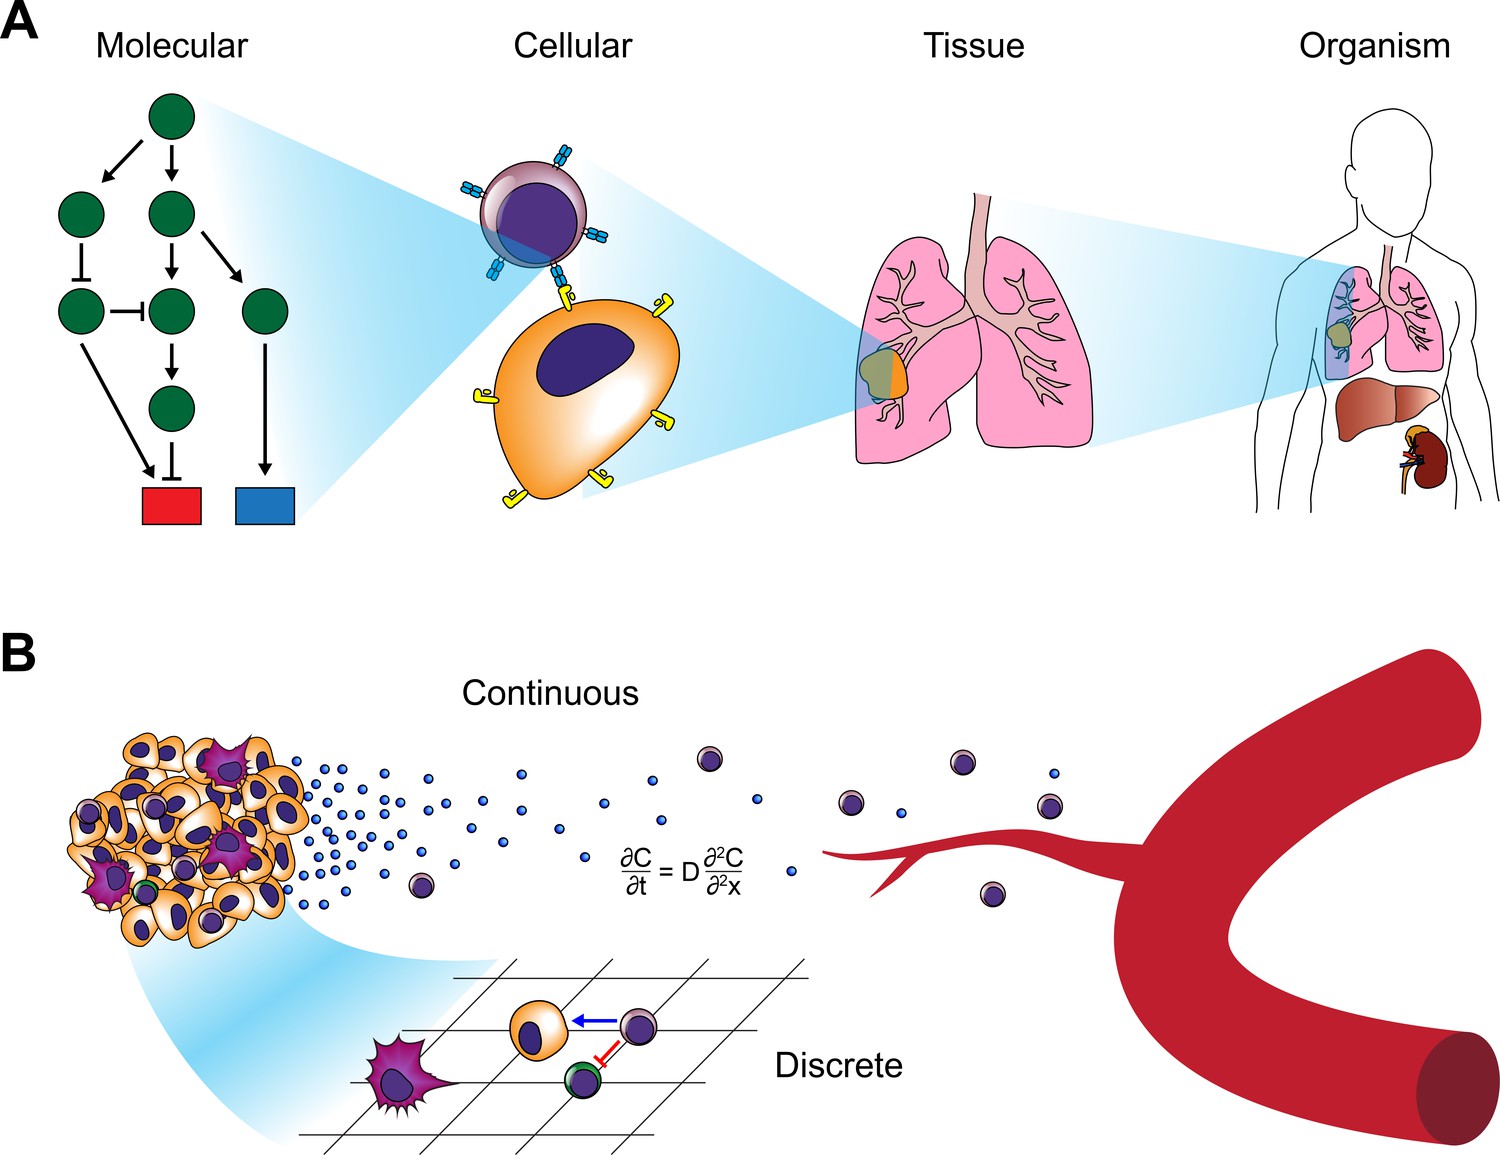
Modeling approaches for cancer systems immunology.
(A) Modeling approaches used in cancer systems immunology operate within or across multiple scales in order to describe how tumors interact with the immune system. (B) Hybrid models, in particular, combine continuous models (e.g. differential equations) with discrete models (e.g. CA or ABM).
Figure 3
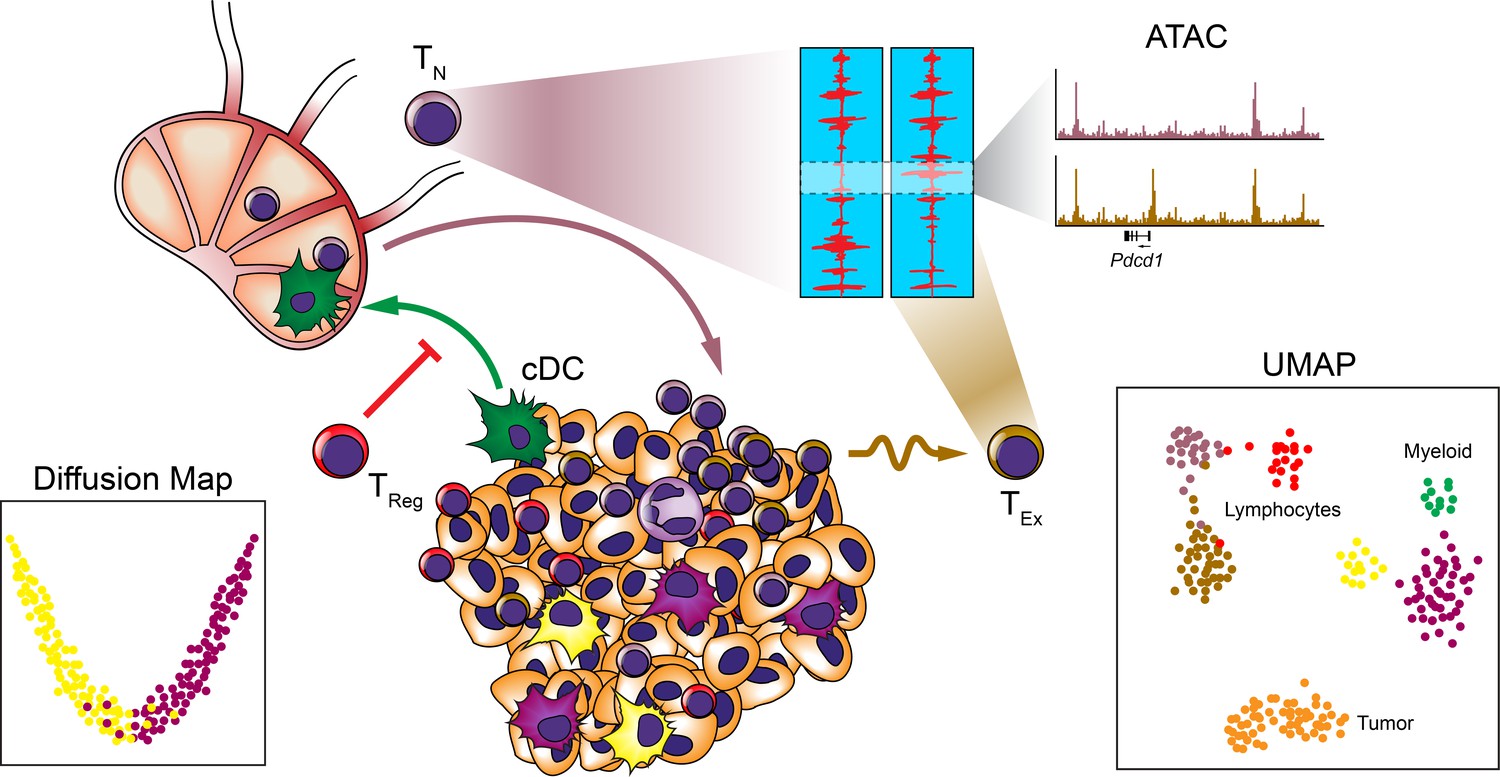
Systems approaches to the TME.
Many systems approaches have been applied to analyzing the TME to reveal the cellular makeup and relationships between immune cells at the single-cell level. Studies have revealed heterogeneity among myeloid and lymphocyte populations, trafficking of cDC subsets to the draining LNs, and epigenetic exhaustion profiles of T cells infiltrating tumors following ICB.
Figure 4
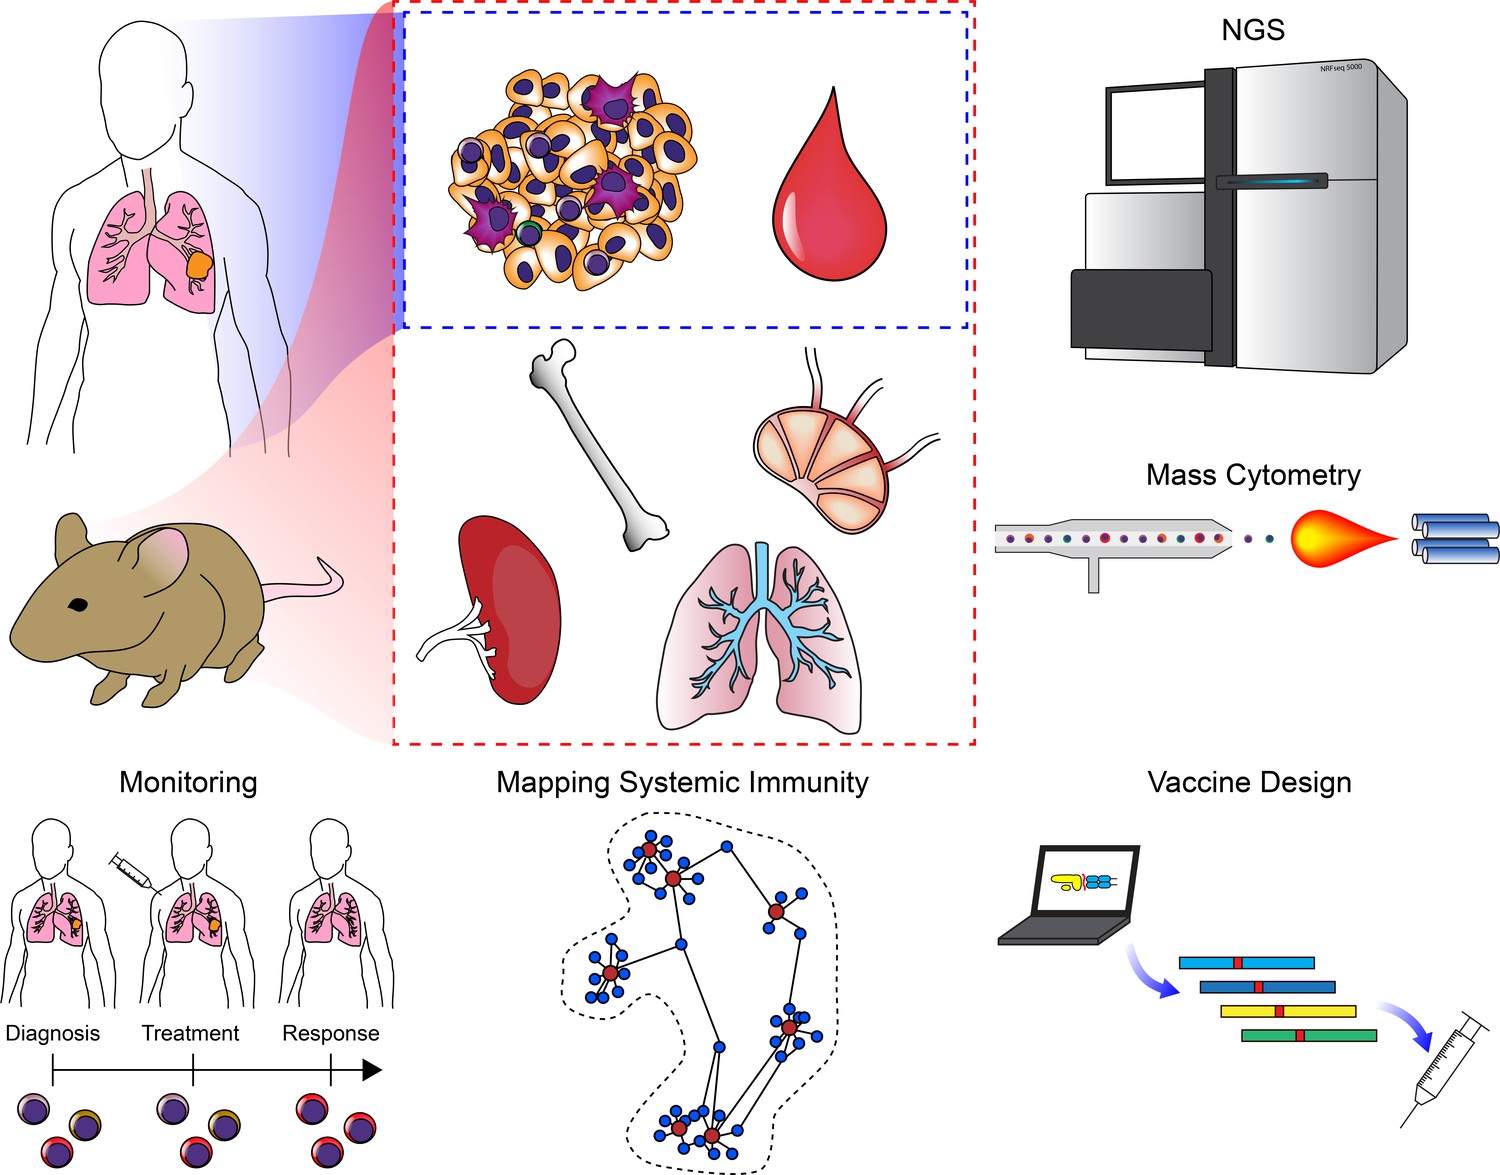
Clinical applications of cancer systems immunology.
Tumor and peripheral blood samples are frequently harvested from patients in a longitudinal fashion. Model organisms such as mice enable researchers to query as many tissues as desired. These samples can be subjected to high-dimensional analysis platforms such as various NGS modalities or mass cytometry. Results from these analyses have been used to monitor responses to ICB (including immune repertoire analysis), mapping changes in the immune system across an organism, and for the design of personalized neoantigen vaccines.
Tables
Table 1
Genomic and transcriptomic profiling technologies.
| Measurement | DNA | DNA | DRNA/RNA | RNA | RNA |
|---|---|---|---|---|---|
| Technology | WGS | WES | Amplicon (e.g. TCR, BCR, specific loci) | RNA-seq | Microarray |
| Strengths | • Captures coding and non-coding regions • may be more accurate in some exons as well • better coverage in low-complexity regions • no PCR step required | • Reduced cost of sequencing since restricted to 2% of genome | • Lower cost • greater sequencing depth | • Not limited to known genes with probes • can identify splice variants • can include ncRNA • can identify sequence variations (e.g. mutations) | • Can theoretically detect very low abundance transcripts at no additional cost |
| Weaknesses | • High cost | • Does not capture non-coding regions • may fail to capture some coding regions depending on probe hybridization • GC bias can be introduced due to PCR • hybridization bias can occur in regions with heterozygous SNVs | • Limited to specific regions (not genome-wide) | • Sequencing depth can limit the ability to detect low-abundance transcripts | • Probe bias • inability to compare relative abundance across genes • limited to known transcripts (for which there are probes) |
| Single-cell Version? | Y | Y | Y | Y (see Table 3) | Y* (very uncommon, Esumi et al., 2008) |
Table 2
Epigenetic profiling technologies.
| Measurement | Technology | Strengths | Weaknesses | Single-cell version? |
|---|---|---|---|---|
| Methylation | WGBS | • No a priori sequence selection | • High cost and may require higher coverage • cannot distinguish type of modification at cytosines | Y |
| Methylation | RRBS | • Lower cost | • Limited mainly to CpG islands • cannot distinguish type of modification at cytosines | Y |
| Protein Localization | ChIP-seq | • Genome-wide profiling of histone modifications and DNA-protein interactions (Histone H3 acetylation/methylation, TF binding site identification, SE identification) | • Survey only one type of interaction (protein) at once • lots of sources of noise/bias • requires good antibodies • requires input DNA and isotype controls • requires large input of cells | Y |
| Protein Localization | CUT&RUN | • Fewer input cells required than ChIP • less noise • fewer sequencing reads required • no cross-linking required | • Requires good antibody • potential for overdigesting DNA | Y (CUT&Tag, uliCUT&RUN) |
| Chromatin Accessibility | DNAse-seq | • Identify a range of cis and trans regulatory elements including TF binding sites | • High input cells requirement • more time-consuming that ATAC • sequence bias | Y |
| Chromatin Accessibility | ATAC-seq | • Identify a range of cis and trans regulatory elements including TF binding sites • minimal input cells required • increased sensitivity over DNAse-seq • simple protocol | • Footprint profiles can be less well-defined than DNAse-seq • potential mitochondrial DNA contamination | Y |
| Chromatin Accessibility | MNAse-seq | • Nucleosome occupancy and positioning • can be used to predict higher-order structure (e.g. 3D) | • Requires crosslinking • highly dependent on enzyme concentration • some sequence bias | Y |
| Chromatin Accessibility | FAIRE-seq | • No sequence bias • simple protocol • no enzymes required | • Requires crosslinking • lower resolution (crosslinking binds chromatin but also TFs) • large input cell requirement | N |
| 3D Conformation | 3C (Chromosome Conformation Capture) | • Identify single chromosomal interaction (one vs. one) | • limited resolution (by 6bp cutters) • laborious • PCR biases • high library complexity • single viewpoint | N |
| 3D Conformation | 4C (Circular 3C) | • Improved resolution over 3C • can identify very long range interactions • can identify all contacts for a locus (one vs. all) | • Biases from circularization • PCR biases • high input cell requirements • single viewpoint | N |
| 3D Conformation | 5C (3C Carbon Copy) | • Can identify many contacts for multiple loci (many vs. many) | • Bias introduced by probe ligation efficiencies • not all fragments can bind probes • all vs. all prohibitively expensive | N |
| 3D Conformation | NG Capture-C | • Analyze hundreds of viewpoints • can identify PCR duplicates (low bias) • highest sensitivity and resolution • fewer input cells required | • Occasional non-specific interactions | N |
| 3D Conformation | Hi-C | • Maps contacts across whole genome (all vs. all) • kilobase resolution | • Fewer contacts per fragment than 4C or Capture-C • higher resolution versions require extremely high sequencing depths | Y |
| 3D Conformation and Protein Localization | ChIA-PET | • Combines 3D interactions with protein interactions | • Interactions defined by few reads • high input requirements • bias toward interactions with targeted protein | Y* (ChIA-Drop: single molecule, Zheng et al., 2019) |
| 3D Conformation and Protein Localization | Hi-ChIP (and PLAC-seq) | • Lower input required • higher yield than ChIA-PET • higher signal to noise over Hi-C | • Bias toward interactions with targeted protein | N |
Table 3
scRNA-seq Technologies.
| Strengths and weaknesses of the ever-evolving compendium of scRNA-seq technologies and analysis packages have been evaluated reviewed extensively in Ziegenhain et al., 2017; Chen et al., 2019a; Haque et al., 2017. Here, we provide a basic overview of the strengths of the general approaches. | |||
|---|---|---|---|
| Technology | Plate-based (e.g. Smart-seq2, MARS-seq) | Microfluidic capture (e.g. C1, Seq-well, CEL-seq2/C1) | Droplet (e.g. 10X, Drop-Seq) |
| Strengths | • Highest sensitivity (number of genes detected) • fewer multiplets • full-length transcripts possible | • High sensitivity (number of genes detected) • fewer multiplets • no sorting required | • Inexpensive (per cell) • profile high numbers of cells • can identify less frequent cell types • no sorting required • Can use UMIs |
| Weaknesses | • Requires sorting • low throughput • high cost per cell • not strand specific | • 3' Only • limited cell numbers • (typically) not strand-specific | • 3' Only • fewer genes/UMIs • more dropout |
Download links
A two-part list of links to download the article, or parts of the article, in various formats.
Downloads (link to download the article as PDF)
Open citations (links to open the citations from this article in various online reference manager services)
Cite this article (links to download the citations from this article in formats compatible with various reference manager tools)
Cancer systems immunology
eLife 9:e53839.
https://doi.org/10.7554/eLife.53839


