Tuning of feedforward control enables stable muscle force-length dynamics after loss of autogenic proprioceptive feedback
- Comparative Biomedical Sciences, Royal Veterinary College, University of London, United Kingdom
- Evolution, Ecology & Organismal Biology, University of California, Riverside, United States
- Organismic and Evolutionary Biology, Harvard University, Cambridge, United States
- Ecology and Evolutionary Biology, University of California, Irvine, United States
Figures
Figure 1
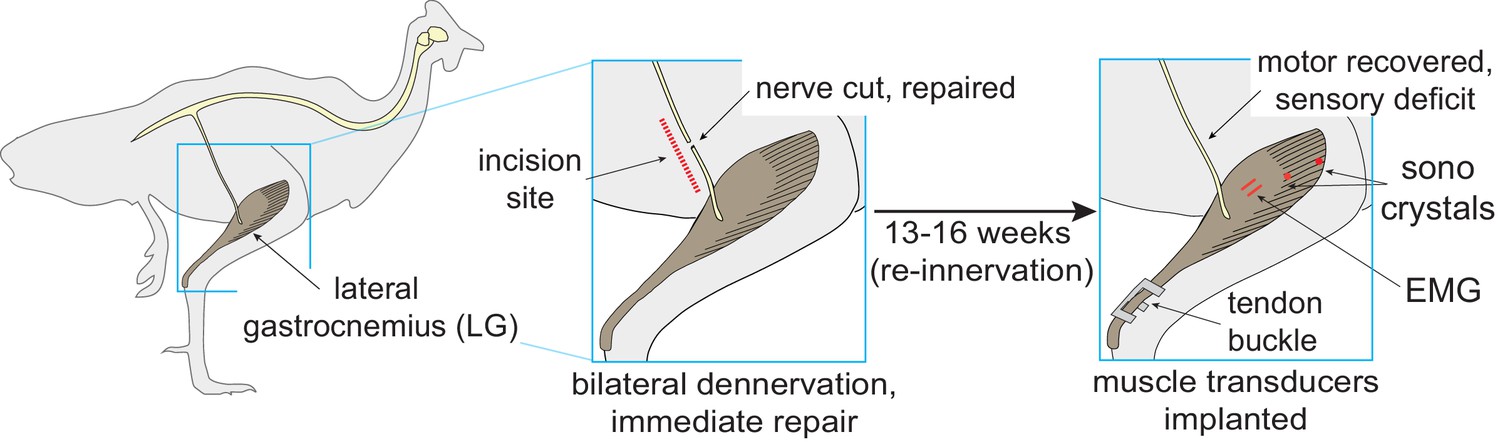
Reinnervation protocol.
Procedure for bilateral self-reinnervation of the lateral gastrocnemius (LG), followed by transducer implantation for in vivo recordings of muscle force (tendon buckle), fascicle length (sonomicrometry crystals) and electromyographic activity (EMG).
Figure 2 with 1 supplement
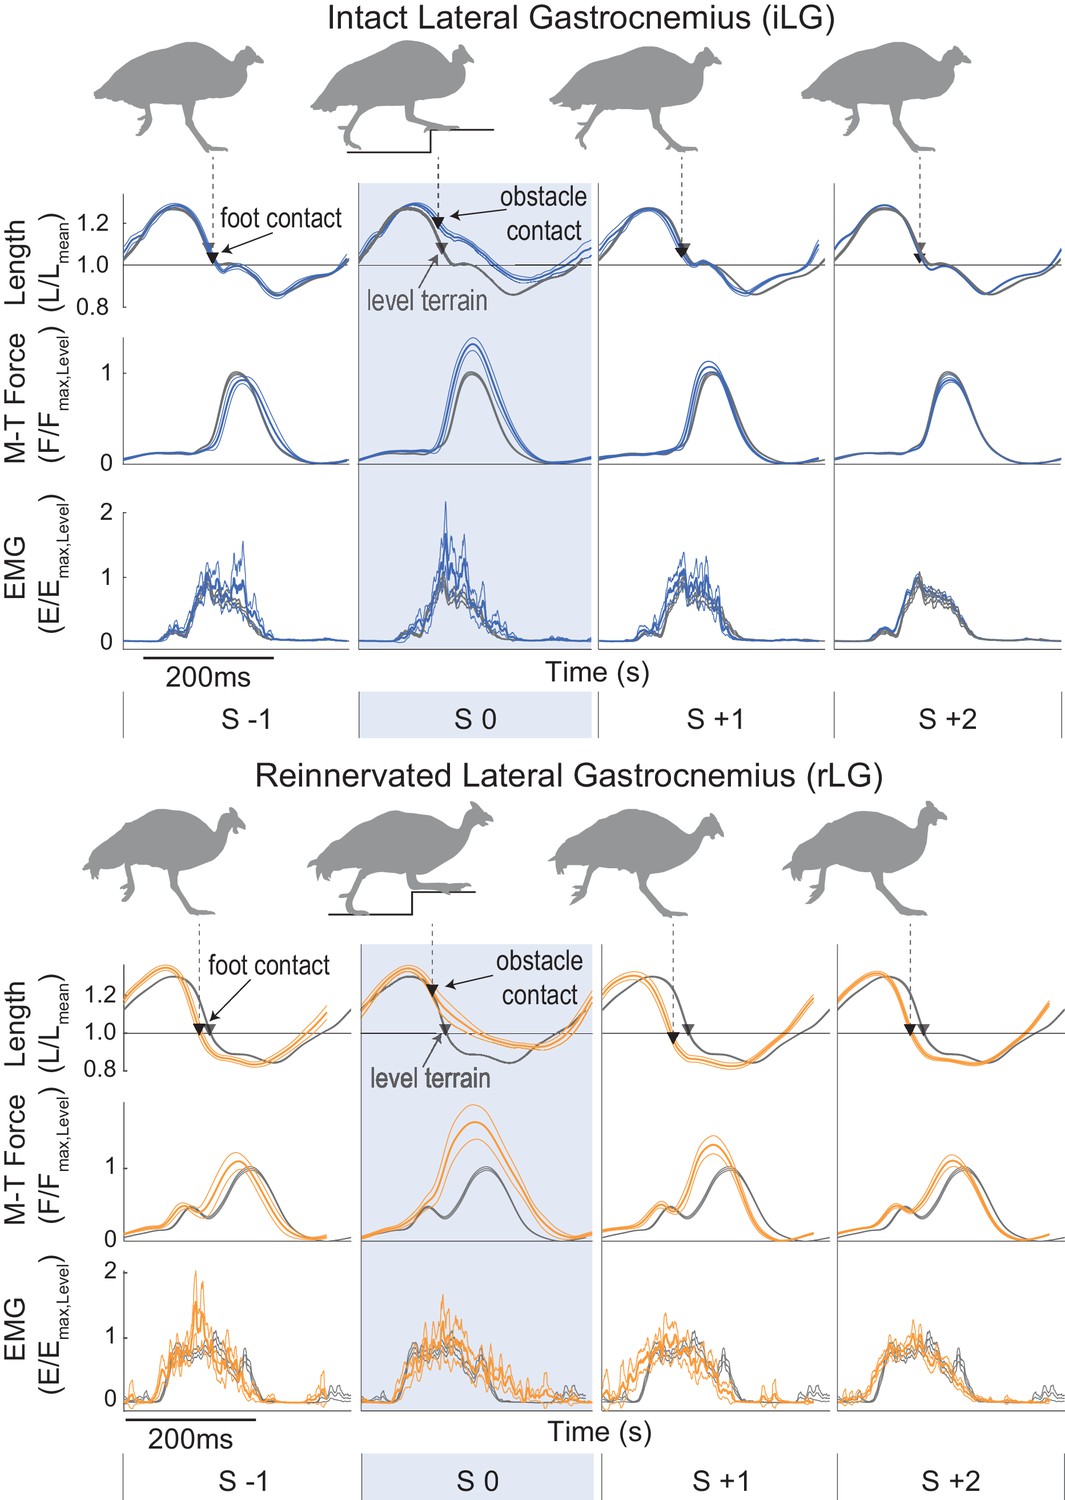
Muscle trajectories during obstacle negotiation for intact and reinnervated lateral gastrocnemius (iLG: blue, top, rLG: orange, bottom).
Stride cycle averages are shown, from mid-swing to mid-swing (mean ± 95% ci) for a 4-stride sequence in obstacle terrain, with steady level terrain means as a reference, in grey. The shaded box is an obstacle encounter (S 0). Obstacle terrain strides are coded as in Daley and Biewener, 2011, for strides preceding (S −1), on (S 0) and following obstacle contact (S +1), with S +2 including all other strides between obstacles. Trajectories are fractional muscle fascicle length (top), muscle-tendon force (middle) and rectified myoelectric activity (EMG). Triangles indicate the timing of foot-ground contact (grey: level terrain, black: obstacle terrain). Example data is shown from one individual in each treatment cohort. See Figure 2—figure supplement 1 for details on stride-cycle cutting and categorization in an example stride sequence in obstacle terrain.
Figure 2—figure supplement 1
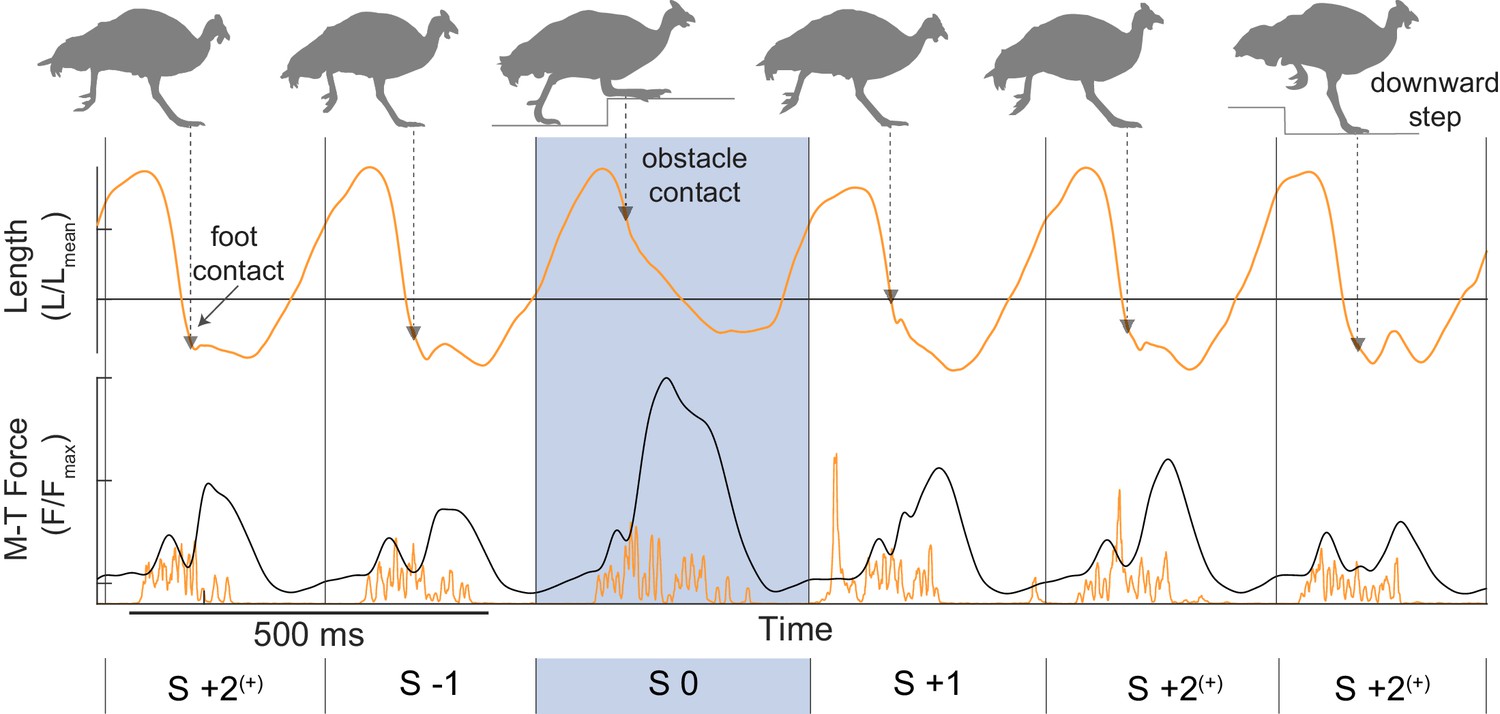
Example 6-stride sequence of in vivo muscle recordings of the reinnervated lateral gastrocnemius (rLG) in the right leg, running at 1.7 ms−1 on the obstacle treadmill.
Muscle length (top, orange), force (bottom, black) and activation (rectified EMG, bottom, orange) are shown, with triangles indicating the time of foot-ground contact, a shaded box indicating an obstacle encounter stride (S 0), and vertical lines indicating the mid-swing cut points between stride cycles. Stride categories were identified from video. Grey silhouettes at the top illustrate the leg posture at the time of foot contact. Strides cycles were cut based on a minimum in muscle-tendon force after it was low-pass filtered with a 6th order Butterworth filter with a cutoff frequency of 3.4 Hz. This resulted in a sinusoidal trajectory with a mid-swing minimum, which was confirmed against video to correspond to when the swing leg crossed vertical. Note that between the last two strides, the contralateral leg stepped on the obstacle, leading to a downward step of the instrumented leg in the final stride. For simplicity, these strides are group with the ‘mid-flat’ strides S+2 (as in Daley and Biewener, 2011) because the focus of the current analysis is the direct response to the obstacle encounter (S 0).
Figure 3
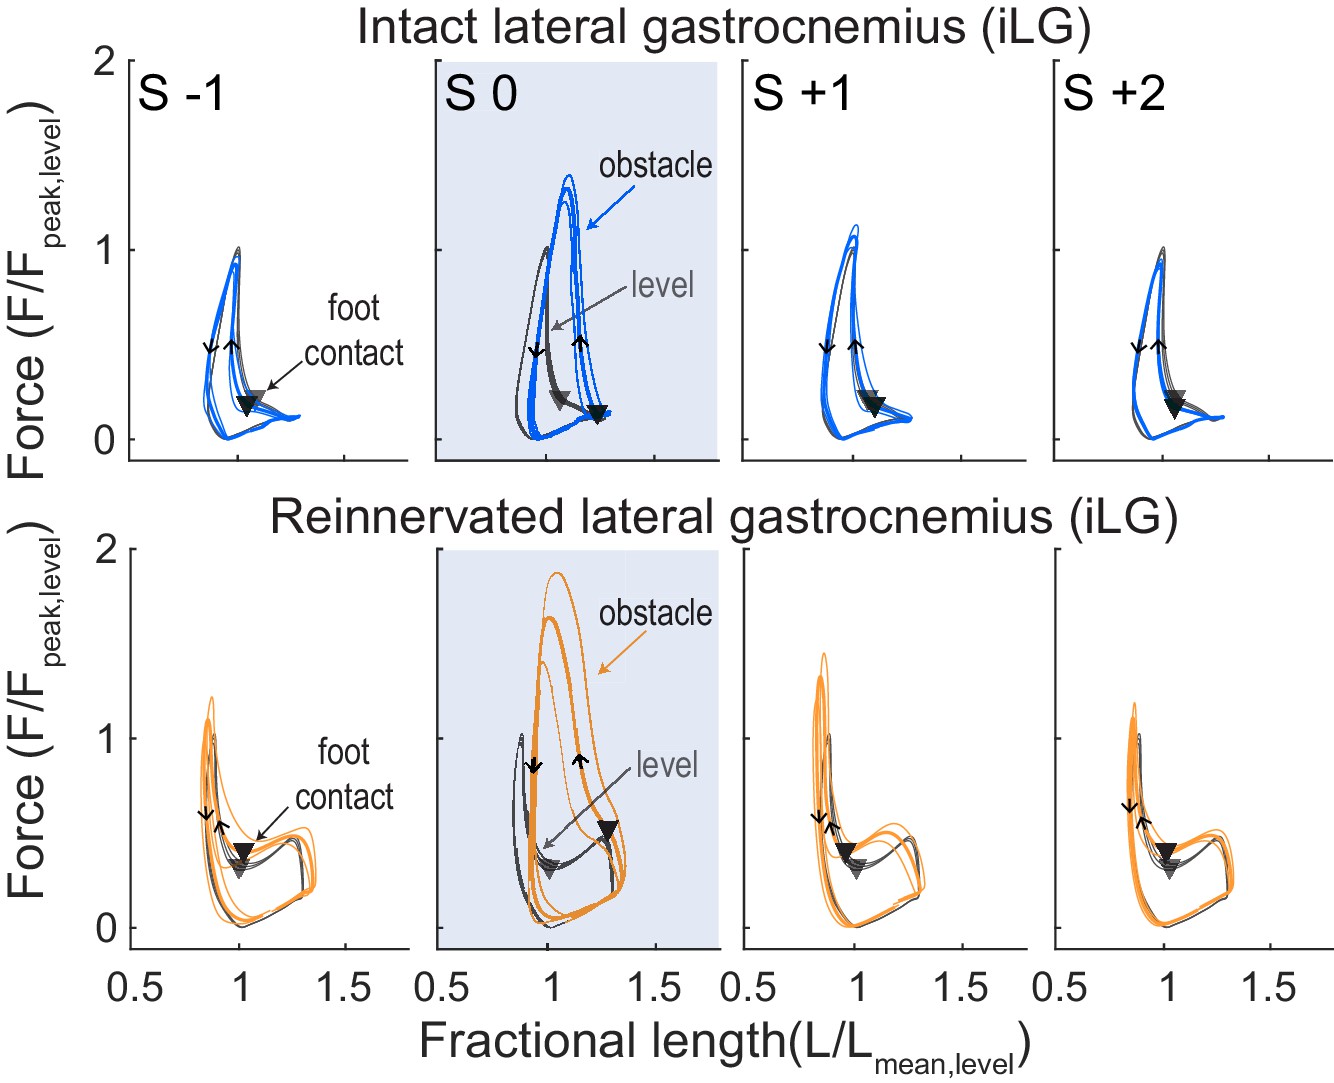
Force-length work loops for iLG (top) and rLG (bottom), for a single individual from each treatment cohort (intact/reinnervated, mean ±95% ci).
Level mean in grey and obstacle strides in colored lines (iLG: blue, rLG: orange). Stride categories as in Figure 2, where the shaded box is an obstacle encounter (S 0). Triangles indicate the timing of foot-ground contact and arrows indicate the direction of the work loop, with a counter-clockwise loop corresponding to net positive muscle work.
Figure 4
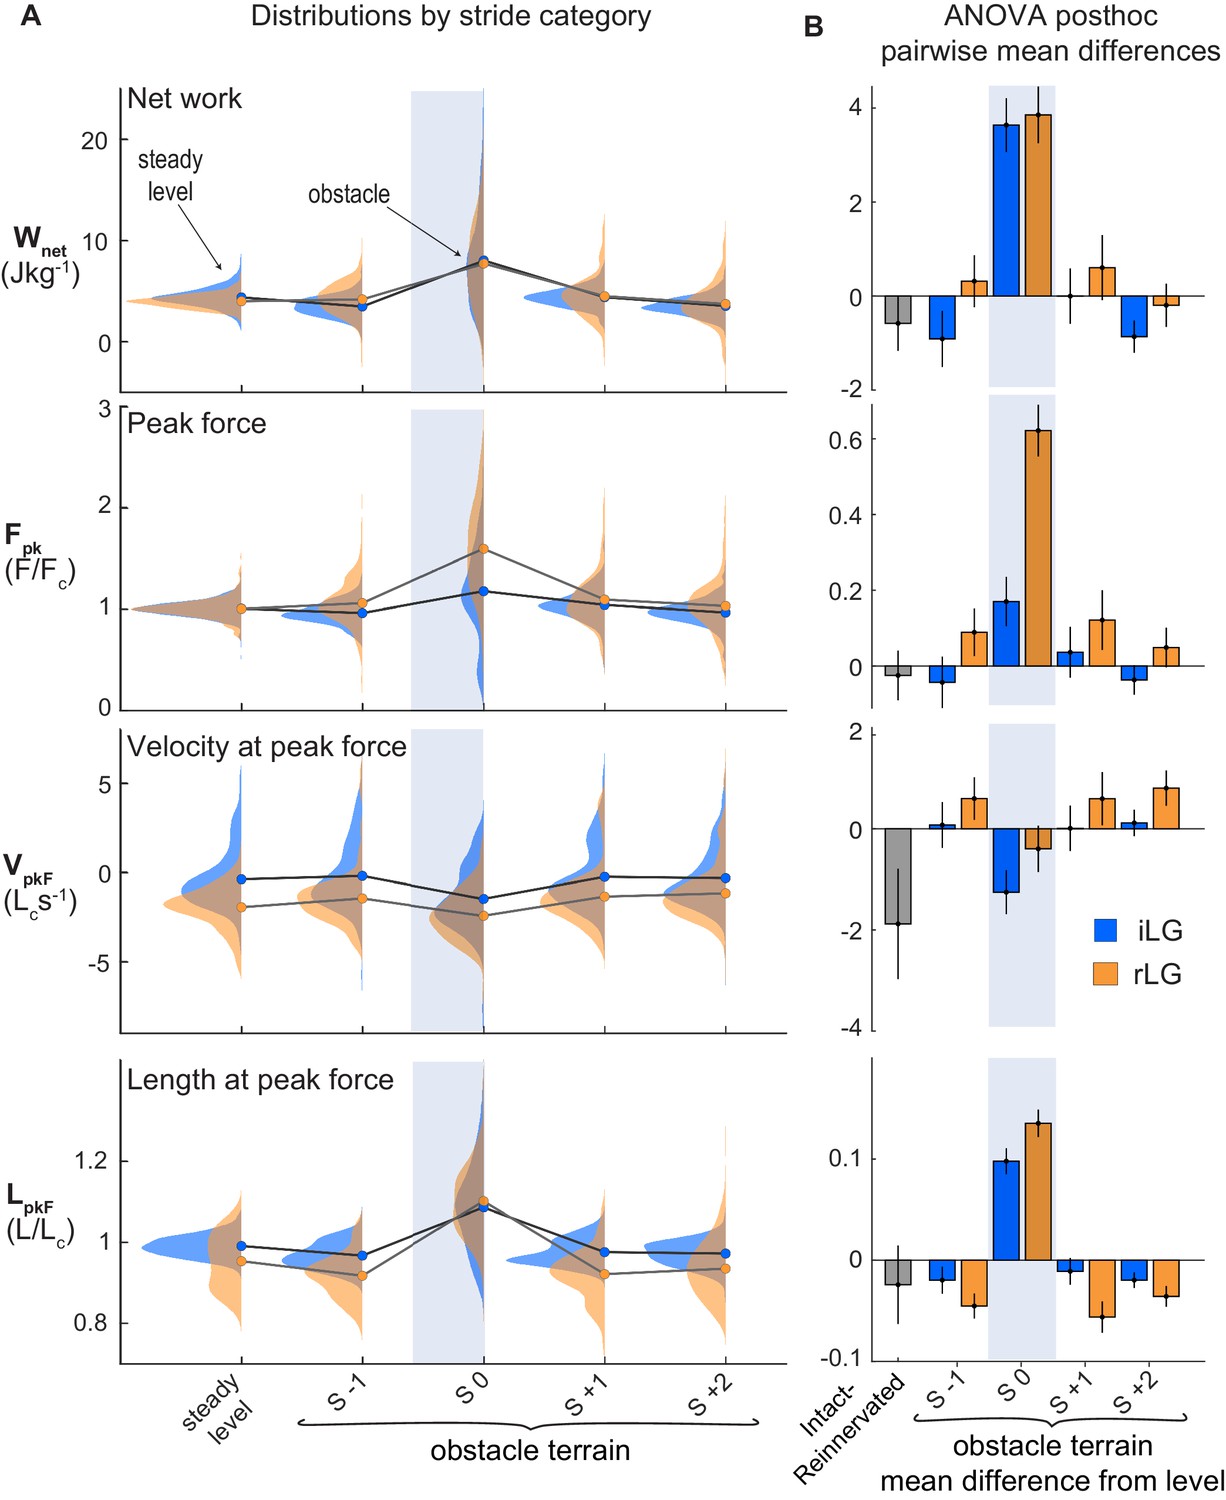
LG muscle mechanical output during obstacle negotiation.
(A) Distributions of muscle total work output (Wnet), peak force (Fpk), velocity and length at peak force (VpkF, LpkF) across stride categories for iLG (blue) and rLG (orange). Circles indicate group means. Lines connect means between stride categories, to highlight the shifts in relation to obstacle encounters (S 0). (B) Pairwise mean differences (mean ±95% ci) for fixed effect categories, between intact and reinnervated treatment cohorts (grey bar), and between obstacle stride categories compared to level means, within treatment cohorts (colored bars). See Tables 1 and 2 for full statistics results and summary data.
Figure 5 with 1 supplement
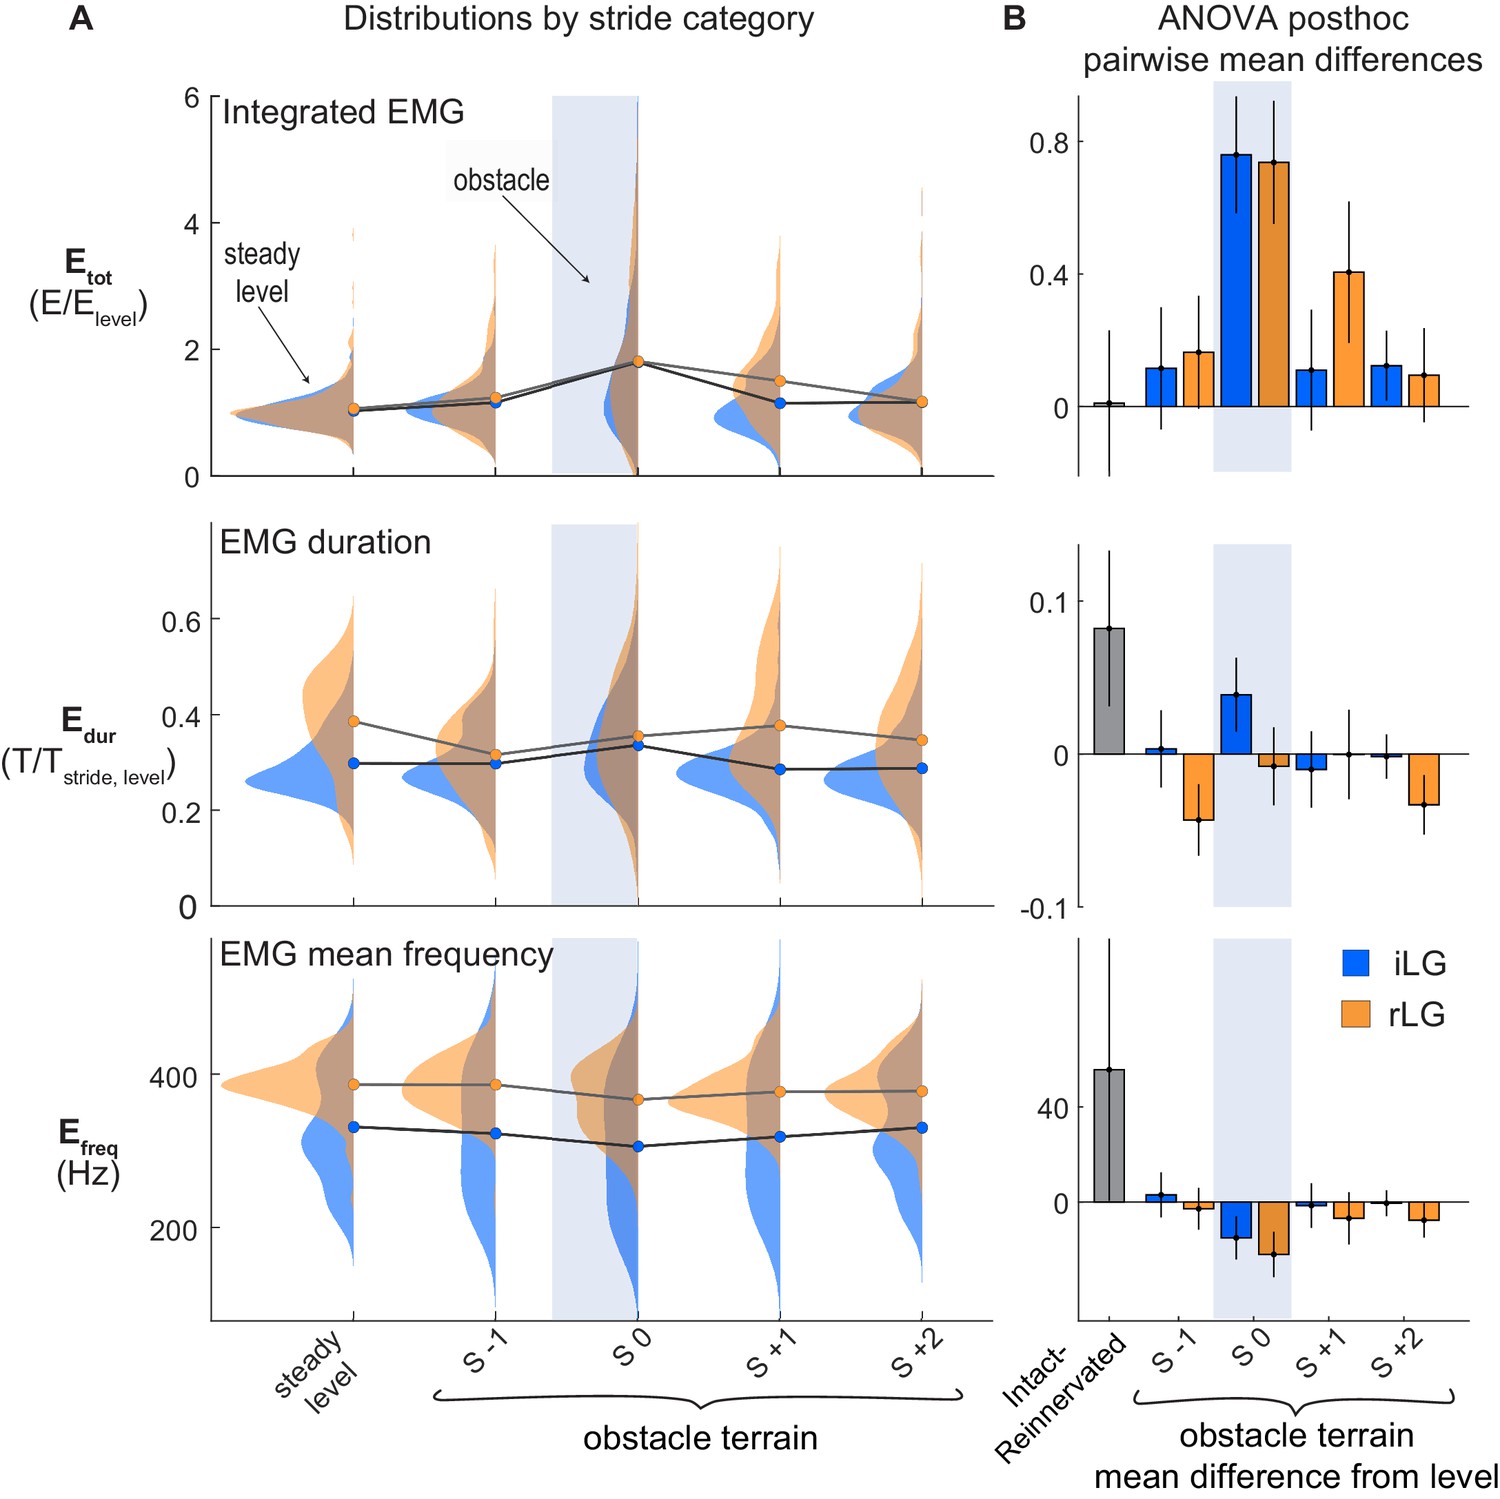
LG muscle activation during obstacle negotiation.
(A) Distributions of total intensity EMG activity (Etot), duration of activity (Edur) and mean frequency of activity (Efreq) across stride categories for iLG (blue) and rLG (orange). Circles indicate group means. Lines connect means between stride categories, to highlight the shifts in relation to obstacle encounters (S 0). (B) Pairwise mean differences (mean ±95% ci) for fixed effects, as presented as in Figure 4. See Tables 1 and 2 for full statistics results and summary data.
Figure 5—figure supplement 1
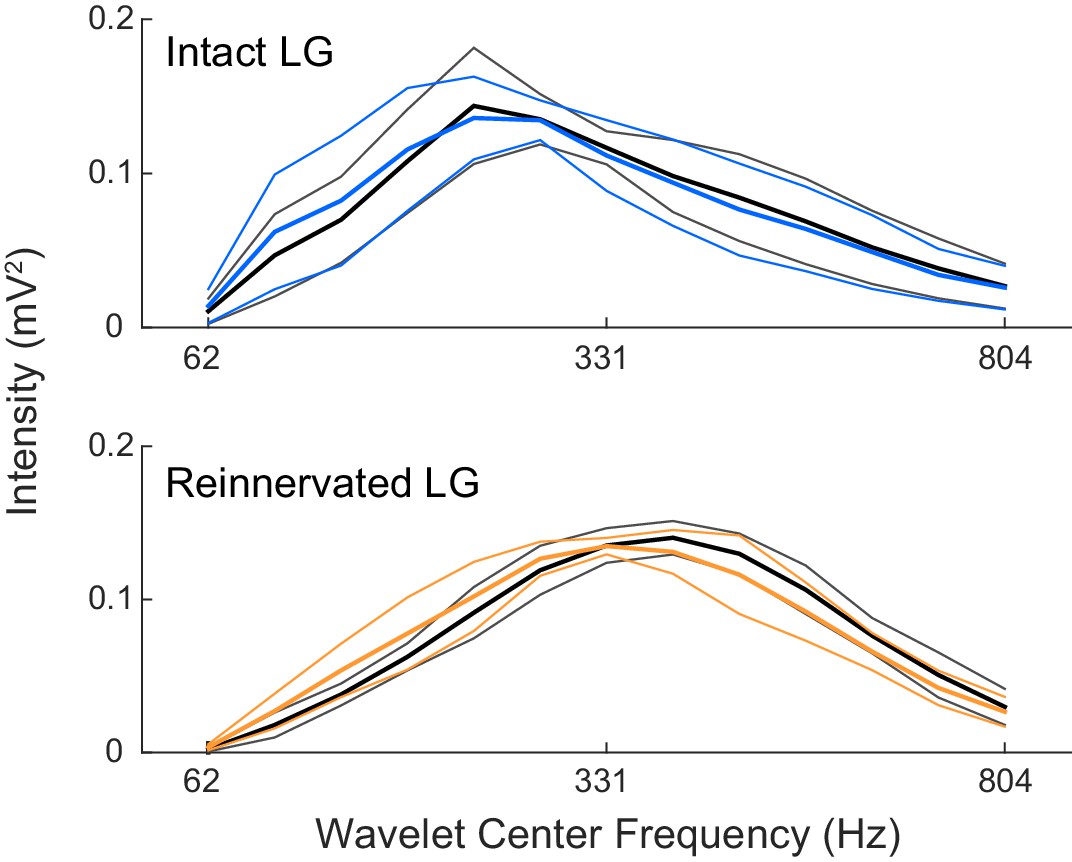
LG frequency distribution.
Distribution of EMG activation frequency (mean ±95% ci) for intact LG (top, blue) and reinnervated LG (bottom, orange), during level running (dark grey lines) and obstacle encounters (S 0, colored lines). Note the shift in peak frequency of EMG activity in the reinnervated LG for both level terrain and obstacle strides, suggesting recruitment of faster motor units.
Figure 6
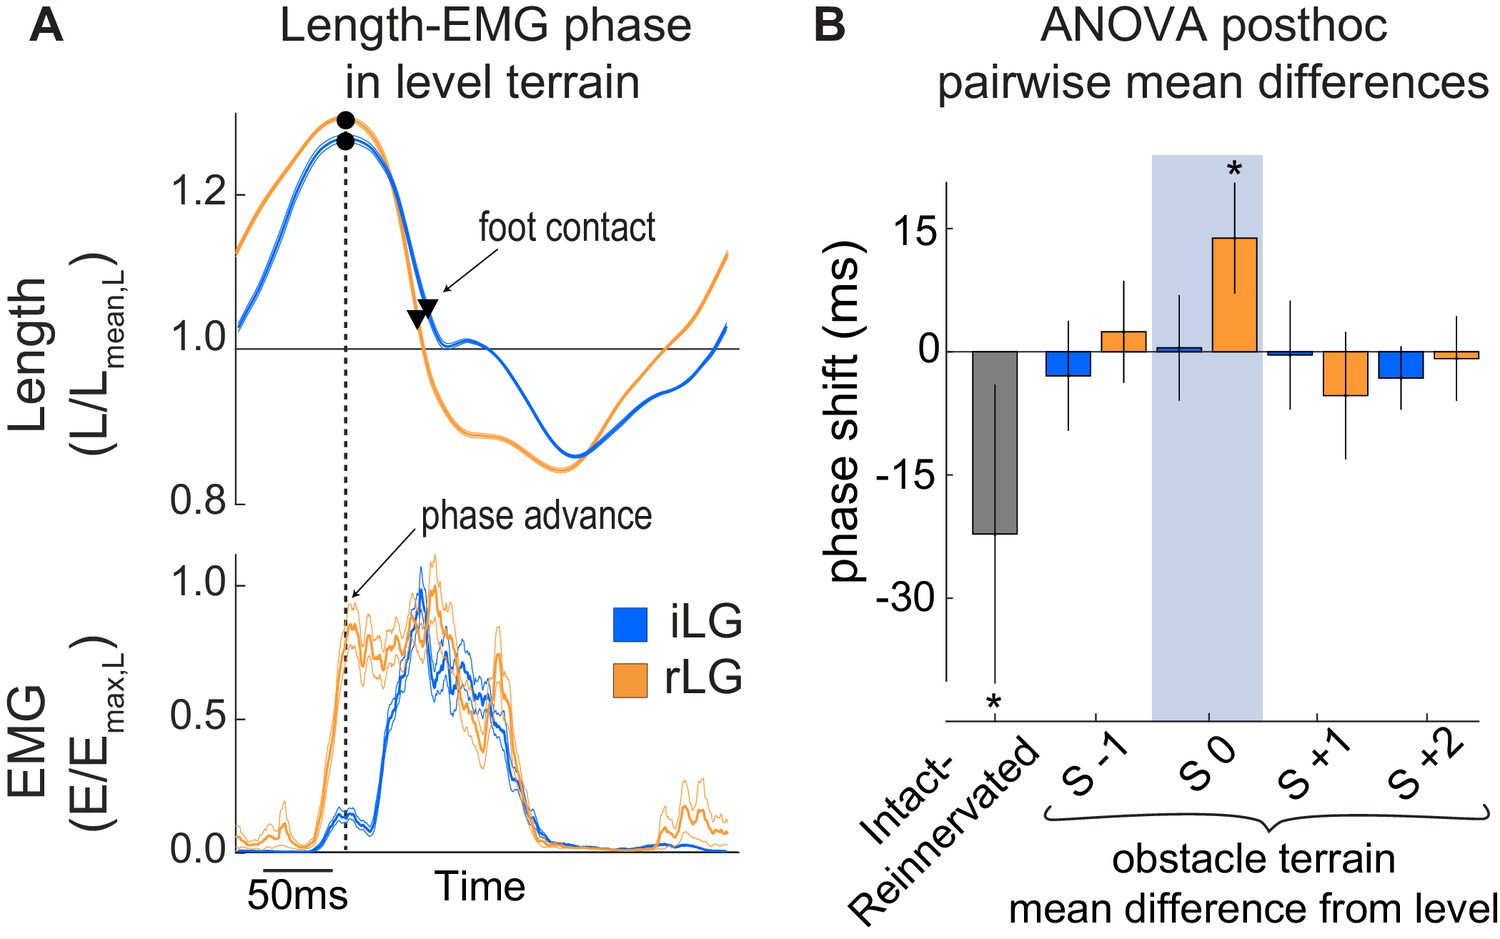
Phase relationship (Ephase) between length and EMG activation.
(A) Average steady-state length and activation trajectories for iLG and rLG in level terrain, aligned in time based on peak length during the swing phase, before foot-substrate contact. Black dot and vertical dashed line indicate the time of peak fascicle length. Triangles indicate timing of foot contact. (B) Pairwise mean differences in Ephase (mean ±95% ci) between intact and reinnervated treatment cohorts (grey), and obstacle stride categories compared to level terrain within each cohort (colored bars). Ephase is reported in the ANOVA tables as a fraction of the stride cycle but is reported in milliseconds here.
Figure 7 with 1 supplement
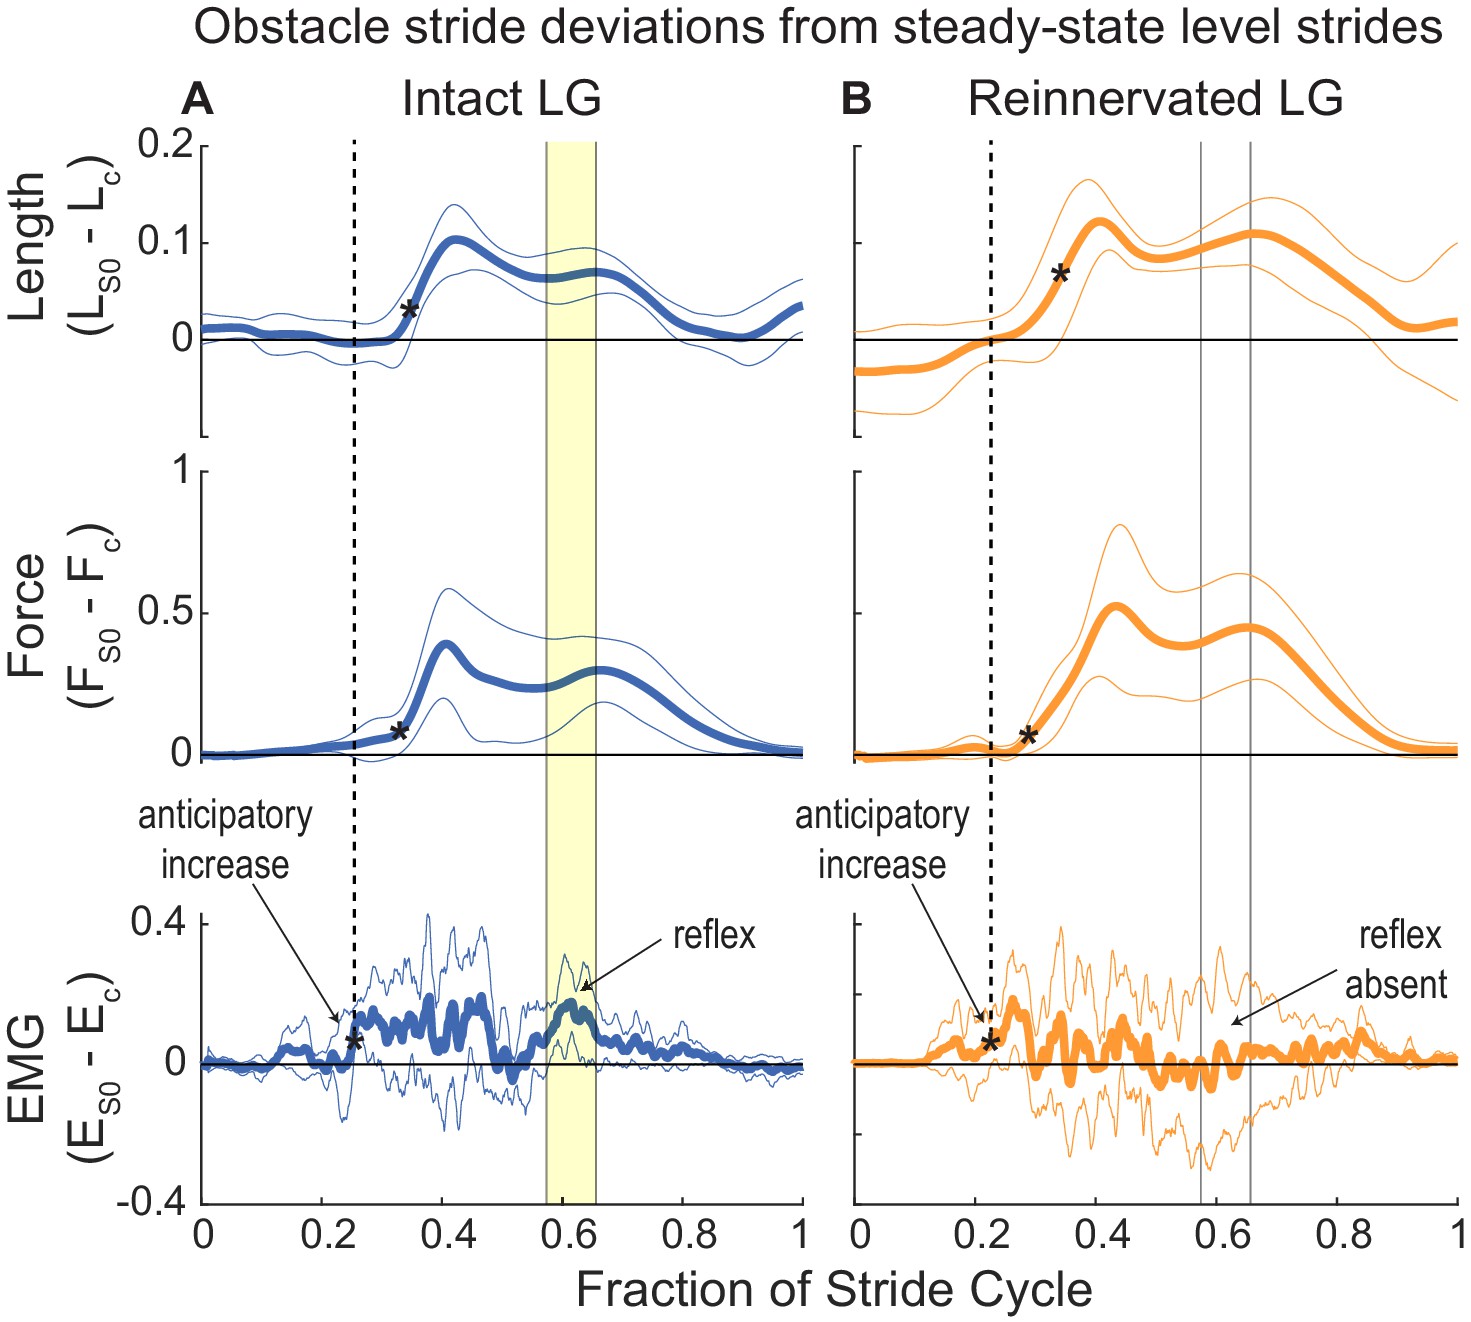
Deviations from steady state in the stride cycle trajectories of muscle length, force and activation, between obstacle strides (S 0) and level strides (grand mean ±95% ci across individuals).
The horizontal zero line indicates no difference from steady state in S 0. The stride cycle is from mid-swing to mid-swing, as in Figure 2. A black asterisk (*) indicates the first timepoint in each trajectory that differs significantly from the level mean. The dashed vertical line and arrow indicating ‘anticipatory increase’ highlights a significant increase in EMG that starts before deviations length and force in S 0. In (A) (iLG), solid vertical lines and yellow fill indicates a 2nd period of significantly increased EMG in late stance that correlates with increased fascicle length and force, suggesting a reflex response. In (B) (rLG), the anticipatory increase in EMG is present; however, wide confidence intervals for EMG in late stance indicates inconsistent patterns of activity across individuals, despite similar increases in length and force as iLG. This suggests disrupted autogenic feedback and idiosyncratic heterogenic feedback patterns across individuals (Figure 7—figure supplement 1).
Figure 7—figure supplement 1
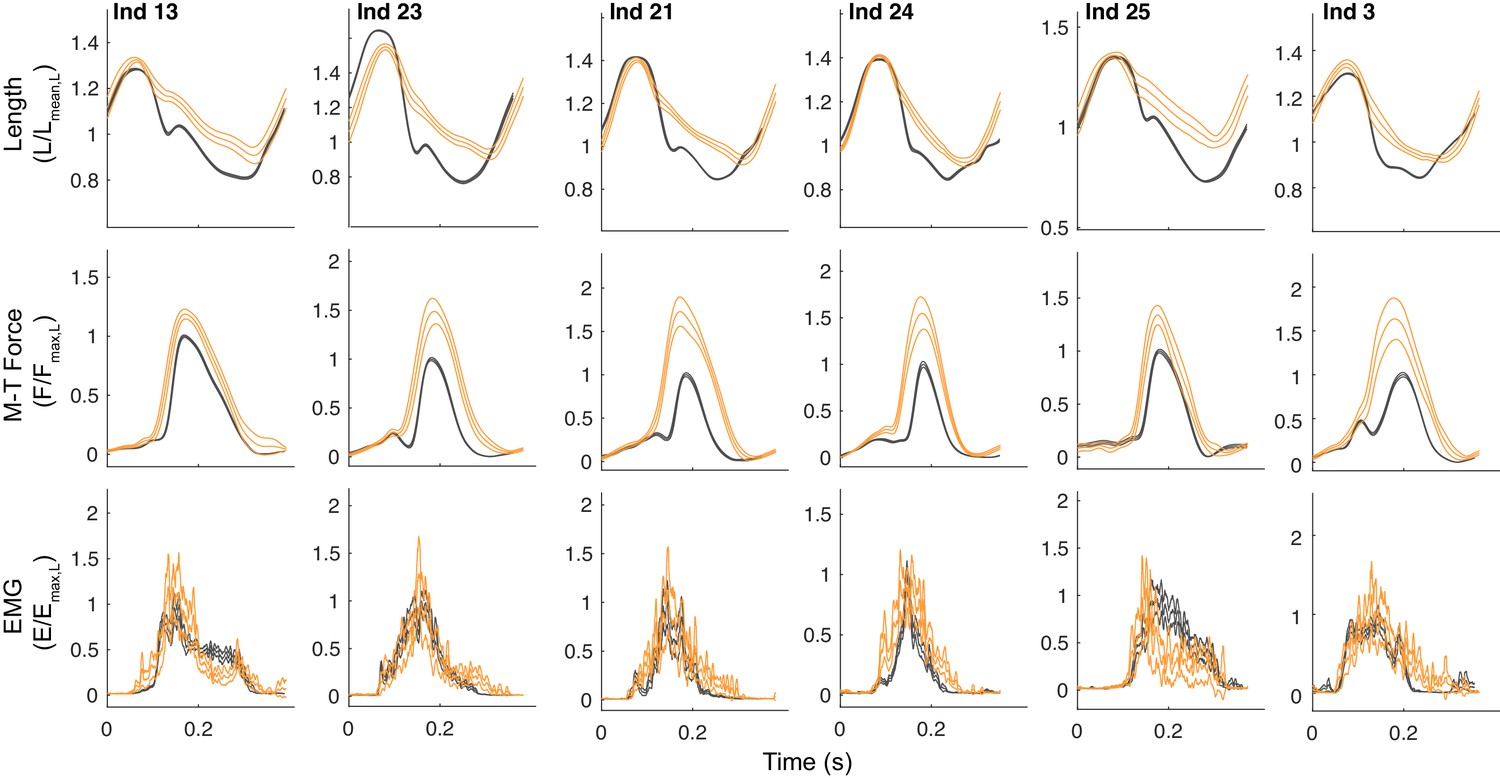
Muscle trajectories during obstacle negotiation for all individuals in the reinnervated cohort.
Average stride cycle trajectories (mean ±95% ci) for fascicle length, muscle-tendon force and myoelectric activity (EMG) during obstacle encounter strides (S 0, orange) compared to the level terrain mean (grey), for all birds with reinnervated LG. Although the deviations in length and force during obstacle encounters are similar across individuals, the shifts in EMG activity in the latter half of stance vary substantially across individuals, with some individuals showing reflex inhibition (Ind 13, Ind 25) and others showing reflex excitation.
Figure 8
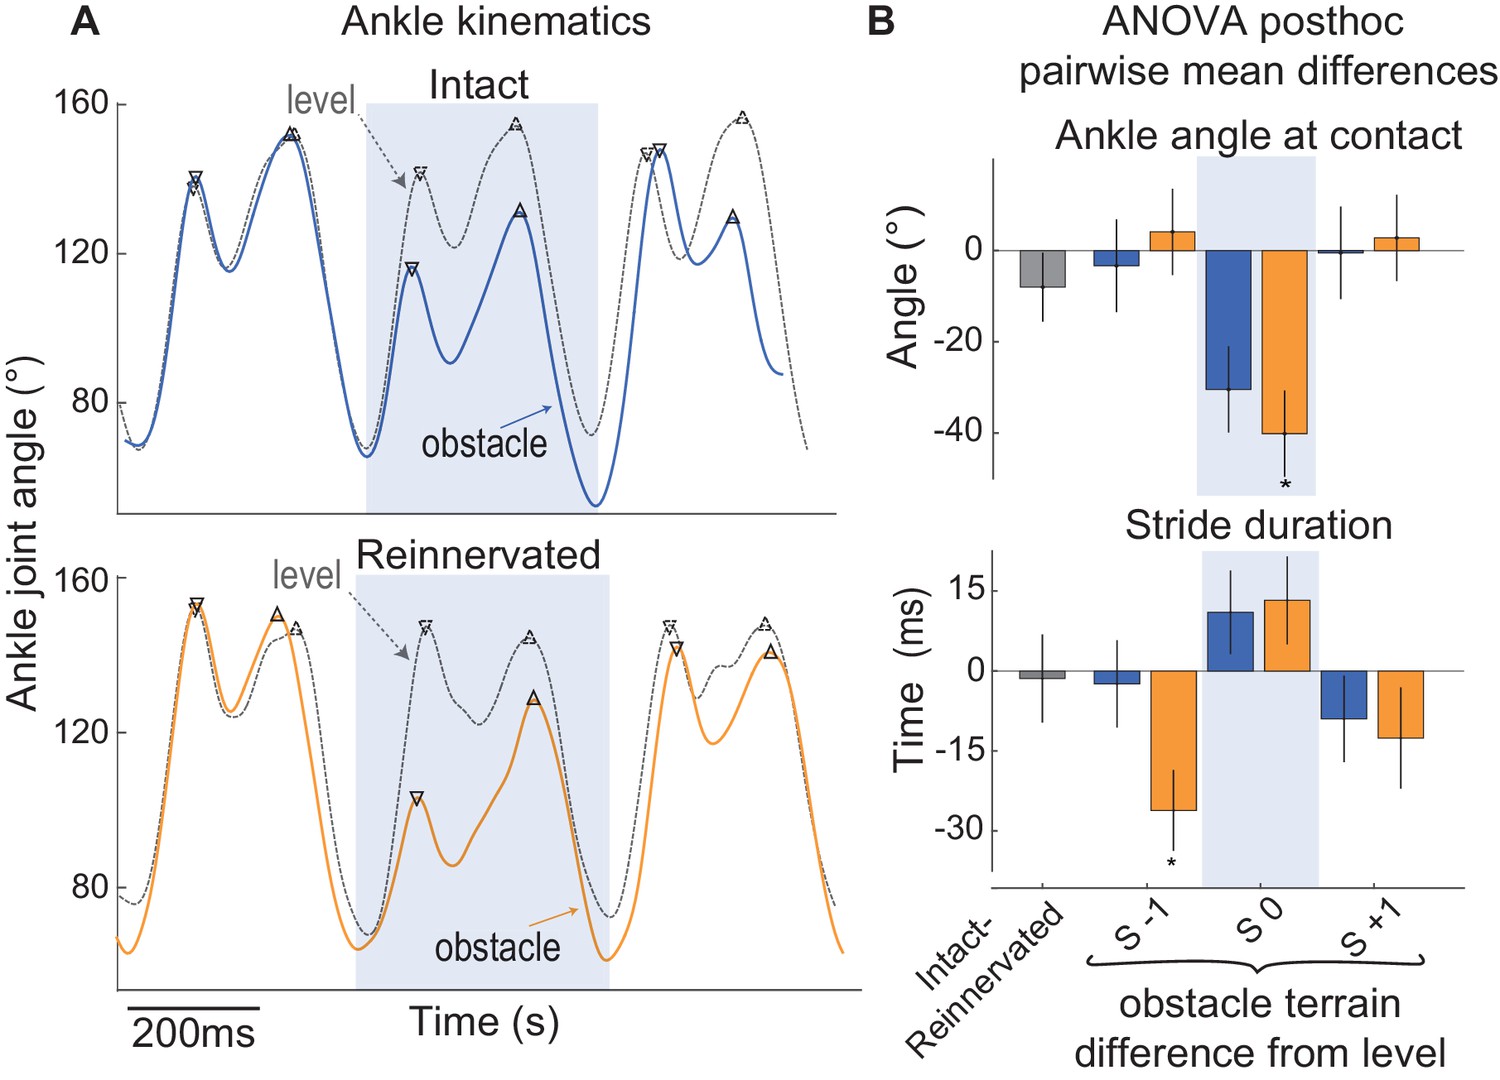
Ankle kinematics in guinea fowl with intact and reinnervated lateral gastrocnemius (LG).
(A) Example ankle joint angle trajectories for a bird with intact LG (blue, top) and a bird with reinnervated LG (orange, below), running in obstacle terrain (solid lines) with level terrain (grey dashed lines). (B) Pairwise mean differences (mean ±95% ci) between intact and reinnervated treatment cohorts (grey), and obstacle stride categories compared to level terrain within each treatment cohort (intact: blue, reinnervated: orange). In obstacle strides (S 0, shaded box), the ankle is more flexed at foot contact in reinnervated compared to intact birds. Reinnervated birds show a shorter stride period in S −1, preceding the obstacle encounter, suggesting increased anticipatory preparation. (See Figure 8—source data 1 for statistical results on ankle angle at the time of foot contact).
-
Figure 8—source data 1
ANOVA results for ankle angle at time of foot contact.
F-statistics, p-values and posthoc pairwise comparisons for linear mixed effect model ANOVA with fixed effects of treatment cohort (treatment: intact, reinnervated) and stride category (stride ID) and the interaction treatment x stride ID. Posthoc pairwise mean differences (mean ±95% ci) are shown between intact and reinnervated treatment cohorts (left), and between obstacle stride categories compared to level stride means, within treatment cohorts (intact/reinnervated).
- https://cdn.elifesciences.org/articles/53908/elife-53908-fig8-data1-v2.csv
Figure 9
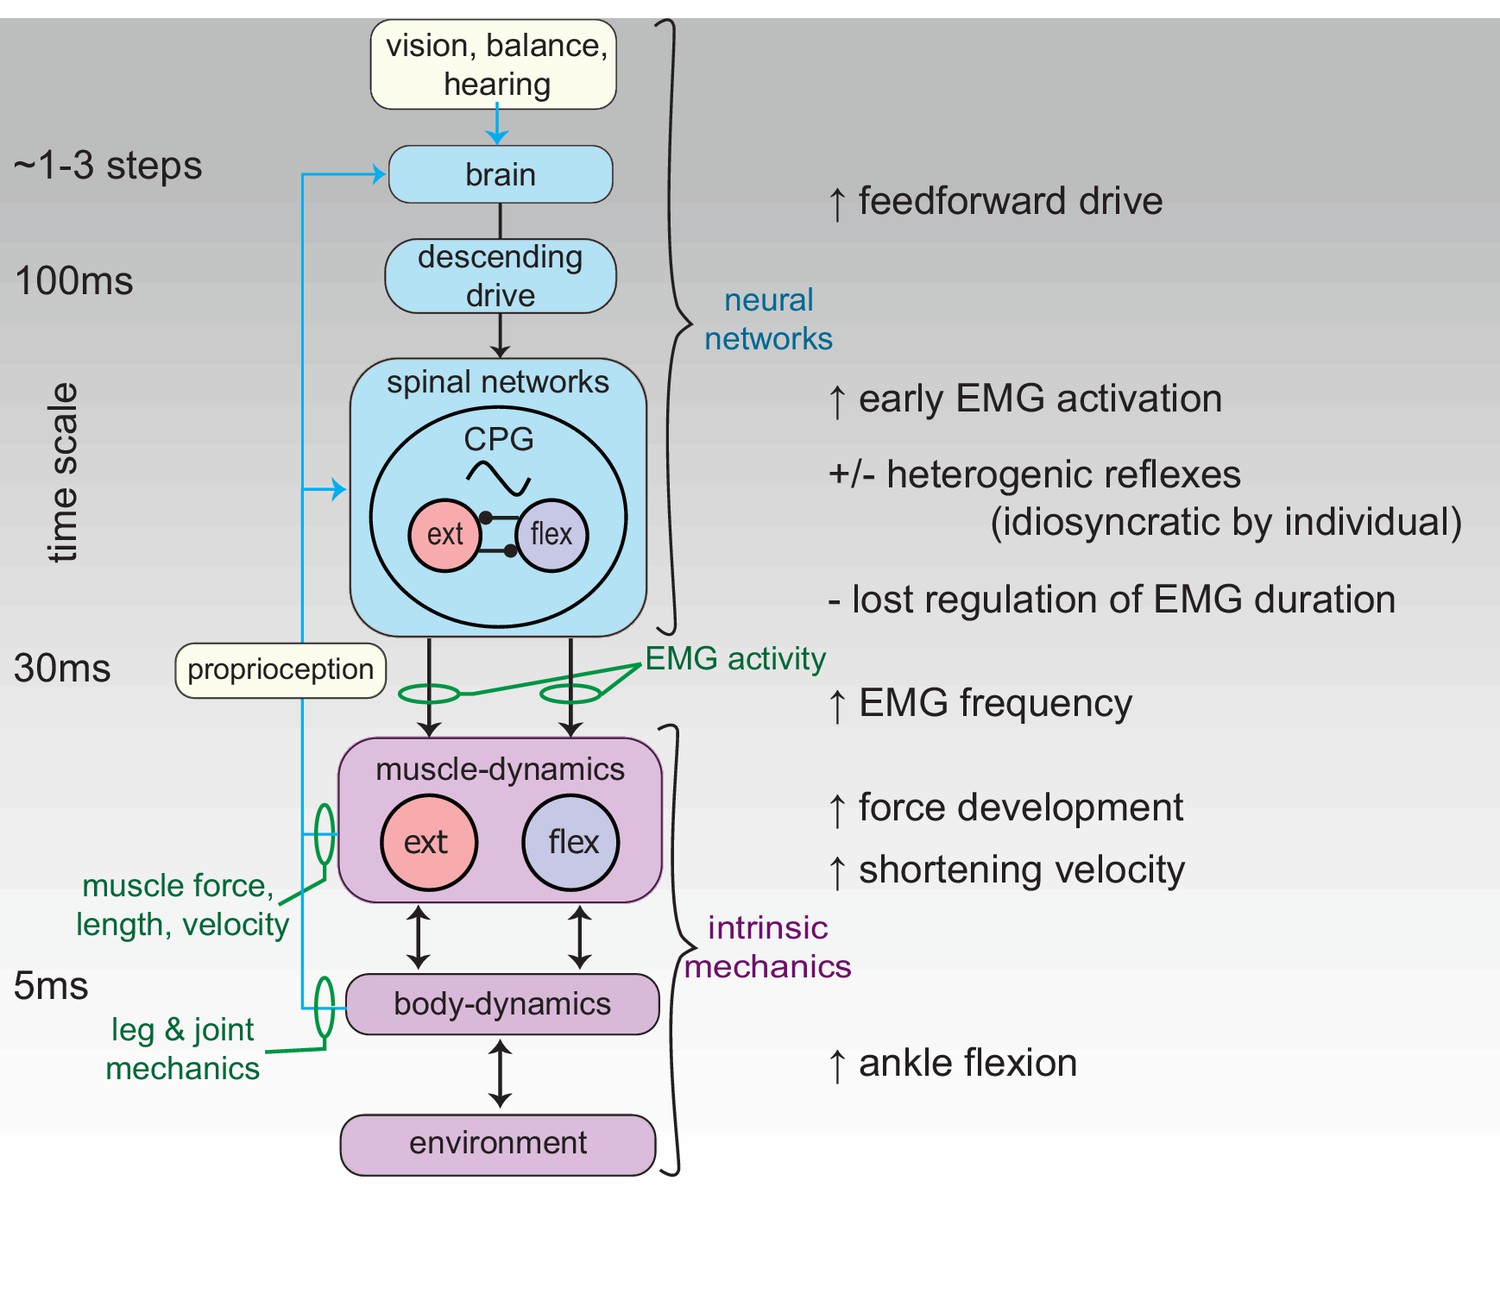
Schematic of the neuromechanical control mechanisms regulating function of the reinnervated lateral gastrocnemius (rLG) of the guinea fowl.
Green text indicates the in vivo experimental measures used to infer sensorimotor control mechanisms. Differences in muscle dynamics between intact and reinnervated cohorts suggest that guinea fowl use a combination of feedforward and intrinsic mechanical mechanisms to compensate for disrupted proprioceptive reflexes, suggesting interconnected plasticity of neural and musculoskeletal mechanisms in the recovery from nerve injury.
Tables
Table 1
Statistical results.
F-statistics for linear mixed effect model ANOVA with fixed effects of treatment cohort (treatment: intact, reinnervated) and stride category (stride ID) and the interaction treatment x stride ID on measures of muscle contraction mechanics and activation. Bolding indicates statistical significance using FDR corrected threshold (p<=0.0263, see Methods). Degrees of freedom for fixed effects were treatment = 1, stride ID = 4, interaction = 4, and error = 2529. See Table 1—source data 1 for p-values.
| F-statistic | |||
|---|---|---|---|
| Variable | treatment | stride ID: | interaction |
| Wnet | 2.44 | 172.04 | 7.44 |
| Fpk | 0.52 | 30.12 | 61.73 |
| LpkF | 1.52 | 238.03 | 39.52 |
| VpkF | 11.43 | 28.09 | 8.73 |
| Tforce | 0.27 | 99.09 | 18.32 |
| Tstride | 0.10 | 12.17 | 17.82 |
| Etot | 0.01 | 49.05 | 3.51 |
| Efreq | 3.93 | 8.71 | 1.85 |
| Ephase | 5.72 | 2.34 | 7.64 |
| Edur | 10.02 | 8.86 | 10.69 |
-
Table 1—source data 1
P-values linear mixed effect model ANOVA with fixed effects of treatment cohort (treatment: intact, reinnervated) and stride category (stride ID) and the interaction treatment x stride ID.
- https://cdn.elifesciences.org/articles/53908/elife-53908-table1-data1-v2.csv
Table 2
Pairwise posthoc comparisons.
Pairwise mean differences (mean ± 95% ci) between intact and reinnervated treatment cohorts (left), and between obstacle stride categories compared to level stride means, within treatment cohorts (intact/reinnervated). Bolding indicates statistical significance using FDR corrected threshold (p <= 0.0263). See Table 2—source data 1 for p-values.
| Variable | Treatment cohort | Intact | Reinnervated | ||||||
|---|---|---|---|---|---|---|---|---|---|
| S −1 | S 0 | Str +1 | S +2 | S −1 | S 0 | Str +1 | S +2 | ||
| Wnet | −0.47 ± 0.59 | −0.91 ± 0.60 | 3.60 ± 0.57 | 0.00 ± 0.59 | −0.86 ± 0.34 | 0.34 ± 0.55 | 3.88 ± 0.60 | 0.49 ± 0.70 | −0.19 ± 0.46 |
| Fpk | −0.02 ± 0.06 | −0.04 ± 0.07 | 0.17 ± 0.06 | 0.04 ± 0.07 | −0.04 ± 0.04 | 0.09 ± 0.06 | 0.62 ± 0.07 | 0.10 ± 0.08 | 0.05 ± 0.05 |
| LpkF | −0.02 ± 0.04 | −0.02 ± 0.01 | 0.10 ± 0.01 | −0.01 ± 0.01 | −0.02 ± 0.01 | −0.05 ± 0.01 | 0.14 ± 0.01 | −0.06 ± 0.02 | −0.04 ± 0.01 |
| VpkF | −1.89 ± 1.10 | 0.07 ± 0.45 | −1.26 ± 0.43 | 0.00 ± 0.45 | 0.11 ± 0.26 | 0.60 ± 0.42 | −0.39 ± 0.46 | 0.63 ± 0.53 | 0.81 ± 0.35 |
| Tforce | 0.02 ± 0.07 | −0.01 ± 0.02 | 0.11 ± 0.02 | −0.01 ± 0.02 | −0.01 ± 0.01 | −0.07 ± 0.02 | 0.07 ± 0.02 | −0.06 ± 0.02 | −0.06 ± 0.02 |
| Tstride | 0.00 ± 0.02 | −0.01 ± 0.02 | 0.03 ± 0.02 | −0.02 ± 0.02 | 0.01 ± 0.01 | −0.07 ± 0.02 | 0.04 ± 0.02 | −0.04 ± 0.03 | −0.03 ± 0.02 |
| Etot | 0.01 ± 0.22 | 0.12 ± 0.18 | 0.76 ± 0.18 | 0.11 ± 0.18 | 0.12 ± 0.11 | 0.16 ± 0.17 | 0.74 ± 0.19 | 0.39 ± 0.22 | 0.09 ± 0.14 |
| Efreq | 55.70 ± 55.12 | 3.05 ± 9.44 | −15.05 ± 9.04 | −1.46 ± 9.34 | −0.46 ± 5.43 | −2.86 ± 8.75 | −22.06 ± 9.52 | −6.81 ± 11.04 | −7.68 ± 7.28 |
| Ephase | −0.06 ± 0.05 | −0.01 ± 0.02 | 0.00 ± 0.02 | 0.00 ± 0.02 | −0.01 ± 0.01 | 0.01 ± 0.02 | 0.04 ± 0.02 | −0.01 ± 0.02 | 0.00 ± 0.01 |
| Edur | 0.08 ± 0.05 | 0.00 ± 0.03 | 0.04 ± 0.02 | −0.01 ± 0.02 | 0.00 ± 0.01 | −0.04 ± 0.02 | −0.01 ± 0.03 | 0.00 ± 0.03 | −0.03 ± 0.02 |
-
Table 2—source data 1
P-values for posthoc pairwise mean differences between intact and reinnervated treatment cohorts (left column) and between obstacle stride categories compared to the level terrain means, within treatment cohorts (intact/reinnervated).
- https://cdn.elifesciences.org/articles/53908/elife-53908-table2-data1-v2.csv
Additional files
Download links
A two-part list of links to download the article, or parts of the article, in various formats.
Downloads (link to download the article as PDF)
Open citations (links to open the citations from this article in various online reference manager services)
Cite this article (links to download the citations from this article in formats compatible with various reference manager tools)
Tuning of feedforward control enables stable muscle force-length dynamics after loss of autogenic proprioceptive feedback
eLife 9:e53908.
https://doi.org/10.7554/eLife.53908


