Stimulation strength controls the rate of initiation but not the molecular organisation of TCR-induced signalling
- Cambridge Institute for Medical Research, University of Cambridge, United Kingdom
- Cancer Research UK Cambridge Institute, University of Cambridge, United Kingdom
- EMBL-European Bioinformatics Institute, Wellcome Genome Campus, United Kingdom
- Wellcome Sanger Institute, Wellcome Genome Campus, United Kingdom
Figures
Figure 1

Diagrammatic representation of TCR signalling pathways measured by mass cytometry panel.
Cartoon depicts the TCR-related signalling pathways examined in this study in our minimal stimulation system wherein T cells present antigen to each other. Solid lines indicate evidence of direct and dotted lines suggested or indirect interaction. Signalling proteins and post-translational modifications directly measured by mass cytometry antibodies are coloured blue (proteins) or green/red (sites of phosphorylation events) and outlined in purple. The mass cytometry panel also profiled surface proteins TCRβ, CD8α, CD45, CD25 (IL2Rα), and CD44.
Figure 2 with 2 supplements
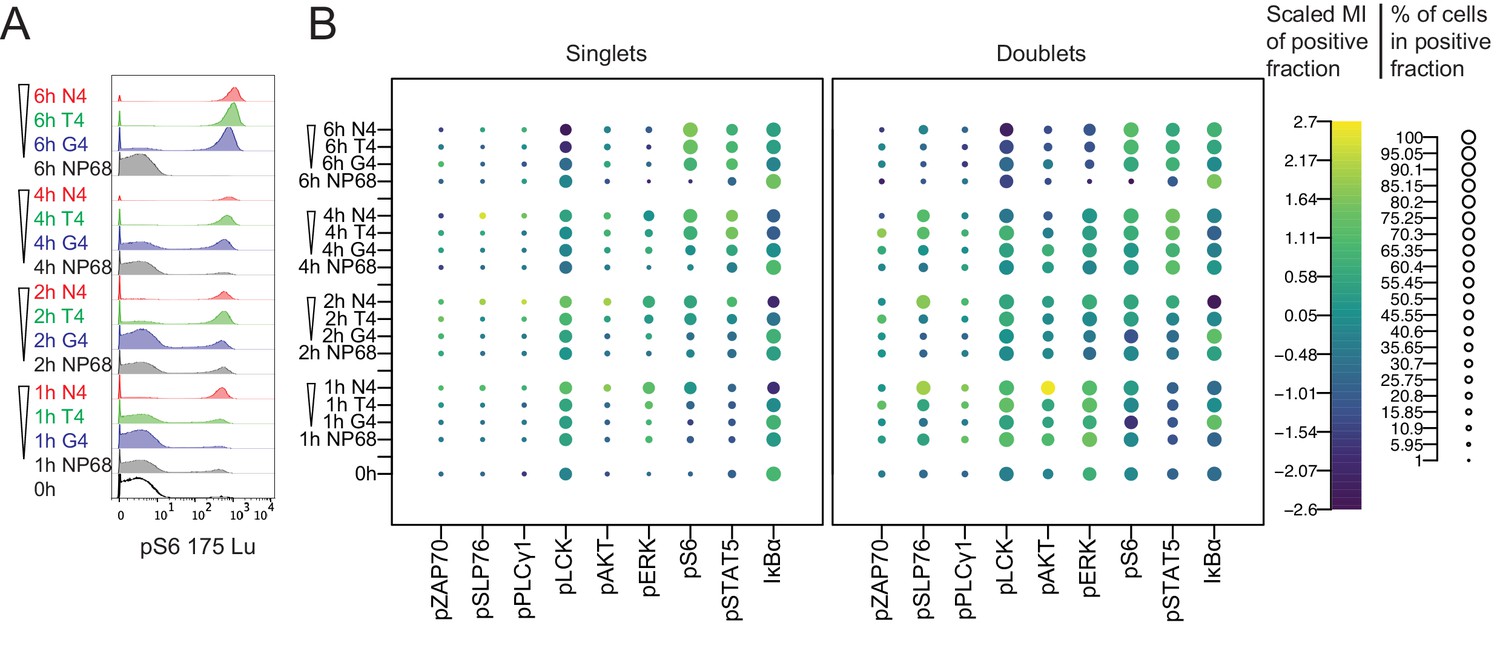
Mass cytometry measurements of signalling in singlet and doublet events.
(a) Naïve CD8+ T cells were stimulated with 1 μM peptides of various potencies for 0, 1, 2, 4 and 6 hr before profiling by mass cytometry. Histograms depict pS6 signal. (b) Bubble plots of all signalling molecules after stimulation as in (a) in mass cytometry events with 1 or 2 cell-equivalents of DNA (singlets or doublets, respectively). The size of the bubbles denotes the percentage of positive cells, and the colour denotes the centred and scaled median intensity of each positive fraction. Results are representative of cells from six biological replicates measured in two independent experiments as detailed in Supplementary file 1.
Figure 2—figure supplement 1
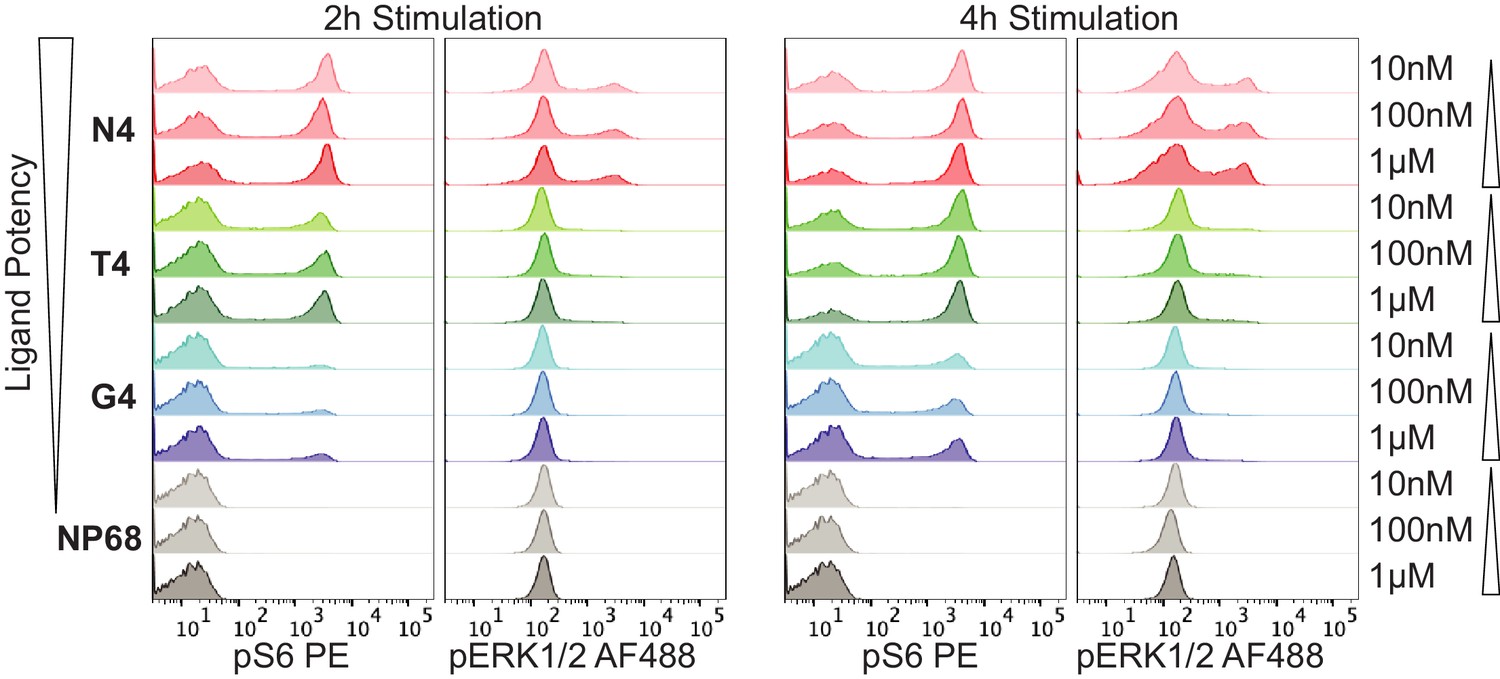
Titrating peptide concentration.
(a) Flow cytometry measurements of pS6 and pERK after 2 or 4 hr of simulation with 10 nM, 100 nM or 1 μM of N4, T4, G4 or NP68 peptides. Results are representative of 3 biological replicates.
Figure 2—figure supplement 2
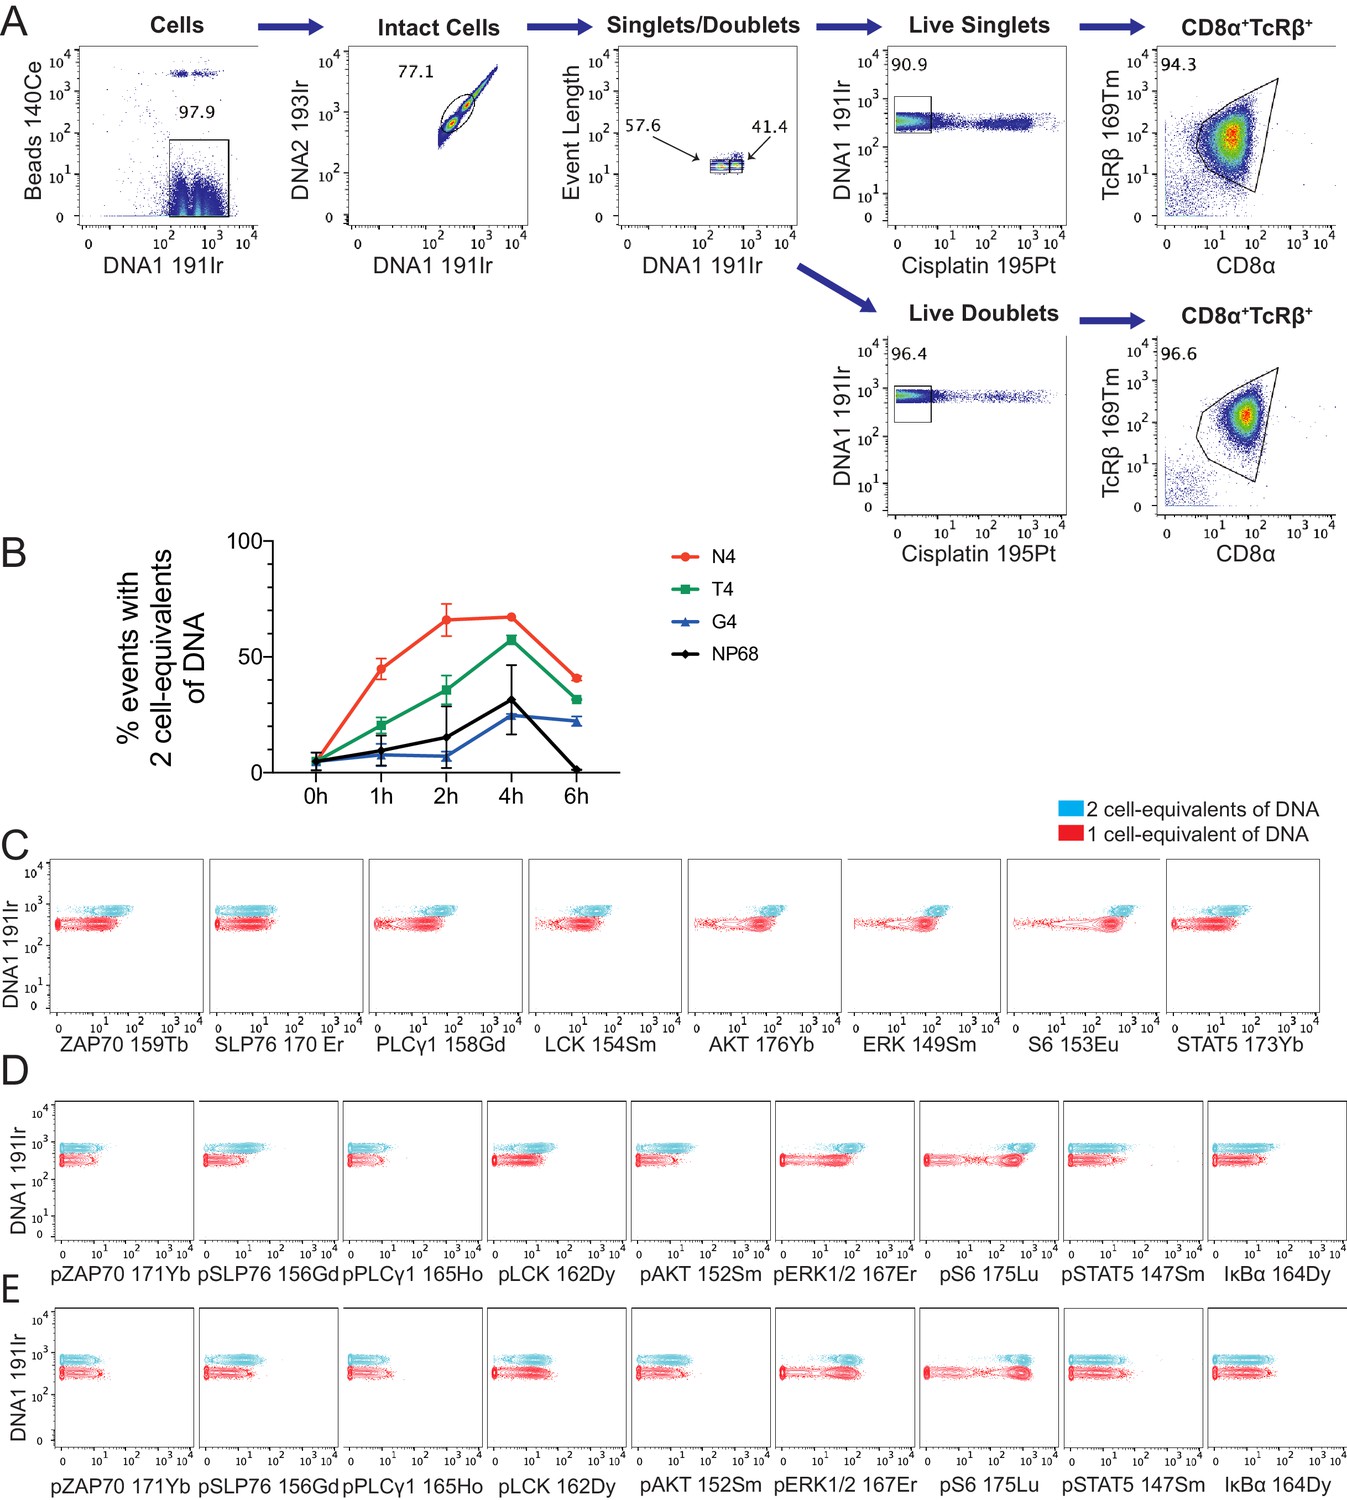
Gating based on DNA content and comparison of signalling markers.
(a) Gating strategy used to select mass cytometry events containing one or two cell-equivalents of DNA from mass cytometry data in Figure 2. (b) Percentages of mass cytometry events deemed doublets (2 cell-equivalents of DNA). Plot depicts mean and standard deviation of 6 biological replicates measured in two independent experiments as detailed in Supplementary file 1. (c–d) Expression of total (c) and phosphorylated (d) protein measurements in cells stimulated with N4 peptide for 1 hr, gated on singlets (red) versus doublets (blue). Data are representative of 6 biological replicates measured in two independent experiments. (e) As (d) after normalization of signalling molecules to total DNA levels.
Figure 3 with 3 supplements
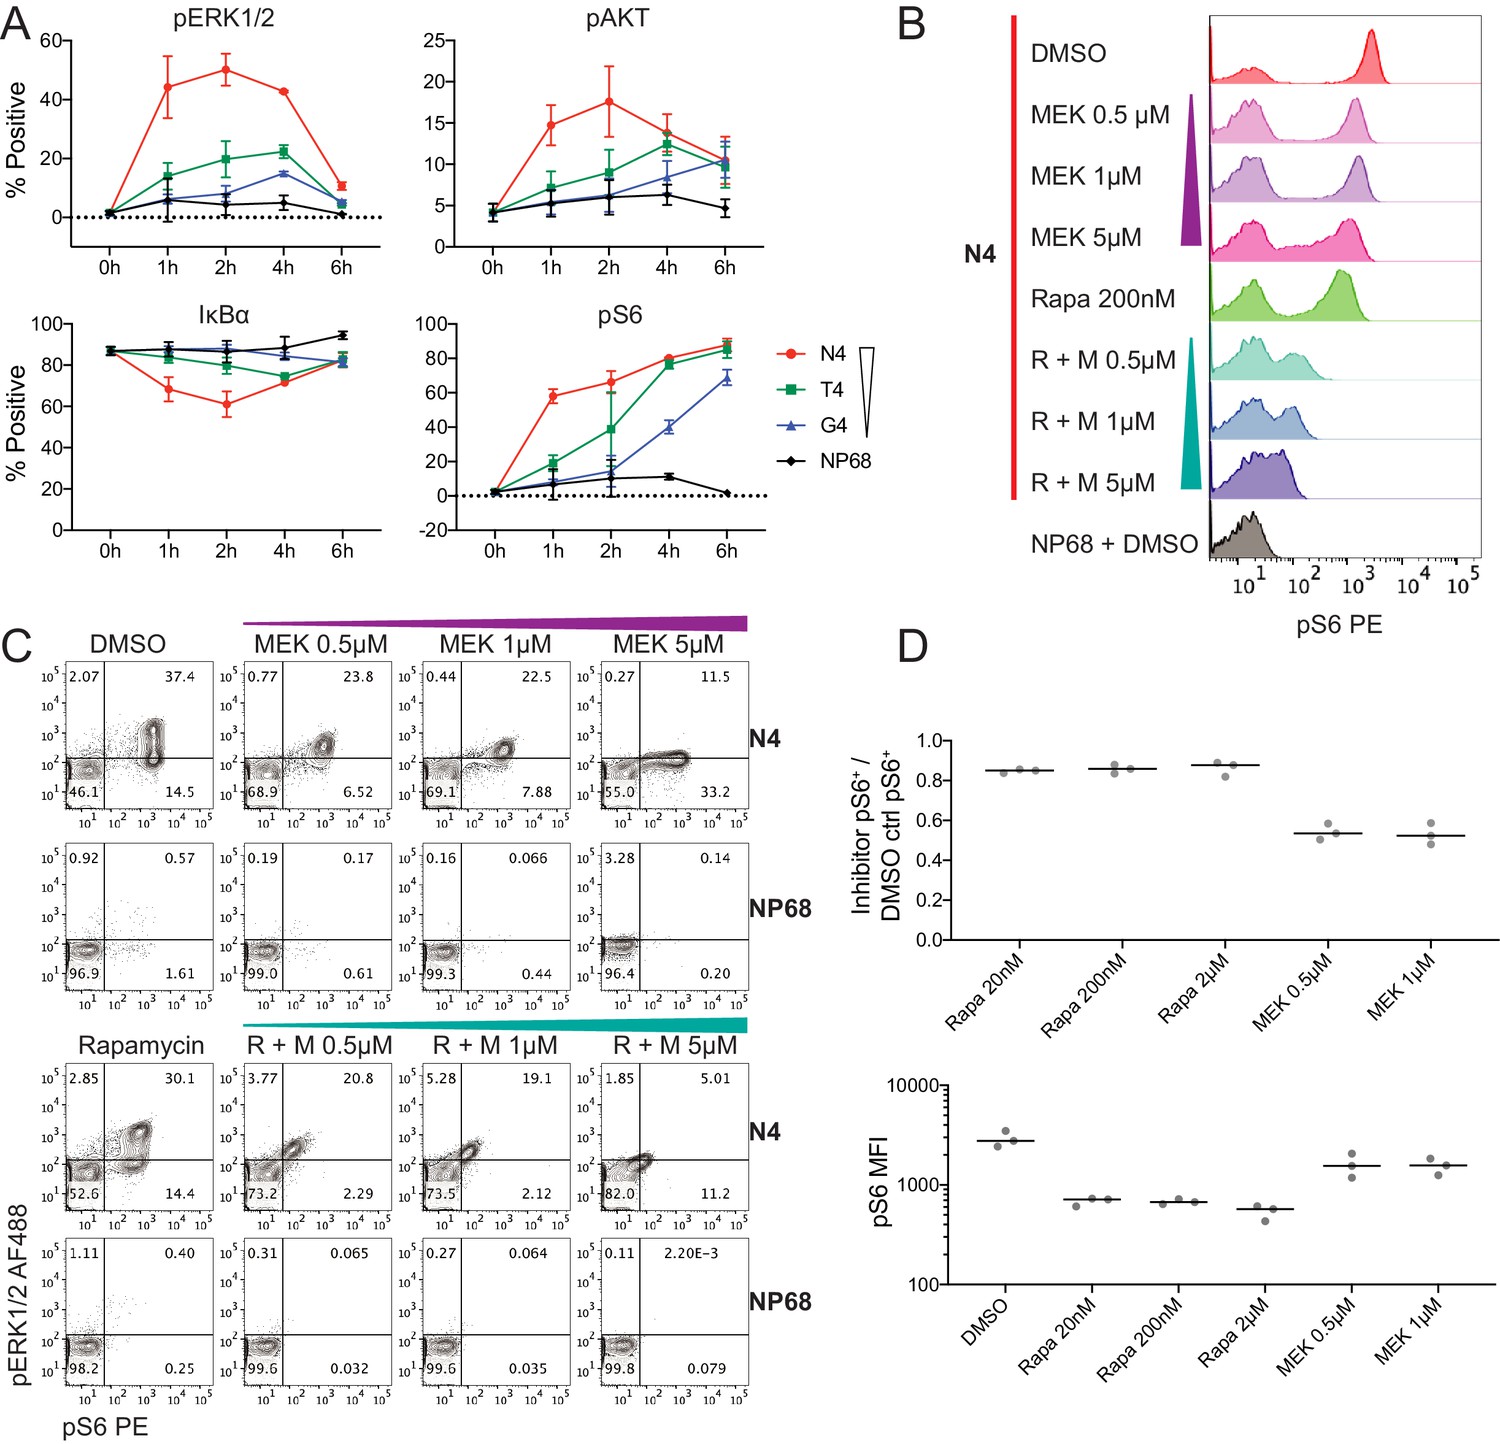
Kinetics of selected signalling proteins and impact of MEK and mTOR pathway inhibitors on T cell activation parameters.
(a) The percentage of cells positive for each marker is plotted against time. Results depict combined data from six biological replicates measured in two independent experiments as detailed in Supplementary file 1. Points represent the mean and error bars depict the SD. Data underlying plots are provided in Supplementary file 5. (b–c) Flow cytometry measurements of pS6[S235/236] and pERK1/2 after 2 hr of pre-treatment with DMSO vehicle control, rapamycin (Rapa) 200 nM, MEK162 (MEK) 0.5 μM, 1 μM and 5 μM, or combined rapamycin with MEK162 (R + M), followed by 4 hr stimulation with 1 μM N4 or NP68 peptides. Results are representative of 3 independent experiments. (d) The fraction of pS6+ cells in N4-stimulated conditions with the indicated inhibitor treatments versus DMSO (top). The median fluorescent intensity of pS6 among pS6+ cells in N4-stimulated conditions with the indicated inhibitor treatments (bottom). Lines represent the median. Results depict combined data from three independent experiments.
Figure 3—figure supplement 1
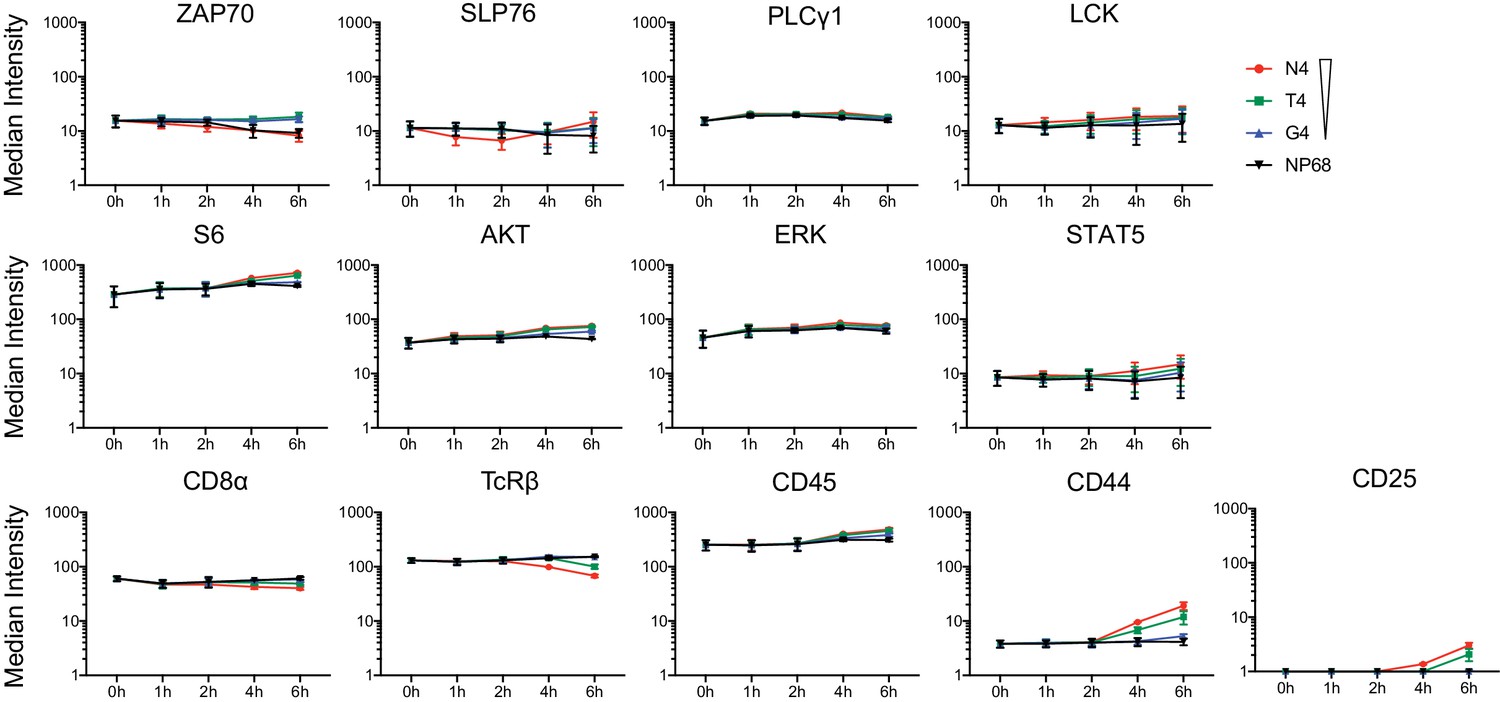
Kinetics of total protein levels and surface markers.
The median intensity of proteins measured by mass cytometry under stimulation with ligands of various potencies over time. Points represent the mean and error bars depict the SD. Results depict combined data from six biological replicates measured in two independent experiments as detailed in Supplementary file 1.
Figure 3—figure supplement 2
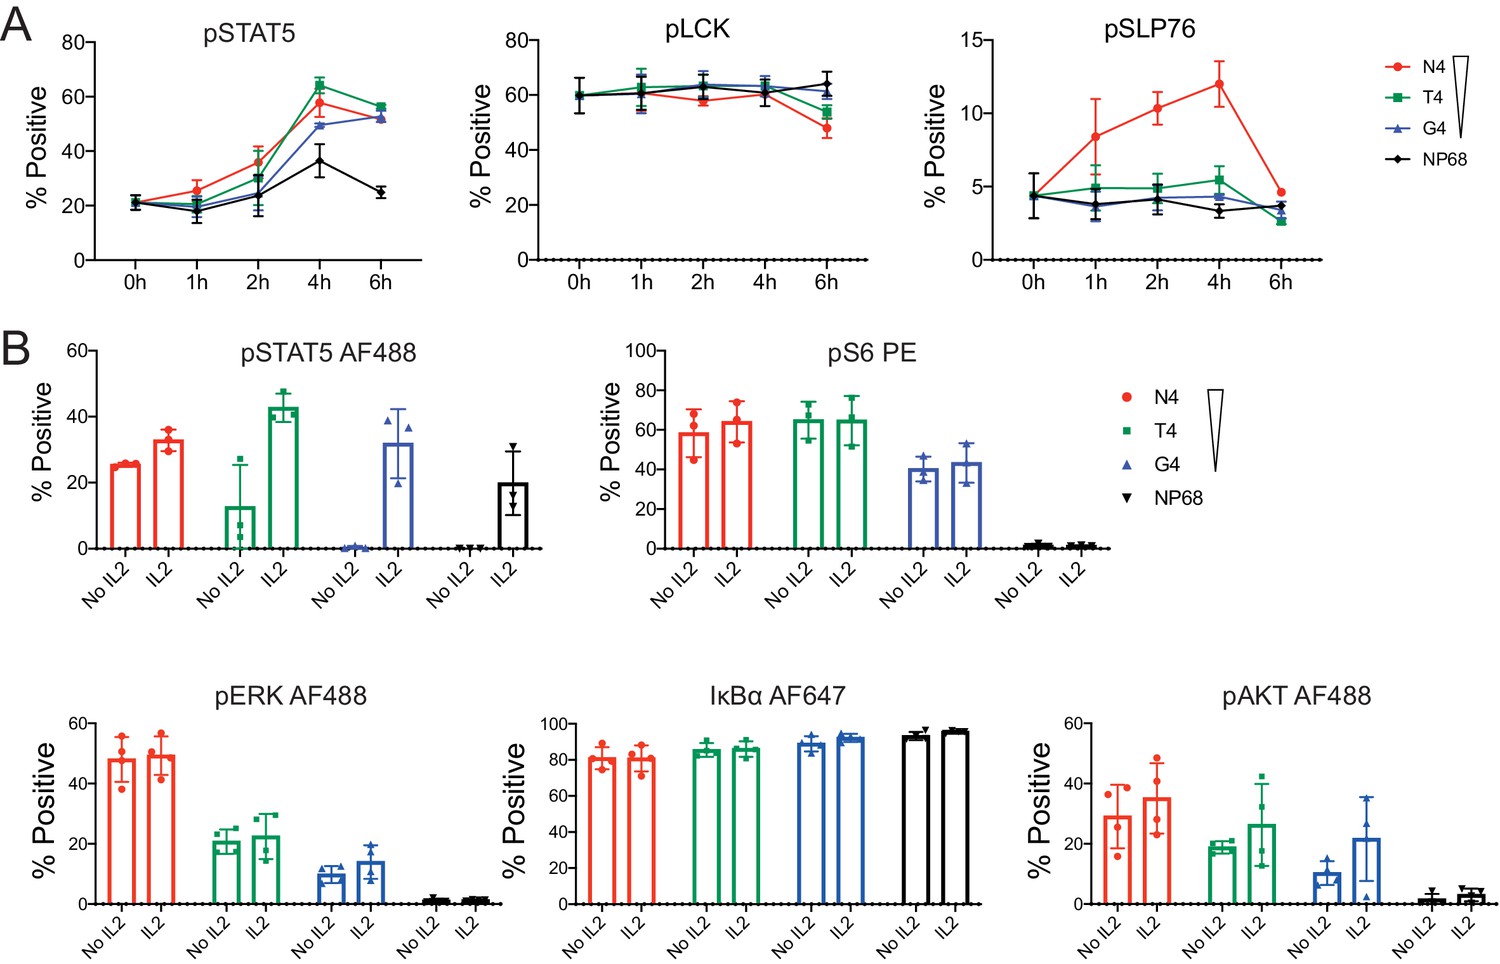
Kinetics of pSTAT5, pLCK and pSLP76 signalling proteins and testing the impact of IL2.
(a) As Figure 3a for pSTAT5, pLCK and pSLP76. Plots depict combined data from six biological replicates measured in two independent experiments as detailed in Supplementary file 1. Points represent the mean and error bars depict the SD. Data underlying plots are provided in Supplementary file 1. (b) Flow cytometry measurements of pSTAT5, pS6[S235/236] pERK1/2, pAKT and IκBα, stimulated with peptides of various potencies for 4 hr, in the presence or absence of IL2. Results depict combined data from three biological replicates measured in 2–3 independent experiments. Bar charts represent the mean and error bars depict the SD.
Figure 3—figure supplement 3
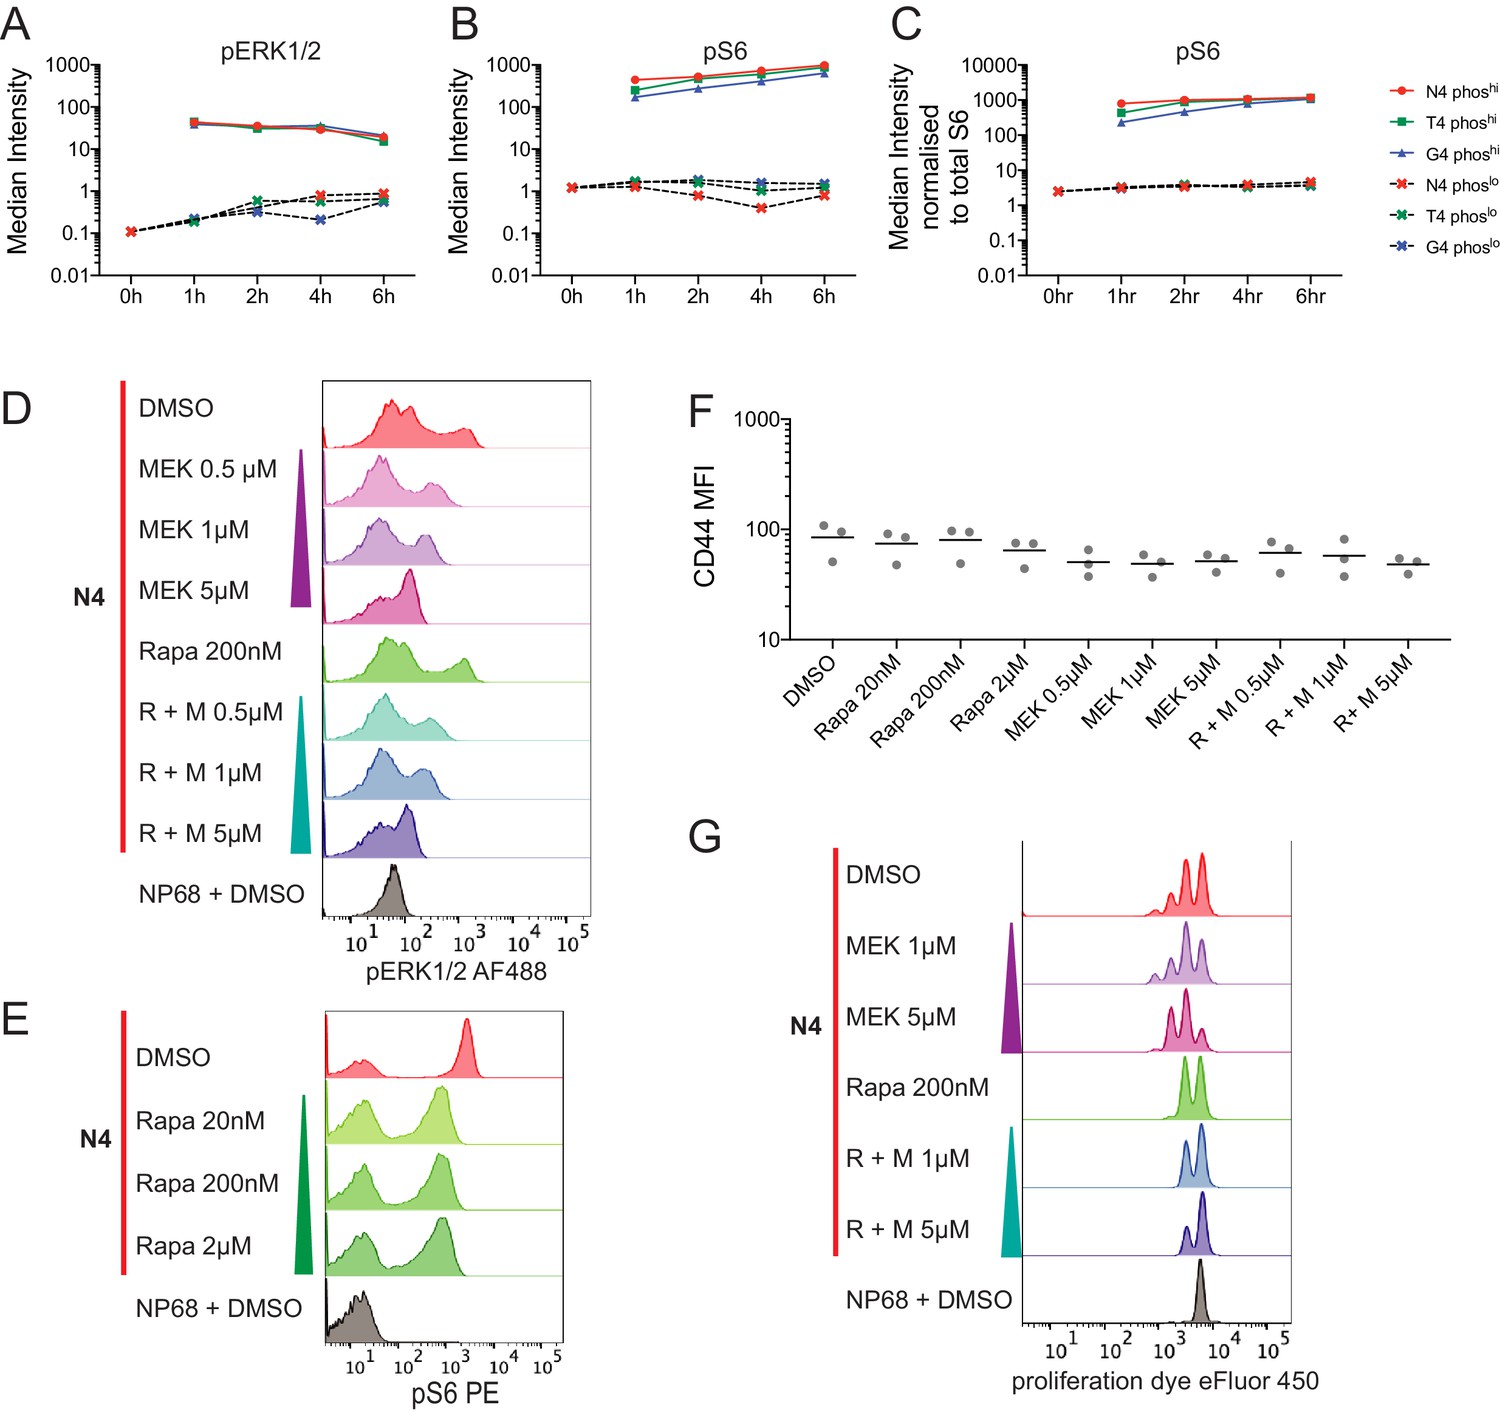
pERK and pS6 distributions and additional MEK and mTOR inhibition data.
(a) Cells were gated on pERK1/2 positive and negative populations. Within these populations, the median marker intensity was calculated at each timepoint in each condition. (b) As (a) for pS6[S235/S236]. (c) As (b) after normalization of pS6 intensity to total S6 intensity within each cell. (a–c) Plots are representative of 6 biological replicates measured in two independent experiments as detailed in Supplementary file 1. (d) As Figure 3b, measuring pERK1/2. (e) Flow cytometry measurements of pS6[S235/236] after stimulation in the presence of the indicated concentrations of rapamycin. (f) The median fluorescent intensity of CD44 among live cells in N4-stimulated conditions with the indicated inhibitor treatments. Results depict combined data from three independent experiments. Lines represent the mean. (g) 2 day proliferation assay of cells treated as in (d–f) measured using Cell Proliferation Dye eFluor450. (d,e,g) Results are representative of 3 biological replicates from 2 to 3 independent experiments.
Figure 4 with 2 supplements
Examination of multi-dimensional phenotypes in mass cytometry signalling data.
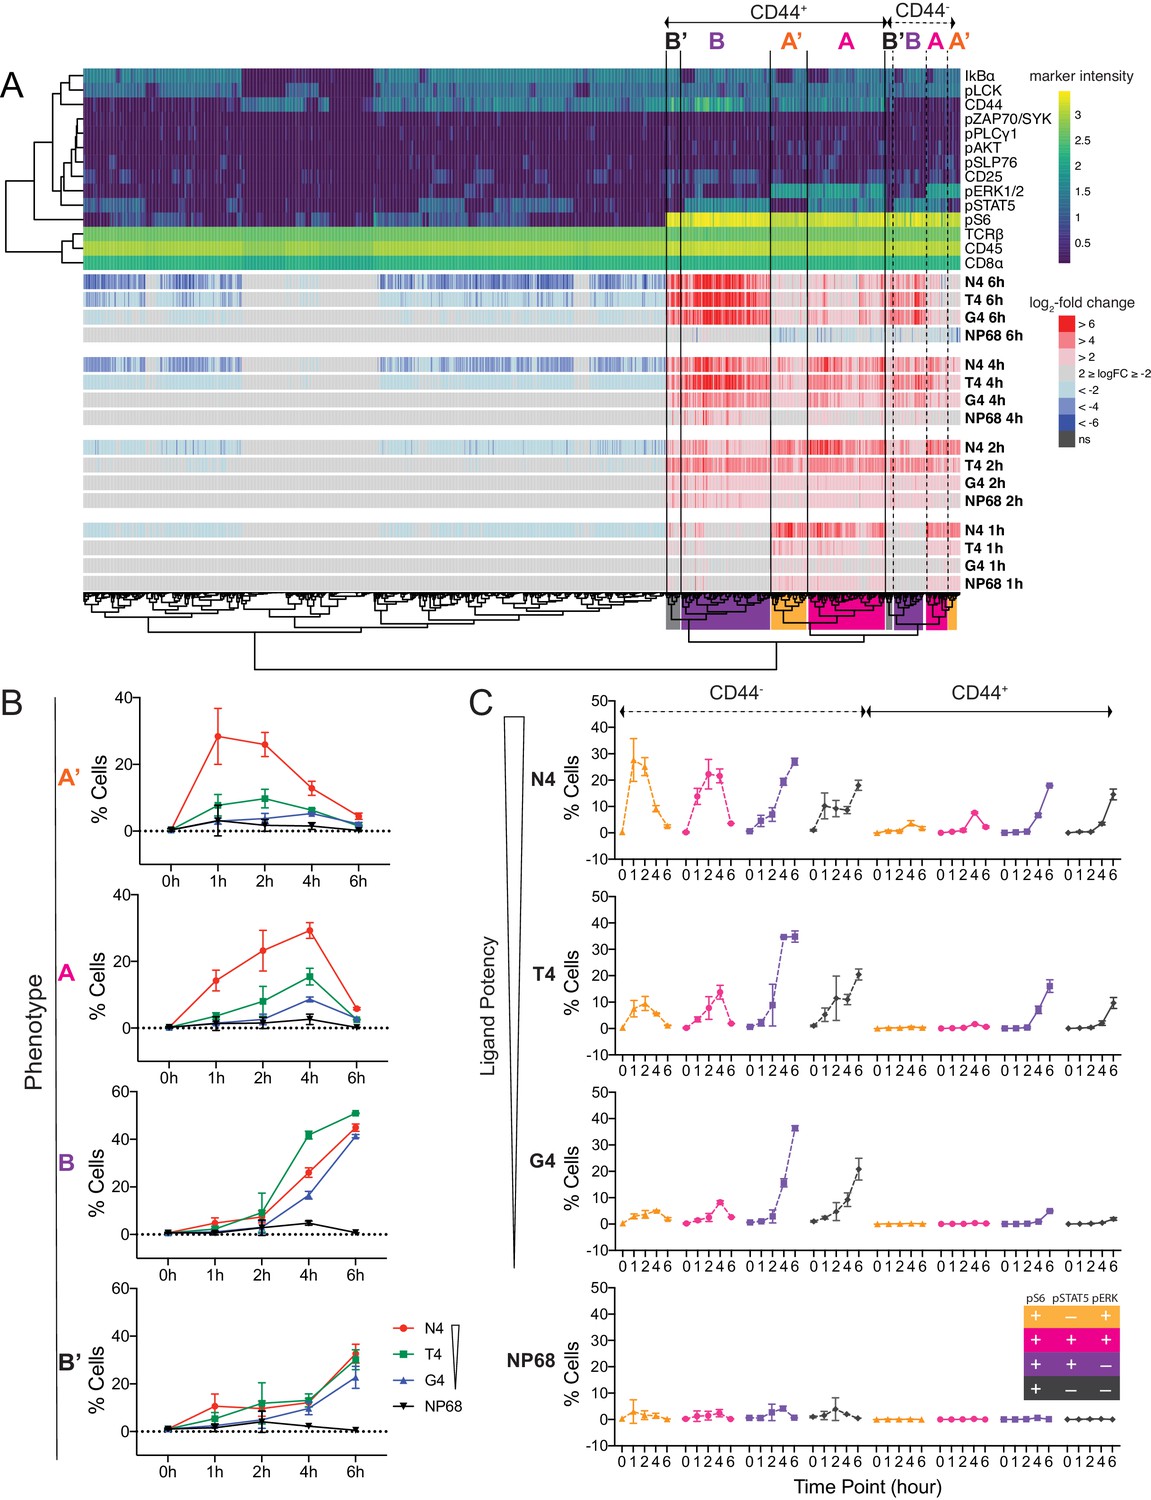
(a) Mass cytometry stimulation time courses were further investigated for multidimensional phenotypes that changed in abundance with stimulation. Analysis was run on two multiplexed biological replicates as described in Materials and methods. Phenotypic hyperspheres were defined within the multidimensional mass cytometry space and abundances of cells from each condition enumerated within each hypersphere. Each column in the heatmap represents an individual hypersphere. At the top of the heatmap, rows correspond to mass cytometry marker measurements with colour depicting the intensity of each marker in each hypersphere. Clustering by Pearson correlation was performed on these hypersphere marker intensity measurements. At the bottom of the heatmap, rows correspond to stimulation conditions with colour depicting the binned log2-fold change in cellular abundance in stimulated versus unstimulated conditions within each hypersphere. ns = hyperspheres that did not significantly change in abundance. Phenotypic clusters of interest, A, A’, B, B’, are indicated in both CD44+ and CD44- populations by coloured highlighting of the dendrogram. Statistics underlying the heatmap are provided in Supplementary file 5. (b) Percentages of cells exhibiting A, A’, B, and B’ phenotypes in mass cytometry measurements. Results are combined data from six biological replicates measured in two independent experiments as detailed in Supplementary file 1. Points represent the mean and error bars depict the SD. Data underlying plots are provided in Supplementary file 5. (c) Phenotypes as in (b) further sub-divided by CD44 expression.
Figure 4—figure supplement 1
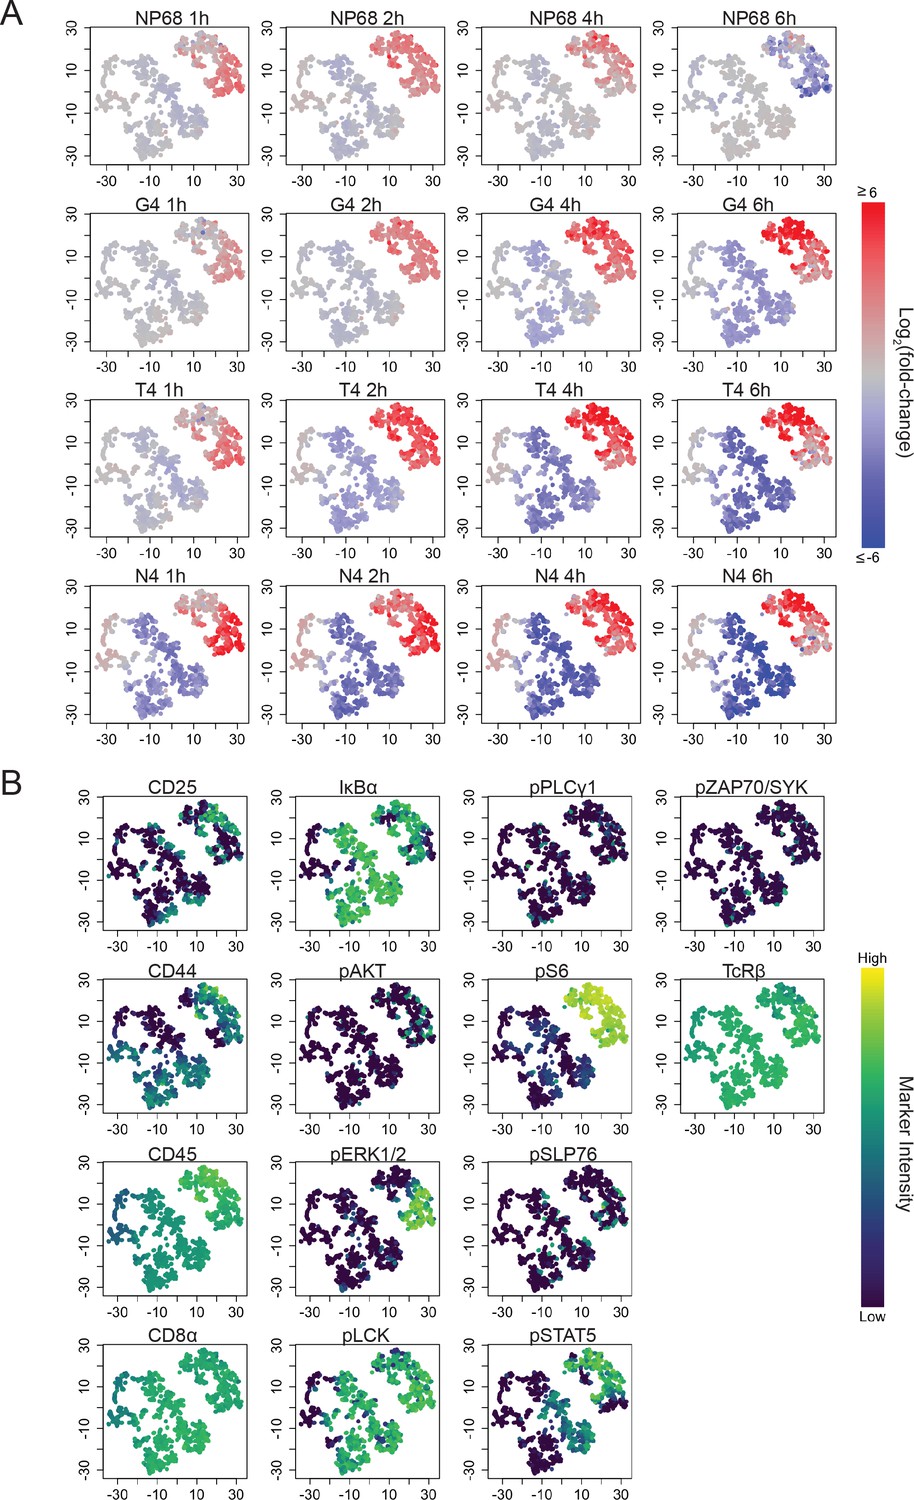
t-SNE visualization of significantly differentially abundant hyperspheres.
a) tSNE plots depict hyperspheres from Figure 4a. Colour indicates log2-fold change of cellular abundance in each stimulated condition versus unstimulated for each hypersphere. (b) As (a) with colour indicating the median intensity of each marker within each hypersphere. Underlying data are provided in Supplementary file 5.
Figure 4—figure supplement 2
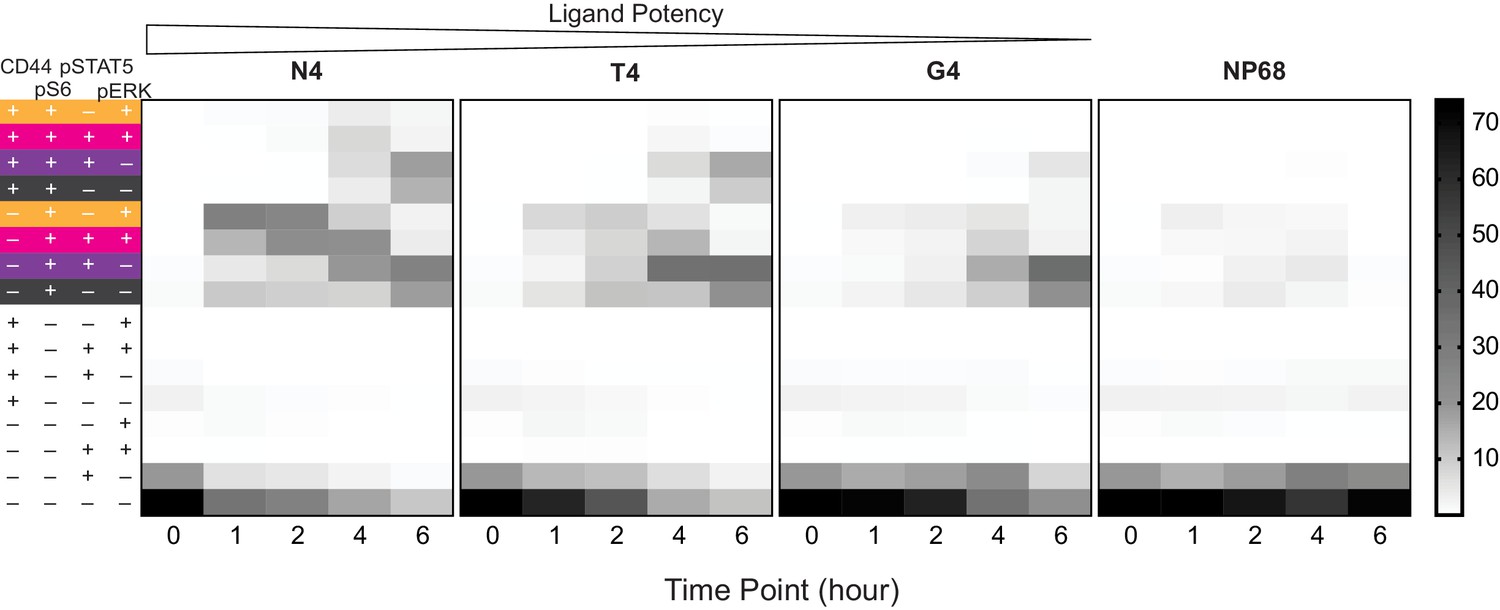
Heatmap of populations in Figure 4c including pS6-.
Data from Figure 4c, additionally including pS6- phenotypes, are plotted as a heatmap. Plots depict averages from six biological replicates measured in two independent experiments as detailed in Supplementary file 1.
Figure 5 with 1 supplement
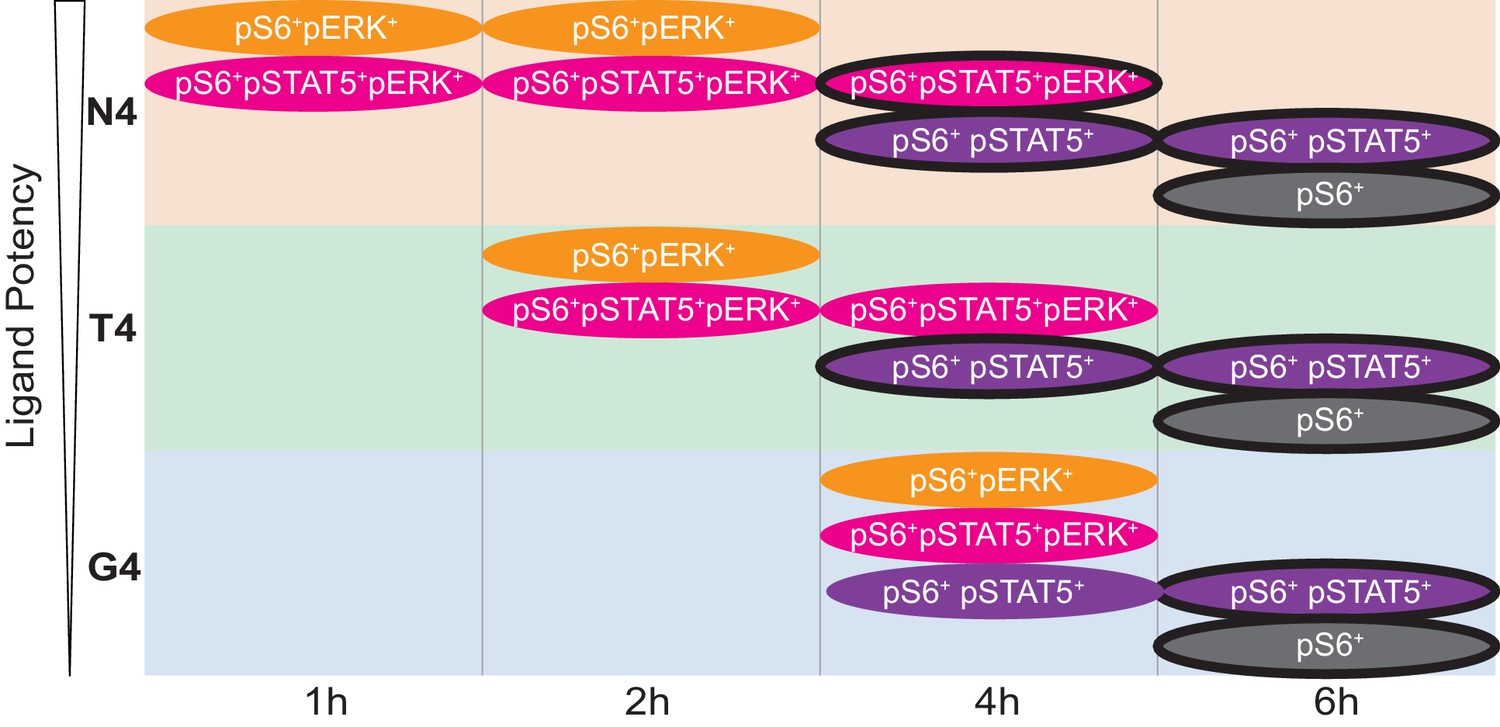
Cartoon Model.
Cartoon depicts the kinetics of the four main signalling phenotypes in cells stimulated with ligands of varying potencies (N4, T4, G4) over time from data in Figures 3a and 4 (note the transient pERK+ populations, even with G4). Black outlines indicate CD44+ populations.
Figure 5—figure supplement 1
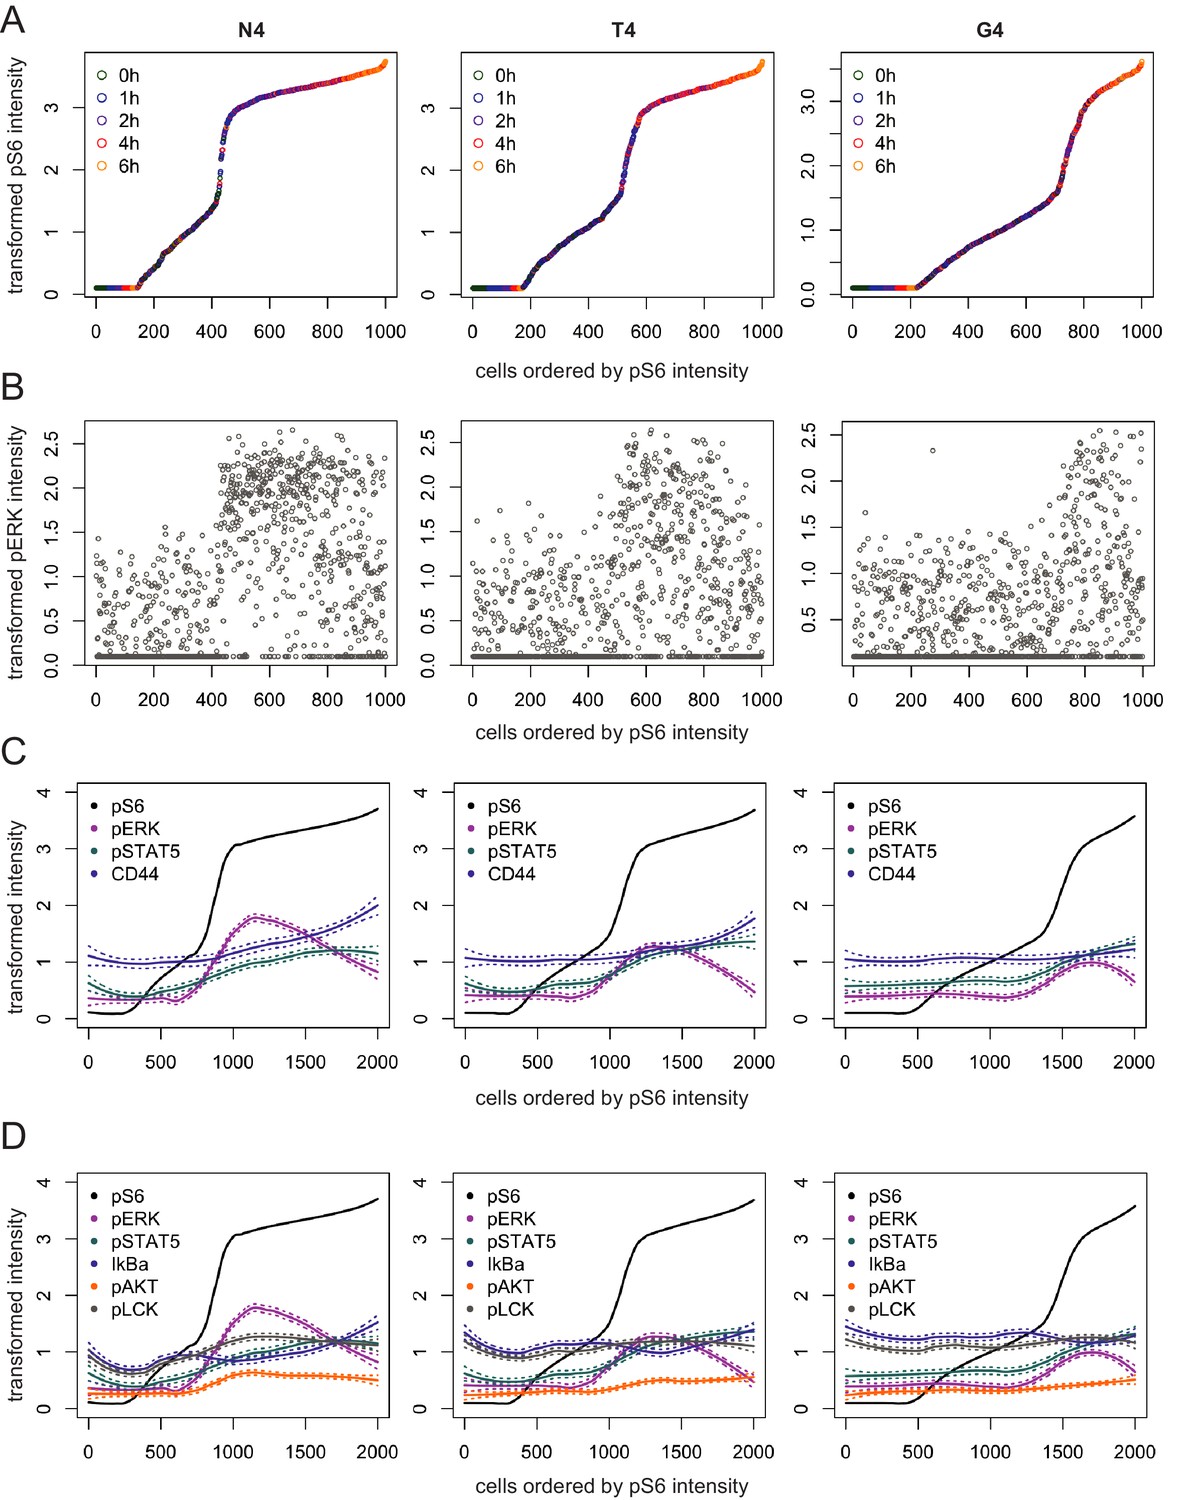
Activation trajectories for examining the order of signalling events.
(a) Mass cytometry data were grouped by biological replicate and stimulating ligand before constructing activation trajectories by ordering the cells according to pS6 intensity. Plots depict 1000 randomly sampled cells from an example replicate. Colours represent real times at which cells were sampled. (b) Example of pERK1/2 intensity measurements along the trajectories constructed in (a). (c) Loess curves were fitted to intensities of the indicated markers along the trajectories depicted in (a). Dotted lines represent the estimated standard error from the loess fits. (d) As (c) for additional signalling markers. Trajectories are representative of the four biological replicates that included at least three time points, measured in two independent experiments as detailed in Supplementary file 1.
Figure 6 with 1 supplement

Simultaneous measurement of phosphorylation of S6 and mRNA expression of transcription factors Nr4a1 and Irf8.
(a) Combined phosphoflow cytometry of pS6 and RNA flow cytometry of Nr4a1 and Irf8 transcripts in naïve OT-I CD8+ T cells stimulated with N4, T4, G4 or NP68 peptides for 2 hr, gated on single live cells in which the control gene Rpl39 was detected. (b) Frequency of phenotypes depicted in (a) after stimulation for 1, 2, 4 or 6 hr. Data are representative of 3 independent experiments.
Figure 6—figure supplement 1
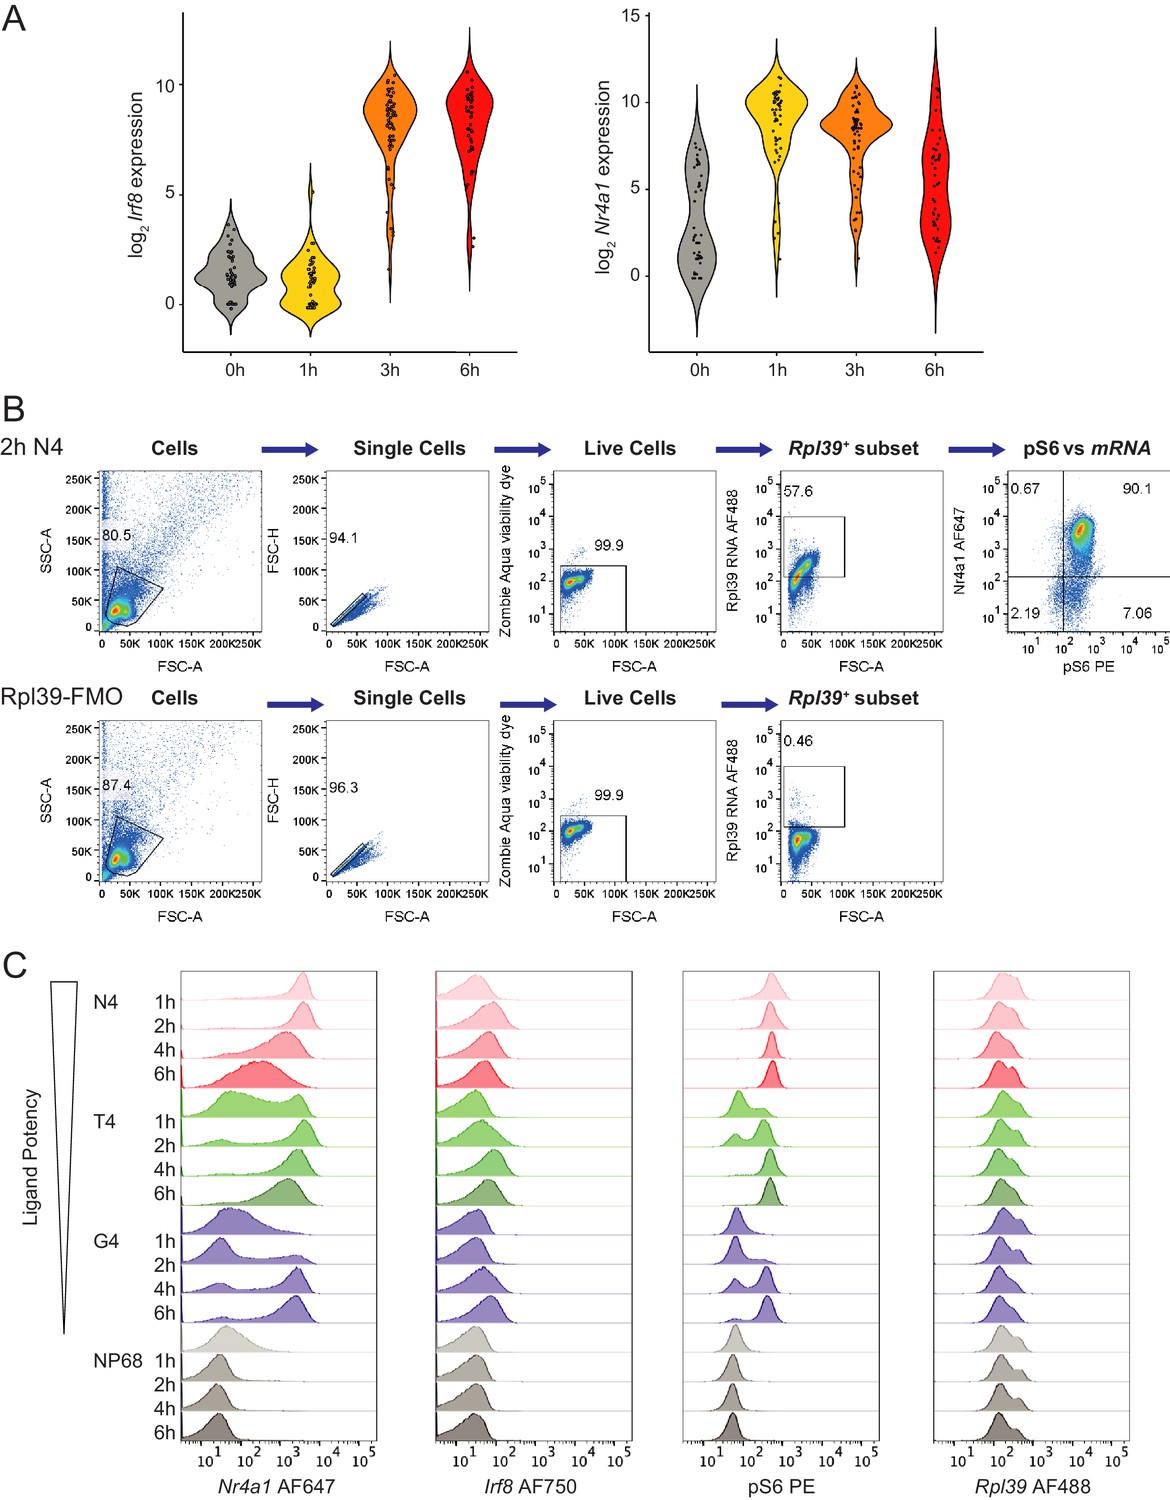
RNA flow cytometry gating strategy and histograms.
(a) Single cell RNA-seq of Irf8 and Nr4a1 expression after 0–6 hr stimulation with 1 μM N4 peptide from previously published data (Richard et al., 2018), ArrayExpress E-MTAB-6051, depicted as violin plots, with dots indicating individual cells. (b) Gating strategy for combined phosphoflow cytometry of pS6 and RNA flow cytometry: cells were gated on size, single cells, live cells and Rpl39+ cells, before examining Nr4a1, Irf8 and pS6 with gates based on fluorescence-minus-one stains. (c) As Figure 6, histograms depict flow cytometry measurements of Nr4a1, Irf8 and pS6 (gated on Rpl39+ cells), and the control mRNA Rpl39 (gated on live cells) over all time points measured. Data are representative of 3 independent experiments.
Figure 7 with 1 supplement
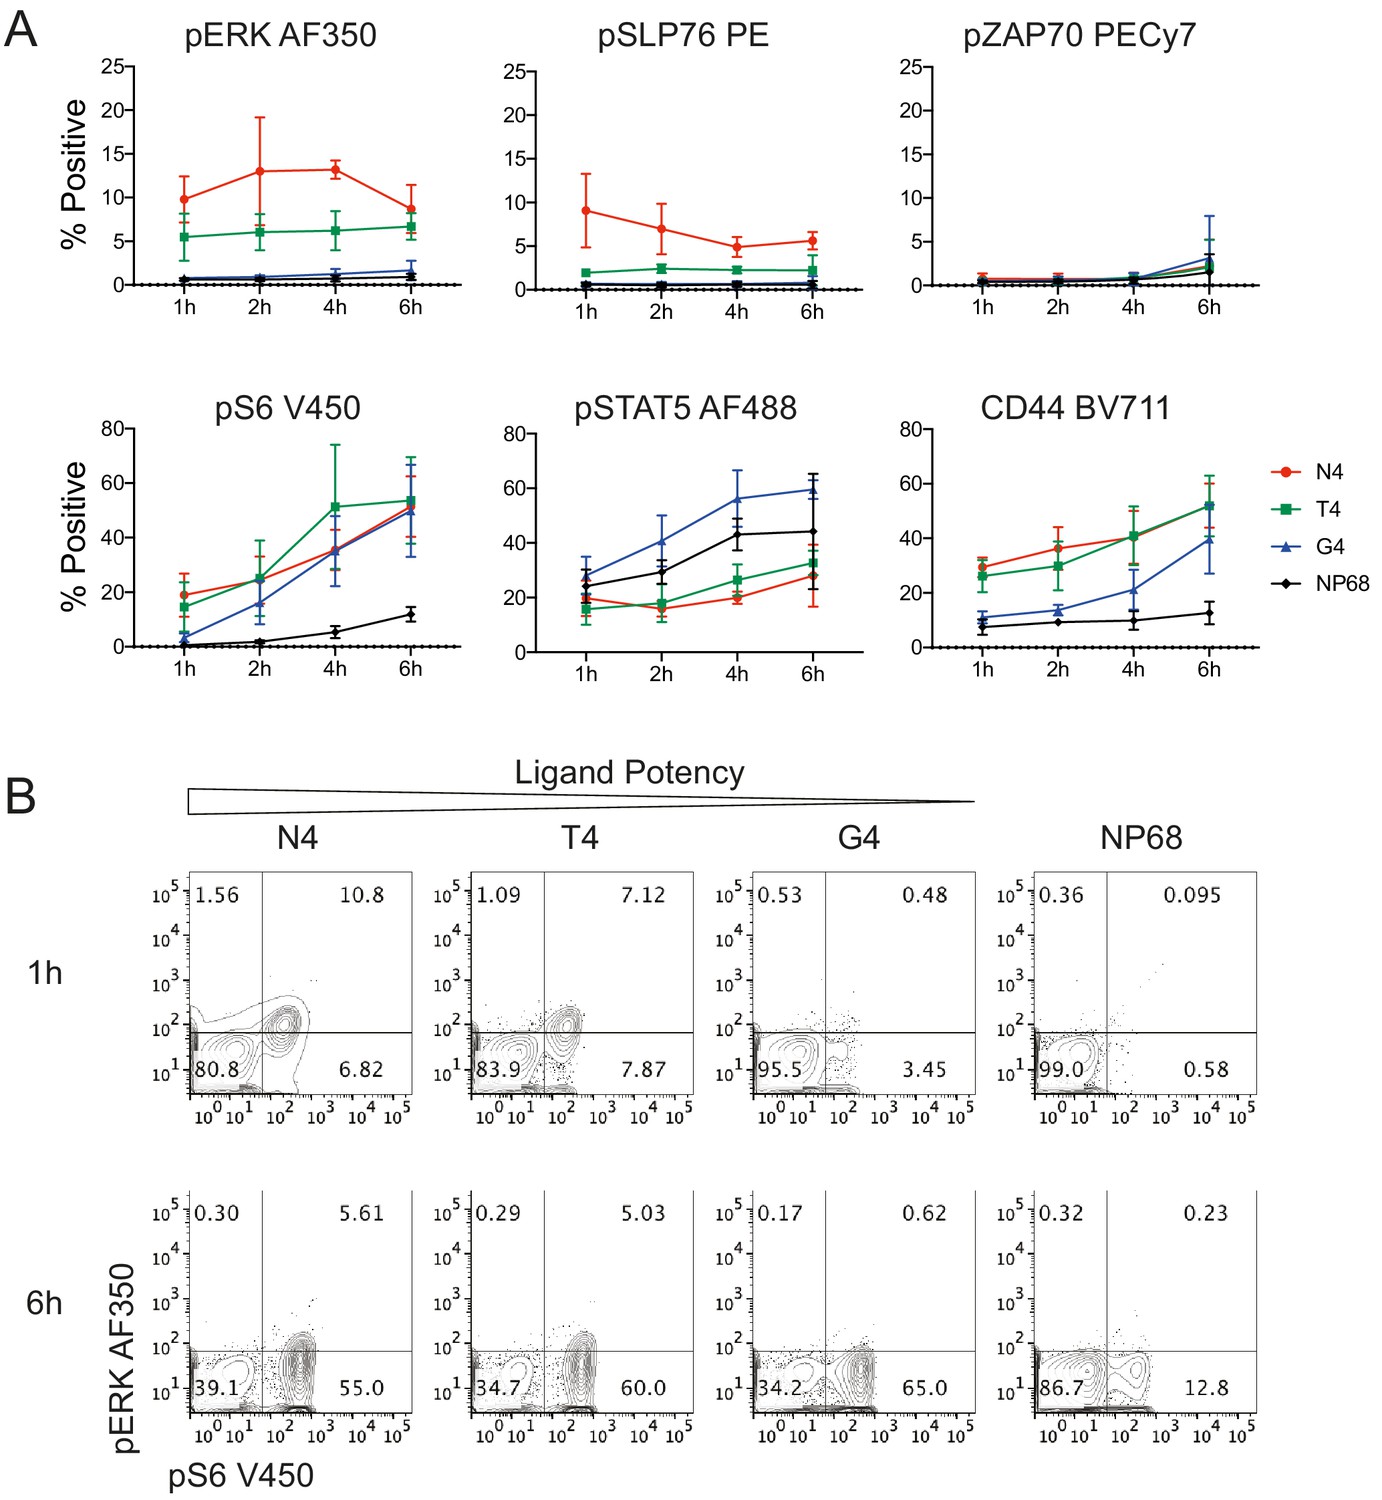
Signalling phenotypes in T cells stimulated with peptide-pulsed APCs.
(a) Naïve CD8+ T cells were stimulated with mature BMDCs loaded with peptides of various potencies for 1, 2, 4 and 6 hr before profiling by flow cytometry. The percentage of cells positive for each marker is plotted against time. Results depict combined data from three independent experiments. Points represent the mean and error bars depict the SD. (b) Example flow cytometry data from (a) of pERK1/2 and pS6 measured at 1 and 6 hr.
-
Figure 7—source data 1
Data underlying plots in Figure 7a.
- https://cdn.elifesciences.org/articles/53948/elife-53948-fig7-data1-v2.xlsx
Figure 7—figure supplement 1
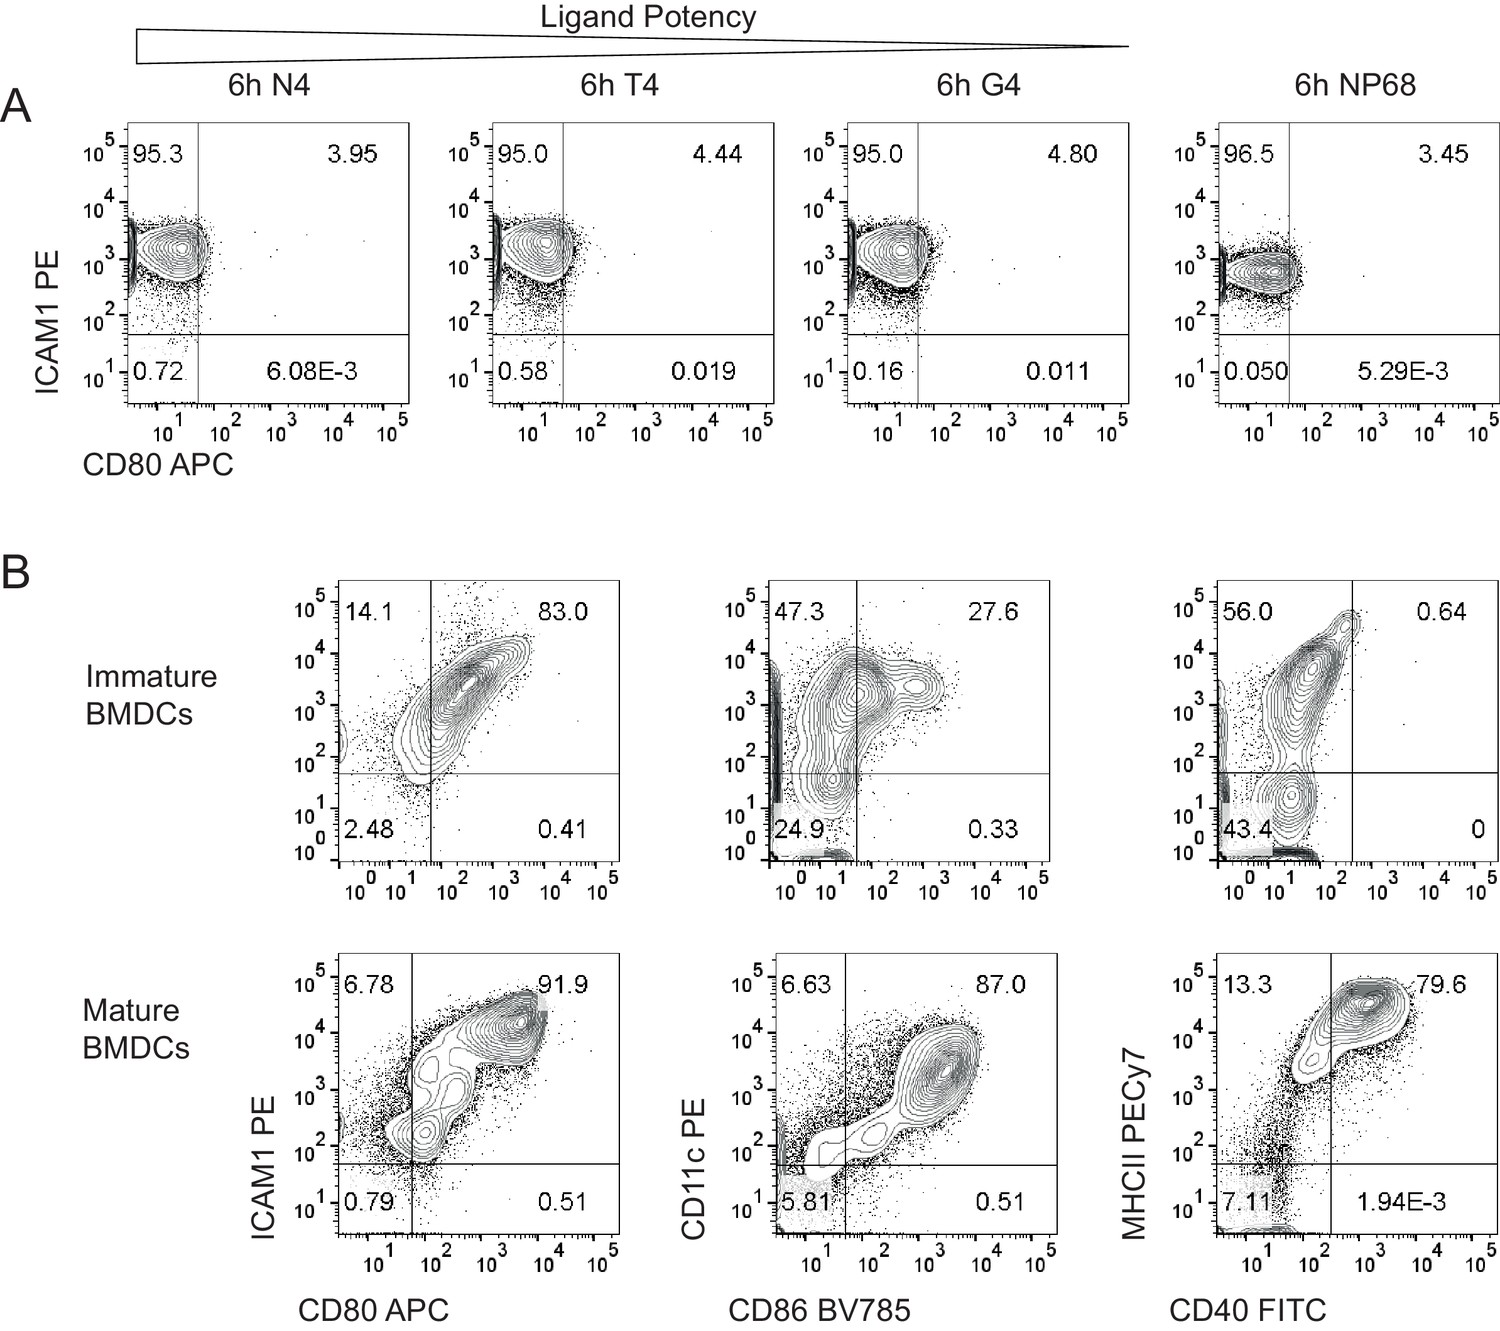
Expression of adhesion and costimulatory molecules on T cells and BMDCs.
(a) Expression of CD80 and ICAM-1 on T cells after 6 hr of stimulation with 1 μM of the indicated peptides. Results are representative of 3 biological replicates measured in two independent experiments. (b) Surface protein phenotyping of BMDCs before and after maturation for 1 day with LPS. Results are representative of 5 independent experiments.
Additional files
-
Supplementary file 1
Replicate structure.
Table details independent experiments, biological replicates and, where applicable, barcoding strategies.
- https://cdn.elifesciences.org/articles/53948/elife-53948-supp1-v2.xlsx
-
Supplementary file 2
Key Resources Table.
- https://cdn.elifesciences.org/articles/53948/elife-53948-supp2-v2.xlsx
-
Supplementary file 3
Antibodies for mass cytometry.
- https://cdn.elifesciences.org/articles/53948/elife-53948-supp3-v2.xlsx
-
Supplementary file 4
Antibody testing and specificity.
Antibody specificity tables detail experiments used to test and validate (a) antibodies targeting total proteins and (b-c) signalling proteins. Tables also include relevant references utilising these clones in knockout, knockdown, overexpression or small molecule inhibitor experiments.
- https://cdn.elifesciences.org/articles/53948/elife-53948-supp4-v2.xlsx
-
Supplementary file 5
Mass cytometry figure underlying data.
Tables provide means and standard deviations of kinetics curves depicted in Figures 3a and 4b–c, and Figure 3—figure supplement 2a, as well as summary statistics from hypersphere differential abundance testing depicted in Figure 4a and Figure 4—figure supplement 1.
- https://cdn.elifesciences.org/articles/53948/elife-53948-supp5-v2.xlsx
-
Transparent reporting form
- https://cdn.elifesciences.org/articles/53948/elife-53948-transrepform-v2.docx
Download links
A two-part list of links to download the article, or parts of the article, in various formats.
Downloads (link to download the article as PDF)
Open citations (links to open the citations from this article in various online reference manager services)
Cite this article (links to download the citations from this article in formats compatible with various reference manager tools)
Stimulation strength controls the rate of initiation but not the molecular organisation of TCR-induced signalling
eLife 9:e53948.
https://doi.org/10.7554/eLife.53948


