Sleep is bi-directionally modified by amyloid beta oligomers
- Department of Cell and Developmental Biology, UCL, United Kingdom
- Centre for Prions & Protein Folding Disease, University of Alberta, Canada
- Department of Biological Sciences, University of Alberta, Canada
Figures
Figure 1 with 4 supplements
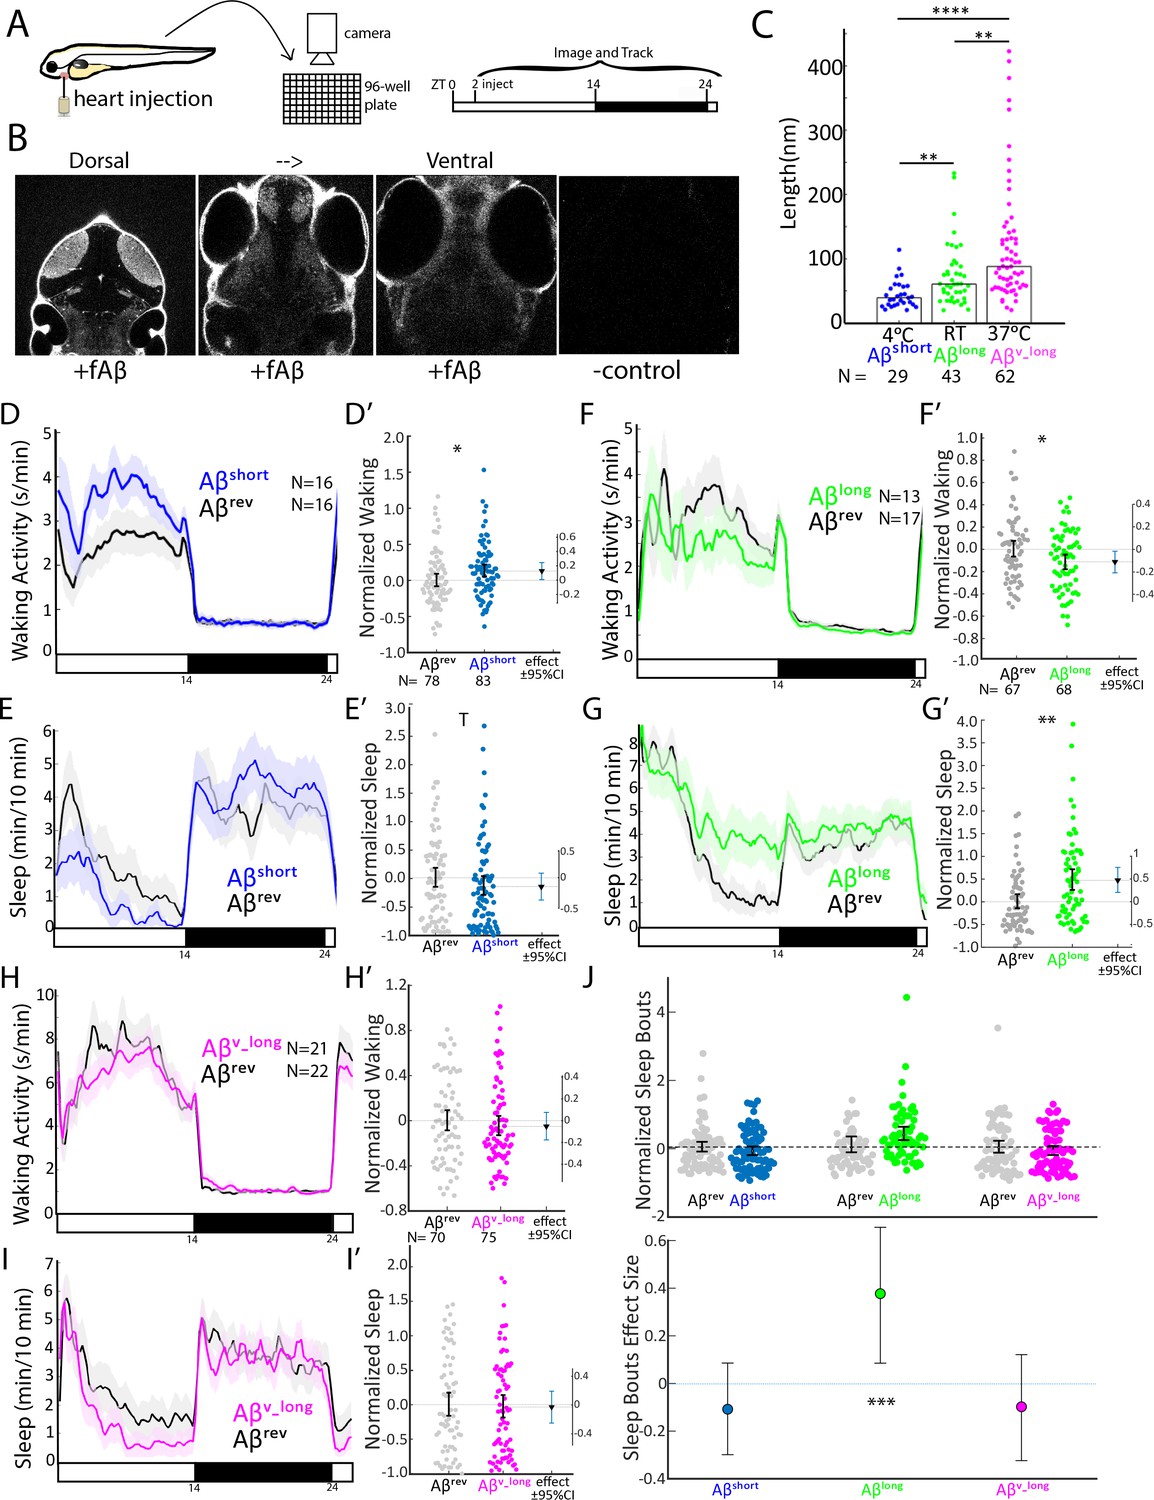
Aβ oligomers bi-directionally affect sleep and wake in zebrafish larvae.
(A) Experimental schematic. Aβ was injected into the heart of 5 dpf larvae in the morning (ZT2 = zeitgeber time 2, that is 2hr after lights on). Behavior was then monitored in a square-welled 96-well plate for 24–48 hr on a 14 hr:10 hr light:dark cycle. (B) Heart-injected HiLyteTM Fluor 647-labeled Aβ42 (fAβ) penetrated the whole larval brain as visualized by confocal microscopy (optical sections, dorsal view) taken 2 hr after injection. Anterior is to the top. (C) Aβ prepared under increasing temperatures adopted longer oligomeric lengths, as measured by transmission electron microscopy. Each dot is a single oligomer (N = number measured), and the bars show the median. Data was taken from five randomly selected micrographs from two independent experiments. **p≤0.01, ****p≤1×10⁻⁷ Kruskal-Wallis, Tukey-Kramer post-hoc test. (D, E) Exemplar 24 hr traces post-injection comparing the effect of Aβshort (blue) on average waking activity (D) and sleep (E) versus Aβrev controls (grey). Ribbons represent ±the standard error of the mean (SEM). Light and dark bars indicate the lights ON and lights OFF periods, respectively. N = the number of larvae in each condition. (D’, E’) The effect of Aβshort relative to Aβrev on waking (D’) and sleep (E’) during the first day is shown, pooled from n = 5 independent experiments. Each dot represents a single larva normalized to the mean of the Aβrev control, and error bars indicate ± SEM. The mean difference effect size and 95% confidence interval is plotted to the right. *p<0.05, Tp <0.1, one-way ANOVA. (F, G) Exemplar 24 hr traces post-injection comparing the effect of Aβlong (green) on average waking activity (F) and sleep (G) versus Aβrev controls (grey). (F’, G’) The effect of Aβlong relative to Aβrev on waking (F’) and sleep (G’) during the first day is shown, pooled from n = 4 independent experiments. *p<0.05, **p<0.01, one-way ANOVA. (H, I) Exemplar 24 hr traces post-injection comparing the effect of Aβv_long (magenta) on average waking activity (H) and sleep (I) versus Aβrev peptide controls (grey). (H’, I’) The effect of Aβv_long relative to Aβrev on waking (H’) and sleep (I’) during the first day is shown, pooled from n = 3 independent experiments. (J) The effect of different Aβ preparations on the number of sleep bouts relative to Aβrev controls. The difference effect size and 95% confidence interval is plotted below. The asterisks indicate statistically significant different effects among the preps (***p<0.001, one-way ANOVA). See also Figure 1—figure supplements 1–3.
Figure 1—figure supplement 1
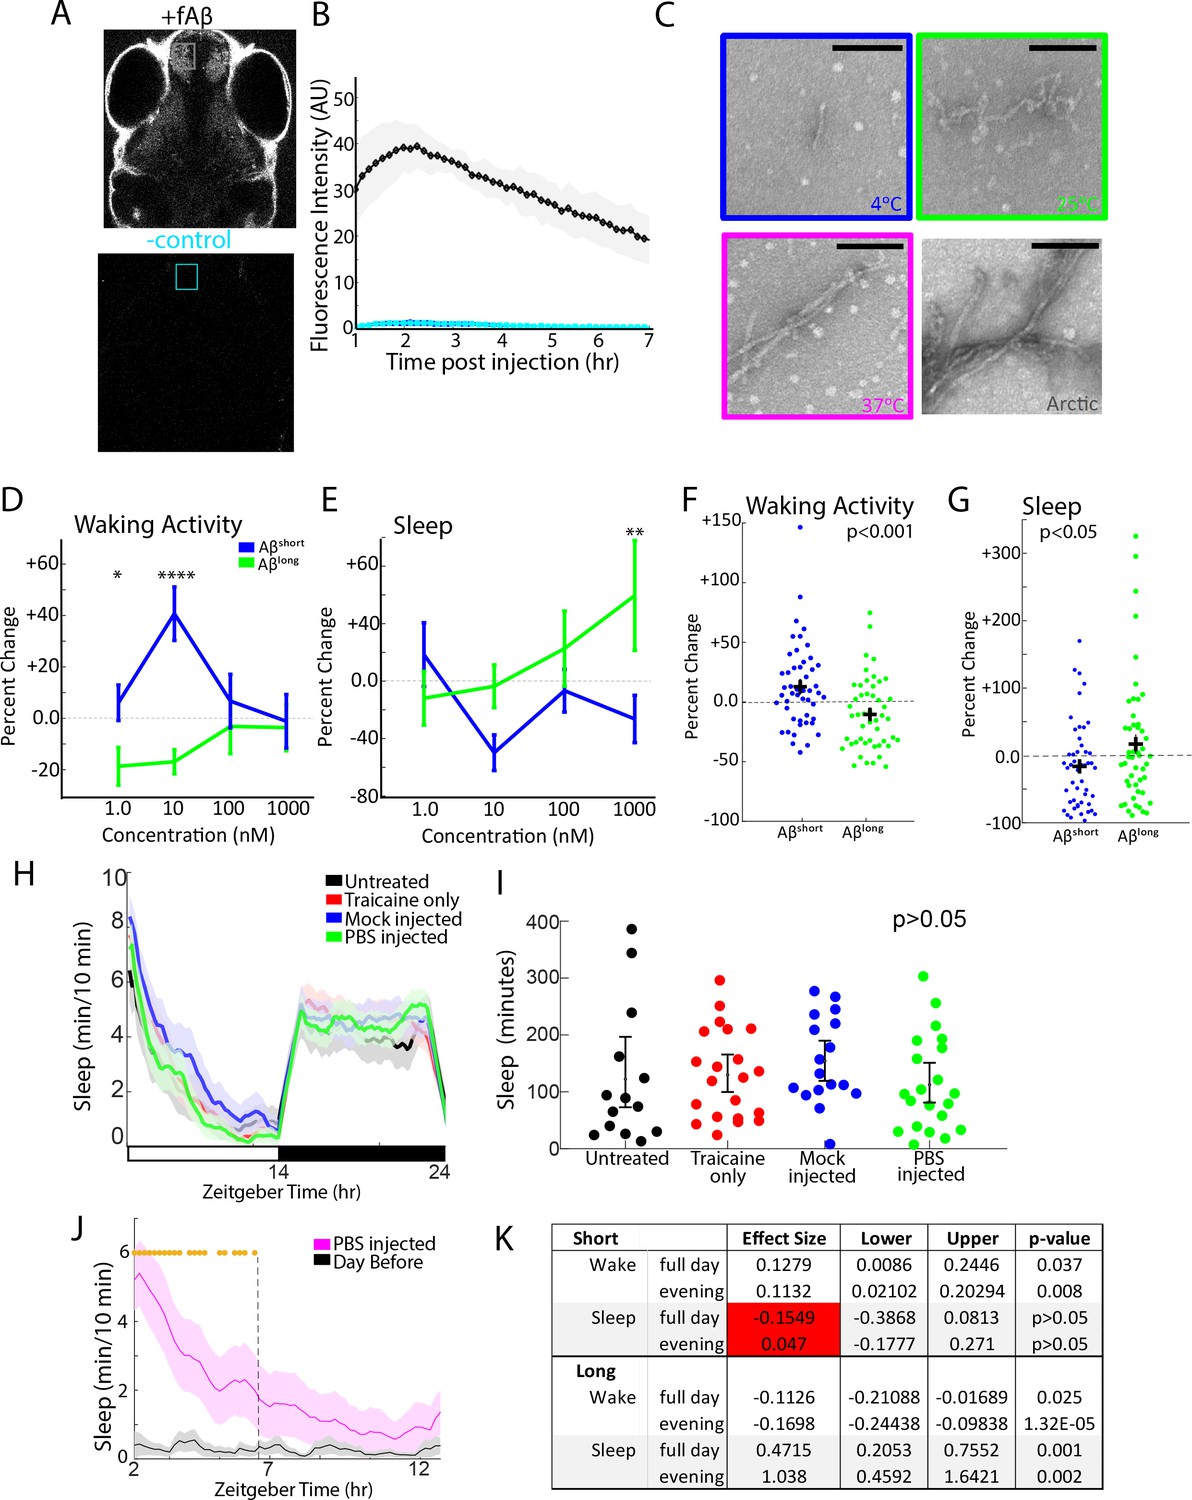
Aβ oligomers exert dose-dependent, short-term effects on zebrafish sleep.
(A) Same images from Figure 1B, highlighting the region of interest in the telencephalon for fluorescence intensity measurements in B. Anterior is to the top, dorsal view. (B) Heart-injected fluorescently-tagged Aβ (black) penetrates the brain within 1 hr and peaks in concentration 2–3 hr post-injection. Cyan shows background fluorescence of a negative control. The shaded area shows ± standard deviation from three independent injections. (C) Electron micrographs of Aβ oligomers formed after 24 hr incubation at 4°C, 25°C, and 37°C. Aβarctic was incubated at 25°C for 2 hr as a positive control. The color code is used throughout the main and supplementary figures. Scale bar = 100 nm (D) The Aβshort (blue) and Aβlong (green) have opposing, dose-dependent effects on average waking activity, normalized to Aβrev injections. The error bars represent ±the SEM. doseXprep interaction *p≤0.05, ****p≤0.0001 two-way ANOVA, Fisher’s least significant difference post hoc test. p≤0.001, prep effect (plotted in F). (E) Aβshort (blue) and Aβlong (green) have opposing, dose-dependent effects on sleep. doseXprep interaction, two-way ANOVA, *p≤0.05, Fisher’s least significant difference post hoc test. p≤0.05, prep effect (plotted in G). Based on the data in D-E, 10 nM was chosen as the concentration for all subsequent Aβ injection experiments. (F) The waking activity for each larva in D, normalized to Aβrev injections and plotted to emphasize the significant effect of the preparation irrespective of dose (p<0.001, two-way ANOVA). (G) Sleep for each larva in E normalized to Aβrev injections and plotted to emphasize the significant effect of the preparation (p<0.001, two-way ANOVA). (H) Sleep plot of untreated WT (black), anesthetized only (red), mock injected (blue) and PBS injected (green) fish on a 14 hr:10 hr light:dark cycle (indicated by the white and black bars). The ribbons represent ±the SEM. (I) Sleep for each larva in H (WT (black), anesthetised only (red), mock injected (blue) and PBS injected (green)) shows that there is no statistical difference in sleep due to any of the manipulations (p>0.05, one-way ANOVA). (J) Sleep plot after vehicle injection (PBS, magenta trace) and immediate tracking compared to larvae that had acclimated to the apparatus for 24 hr (black trace). The ribbons represent ±the SEM. Gold stars flag significantly different timepoints (p<0.05, repeated measures ANOVA) and were used to determine the window for calculating the evening-only effects of Aβ injections. (K) Calculating Aβ injection effects across the whole day or only in the evening window (data from Figure 1) has minimal effect on the analysis of Aβshort or Aβlong. The only exception (red shading) is for the reduction in sleep by Aβshort, due to a flooring effect.
Figure 1—figure supplement 2
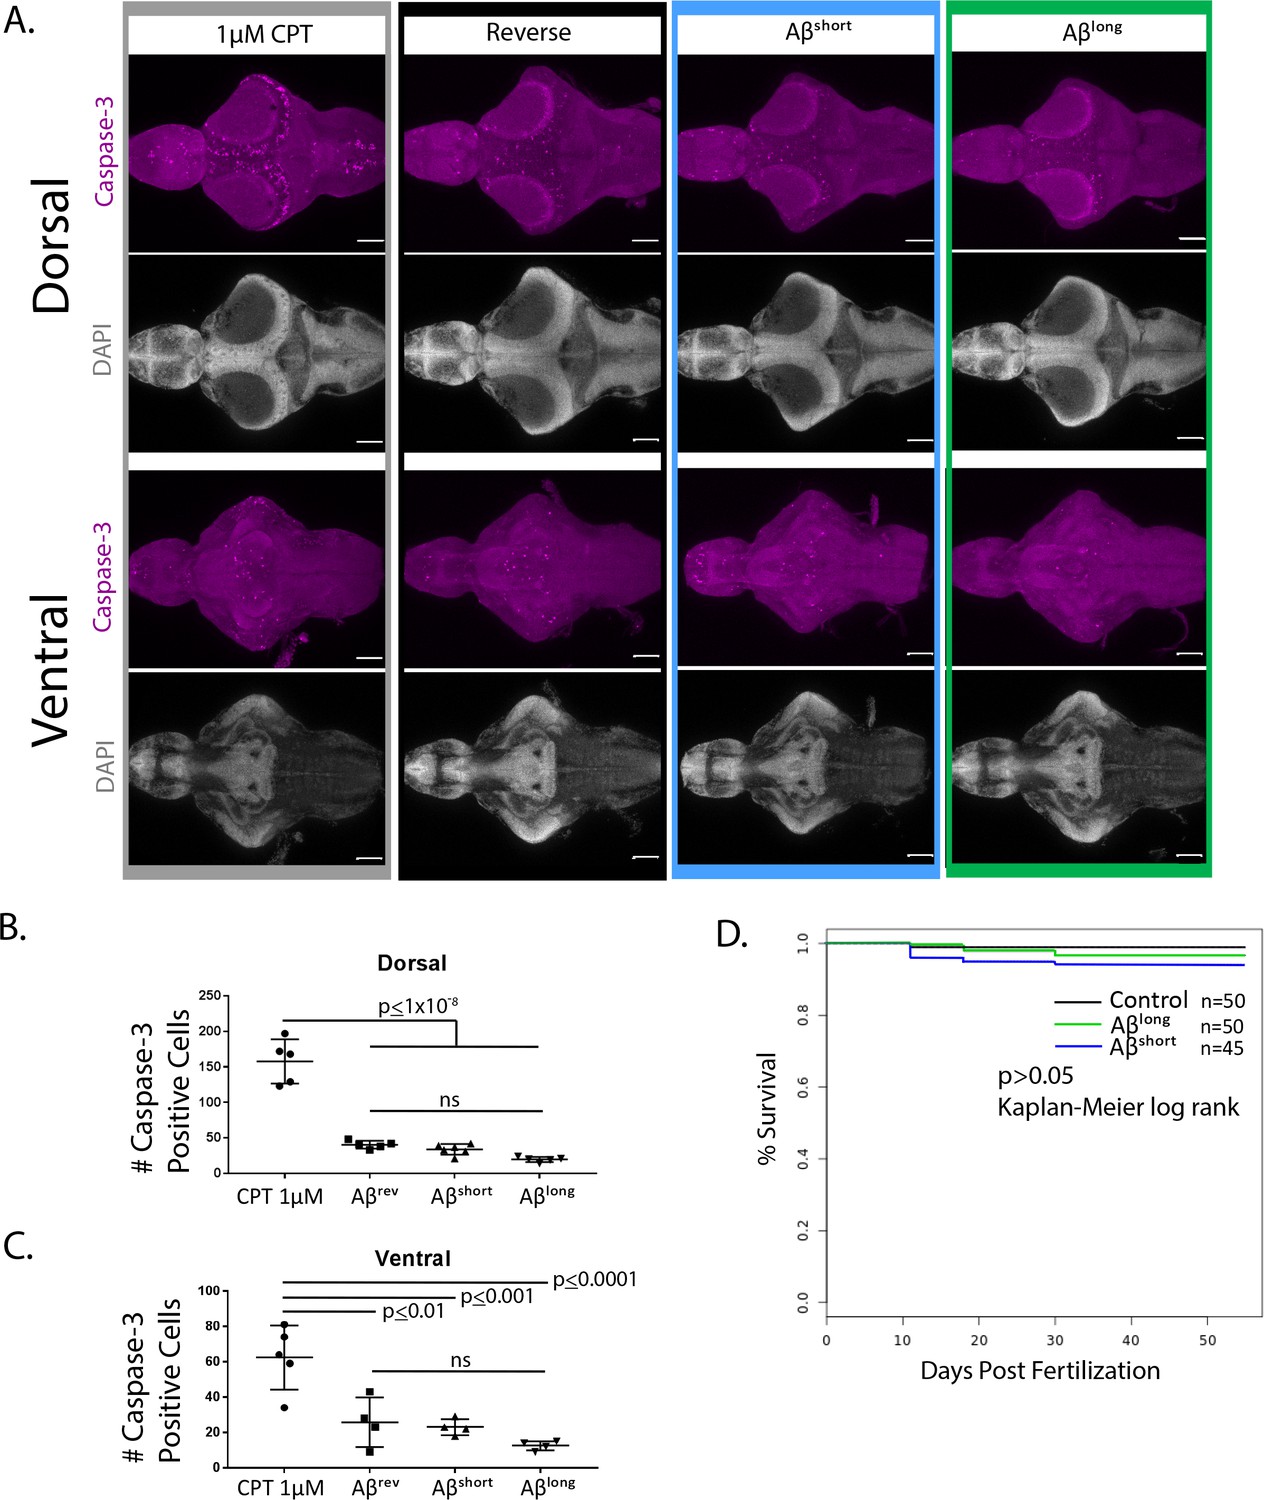
Aβ exposure does not increase neuronal cell death and does not alter survival into adulthood.
(A) Dorsal and ventral views of representative 5 dpf larval brains stained for Caspase-3 activation (purple) to map apoptosis. Exposure to the topoisomerase inhibitor camptothecin (CPT, 1 µM), which induces apoptosis, serves as a positive control. DAPI stains nuclei in white for reference. Anterior is to the left. Scale bar = 100 µm (B,C) Quantification of the number of Caspase-3-positive cells after exposure to 1 µM CPT or Aβ oligomer injections (n = 5 brains for each condition, B-dorsal, C-ventral). Only CPT significantly increased apoptosis relative to Aβrev. ns, p>0.05, one-way ANOVA, Tukey’s post-hoc test. (D) Survival curves to adulthood after 5dpf injection of Aβ oligomers. There are no significant differences among survival curves, p>0.05, Kaplan-Meier log rank test.
Figure 1—figure supplement 3
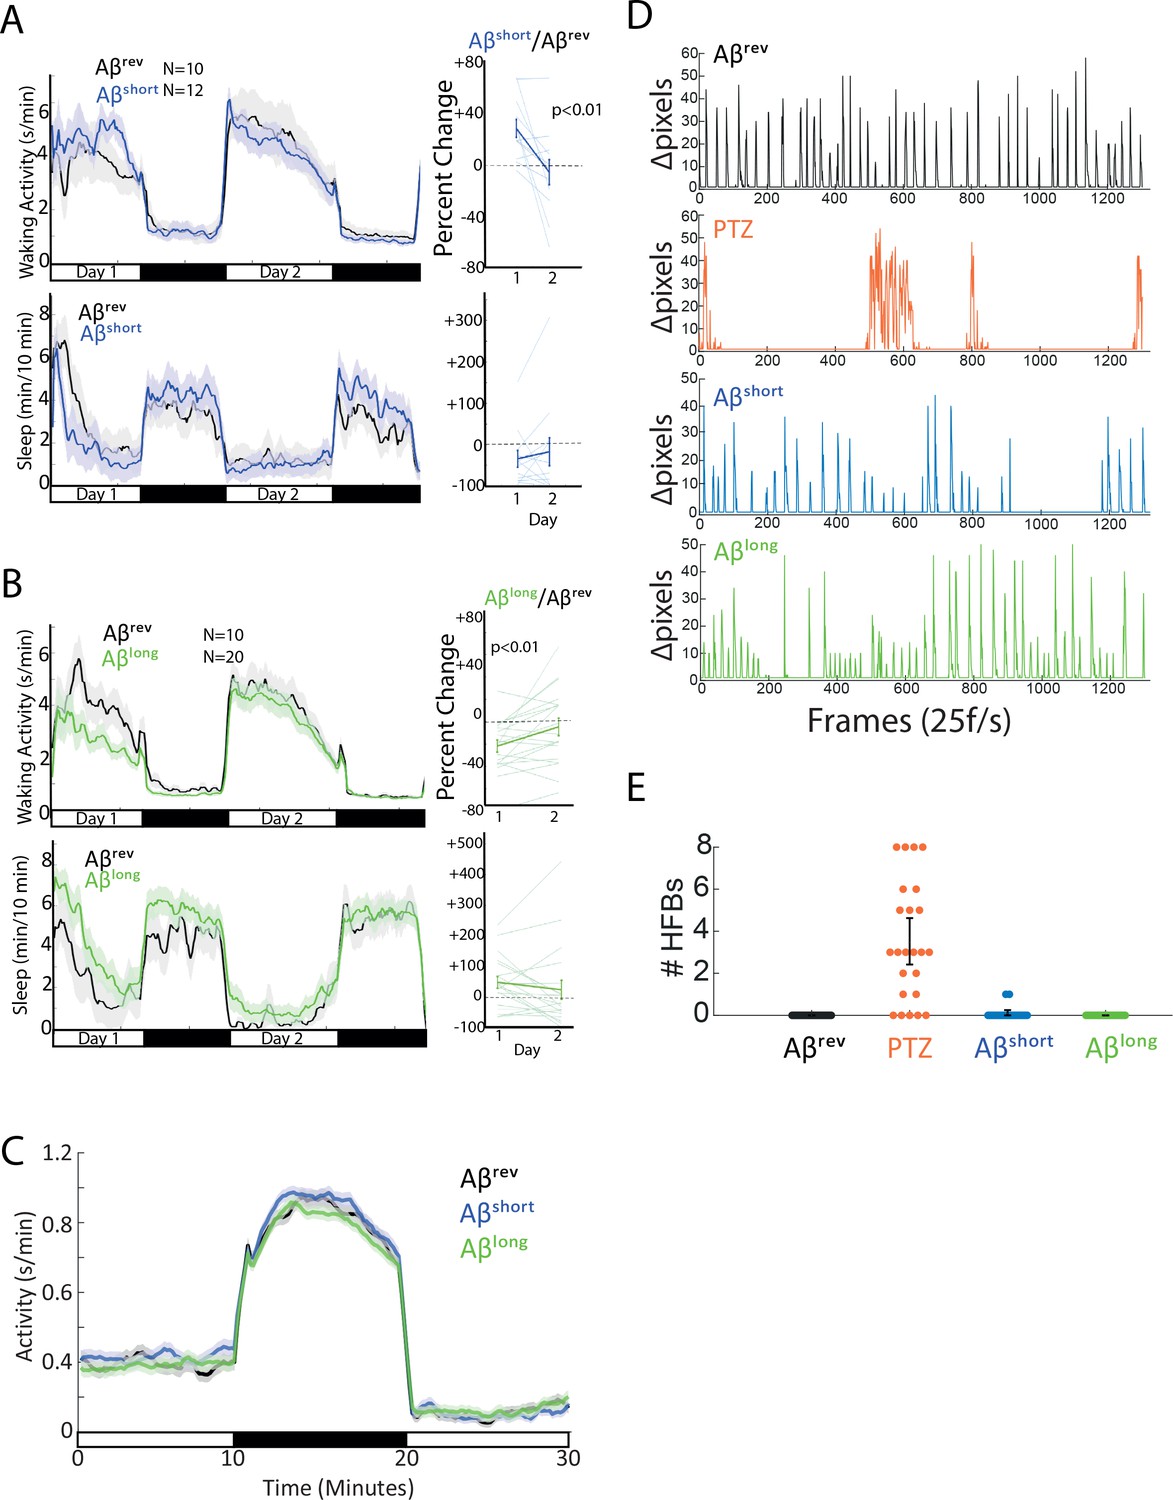
Aβ-injected larvae recover after 24 hr and do not exhibit seizure-like or sickness behavior.
(A–B) The effects of Aβshort (A) and Aβlong (B) on waking activity (top) and sleep (bottom) return to baseline after 24 hr. Shown in A and B are traces for 48 hr post-injection on a 14 hr:10 hr light:dark cycle (indicated by the white and black bars). The ribbons represent ±the SEM. Plotted on the right are the percent change induced by Aβ relative to Aβrev for day 1 versus day 2, demonstrating that these parameters return to baseline (*p≤0.01, paired t-test). Each line represents a single larva, the thicker line represents the mean ± SEM. (C) Activity traces of Aβshort (blue), Aβlong (green), and Aβrev (black) during and after a ten minute dark pulse are indistinguishable. Traces are for a 10 min:10 min:10 min light:dark:light window (indicated by the white and black bars). The ribbons represent ±the SEM. (D) The effects of Aβrev (black), convulsant PTZ (10 mM, orange), Aβshort (blue), and Aβlong (green) on sub-second larval bout structures. Shown are delta pixel movement of one representative larva in each group for ~1 min (see Figure 1—video 1). Unlike PTZ treated larvae, Aβ injected larvae have normal bout structures. Representative larvae were chosen to also highlight that, while overall Aβlong injected larvae are less active, individual animals can have sustained periods of heightened activity. Similarly, individual Aβshort injected animals can exhibit periods of relatively dampened activity. (E) The effects of Aβrev (black), convulsant PTZ (10 mM, orange), Aβshort (blue) and Aβlong (green) on high-frequency bouts (HFB) in a 5 min interval. Each dot represents a single larva. PTZ-induced HFB’s is non-existent or very rare in the other groups (n = 24 for all groups).
Figure 1—video 1
Aβ does not induce seizures.
Figure 2
Aβ oligomers differentially alter neuronal activity in the larval zebrafish brain.
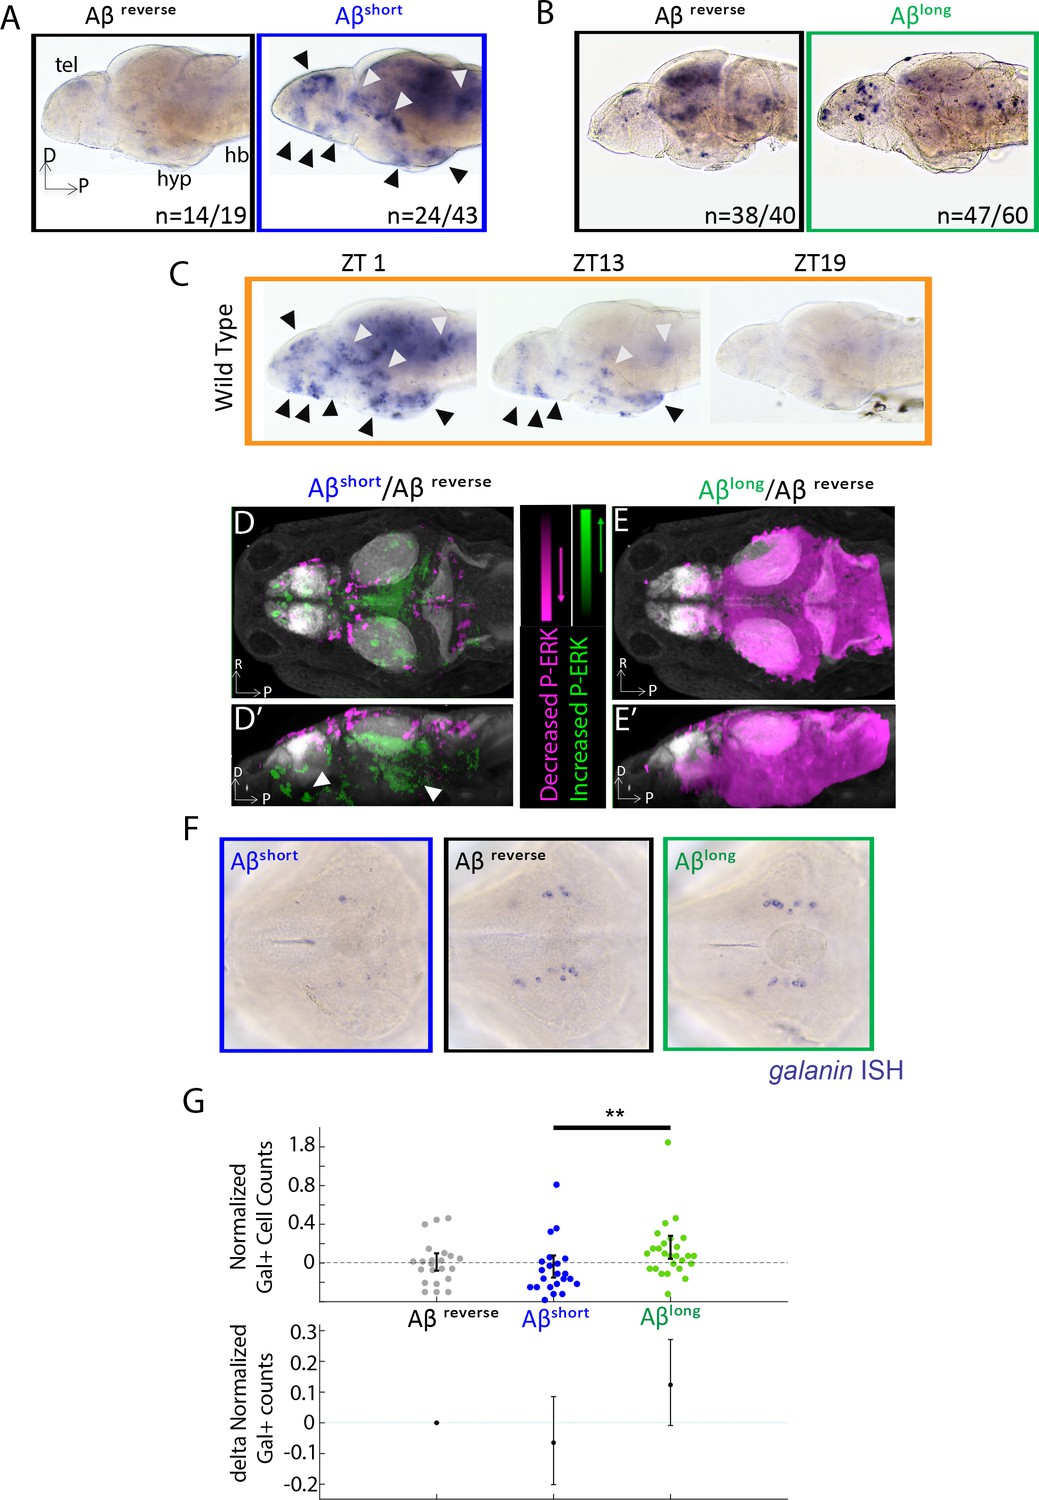
(A) As detected by ISH, the immediate early gene c-fos is upregulated in many larval brain areas following Aβshort injection, including the dorsal and ventral telencephalon (tel) and the posterior hypothalamus (black arrowheads), relative to Aβrev control injections. Other upregulated areas in the midbrain and hindbrain are indicated (white arrowheads). hyp- hypothalamus; hb- hindbrain. D = dorsal, p=Posterior, R = Right. n = blind counts of brains with the shown expression pattern/total brains. 24/43 stringently counts only brains with the major areas upregulated. (B) Compared to Aβrev injections, Aβlong oligomers induce less c-fos expression. The Aβrev and Aβlong treated brains were stained longer than in (A) to ensure detection of weaker c-fos expression. n = blind counts of number of brains with the shown expression/total brains. (C) c-fos is upregulated in many larval brain areas at 10 am (ZT1) awake fish, including the dorsal and ventral telencephalon and the posterior hypothalamus (black arrowheads), and other discrete regions of the mid and hindbrain (white arrowheads). c-fos expression is downregulated in later timepoints (ZT13) and is very low in ZT19 brains, when larvae are predominantly asleep. N = 10 fish/timepoint. (D, D’) Brain expression of the neuronal activity correlate pERK/tERK comparing Aβshort (n = 6) to Aβrev (n = 5) injected larvae identified areas upregulated (green) and downregulated (magenta) by Aβshort. Data are shown as a thresholded maximum projection overlaid on the Z-Brain Atlas tERK reference (gray). White arrowheads indicate regions in the ventral telencephalon and posterior hypothalamus that are upregulated similar to c-fos in (A). Dorsal view in (D), lateral view in (D’). (E, E’) pERK/tERK expression after Aβlong injections (n = 7) shows widespread downregulation of neuronal activity (magenta) compared to Aβrev controls (n = 7), consistent with c-fos data in (B). Dorsal view in (E), lateral view in (E’). (F) As detected by ISH, the number and intensity of hypothalamic galanin-positive neurons are downregulated following Aβshort injection and upregulated following Aβlong injection, relative to Aβrev control injections. Representative images from N = 22–24 per condition. (G) Normalized, blinded counts of hypothalamic galanin-positive cell numbers 4–6 hr after Aβshort and Aβlong injections, relative to Aβrev. Error bars indicate ± SEM. The mean difference effect size and 95% confidence interval is plotted at the bottom. **p<0.01, one-way ANOVA. See also Figure 2—source datas 1 and 2.
-
Figure 2—source data 1
MAP-Mapping of brain areas that are significantly up- and down-regulated in P-ERK levels in response to Aβshort.
- https://cdn.elifesciences.org/articles/53995/elife-53995-fig2-data1-v1.xlsx
-
Figure 2—source data 2
MAP-Mapping of brain areas that are significantly up- and down-regulated in P-ERK levels in response to Aβlong.
- https://cdn.elifesciences.org/articles/53995/elife-53995-fig2-data2-v1.xlsx
Figure 3 with 2 supplements
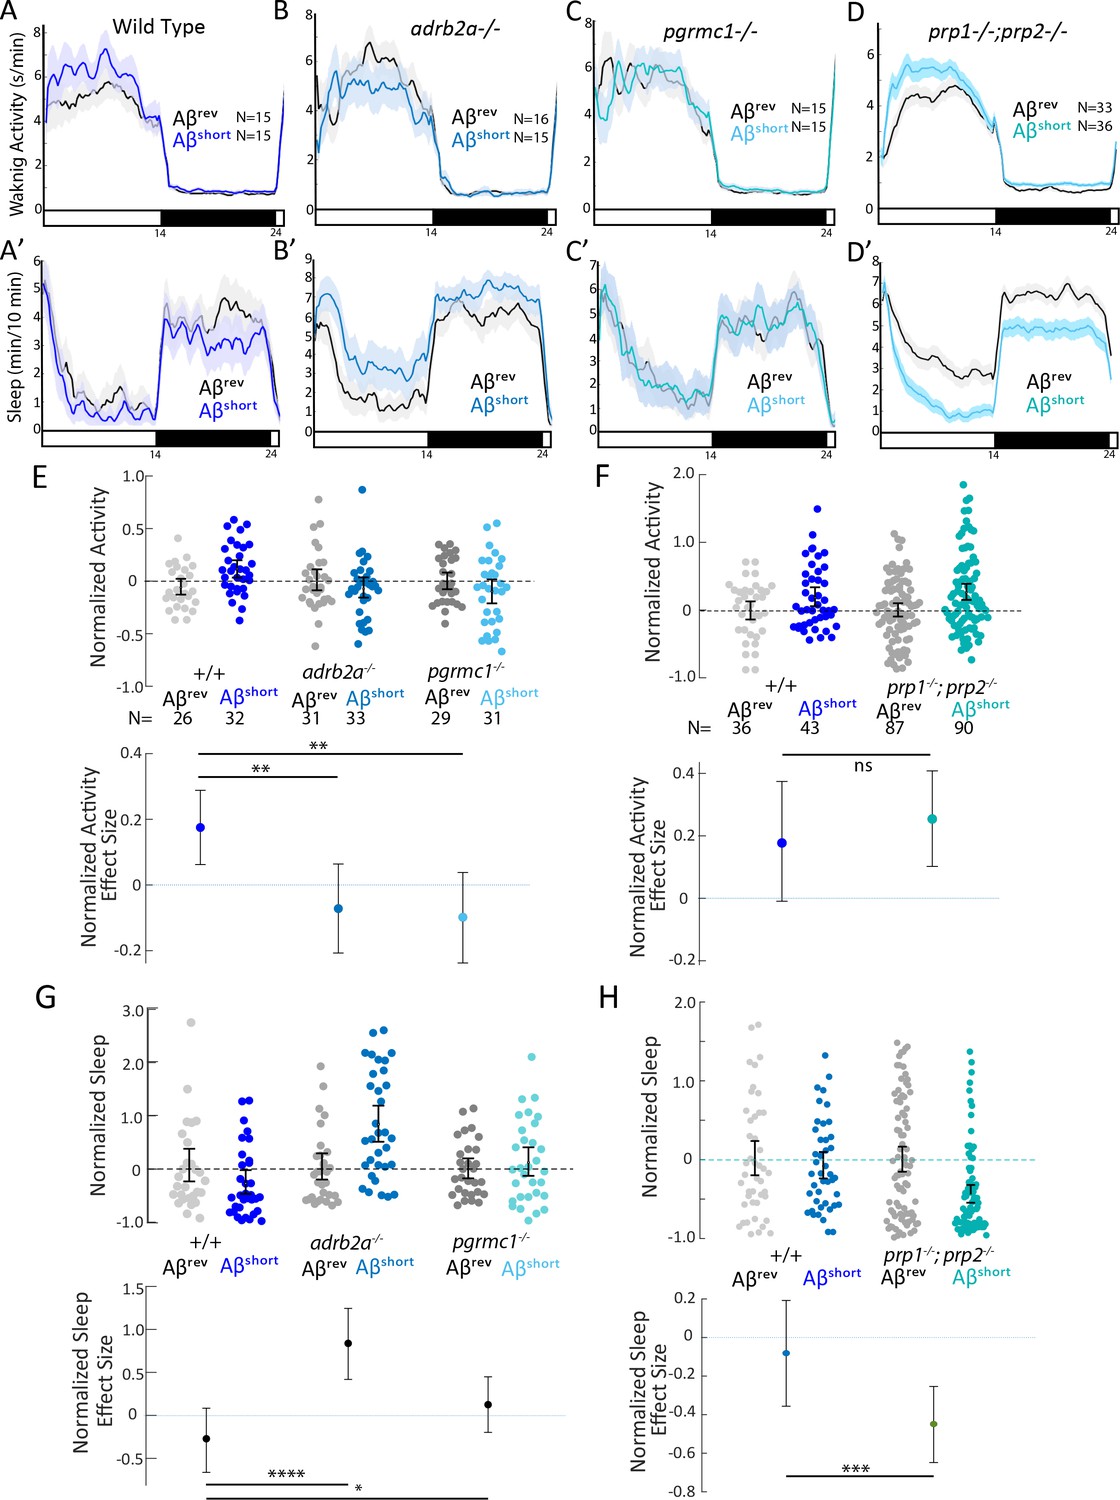
Wake induction by Aβshort requires Adrb2a and Pgrmc1, but not the Prion Protein.
(A-D’) Exemplar 24 hr traces comparing the effects of Aβshort oligomers on average waking activity (A-D) and sleep (A’-D’) versus Aβrev injected into wild type (A,A’), adrb2a-/- (B,B’), pgrmc1-/- (C,C’), and prp1-/-;prp2-/- mutants (D,D’). (E-H) The effect of Aβshort relative to Aβrev on normalized waking activity (E and F) and sleep (G and H) during the first day is shown. Each dot represents a single larva normalized to the mean of the Aβrev control, and error bars indicate ± SEM. The mean difference effect size and 95% confidence interval are plotted below. N = the number of larvae. The wake inducing and sleep suppressing effects of Aβshort are absent in (E,G) adrb2a-/- and pgrmc1-/- but enhanced in prp1-/-;prp2-/- mutants (F,H). nsp>0.05, *p≤0.05, **p≤0.01, ***p≤0.0001, ****p≤10–5 one-way ANOVA. Data is pooled from n = 2 independent experiments for adrb2a-/-and pgrmc1-/- and n = 3 for prp1-/-;prp2-/-. See also Figure 3—figure supplements 1 and 2.
Figure 3—figure supplement 1
Crispr/Cas9 targeting of zebrafish adrb2a and pgrmc1.
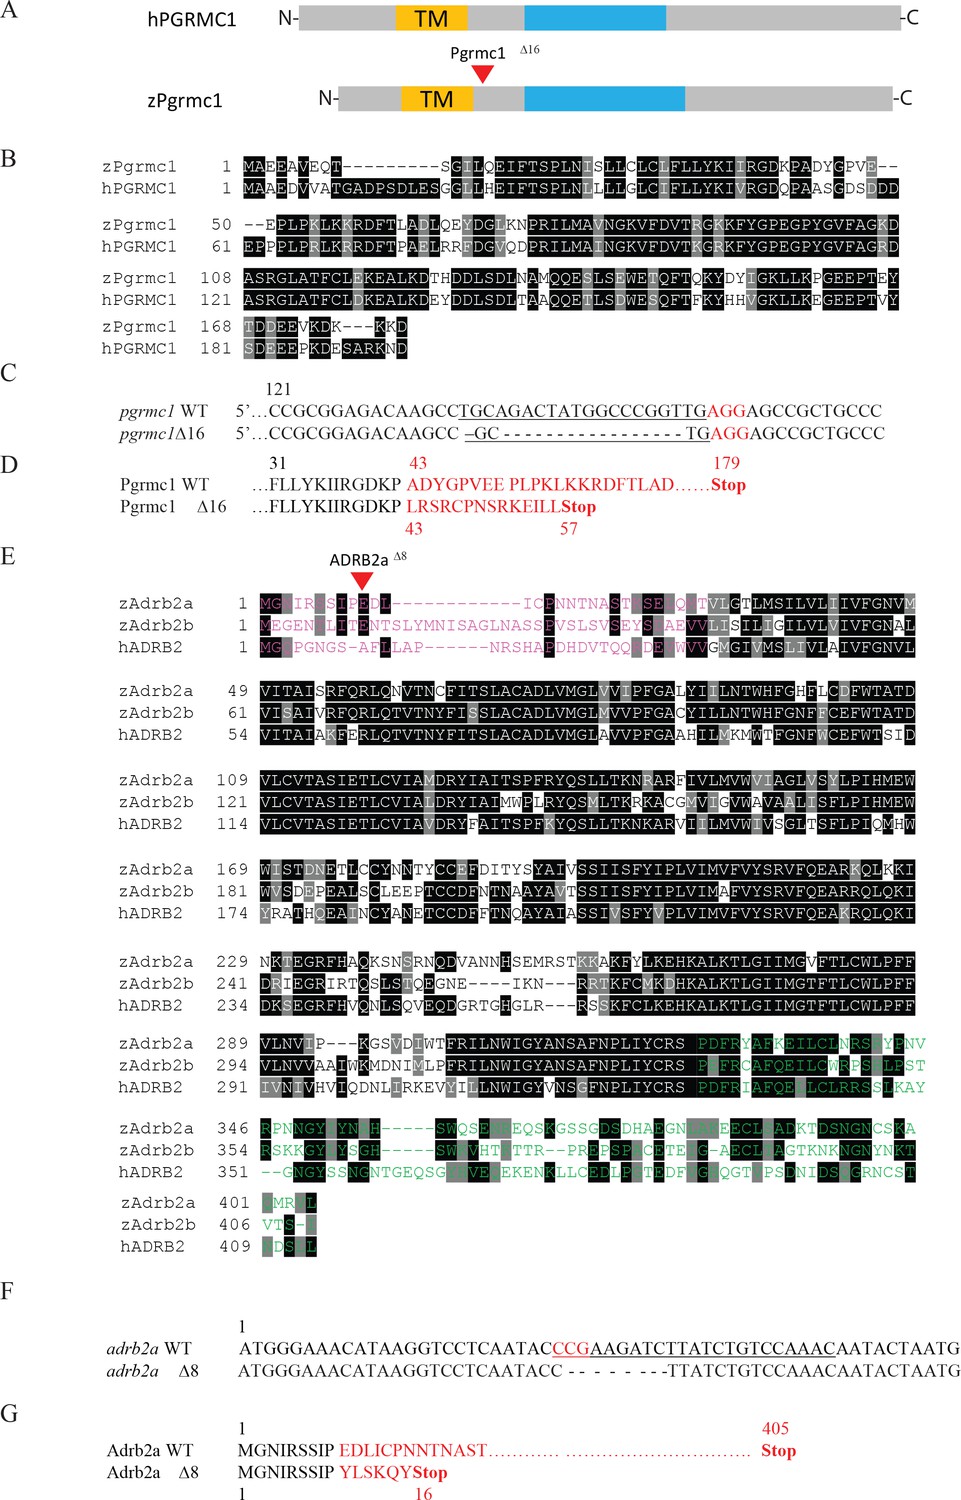
(A) Human PGRMC1and zebrafish Pgrmc1 contain a conserved Transmembrane (TM) domain (yellow) and a Cytochrome b5-like Heme/Steroid binding domain (blue). (B) Protein alignment of zebrafish Pgrmc1 to human PGRMC1. Identical residues are marked in black, similar residues in grey. (C) Crispr-Cas9 targeting of pgrmc1 generated an allele with a 16 bp deletion. The PAM sequence is indicated in red. (D) The predicted translation of pgrmc1 Δ16 leads to a premature stop codon. (E) Protein alignment of zebrafish Adrb2a and Adrb2b to human ADRB2. Identical residues are marked in black, similar residues in grey. The N-terminal region (pink) is the putative Aβ binding region. The C-terminal region is in green. (F) Crispr-Cas9 targeting of adrb2a generated an allele with an 8 bp deletion. The PAM sequence is indicated in red. (G) The predicted translation of adrb2aΔ8 leads to a premature stop codon lacking all functional domains.
Figure 3—figure supplement 2

adrb2a and pgrmc1 mutations have small effects on baseline sleep:wake parameters.
(A–C’) Sleep and waking activity plots for larvae from pgrmc1+/- in crosses. (A,A’) show representative 48 hr traces for the indicated genotypes. The ribbon represents ± SEM. (B–C’) Sleep and waking activity for each larva for all genotypes are plotted. The error bars represent the mean ± SEM. There is a trend to decreased waking activity in pgrmc1-/- mutants compared to wild-type siblings. p=0.07, Kruskal-Wallis, Tukey-Kramer post-hoc. (D–F’) Sleep and waking activity plots for larvae from adrb2a+/- in crosses. (D,D’) show 48 hr traces for all three genotypes. The ribbon represents ± SEM. (E–F’) Sleep and waking activity for the day and night are plotted for each larva. The error bars represent the mean ± SEM. Compared to both wild type and heterozygous siblings, adrb2a-/- mutants have increased sleep during the day. *p≤0.05, Kruskal-Wallis, Tukey-Kramer post-hoc.
Figure 4 with 2 supplements
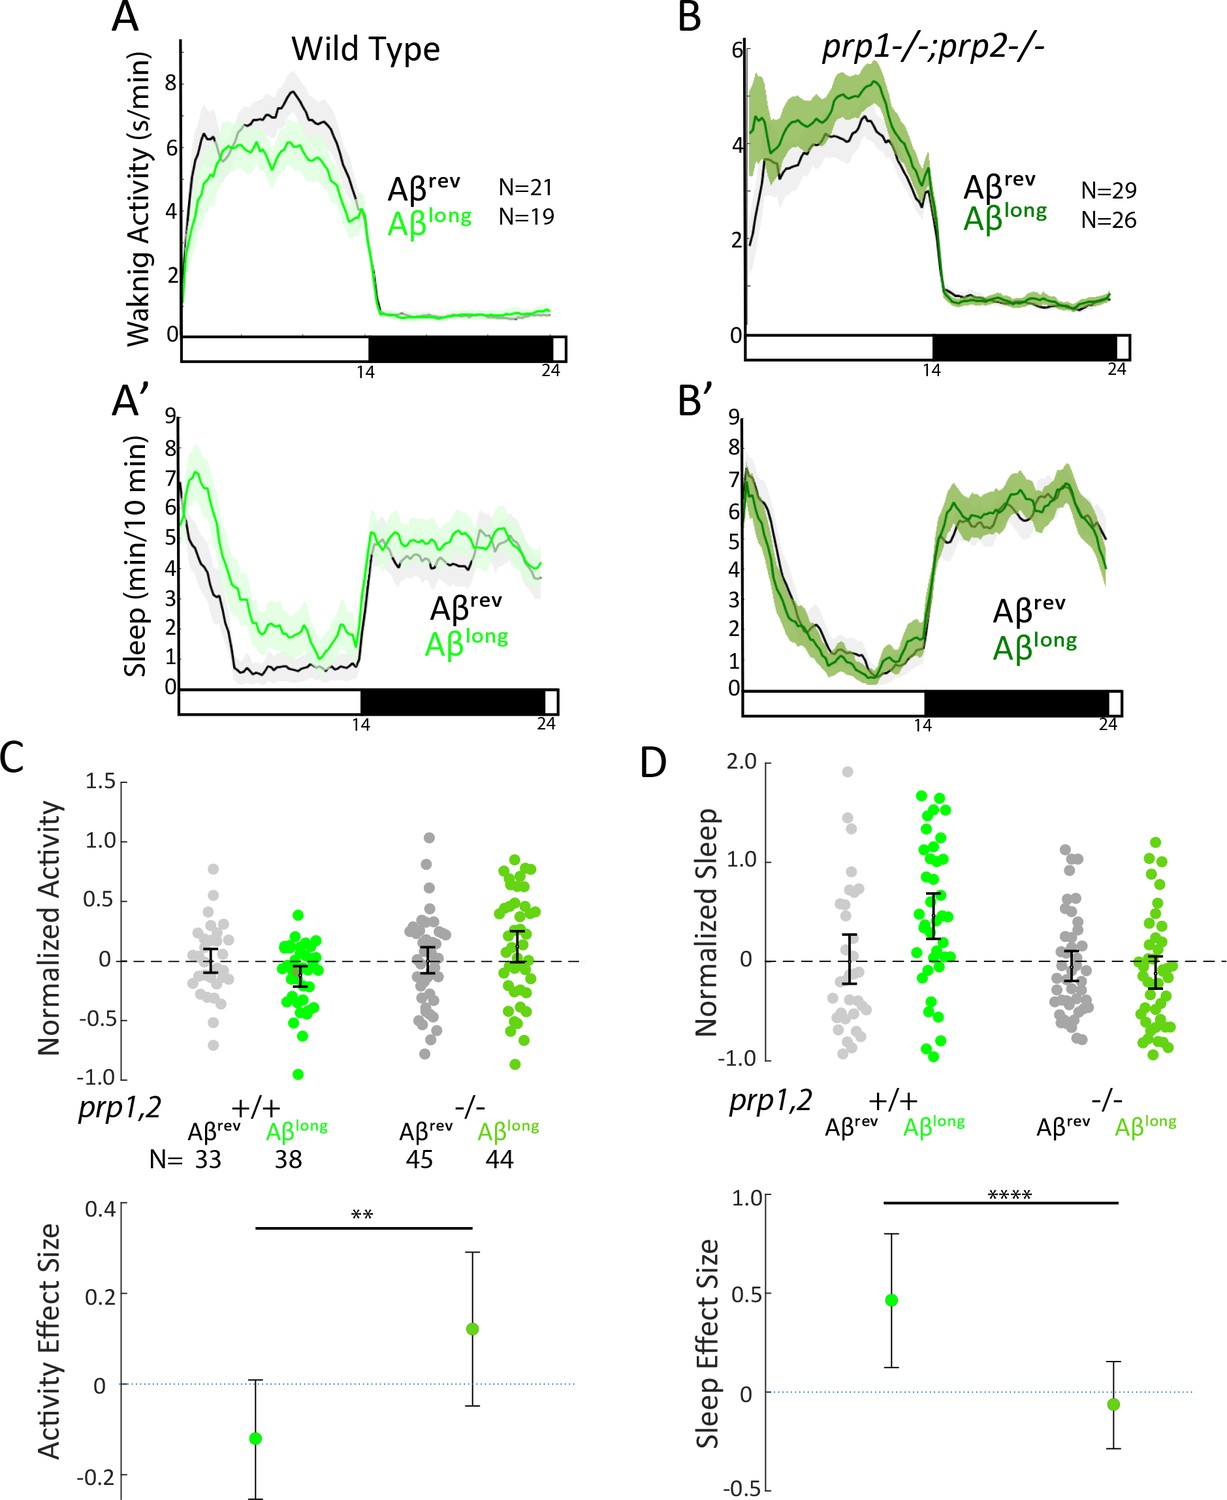
Sleep induction by Aβlong requires signalling through Prion Protein.
(A-B’) Exemplar 24 hr traces comparing the effects of Aβlong oligomers on average waking activity (A,B) and sleep (A’-B’) versus Aβrev on wild type (A,A’), and prp1-/-;prp2-/- mutant (B,B’) backgrounds. (C-D) The effect of Aβlong relative to Aβrev on normalized waking (C) and sleep (D) on wild type and prp1-/-;prp2-/- mutant backgrounds (mixed prp3 background) during the first day is shown. The activity reducing (C) and sleep promoting (D) effects of Aβlong are blocked in prp1-/-;prp2-/- mutants. **p≤0.01, ****p≤10–5 one-way ANOVA. Data is pooled from n = 3 independent experiments. See also Figure 4—figure supplements 1 and 2.
Figure 4—figure supplement 1
Relationship among zebrafish prp genes with Aβ binding sites.
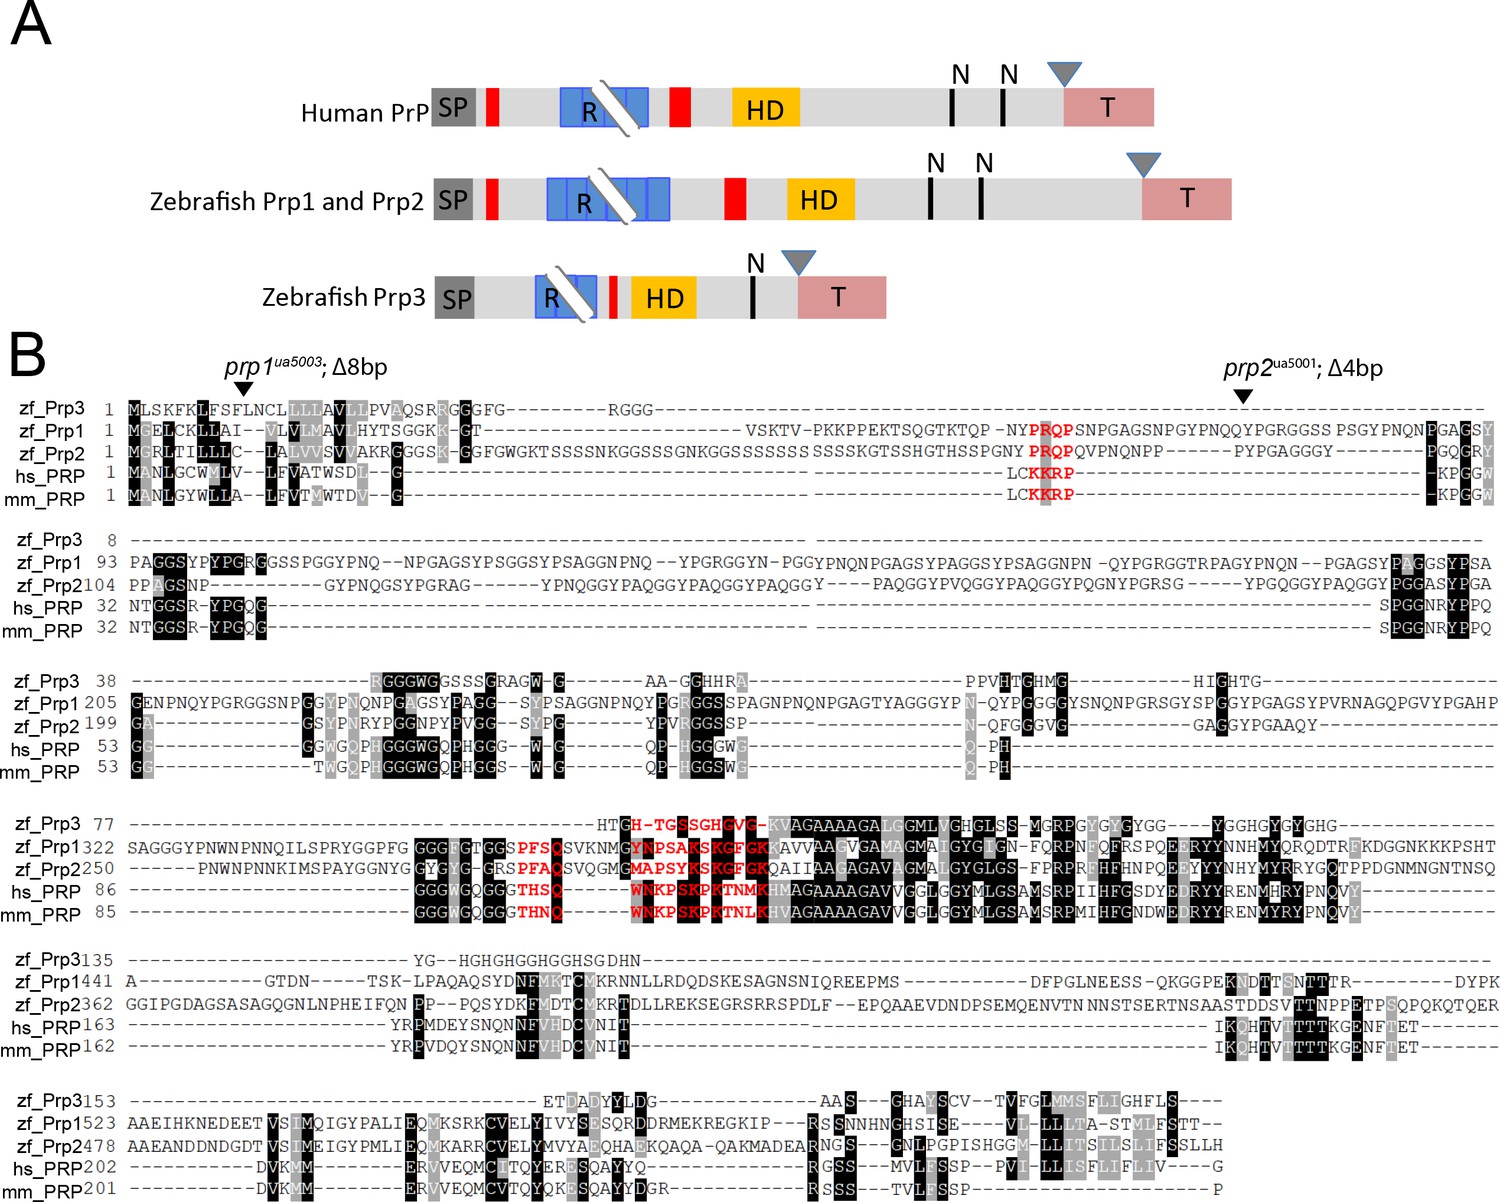
(A) Schematic comparing zebrafish Prp1-3 proteins to human PrP. SP, signal peptide (dark grey); R, repetitive region (blue); HD, hydrophobic domain (yellow); N, glycosylation sites (black lines); GPI anchor residue (triangle); hydrophobic tail (coral). Aβ oligomer binding regions are shown in red. Breakpoints at repetitive regions indicate length variation. Adapted from Cotto et al., 2005. (B) Protein alignments of zebrafish Prp1, Prp2, and Prp3 proteins to human and mouse PrP proteins. Identical residues are marked in black, similar residues in grey. Aβ oligomer binding sites are indicated in red. The site of truncation mutations in prp1 and prp2 mutants are indicated with a triangle.
Figure 4—figure supplement 2

prp double mutants do not affect baseline sleep or wake across the day:night cycle.
(A-C’) Sleep and waking activity plots for larvae from prp1+/-; prp2+/- in crosses. (A,A’) show representative 48 hr traces for the indicated genotypes. The ribbon represents ± SEM. (B–C’) Sleep and waking activity for each larva for all genotypes are plotted. The error bars represent the mean ± SEM. (D–F’) Sleep and waking activity plots for larvae from prp1+/-;prp2-/- in crosses. (D, D’) show 48 hr traces for all three genotypes. The ribbon represents ± SEM. (E–F’) Sleep and waking activity for the day and night are plotted for each larva. The error bars represent the mean ± SEM.
Figure 5
Neuronal activity after exposure to Aβ preparations is altered in mutants of Aβ binding targets.
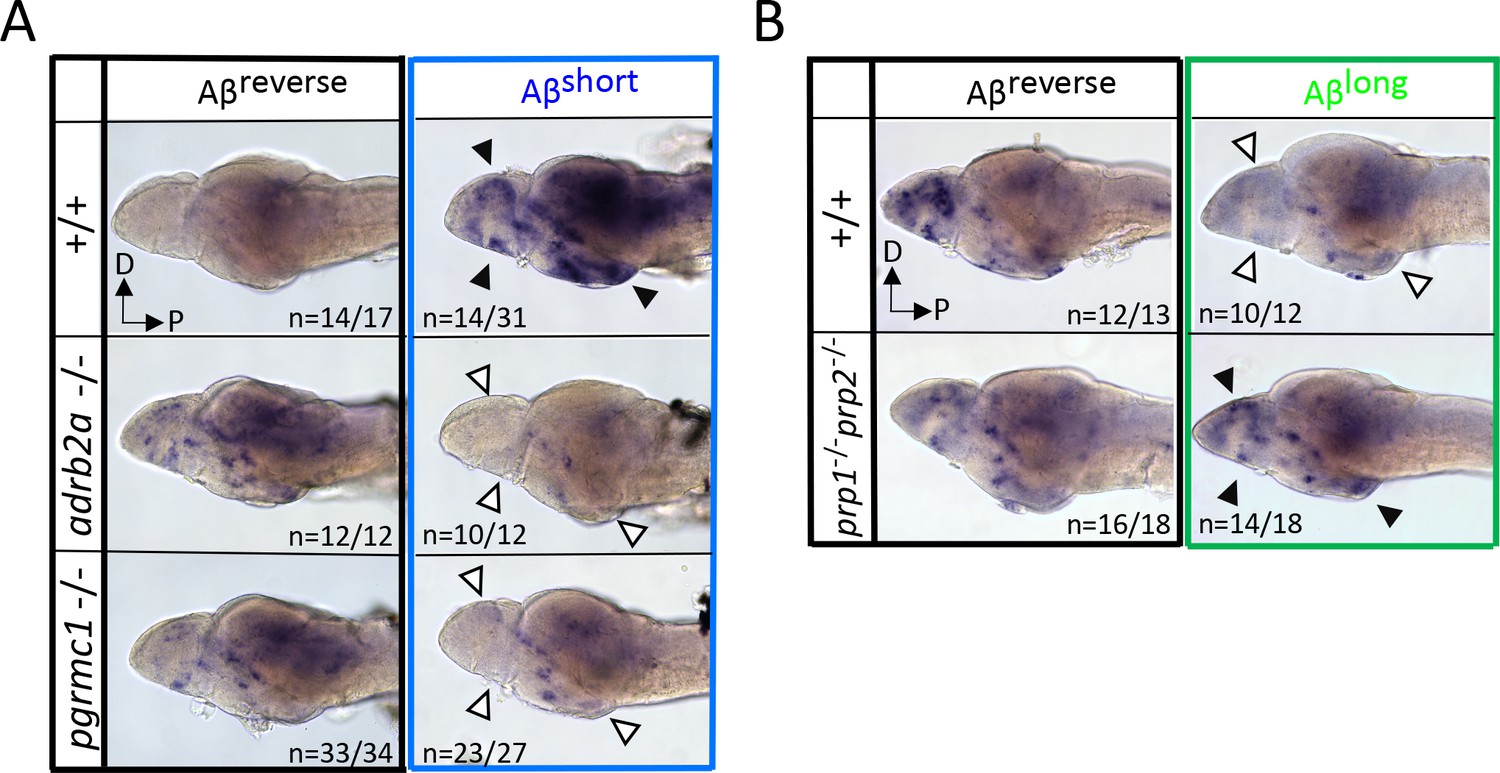
(A) After Aβshort injection into WT larvae (top right), c-fos is detected in many larval brain areas, including the dorsal and ventral telencephalon and posterior hypothalamus (black arrowheads), but not after injection of Aβ reverse controls (left). In contrast, Aβshort injections into either adrb2a-/- (middle right) or pgrmc1-/- mutants (bottom right) do not induce c-fos expression. The brains in the middle and lower panels were stained longer than the WT (+/+) brains to ensure detection of weaker expression. D = dorsal, p=Posterior. n = blinded counts of brains with expression pattern/total brains. (B) Compared to Aβrev injections, Aβlong oligomers induce less c-fos expression in WT larvae (top panels). In contrast, Aβlong induced relatively increased c-fos expression in the telencephalon and posterior hypothalamus (black arrows) in the prp1-/-; prp2 -/- double mutants. These Aβrev and Aβlonginjectedbrains were stained longer to ensure detection of weaker c-fos expression. D = dorsal, p=Posterior.
Figure 6 with 1 supplement
Pharmacological blockade of the Aβlong-Prp-mGluR5-Fyn Kinase signaling cascade prevents increases in sleep.
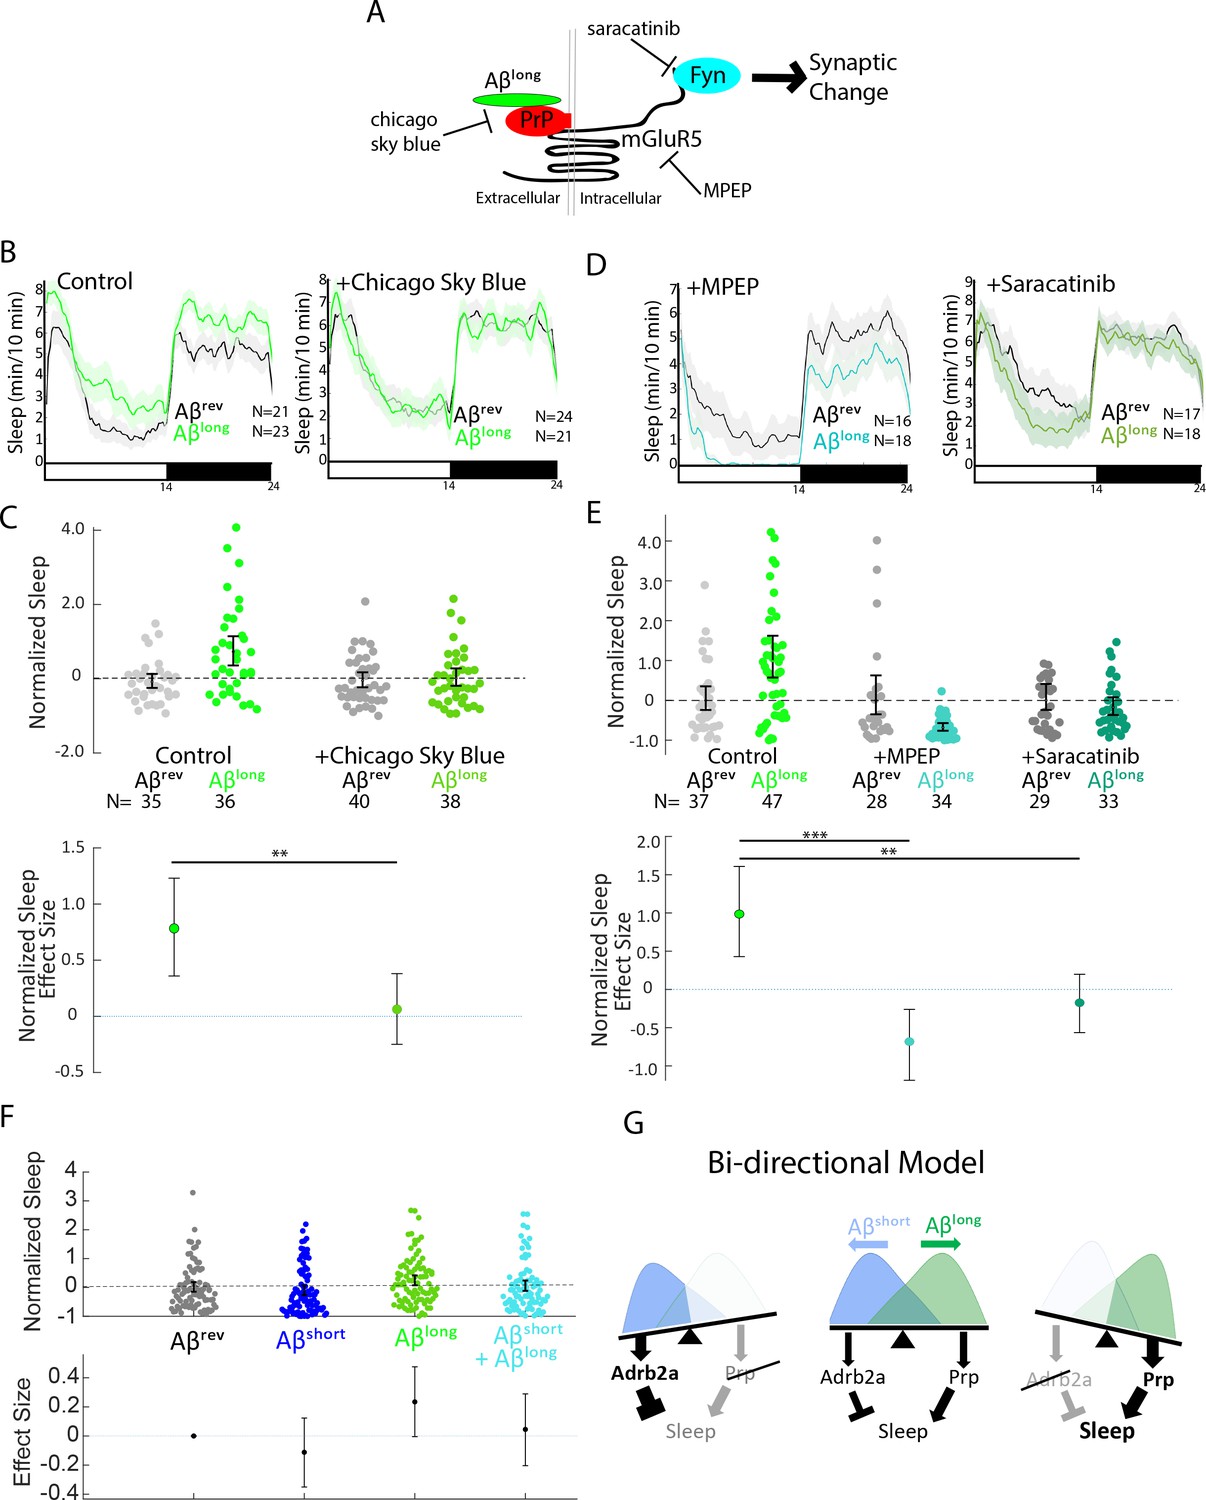
(A) Schematic showing how Aβ–Prp interactions signal through mGluR5 to activate Fyn kinase, leading to synaptic changes (Nygaard et al., 2014). Small molecules that block each step in the pathway are indicated. (B) Representative traces of sleep behavior after Aβlong versus Aβrev injections in the absence (left) or presence (right) of the Aβ-Prion binding disruptor, Chicago Sky Blue 6B (3 nM). Ribbons represent ± SEM. (C) The effect of Aβlong relative to Aβrev on normalized sleep during the first day in the in the absence or presence of 3 nM Chicago Sky Blue 6B. The data is pooled from n = 2 independent experiments **p≤0.01, one-way ANOVA. (D) Representative traces of sleep behavior after Aβlong versus Aβrev injections in the presence of mGluR5 inhibitor MPEP (5 uM, left) and Fyn Kinase inhibitor saracatinib (300 nM, right). Ribbons represent ± SEM. (E) The effect of Aβlong relative to Aβrev on normalized sleep during the first day in the absence or presence of 5 uM MPEP (left) and 300 nM saracatinib (right). Each dot represents a single larva normalized to the mean Aβrev. Data is pooled from two independent experiments. **p≤0.01, ****p≤10–5 one-way ANOVA. (F) The effect of a 1:1 mixture of Aβlong to Aβshort relative to single injections of Aβrev, Aβshort, and Aβlong on normalized sleep during the first day. The data is pooled from n = 4 independent experiments. (G) A bi-directional model for sleep/wake regulation by Aβ. In wild-type animals (centre), injection of Aβshort species signal through Adrb2a/Pgrmc1 to drive wakefulness while Aβlong oligomers signal via Prp to induce sleep. In mutants that lack Prp (left), only Aβshort species (as shown by the overlapping distributions) remain to inhibit sleep with no residual Aβlong oligomers to stimulate the sleep-inducing pathway to counteract wake-inducing signals. Thus prp1-/-; prp2-/- mutants have enhanced wakefulness in response to Aβ. Conversely, mutants that lack Adrb2a/Pgrmc1 (right), retain only the sleep-promoting Aβ pathway and fail to increase wakefulness in response to Aβshort. See also Figure 6—figure supplement 1.
Figure 6—figure supplement 1
Pharmacological blockade of the ABlong-Prp-MgluR5-Fyn Kinase signalling cascade prevents reductions in waking activity.
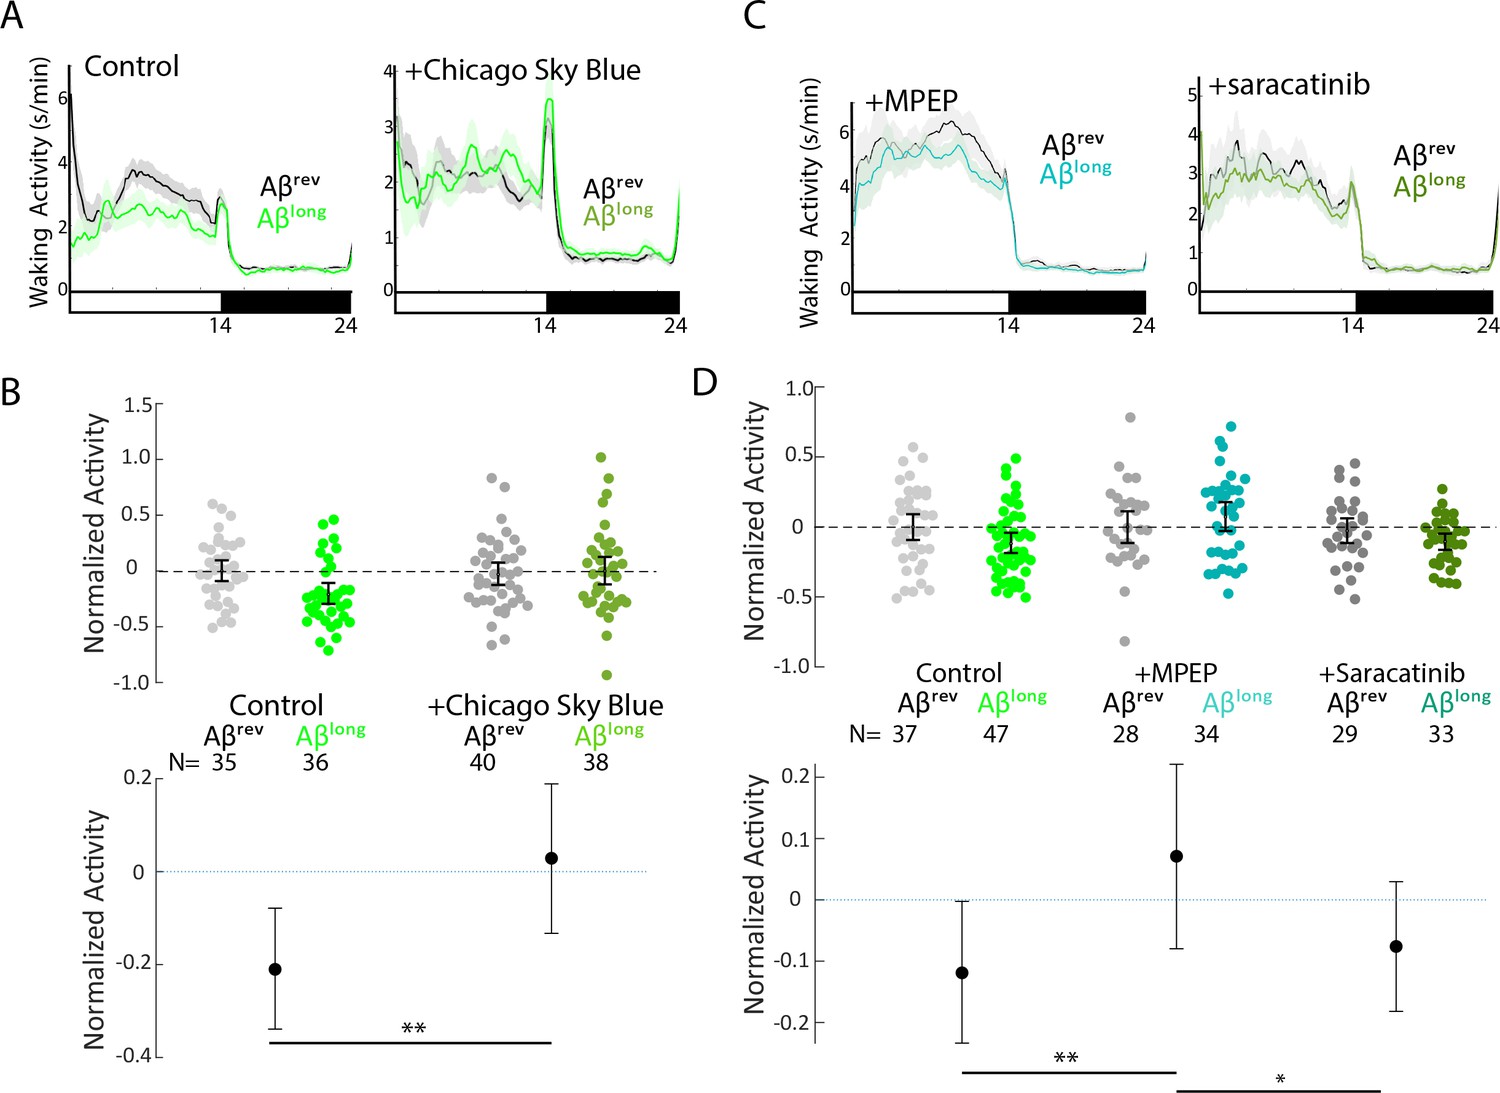
(A) Representative traces of waking activity after Aβlong versus Aβrev injections in wild type larvae in the absence (left) or presence (right) of the Aβ-Prp binding disruptor, Chicago Sky Blue 6B (3 nM). The data are from the same injections as in Figure 6B. Ribbons represent ± SEM. Light and dark bars indicate the lights ON and lights OFF periods, respectively. (B) The change in normalized waking activity induced by Aβlong versus Aβrev control injections in the absence or presence of 3 nM Chicago Sky Blue 6B. Each dot represents a single larva and error bars indicate ± SEM. The mean difference effect size and 95% confidence interval is plotted at the bottom. N = the number of larvae in each group. **p≤0.01, Kruskal-Wallis, Tukey-Kramer post hoc. (C) Representative traces of sleep behavior after Aβlong versus Aβrev injections (left) in the presence of the mGluR5 inhibitor, MPEP (5 μM) and (right) Src-kinase inhibitor, saracatinib (300 nM). Ribbons represent ± SEM. The data are from the same injections as in Figure 6D. (D) The change in sleep induced by Aβlong relative to Aβrev control injections in the presence of MPEP (5 μM) and (300 nM) saracatinib. *p≤0.05, **p≤0.01, Kruskal-Wallis, Tukey-Kramer post hoc.
Author response image 1
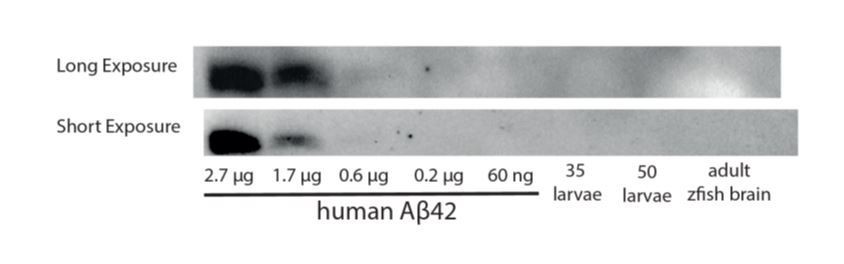
A Western blot against Aβ42 is unable to detect a band in homogenates from 35-50 zebrafish larvae or from an adult brain.
Tables
Appendix 1—key resources table
| Reagent type (species) or resource | Designation | Source or reference | Identifiers | Additional information |
|---|---|---|---|---|
| Gene (Danio rerio) | prp1 | Leighton et al., 2018 PMID:29903907 | ZFIN ID: ZDB-GENE-041221-2 | |
| Gene (Danio rerio) | prp2 | Fleisch et al., 2013 PMID:23523635 | ZFIN ID: ZDB-GENE-041221-3 | |
| Gene (Danio rerio) | adrb2a | This paper | ZFIN ID: ZDB-GENE-100414-3 | |
| Gene (Danio rerio) | pgrmc1 | This paper | ZFIN ID: ZDB-GENE-041114-91 | |
| Strain background (Danio rerio) | AB | UCL Fish Facility | ||
| Strain background (Danio rerio) | TL | UCL Fish Facility | ||
| Strain background (Danio rerio) | ABxTup | UCL Fish Facility | ||
| Strain (Danio rerio) | prp1 (ua5003/ua5003) mutant | Leighton et al., 2018 PMID:29903907 | ZFIN ID: ZDB-ALT-181113-1 | |
| Strain (Danio rerio) | prp2 (ua5001/5001) mutant | Leighton et al., 2018 PMID:29903907 | ZFIN ID: ZDB-ALT-130724-2 | |
| Strain (Danio rerio) | adrb2a (u511/u511) mutant | This paper | Allele will be added to ZFIN upon publication acceptance | |
| Strain (Danio rerio) | pgrmc1 (u512/u512) mutant | This paper | Allele will be added to ZFIN upon publication acceptance | |
| Antibody | anti-DIG-AP antibody (Sheep) polyclonal | Roche | Cat # 14608125; RRID:AB_2734716 | (1:2000) |
| Antibody | anti-Active Caspase 3 (Rabbit) | BD Biosciences | Cat # 559565; RRID:AB_397274 | (1:500) |
| Antibody | p44/42 MAP Kinase (L34F12) Mouse mAb | Cell Signaling | Cat # 4696; RRID:AB_390780 | (1:500) |
| Antibody | Phospho-p44/42 MAPK(Erk1/2)(Thr202/Tyr204) Rabbit mAb | Cell Signaling | Cat # 4370; RRID:AB_2315112 | (1:500) |
| Antibody | Alexa Fluor 568 goat anti-mouse, polyclonal | Thermo Fisher Scientific | Cat # A-11031; RRID:AB_144696 | (1:200) |
| Antibody | Goat anti-Rabbit IgG Alexa 488, polyclonal | Thermo Fisher Scientific | Cat # A-11034; RRID:AB_2576217 | (1:200) |
| Sequence-based reagent | galanin probe | Chen et al., 2017 PMID:28648499 | Plasmid for galanin ISH riboprobe | |
| Sequence-based reagent | c-fos probe | Reichert et al., 2019 PMID:31537465 | Plasmid for c-fos ISH riboprobe | |
| Sequence-based reagent | adrb2a | This paper | Gene-specific oligomer for CRISPR | 5’ATTTAGGTGACACTATAGTTTGGACAGATAAGATCTTGTTTTAGAGCTAGAAATAGCAAG-3’ |
| Sequence-based reagent | pgrmc1 | This paper | Gene-specific oligomer for CRISPR | 5’ATTTAGGTGACACTATATGCAGACTATGGCCCGGTTGGTTTTAGAGCTAGAAATAGCAAG-3’ |
| Sequence-based reagent | gRNA constant region | Thermofisher | Constant oligomer for CRISPR | 5’AAAAGCACCGACTCGGTGCCACTTTTTCAAGTTGATAACGGACTAGCCTTATTTTAACTTGCTATTTCT AGCTCTAAAAC-3’ |
| Peptide, recombinant protein | Beta-Amyloid (1-42); HFIP treated | JPT Peptide Technologies | Cat# SP-Ab-07_0.5 | |
| Peptide, recombinant protein | Amyloid β 42-1 reverse human | Sigma Aldrich | Cat# SCP0048 | |
| Peptide, recombinant protein | ß-Amyloid (1-42), HiLyte Fluor 647-labeled | Eurogentech LTD | Cat# AS-64161 | |
| Commercial assay or kit | T4 DNA polymerase | NEB | Cat# M0203S | |
| Commercial assay or kit | PCR clean-up column kit | Qiaquick | Cat# 28104 | |
| Commercial assay or kit | Ambion MEGAscript SP6 kit | Ambion | Cat# AM1330 | |
| Chemical compound, drug | 2000 kDa dextran-conjugated FITC | Sigma Aldrich | Cat# 52471 | 3 mg/ml |
| Chemical compound, drug | Chicago Sky Blue 6B | Sigma Aldrich | Cat# C8679 | 3 nM |
| Chemical compound, drug | MPEP | Cambridge Biosciences | Cat# CAY14536 | 5 μM |
| Chemical compound, drug | Saracatinib | Generon | Cat# A2133 | 300 nM |
| Chemical compound, drug | Pentylenetetrazol (PTZ) | Sigma Aldrich | Cat# P6500 | 10 mM |
| Chemical compound, drug | Camptothecin | Sigma Aldrich | Cat# 208925 | 1 uM |
| Software, algorithm | Sleep analysis2 | Rihel et al., 2010 PMID:21111222 | ||
| Software, algorithm | Dabest estimation plots | Ho et al., 2019 PMID:31217592 |
Additional files
Download links
A two-part list of links to download the article, or parts of the article, in various formats.
Downloads (link to download the article as PDF)
Open citations (links to open the citations from this article in various online reference manager services)
Cite this article (links to download the citations from this article in formats compatible with various reference manager tools)
Sleep is bi-directionally modified by amyloid beta oligomers
eLife 9:e53995.
https://doi.org/10.7554/eLife.53995


