Sleep is bi-directionally modified by amyloid beta oligomers
- Department of Cell and Developmental Biology, UCL, United Kingdom
- Centre for Prions & Protein Folding Disease, University of Alberta, Canada
- Department of Biological Sciences, University of Alberta, Canada
Abstract
Disrupted sleep is a major feature of Alzheimer’s disease (AD), often arising years before symptoms of cognitive decline. Prolonged wakefulness exacerbates the production of amyloid-beta (Aβ) species, a major driver of AD progression, suggesting that sleep loss further accelerates AD through a vicious cycle. However, the mechanisms by which Aβ affects sleep are unknown. We demonstrate in zebrafish that Aβ acutely and reversibly enhances or suppresses sleep as a function of oligomer length. Genetic disruptions revealed that short Aβ oligomers induce acute wakefulness through Adrenergic receptor b2 (Adrb2) and Progesterone membrane receptor component 1 (Pgrmc1), while longer Aβ forms induce sleep through a pharmacologically tractable Prion Protein (PrP) signaling cascade. Our data indicate that Aβ can trigger a bi-directional sleep/wake switch. Alterations to the brain’s Aβ oligomeric milieu, such as during the progression of AD, may therefore disrupt sleep via changes in acute signaling events.
Introduction
Accumulation of amyloid-beta (Aβ) in plaques, along with tau tangles, is one of the two pathological hallmarks of Alzheimer’s disease (AD). Change in Aβ levels in the brain is one of the earliest known pathological events in AD and is detectable years before the development of Aβ plaques and decades before the clinical onset of AD (Bateman et al., 2007; Jack et al., 2013). Because of its importance in AD progression, Aβ has been mostly characterized as a functionless, pathological, intrinsically neurotoxic peptide (Moir and Tanzi, 2019). However, Aβ is an ancient neuropeptide conserved across vertebrates through at least 400 million years of evolution (Moir and Tanzi, 2019). Aβ’s cleavage from amyloid precursor protein (APP) is tightly regulated by multiple enzymatic reactions (O'Brien and Wong, 2011), and its release from neurons is carefully controlled (Kamenetz et al., 2003). Aβ interacts with numerous surface receptors and can activate intrinsic cellular signalling cascades to alter neuronal and synaptic function (Jarosz-Griffiths et al., 2016). More recently, Aβ has been suggested to act as an antimicrobial peptide (Soscia et al., 2010), and the deposition of Aβ may be induced as an innate immune defence mechanism against microbial pathogens (Kumar et al., 2016). However, the various biological effects of Aβ in health or disease remain obscure.
One of the earliest symptoms of AD is the disruption of sleep, and AD patients have sleep-wake abnormalities, including insomnia at night and increased napping during the day (Allen et al., 1987; Loewenstein et al., 1982; Moran et al., 2005; Prinz et al., 1982). Multiple transgenic AD mouse models that overproduce Aβ also show disrupted sleep phenotypes (Roh et al., 2012; Sterniczuk et al., 2010; Wang et al., 2002), often in the absence of neuronal loss and preceding impairments of learning and memory (Irizarry et al., 1997). In non-pathological conditions, Aβ levels in the cerebrospinal fluid (CSF) are modulated by the sleep-wake cycle (Kang et al., 2009; Xie et al., 2013). Aβ generation and release are controlled by electrical and synaptic activity (Cirrito et al., 2005; Kamenetz et al., 2003), leading to increased extracellular Aβ levels during wakefulness and decreased levels during sleep (Kang et al., 2009; Xie et al., 2013). These observations have led to the proposal that sleep and Aβ dynamics create a vicious feed-forward cycle, wherein increases in wakefulness result in increased extracellular Aβ and aggregation, which then dysregulates sleep, further exacerbating pathogenic Aβ production (Roh et al., 2012). How increased Aβ burden leads to disruptions in sleep remains unknown, although AD-related cell death of critical sleep/wake regulatory neurons has been suggested as a possible mechanism (Fronczek et al., 2012; Lim et al., 2014; Manaye et al., 2013).
Given the relationship between Aβ and sleep, we hypothesized that Aβ may directly modulate sleep-regulatory pathways independently of neuronal cell death. To test this, we took advantage of the ability to directly deliver small molecules and Aβ peptides to the brain of larval zebrafish, which have conserved APP processing machinery and Aβ peptides (Newman et al., 2014) and share genetic, pharmacological, and neuronal sleep-regulatory mechanisms with mammals (Barlow and Rihel, 2017). We found that Aβ size-dependently and reversibly modulates behavior through two distinct genetic, pharmacologically tractable pathways that regulate sleep in opposing directions.
Results
Aβ dose-dependently modifies zebrafish sleep and wake behavior
Isolating the specific biological effects of Aβ has been experimentally difficult. One challenge is that Aβ is processed from a series of complex cleavage steps of a longer transmembrane protein, APP, which also produces other protein products with a variety of functions (O'Brien and Wong, 2011). This restricts the utility of genetic manipulations to tease out Aβ-specific roles from the other APP components. Another challenge is that Aβ forms, in vitro and in vivo, a variety of oligomeric species (e.g. dimers, longer oligomers, or large fibrils) with diverse structures, binding affinities, and signalling properties (Benilova et al., 2012; Jarosz-Griffiths et al., 2016). Teasing out the biological signalling capabilities of these diverse oligomeric species requires selective manipulation of Aβ oligomeric states, which is difficult in vitro and is currently nearly impossible endogenously in vivo.
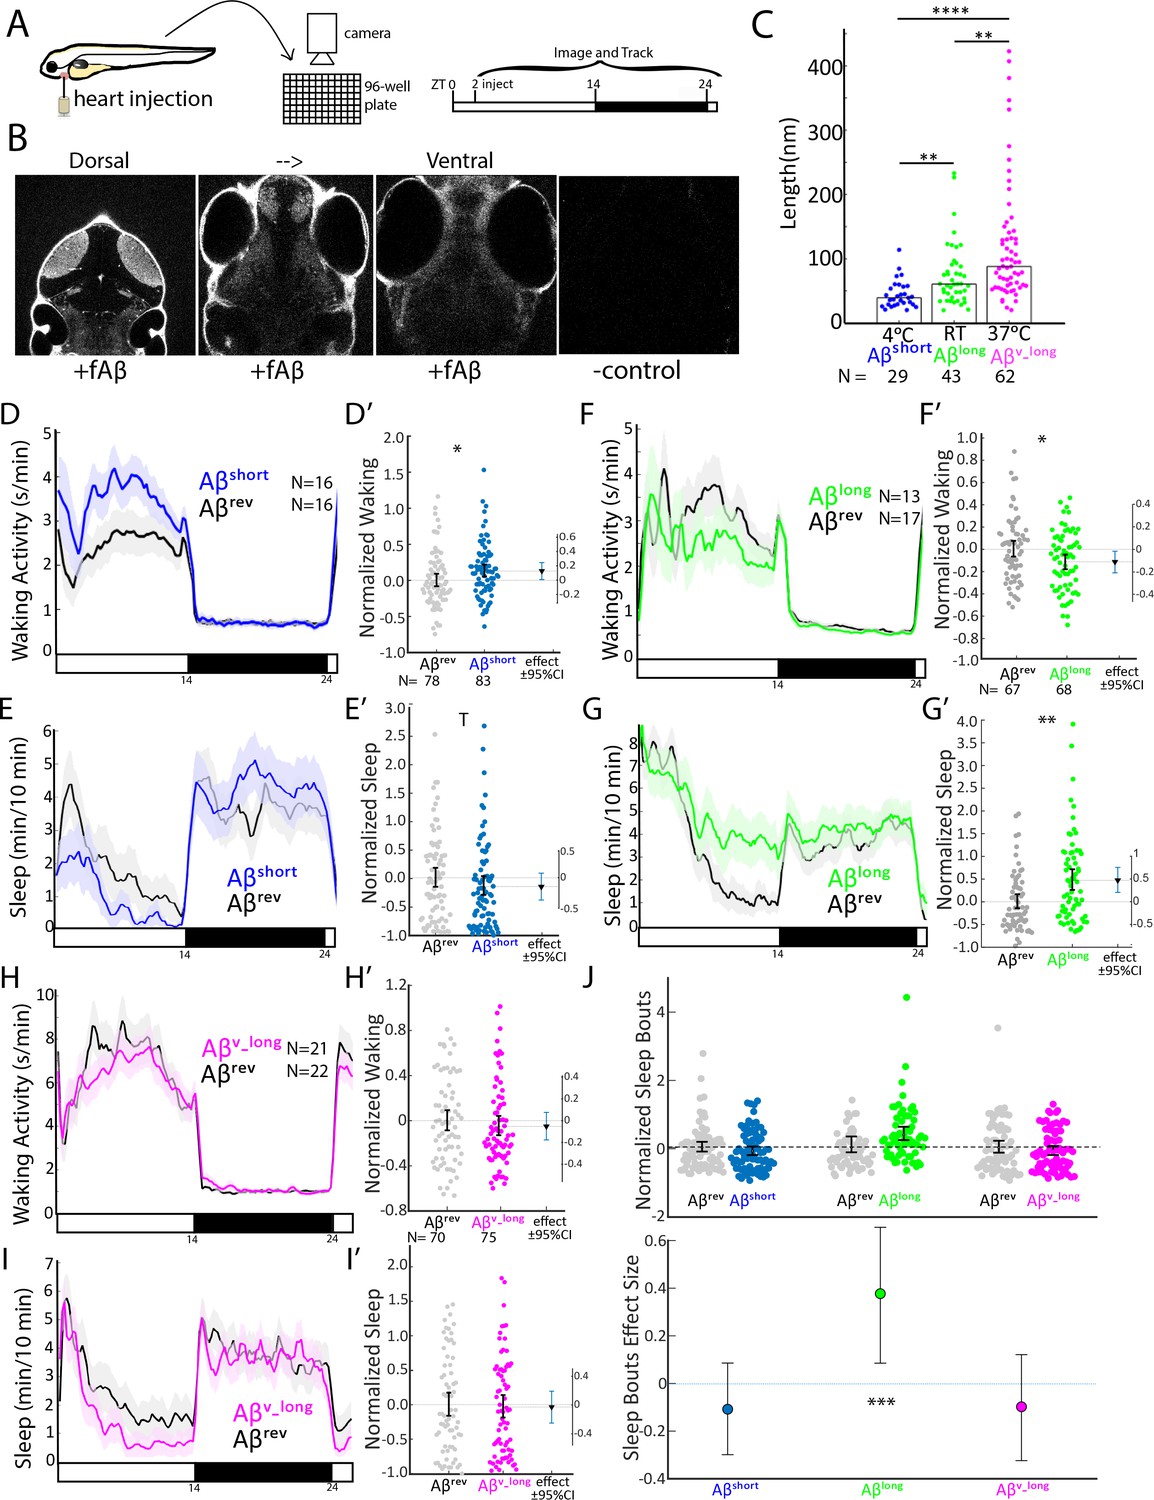
To overcome some of these barriers, we developed an injection assay in which the amount and type of the Aβ oligomers can be controlled and then tested the acute signaling effects of Aβ on sleep and wake behavior. Our minimally invasive intra-cardiac injection assay in 5 days post fertilization (5 dpf) larval zebrafish avoids direct damage to brain tissue (Figure 1A and B). This technique rapidly (<1 hr, peaking within 2–3 hr) and reversibly delivers Aβ to the larval brain, as assessed by injection of fluorescently tagged Aβ42 and subsequent confocal brain imaging (Figure 1B, Figure 1—figure supplement 1A,B). To generate different Aβ oligomeric species, we modified previously established in vitro monomeric Aβ incubation protocols (see Extended Methods) that enrich for Aβ with different oligomeric sizes and opposing effects on rat neuronal excitability (Kusumoto et al., 1998; Orbán et al., 2010; Whitcomb et al., 2015). By incubating Aβ42 overnight at increasing temperatures, we generated Aβ oligomeric pools with significantly different lengths, as measured by transmission electron microscopy (TEM) (Figure 1C and Figure 1—figure supplement 1C). Aβ42 incubated overnight at 4°C consisted of fewer and shorter oligomers (Aβshort, mean 45 ± 11 nm, median = 39 nm) than when incubated at 25°C (Aβlong, mean 75 ± 10 nm, median = 61 nm) or at 37°C (Aβv-long, mean 121 ± 10 nm, median = 88 nm) (Figure 1C).
Figure 1 with 4 supplements see all
Aβ oligomers bi-directionally affect sleep and wake in zebrafish larvae.
(A) Experimental schematic. Aβ was injected into the heart of 5 dpf larvae in the morning (ZT2 = zeitgeber time 2, that is 2hr after lights on). Behavior was then monitored in a square-welled 96-well plate for 24–48 hr on a 14 hr:10 hr light:dark cycle. (B) Heart-injected HiLyteTM Fluor 647-labeled Aβ42 (fAβ) penetrated the whole larval brain as visualized by confocal microscopy (optical sections, dorsal view) taken 2 hr after injection. Anterior is to the top. (C) Aβ prepared under increasing temperatures adopted longer oligomeric lengths, as measured by transmission electron microscopy. Each dot is a single oligomer (N = number measured), and the bars show the median. Data was taken from five randomly selected micrographs from two independent experiments. **p≤0.01, ****p≤1×10⁻⁷ Kruskal-Wallis, Tukey-Kramer post-hoc test. (D, E) Exemplar 24 hr traces post-injection comparing the effect of Aβshort (blue) on average waking activity (D) and sleep (E) versus Aβrev controls (grey). Ribbons represent ±the standard error of the mean (SEM). Light and dark bars indicate the lights ON and lights OFF periods, respectively. N = the number of larvae in each condition. (D’, E’) The effect of Aβshort relative to Aβrev on waking (D’) and sleep (E’) during the first day is shown, pooled from n = 5 independent experiments. Each dot represents a single larva normalized to the mean of the Aβrev control, and error bars indicate ± SEM. The mean difference effect size and 95% confidence interval is plotted to the right. *p<0.05, Tp <0.1, one-way ANOVA. (F, G) Exemplar 24 hr traces post-injection comparing the effect of Aβlong (green) on average waking activity (F) and sleep (G) versus Aβrev controls (grey). (F’, G’) The effect of Aβlong relative to Aβrev on waking (F’) and sleep (G’) during the first day is shown, pooled from n = 4 independent experiments. *p<0.05, **p<0.01, one-way ANOVA. (H, I) Exemplar 24 hr traces post-injection comparing the effect of Aβv_long (magenta) on average waking activity (H) and sleep (I) versus Aβrev peptide controls (grey). (H’, I’) The effect of Aβv_long relative to Aβrev on waking (H’) and sleep (I’) during the first day is shown, pooled from n = 3 independent experiments. (J) The effect of different Aβ preparations on the number of sleep bouts relative to Aβrev controls. The difference effect size and 95% confidence interval is plotted below. The asterisks indicate statistically significant different effects among the preps (***p<0.001, one-way ANOVA). See also Figure 1—figure supplements 1–3.
We then assessed how each Aβ preparation affected sleep and wake behavior in zebrafish relative to an Aβ42–1 ‘reverse’ peptide control (Aβrev) using automated video-monitoring (Prober et al., 2006; Rihel et al., 2010). In initial experiments, we determined the appropriate Aβ injection dose by injecting 1 nL of a 1–1000 nM dose series for both Aβshort and Aβlong and assessing subsequent waking activity and sleep, which is defined in zebrafish larvae as a period of inactivity lasting longer than one minute, which are associated with an increased arousal threshold and other features of behavioral sleep (Prober et al., 2006). Unexpectedly, these oligomeric species had opposing behavioral effects (Figure 1—figure supplement 1D–G). Aβshort increased waking activity and decreased sleep relative to Aβrev peptide, while Aβlong decreased waking and increased sleep (prep waking effect, p<0.001; prep sleep effect p<0.05, two-way ANOVA). These effects were generally consistent across doses, although some dose-responses elicited stronger differential effects than others (Figure 1—figure supplement 1D,E), with the maximal difference between the Aβshort and Aβlong preparations at 10 nM (p<0.01 doseXprep interaction, two-way ANOVA). We estimate this dose yields a final concentration that falls within the lower range of physiological concentrations reported for Aβ42 in human CSF of 100 pM-5nM (Bateman et al., 2007). For example, assuming that all injected Aβ goes into the brain, the highest possible concentration would be 1500 pg/ml or 300 pM (45 ng/ml x 1 nl in 30.4 nl brain = 1.5 ng/ml = 1500 pg/ml). At the lower end, assuming equal distribution of Aβ over the whole body yields a final concentration estimate of 150 pg/ml or 30 pM (45 ng/ml x1 nl in 300 nl of body = 150 pg/ml). We therefore continued with 10 nM injections for all subsequent experiments, as it combines the maximal differentially observed behavioral effects between Aβshort and Aβlong with physiologically reasonable concentrations.
Aβ affects sleep and wake in opposing directions as a function of oligomer size and independently of neural death
To explore the effect of Aβ oligomeric size on sleep, we then systematically tested the behavior effects of each Aβ species relative to a Aβrev control for n = 3–5 independent experiments each. As in the dose response experiments, Aβ affected sleep and wake in opposing directions depending on its oligomeric state (Figure 1D–I’). In the day following injection, Aβshort significantly increased waking activity by +12.8% and reduced total sleep relative to Aβrev by 15.5% (Figure 1D–E’). The magnitude of the sleep effect is likely partially masked by a flooring effect due to generally reduced sleep during the day; we therefore favor reporting effect sizes and confidence intervals as recommended (Amrhein et al., 2019; Ho et al., 2019). Indeed, if we were to combine all the additional control Aβshort experiments subsequently reported in this manuscript (n = 160 Aβrevn = 164 Aβshort, see Figure 3G and H), the effect size remains robust at −15.9% and the result is statistically significant (p<0.05, one-way ANOVA). These effects were reversible, as there were no significant differences in sleep (Figure 1E, black bar) or waking activity (Figure 1D, black bar) between Aβshort and reverse peptide in the night following injection, and the behavior of Aβshort-injected larvae returned to baseline levels in the subsequent day (Figure 1—figure supplement 3A).
In contrast, while injection of longer Aβ fibers (Aβv_long) had no effect on behavior, (Figure 1H–I’), injection of the intermediate Aβlong oligomers significantly increased sleep during the post-injection day by +47.2% and reduced waking activity by 11.3% (Figure 1F–G’). The increased sleep induced by Aβlong was due to a significant increase in the average number of sleep bouts but not an increase in sleep bout length (Figure 1J), indicating higher sleep initiation is responsible for the change in sleep rather than an increased sleep consolidation. This increased sleep effect by Aβlong was not observed in the night following injection (Figure 1F and G, black bar), and behavior returned to baseline by the following morning (Figure 1—figure supplement 3B).
This data is consistent with Aβshort increasing wakefulness and Aβlong decreasing wakefulness and increasing sleep. Additional control experiments ruled out experimental artefacts, as larvae undergoing no treatment, anesthesia only, mock injection, or PBS only injections had indistinguishable effects on sleep/wake (Figure 1—figure supplement 1H–J). Next, we recalculated the behavioral analysis only for the evening period before lights off, when vehicle-injected larvae were statistically indistinguishable from larvae that had been acclimated to the tracking rig for 24 hr (Figure 1—figure supplement 1J). Except for an even more severe flooring effect in the Aβshort injection experiments, the results from evening-only analysis were indistinguishable from calculations across the whole day (Figure 1—figure supplement 1K). We therefore used full day analysis for all subsequent experiments.
We next considered if the dual-effects of Aβ on sleep and wake are due to either neuronal damage or generalized toxic effects, such as the induction of seizure, paralysis, or sickness behavior.
First, injection with either long or short forms of Aβ had no effect on apoptosis, as detected by staining for activation of Caspase-3 (Figure 1—figure supplement 2A–C). In addition, Aβ injected animals raised to adulthood showed no major differences in their general health or in their survival rates (Figure 1—figure supplement 2D). Moreover, injected animals recovered fully in the long term, returning to baseline sleep and activity levels within 24 hr (Figure 1—figure supplement 3A,B). Second, both Aβshort and Aβlong injected larvae responded normally to salient stimuli such as a light:dark pulse, demonstrating that these larvae were not paralyzed, in a coma, or undergoing sickness behavior (Figure 1—figure supplement 3C). Finally, we considered if the changes in motility in Aβ-injected larvae were seizure-like behaviors. Wild type (WT) zebrafish larvae display ‘burst-and-glide’ movements characterized by single short forward or turn movement followed by a short pause (Figure 1—figure supplement 3D and Figure 1—video 1). In contrast, epileptogenic drugs like the GABA-receptor antagonist PTZ induce electrophysiological and behavioral seizures (Baraban et al., 2005), which are observed as dramatic rearrangements in zebrafish bout structure (Figure 1—figure supplement 3D). The bout structure of Aβrev, Aβshort, and Aβlong injected fish was highly similar to WT behavior (Figure 1—figure supplement 3D,E and Figure 1—video 1), and the high-frequency bouts (HFB) indicative of seizures (Reichert et al., 2019) were only found in PTZ exposed fish but not Aβ injected larvae (Figure 1—figure supplement 3D,E). Together these experiments indicate that exposure to Aβ modulates normal sleep/wake behavior without inducing toxic states.
We conclude that the changes in behavior after Aβ exposure are due to acute signalling events and therefore sought to identify the neuronal and molecular substrates through which Aβ signals to modulate sleep/wake behavior.
Aβshort and Aβlong induce opposing changes in neuronal activity and differentially engage sleep-promoting neurons
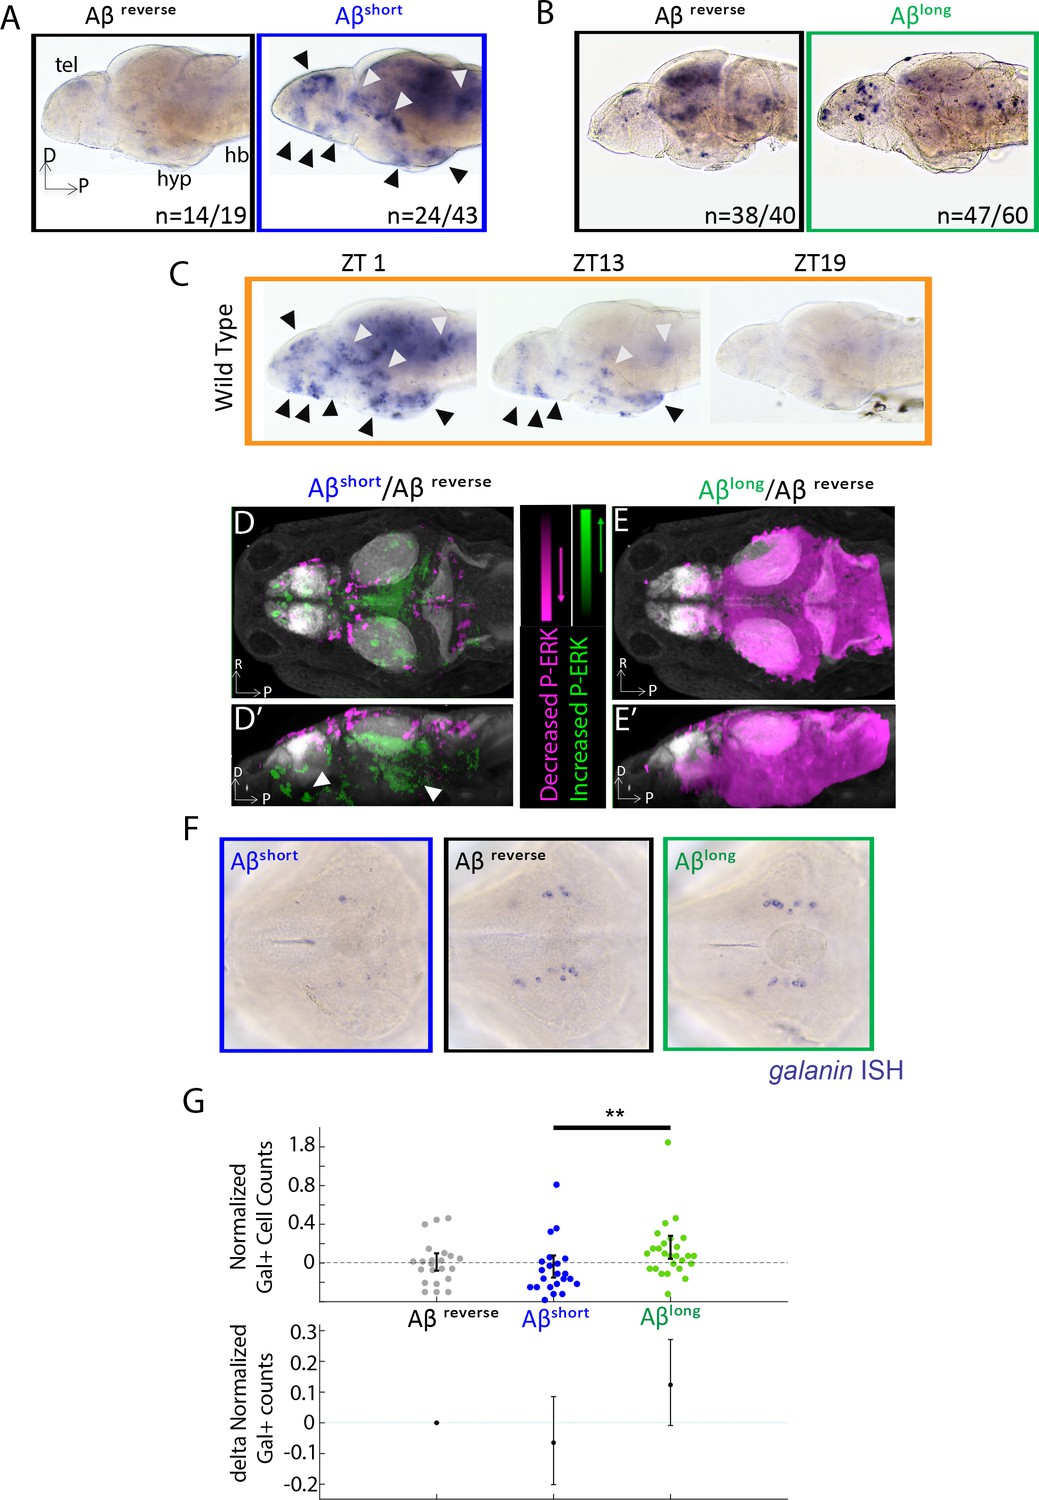
If Aβ oligomers alter behavior through acute signaling in the brain, the differential effects of Aβshort and Aβlong should be reflected at the level of neuronal activity. In situ hybridization (ISH) for expression of the immediate early gene, c-fos, identified several discrete areas of the larval brain that are upregulated after injection of Aβshort relative to Aβrev, including the posterior hypothalamus and the dorsal and ventral telencephalon (Figure 2A), areas that are also upregulated in mutants with extended wakefulness (Ashlin et al., 2018). Comparing the Aβshort induced c-fos patterns to WT brains collected at zeitgeber time 1 (ZT1, ZT0 = lights ON), when larvae are maximally awake, reveals at least nine populations of c-fos-positive neurons in both Aβshort and waking brains (Figure 2A,C). In contrast, c-fos expression following Aβlong injections was globally dampened relative to Aβrev (Figure 2B) in a manner consistent with the low expression of c-fos in WT brains collected at ZT19, when larvae are maximally asleep (Figure 2C).
Figure 2
Aβ oligomers differentially alter neuronal activity in the larval zebrafish brain.
(A) As detected by ISH, the immediate early gene c-fos is upregulated in many larval brain areas following Aβshort injection, including the dorsal and ventral telencephalon (tel) and the posterior hypothalamus (black arrowheads), relative to Aβrev control injections. Other upregulated areas in the midbrain and hindbrain are indicated (white arrowheads). hyp- hypothalamus; hb- hindbrain. D = dorsal, p=Posterior, R = Right. n = blind counts of brains with the shown expression pattern/total brains. 24/43 stringently counts only brains with the major areas upregulated. (B) Compared to Aβrev injections, Aβlong oligomers induce less c-fos expression. The Aβrev and Aβlong treated brains were stained longer than in (A) to ensure detection of weaker c-fos expression. n = blind counts of number of brains with the shown expression/total brains. (C) c-fos is upregulated in many larval brain areas at 10 am (ZT1) awake fish, including the dorsal and ventral telencephalon and the posterior hypothalamus (black arrowheads), and other discrete regions of the mid and hindbrain (white arrowheads). c-fos expression is downregulated in later timepoints (ZT13) and is very low in ZT19 brains, when larvae are predominantly asleep. N = 10 fish/timepoint. (D, D’) Brain expression of the neuronal activity correlate pERK/tERK comparing Aβshort (n = 6) to Aβrev (n = 5) injected larvae identified areas upregulated (green) and downregulated (magenta) by Aβshort. Data are shown as a thresholded maximum projection overlaid on the Z-Brain Atlas tERK reference (gray). White arrowheads indicate regions in the ventral telencephalon and posterior hypothalamus that are upregulated similar to c-fos in (A). Dorsal view in (D), lateral view in (D’). (E, E’) pERK/tERK expression after Aβlong injections (n = 7) shows widespread downregulation of neuronal activity (magenta) compared to Aβrev controls (n = 7), consistent with c-fos data in (B). Dorsal view in (E), lateral view in (E’). (F) As detected by ISH, the number and intensity of hypothalamic galanin-positive neurons are downregulated following Aβshort injection and upregulated following Aβlong injection, relative to Aβrev control injections. Representative images from N = 22–24 per condition. (G) Normalized, blinded counts of hypothalamic galanin-positive cell numbers 4–6 hr after Aβshort and Aβlong injections, relative to Aβrev. Error bars indicate ± SEM. The mean difference effect size and 95% confidence interval is plotted at the bottom. **p<0.01, one-way ANOVA. See also Figure 2—source datas 1 and 2.
-
Figure 2—source data 1
MAP-Mapping of brain areas that are significantly up- and down-regulated in P-ERK levels in response to Aβshort.
- https://cdn.elifesciences.org/articles/53995/elife-53995-fig2-data1-v1.xlsx
-
Figure 2—source data 2
MAP-Mapping of brain areas that are significantly up- and down-regulated in P-ERK levels in response to Aβlong.
- https://cdn.elifesciences.org/articles/53995/elife-53995-fig2-data2-v1.xlsx
Immediate early gene expression is an imperfect readout of changes in neuronal activity and brain state, as baseline c-fos is expressed in low amounts in zebrafish and has a relatively slow time course of 15–30 min for transcription of mRNA (Baraban et al., 2005). We therefore also quantified changes in the more rapid (<5 min) neuronal activity marker, phosphorylated ERK (p-ERK), using the larval zebrafish MAP-Mapping technique (Randlett et al., 2015). This method identifies the relative quantitative changes in brain region-specific levels of p-ERK relative to total ERK between Aβ injections and reverse peptide control conditions. Consistent with c-fos induction, Aβshort upregulated P-ERK in the ventral telencephalon and posterior hypothalamus (Figure 2D and D’, Figure 2—source data 1), while Aβlong resulted in a widespread reduction in p-ERK levels throughout most of the brain (Figure 2E and E’, Figure 2—source data 2). These brain activity states are consistent with the induction of wakefulness by Aβshort and sleep by Aβlong.
Finally, if the behavioral states induced by Aβ are bona fide sleep/wake states, we reasoned that known zebrafish sleep/wake regulatory neurons should be engaged. Galanin-expressing neurons of the preoptic area and hypothalamus are active and upregulate galanin transcription during zebrafish sleep (Reichert et al., 2019). Similarly, ISH for galanin 4–6 hr post-injection of Aβ oligomers revealed that wake-promoting Aβshort slightly decreased (−6%, blinded counts), while sleep-promoting Aβlong slightly increased (+12%, blinded counts), the number of galanin-positive cells in the hypothalamus compared to Aβrev injected larvae (Figure 2F–G). The differential effects on galanin neurons are consistent with that the induction of wakefulness by Aβshort and sleep by Aβlong.
Aβ binding targets are required for behavioral responses to Aβ
Many candidate Aβ binding partners have been implicated in mediating the signalling effects of Aβ on synapses, with some targets showing preferences for Aβ dimers, such as Adrenergic Receptor β2 (ADRB2) (Wang et al., 2010), or low molecular weight (50–75 kDa) species, such as the Progesterone Membrane Receptor Component 1 (PGRMC1) (Izzo et al., 2014b), while other targets preferentially bind to longer oligomers/protofibrils, such as the Prion Protein (PrP) (Laurén et al., 2009; Nicoll et al., 2013). We therefore used Crispr/Cas9 to make genetic lesions in several zebrafish candidate Aβ receptors, choosing examples with reported affinities for various sized Aβ oligomers (Figure 3—figure supplement 1 and Figure 4—figure supplement 1). We isolated a pgrmc1 allele with a 16 bp deletion that leads to a frameshift and early stop codon that truncates the protein before a conserved Cytochrome b5-like Heme/Steroid binding domain (Figure 3—figure supplement 1A–D). We also isolated an adrb2a allele with an 8 bp deletion that leads to a severely truncated protein lacking all transmembrane domains (Figure 3—figure supplement 1E–G). We also obtained a prp1-/-;prp2-/- double mutant (Fleisch et al., 2013; Leighton et al., 2018) that lacks both zebrafish Prp proteins with conserved Aβ binding sites (Figure 4—figure supplement 1). The third zebrafish prion gene product, Prp3, does not have the conserved Aβ binding domains present in Prp1 and Prp2 (Figure 4—figure supplement 1). Except for a mild increase in daytime sleep in adrb2a-/- mutants (Figure 3—figure supplement 2D'–F’), none of these mutants exhibited changes in baseline sleep and wake on a 14 hr:10 hr light:dark cycle as compared to wild type and heterozygous siblings (Figure 3—figure supplement 2A–F’; Figure 4—figure supplement 2A–F’). Under baseline conditions, we also detected no significant differences in day or night sleep and waking activity in prp1-/-;prp2-/- double mutants compared to prp+/+ siblings generated from either prp1+/-; prp2+/- or prp1+/-;prp2-/- in-crosses (Figure 4—figure supplement 2A–F’). The mild baseline phenotypes allowed us to test the effect of Aβ oligomers in these mutants without complex behavioral confounds.
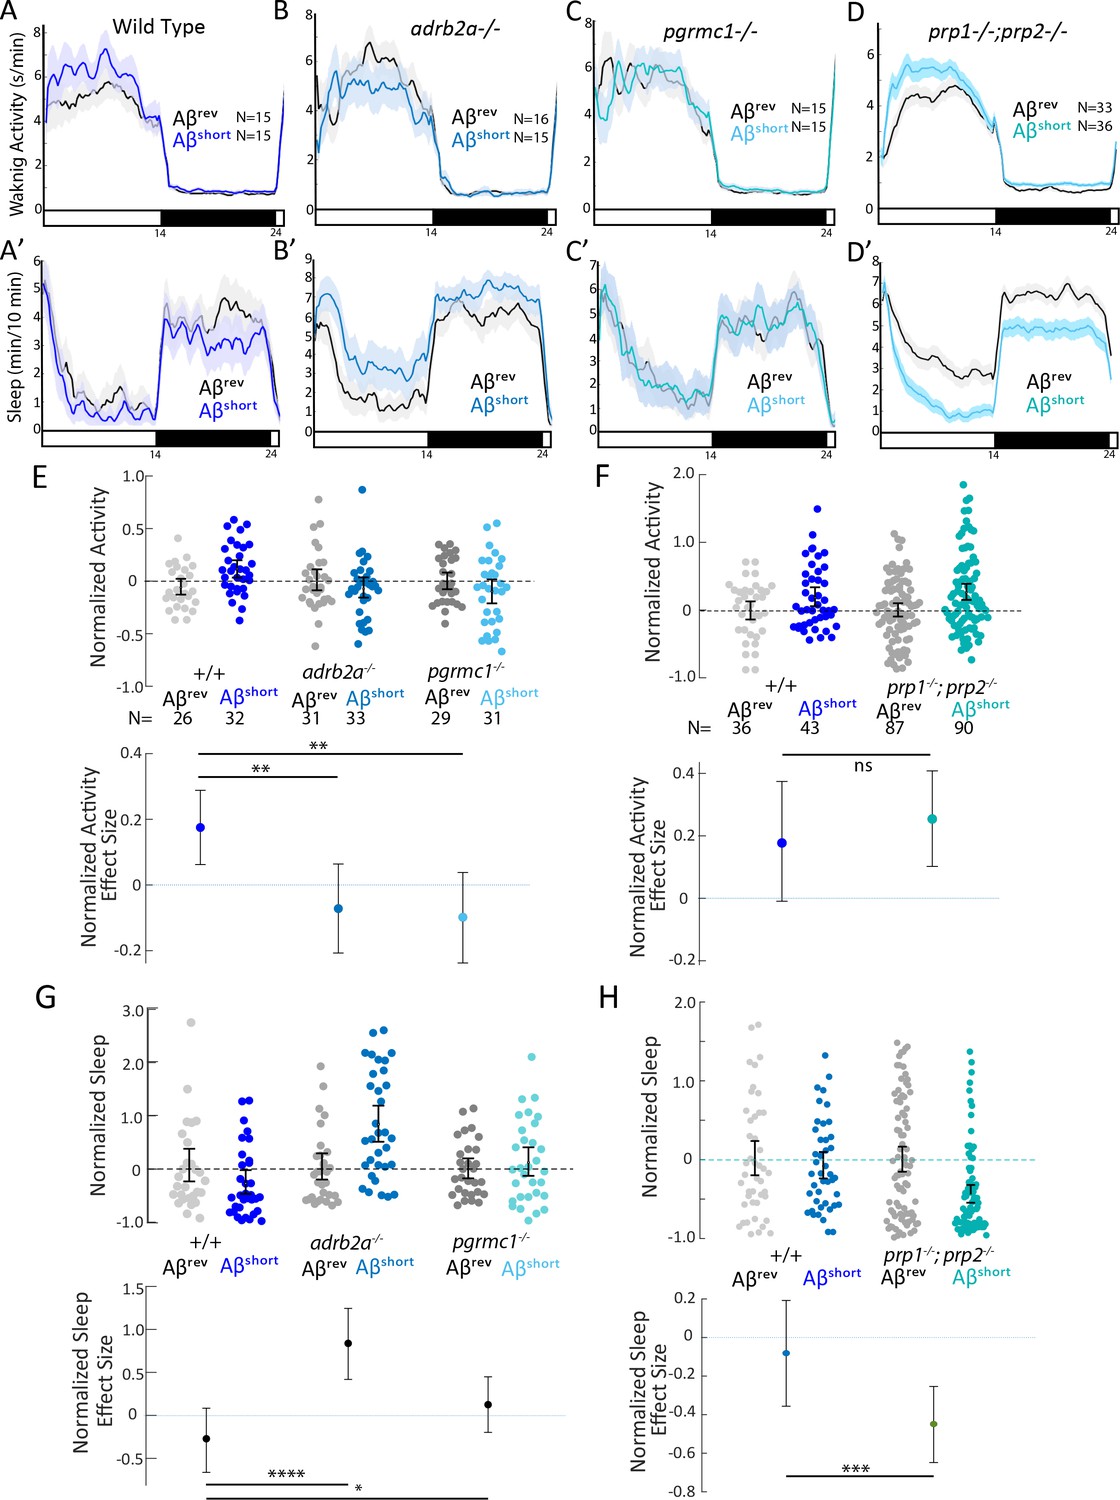
We first tested the effects of Aβshort injection on mutant behavior. Unlike the wild type controls, neither the adrb2a-/- nor the pgrmc1-/- mutants increased waking activity (Figure 3A–C and E) or suppressed sleep as observed in wild-type controls (Figure 3A’–C’ and G). Injection of Aβshort into adrb2a-/- animals even significantly increased sleep (+83.7%) instead of reducing it as in wild-type larvae (Figure 3B’ and G). In contrast, Aβshort injected into mutants that lack both zebrafish Prp orthologs (prp1-/-; prp2-/-) elicited slightly stronger increases in waking activity and significantly large (−45%) reductions in sleep (Figure 3D,D’, F and H). Thus, the wake-promoting activity of Aβshort requires intact Adrb2a and Pgrmc1 but not functional Prp1 and Prp2.
Figure 3 with 2 supplements see all
Wake induction by Aβshort requires Adrb2a and Pgrmc1, but not the Prion Protein.
(A-D’) Exemplar 24 hr traces comparing the effects of Aβshort oligomers on average waking activity (A-D) and sleep (A’-D’) versus Aβrev injected into wild type (A,A’), adrb2a-/- (B,B’), pgrmc1-/- (C,C’), and prp1-/-;prp2-/- mutants (D,D’). (E-H) The effect of Aβshort relative to Aβrev on normalized waking activity (E and F) and sleep (G and H) during the first day is shown. Each dot represents a single larva normalized to the mean of the Aβrev control, and error bars indicate ± SEM. The mean difference effect size and 95% confidence interval are plotted below. N = the number of larvae. The wake inducing and sleep suppressing effects of Aβshort are absent in (E,G) adrb2a-/- and pgrmc1-/- but enhanced in prp1-/-;prp2-/- mutants (F,H). nsp>0.05, *p≤0.05, **p≤0.01, ***p≤0.0001, ****p≤10–5 one-way ANOVA. Data is pooled from n = 2 independent experiments for adrb2a-/-and pgrmc1-/- and n = 3 for prp1-/-;prp2-/-. See also Figure 3—figure supplements 1 and 2.
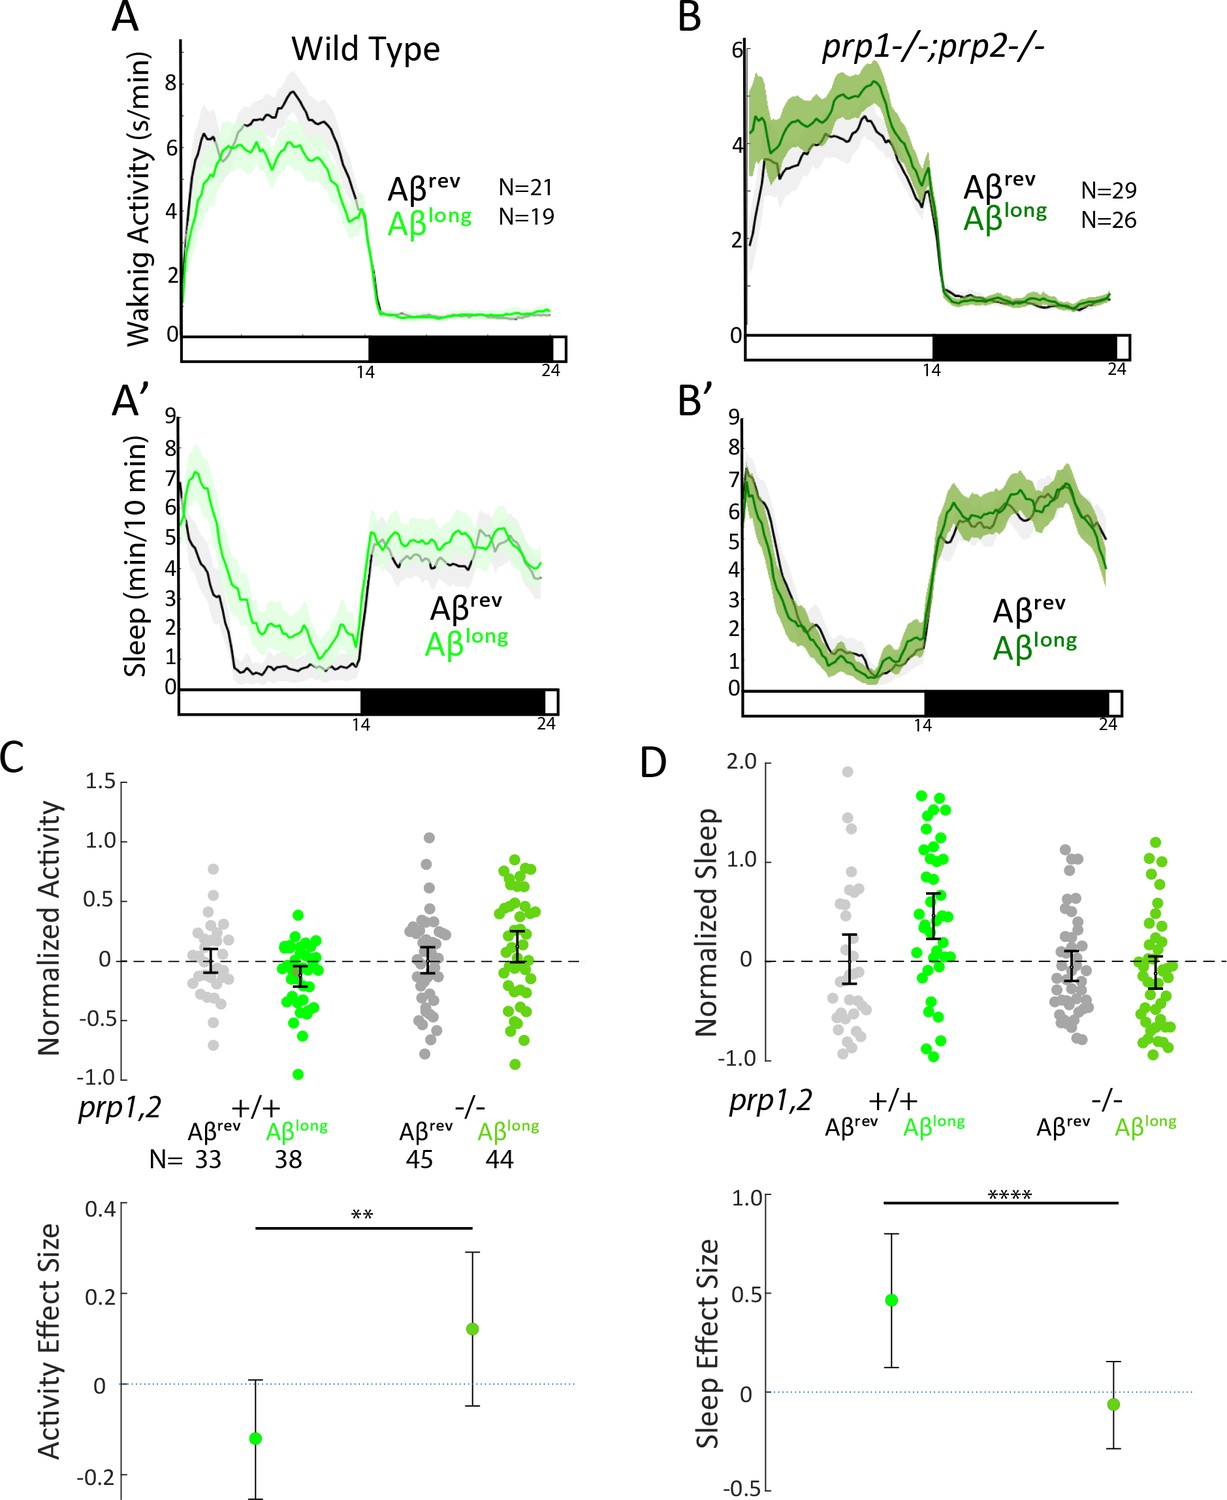
Because the size of oligomeric species in our Aβlong preparation (20–400 nm) falls into the size range that exhibits high-affinity binding to mammalian Prion Protein (PrP) (20–200 nm) and thereby acts to modulate synapses (Gimbel et al., 2010; Laurén et al., 2009; Nicoll et al., 2013; Um et al., 2012), we tested whether PrP is instead required for Aβlong-induced sleep. After injection of Aβlong, prp1-/-;prp2-/- null mutants failed to increase sleep compared to wild-type controls (Figure 4A–D). The modest reduction of wakefulness induced by Aβlong was even reversed in prp1-/-;prp2-/- mutants, with Aβlong instead significantly increasing wakefulness (Figure 4C). Thus, while Prps are not required for the wake-inducing effects of Aβshort, functional Prp1 and Prp2 are essential for sleep induced by Aβlong. Moreover, since prp double mutants have exacerbated wakefulness in response to Aβshort injections, the sleep-inducing Prp pathway is likely co-activated along with the wake-promoting pathway by Aβ to partially dampen the behavioral response of wild-type larvae (Figure 3D and H).
Figure 4 with 2 supplements see all
Sleep induction by Aβlong requires signalling through Prion Protein.
(A-B’) Exemplar 24 hr traces comparing the effects of Aβlong oligomers on average waking activity (A,B) and sleep (A’-B’) versus Aβrev on wild type (A,A’), and prp1-/-;prp2-/- mutant (B,B’) backgrounds. (C-D) The effect of Aβlong relative to Aβrev on normalized waking (C) and sleep (D) on wild type and prp1-/-;prp2-/- mutant backgrounds (mixed prp3 background) during the first day is shown. The activity reducing (C) and sleep promoting (D) effects of Aβlong are blocked in prp1-/-;prp2-/- mutants. **p≤0.01, ****p≤10–5 one-way ANOVA. Data is pooled from n = 3 independent experiments. See also Figure 4—figure supplements 1 and 2.
Mutants lacking Aβ targets have altered brain activity in response to Aβ consistent with behavioral effects
If Aβshort interacts with Adrb2a and Pgrmc1 to drive changes in wakefulness, the increased neuronal activity we observed in wild-type larvae after Aβshort injections (Figure 2A) should also be abolished in the adrb2a-/- and pgrmc1-/- mutant backgrounds. Consistently, lack of either Adrb2a or Pgrmc1 abolished the neuronal activity-inducing effect of Aβshort (Figure 5A), as detected by in situ hybridization for c-fos. In particular, the neuronal activity observed in the posterior hypothalamus and the dorsal and ventral telencephalon after Aβshort into WT controls was not detected after injection into either adrb2a-/- or pgrmc1-/- mutants (Figure 5A). This result is consistent with Aβshort failing to induce wakefulness in these mutants. Similarly, although Aβlong dampens neuronal activity when injected into wild-type larvae, Aβlong injections into the prp1-/-; prp2-/- double mutants elicited no reduction in c-fos expression (Figure 5B). Instead, c-fos expression in the telencephalon and hypothalamus was upregulated relative to reverse injected controls (Figure 5B), consistent with the increased behavioral wakefulness observed in the prp mutants (Figure 4C). Together, these data are consistent with Aβshort acutely upregulating neuronal activity and behavioral wakefulness through interactions with Adrb2a and Pgrmc1, while Aβlong interactions with Prp drive increased sleep and a global reduction in neuronal activity.
Figure 5
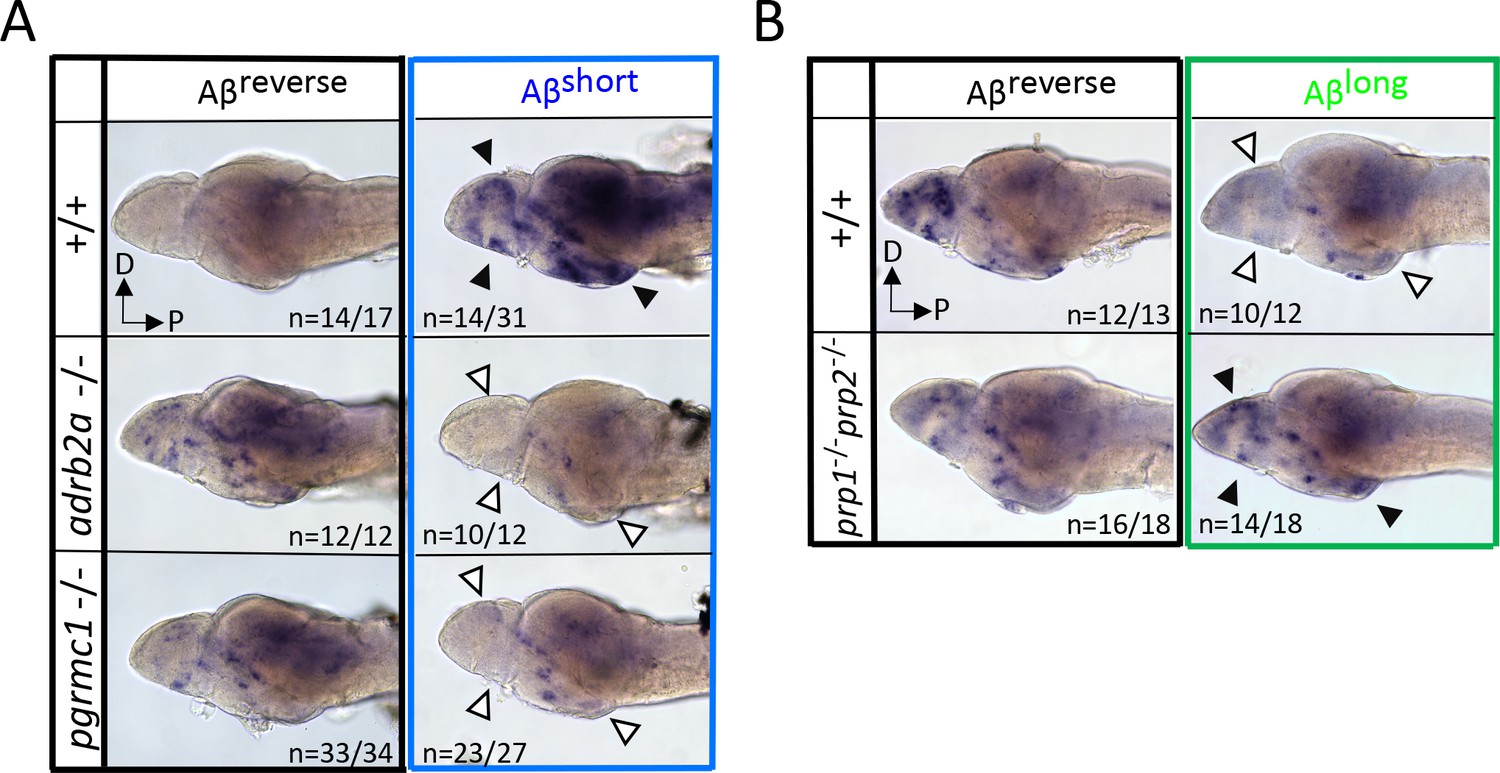
Neuronal activity after exposure to Aβ preparations is altered in mutants of Aβ binding targets.
(A) After Aβshort injection into WT larvae (top right), c-fos is detected in many larval brain areas, including the dorsal and ventral telencephalon and posterior hypothalamus (black arrowheads), but not after injection of Aβ reverse controls (left). In contrast, Aβshort injections into either adrb2a-/- (middle right) or pgrmc1-/- mutants (bottom right) do not induce c-fos expression. The brains in the middle and lower panels were stained longer than the WT (+/+) brains to ensure detection of weaker expression. D = dorsal, p=Posterior. n = blinded counts of brains with expression pattern/total brains. (B) Compared to Aβrev injections, Aβlong oligomers induce less c-fos expression in WT larvae (top panels). In contrast, Aβlong induced relatively increased c-fos expression in the telencephalon and posterior hypothalamus (black arrows) in the prp1-/-; prp2 -/- double mutants. These Aβrev and Aβlonginjectedbrains were stained longer to ensure detection of weaker c-fos expression. D = dorsal, p=Posterior.
Pharmacological blockade of the Prp-mGluR5-Fyn kinase signaling cascade prevents sleep induction by Aβlong
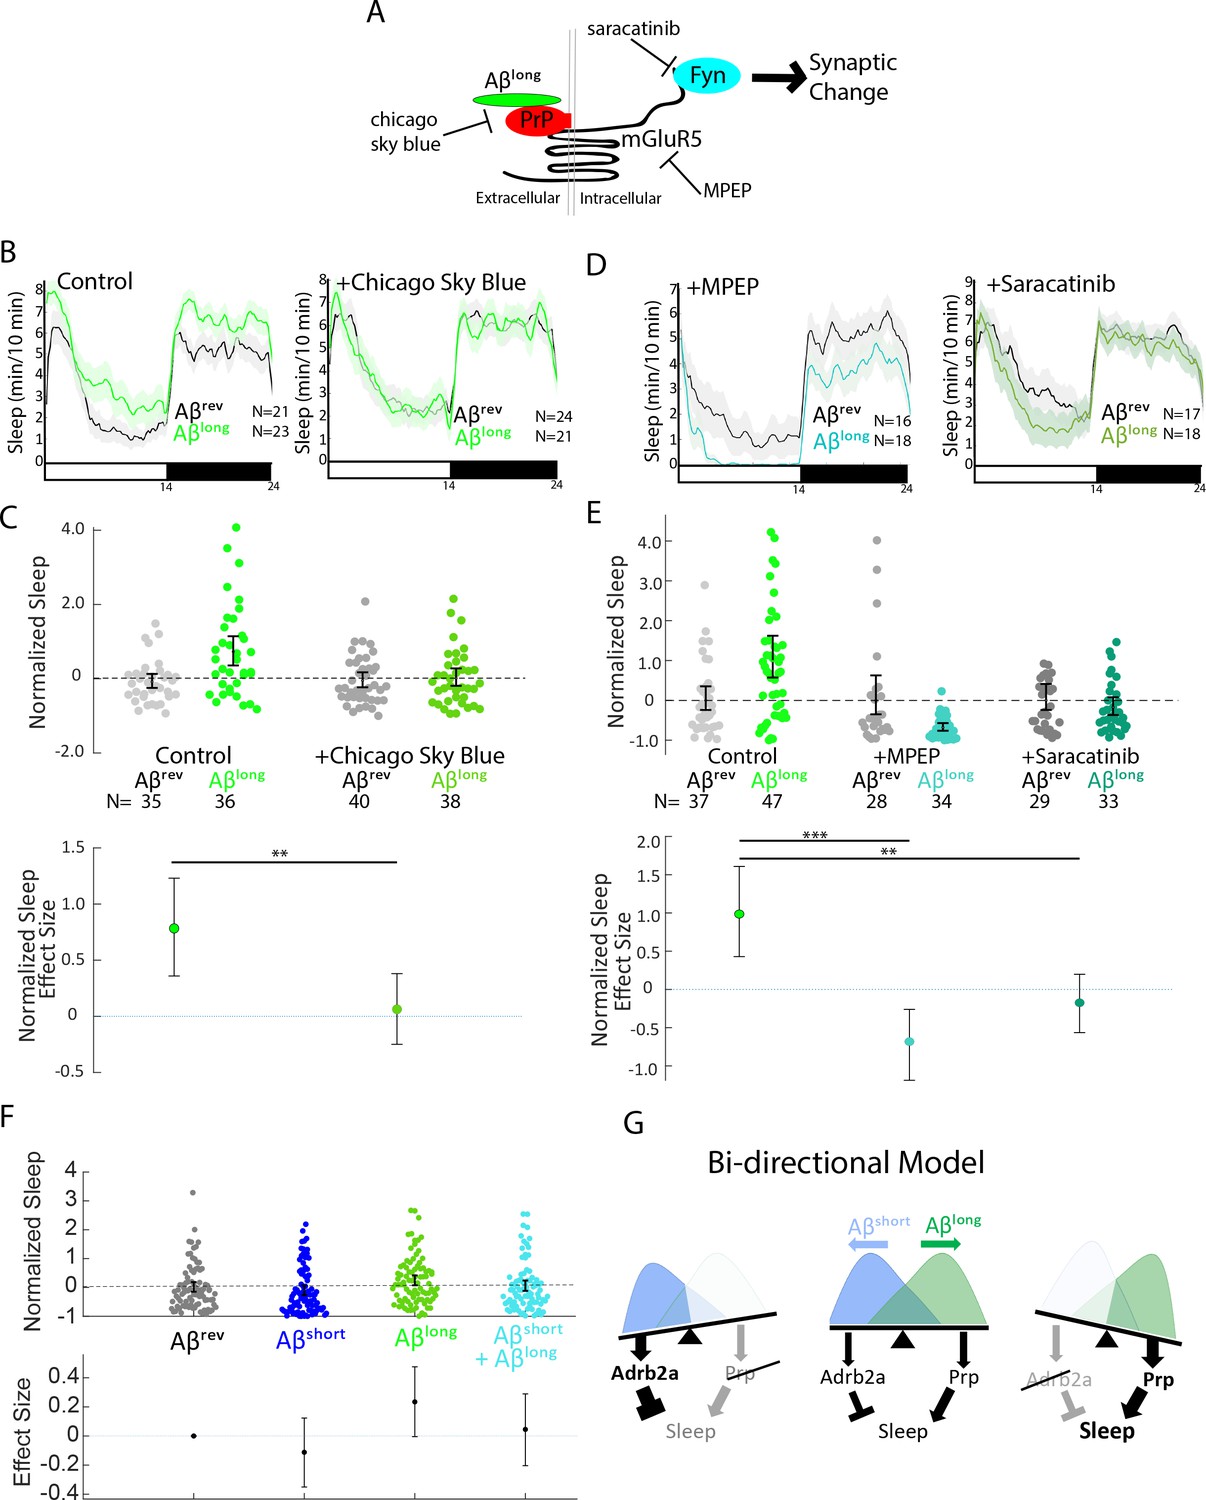
One of the advantages of using the zebrafish model system is the ability to perturb Aβ signalling cascades with small molecule inhibitors added directly to the water (Kokel et al., 2010; Rihel et al., 2010). To further dissect the Aβlong-PrP sleep-inducing pathway, we focused on disrupting the putative signalling cascade downstream of Aβ-Prp interactions that lead to synaptic changes in neuronal culture (Um et al., 2012; Figure 6A). Consistent with a role for direct Aβlong-Prp interactions in sleep, soaking the larvae in Chicago Sky Blue 6B, a small molecule reported to disrupt Aβ-PrP interactions (Risse et al., 2015), significantly abolished the sleep-inducing effect of Aβlong (Figure 6B and C, S7A and Figure 6—figure supplement 1A,B). Similarly, pharmacological inhibition of either of the putative Aβ-Prp downstream signalling components Metabotropic Glutamate Receptor 5 (mGluR5) or Fyn kinase (Um et al., 2013; Um et al., 2012) significantly blocked the sleep-inducing properties of Aβlong (Figure 6D and E, Figure 6—figure supplement 1C,D). Both the mGluR5 inhibitor MPEP and the Src-kinase inhibitor saracatinib even resulted in significant sleep reductions after exposure to Aβlong. Overall, these results are consistent with the effect of genetic ablation of prp1 and prp2. Thus, both genetic and pharmacological interference with several steps of the Aβ-Prp-mGluR5-Fyn kinase signaling cascade prevents the ability of Aβlong to increase sleep behavior.
Figure 6 with 1 supplement see all
Pharmacological blockade of the Aβlong-Prp-mGluR5-Fyn Kinase signaling cascade prevents increases in sleep.
(A) Schematic showing how Aβ–Prp interactions signal through mGluR5 to activate Fyn kinase, leading to synaptic changes (Nygaard et al., 2014). Small molecules that block each step in the pathway are indicated. (B) Representative traces of sleep behavior after Aβlong versus Aβrev injections in the absence (left) or presence (right) of the Aβ-Prion binding disruptor, Chicago Sky Blue 6B (3 nM). Ribbons represent ± SEM. (C) The effect of Aβlong relative to Aβrev on normalized sleep during the first day in the in the absence or presence of 3 nM Chicago Sky Blue 6B. The data is pooled from n = 2 independent experiments **p≤0.01, one-way ANOVA. (D) Representative traces of sleep behavior after Aβlong versus Aβrev injections in the presence of mGluR5 inhibitor MPEP (5 uM, left) and Fyn Kinase inhibitor saracatinib (300 nM, right). Ribbons represent ± SEM. (E) The effect of Aβlong relative to Aβrev on normalized sleep during the first day in the absence or presence of 5 uM MPEP (left) and 300 nM saracatinib (right). Each dot represents a single larva normalized to the mean Aβrev. Data is pooled from two independent experiments. **p≤0.01, ****p≤10–5 one-way ANOVA. (F) The effect of a 1:1 mixture of Aβlong to Aβshort relative to single injections of Aβrev, Aβshort, and Aβlong on normalized sleep during the first day. The data is pooled from n = 4 independent experiments. (G) A bi-directional model for sleep/wake regulation by Aβ. In wild-type animals (centre), injection of Aβshort species signal through Adrb2a/Pgrmc1 to drive wakefulness while Aβlong oligomers signal via Prp to induce sleep. In mutants that lack Prp (left), only Aβshort species (as shown by the overlapping distributions) remain to inhibit sleep with no residual Aβlong oligomers to stimulate the sleep-inducing pathway to counteract wake-inducing signals. Thus prp1-/-; prp2-/- mutants have enhanced wakefulness in response to Aβ. Conversely, mutants that lack Adrb2a/Pgrmc1 (right), retain only the sleep-promoting Aβ pathway and fail to increase wakefulness in response to Aβshort. See also Figure 6—figure supplement 1.
Aβshort and Aβlong affect sleep through distinct neuronal/molecular pathways
Although long and short oligomers require different receptors to affect behavior, they may act within the same neuronal circuit signalling cascade. If so, one phenotype should predominate over the other when the two oligomers are co-administered. Alternatively, oligomers may signal through parallel signalling circuits to bi-directionally modulate sleep in an additive manner. To test this, we co-injected Aβshort and Aβlong in a 1:1 ratio and compared the sleep phenotype to injection of either oligomer alone. As expected, Aβshort alone reduced sleep and Aβlong alone increased sleep. In contrast, co-injection of both Aβshort and Aβlong resulted in an intermediate phenotype that is indistinguishable from control injections of Aβrev (Figure 6F), suggesting that the effects of Aβshort and Aβlong are additive and likely act through distinct neuronal circuits or signaling cascades to modulate sleep.
Considering this result is aligned with the genetic and pharmacological data, we propose a bi-directional model of Aβ sleep regulation in which Aβshort and Aβlong act through distinct receptors and neuronal pathways to independently modulate behavioral state (Figure 6G). In this model, the presence of both oligomers leads a balance of signaling through sleep-promoting and sleep-inhibiting pathways, resulting in little or no change in behavior. Tipping the balance from one oligomeric state to the other leads to either the sleep activating or the sleep inhibiting pathway to predominate.
Discussion
Previous studies have suggested that changes in sleep during AD may further accelerate Aβ accumulation and neuronal damage, creating a vicious cycle that leads to further neuronal dysregulation and increased sleep-wake cycle abnormalities (Roh et al., 2012). Our results show that, depending on its oligomeric form, Aβ can acutely increase or decrease sleep and wake behaviors and brain states through behaviorally relevant molecular targets and independently of neuronal cell death. The exogenous application of Aβ oligomers in our experiments limit the conclusions we can draw about endogenous functions of Aβ, which in vivo may present with different structure, local concentrations, and kinetics. However, the bi-directional Aβ modulation of sleep and wakefulness (Figure 6G) predicts that alterations to the relative concentrations of different Aβ oligomeric forms during healthy aging and AD disease progression will have opposing consequences on sleep and wake behavior.
Distinct molecular pathways for Aβ sleep-wake regulation
We found that Aβshort-triggered wakefulness required intact Adrb2a and Pgrmc1, while Aβlong-induced sleep required functional Prp signalling. These data are consistent with a model in which Aβ directly binds to these targets to modulate downstream signaling cascades that ultimately affect neuronal circuits that regulate behavioral state. Our results match well with previous reports demonstrating binding preferences of Aβ dimers, trimers, and 56 kDa oligomers for different targets in vitro. For example, Aβ dimers, which have been detected in the brains of AD patients ( Vázquez de la Torre et al., 2018), have been shown to directly bind human ADRB2 with high-affinity, causing increased calcium influx and neuronal hyper-activation in rat prefrontal cortical slices (Wang et al., 2010). PGRMC1 can be activated by AD brain extracts (Izzo et al., 2014b) and also has shown preferential binding for 50–75 kDa Aβ species in vitro (Izzo et al., 2014a). Both types of shorter Aβ species that bind to ADRB2 and PGRMC1 fall within the size ranges that induce Adrb2a- and Pgrmc1-dependent wakefulness in zebrafish larvae. Our results are also consistent with studies that have identified PrP as a direct binding partner (Laurén et al., 2009) for longer Aβ-oligomers of 20–200 nm in length (Nicoll et al., 2013), the size range of our sleep-inducing Aβlong preparation. In neuronal culture and slice preparations, longer Aβ-oligomers trigger reduction of synaptic strength (Laurén et al., 2009) via a Prp signaling cascade through mGluR5 and Fyn kinase activation (Um et al., 2012). Similarly, we found that pharmacological blockade of either the direct Aβ-Prp interaction (with Chicago Sky Blue 6B), mGluR5 signalling (with MPEP), Fyn kinase activity (with saracatinib), or by mutation of the Prp receptors prevented the widespread reduction of neuronal activity and increase in sleep that was induced by longer Aβ-oligomers.
Although triggering neuronal and behavioral changes through distinct molecular pathways, several aspects of Aβ’s effects on sleep-wake regulation remain to be elucidated. For example, the elimination of either Adrb2a or Pgrmc1 is sufficient to fully prevent Aβshort-induced wakefulness. This suggests that Adrb2a and Pgrmc1 function in the same molecular pathway, and signaling by Aβ on either alone is insufficient to modulate behavior. Not much is known about how these two receptors interact with one another, but at least one study (Roy et al., 2013) has suggested they can directly physically interact. Whether Aβshort binds both receptors to affect behavior or whether one receptor is an obligate component of the other’s ability to transmit Aβ signals is currently unclear. It also remains unclear if the Aβshort-Adrb2a/Pgrmc1 wake pathway and the Aβlong-Prp sleep pathway occur in the same or different sets of neurons to modulate behavior, as these receptors have widespread expression in zebrafish (Cotto et al., 2005; Málaga-Trillo et al., 2009; Steele et al., 2011; Thisse and Thisse, 2004; Wang et al., 2009), although our co-injection experiment suggests they act on parallel neuronal circuits. Numerous wake- and sleep-promoting neuronal populations that could serve as neuronal targets for these signalling cascades to drive changes in behavioral state have been uncovered in zebrafish (Barlow and Rihel, 2017). Future experiments will be needed to tease out the neuronal components involved, for example by replacing functional receptors into candidate neurons in otherwise mutant animals and rescuing the responses to Aβ, or by mutating receptors selectively in cell types with conditional genetics.
Altered Aβ oligomeric ratio—implications for sleep in health and AD
Our model investigates alterations in sleep/wake behavior due to acute changes in exogenously delivered Aβ levels. Thus, it is possible that the sleep/wake effects observed in our study may be different from those observed when Aβ fluctuates over 24 hr or when it is chronically accumulating as in AD. However, our model predicts that alterations to the ratio of Aβ oligomeric forms present in the brain could have differential effects on sleep-wake regulation, as the balance between sleep- and wake- promoting Aβ signals is tilted to favour one pathway over the other (Figure 6G).
Given the natural daily increase in Aβ secretion during wakefulness and increased levels of Aβ clearance during sleep (Xie et al., 2013), changes in extracellular Aβ levels could sculpt behavior over the normal 24 hr circadian cycle. As Aβ burden is acutely increased by sleep deprivation (Shokri-Kojori et al., 2018), perturbations to the normal sleep-wake cycle may feedback on behavior through altered Aβ signaling. Other phenomena have been reported to alter Aβ generation and fibrilization over short time-scales. For example, temperature changes in the physiological range (35–42°C) have been reported to significantly affect Aβ oligomerization (Ghavami et al., 2013), suggesting that either the natural daily fluctuation in body temperature (in humans, up to 2°C) or the induction of a fever can promote changes in amyloidogenic Aβ generation (Szaruga et al., 2017). In addition, Aβ can act as an antimicrobial peptide (Kumar et al., 2016; Soscia et al., 2010), and microbial infection can trigger Aβ fibrilization (Eimer et al., 2018). Considering that infection and fever are also potent drivers of sleep (Imeri and Opp, 2009), the sleep-inducing Aβ-Prp signaling pathway we identified here could mediate recovery sleep during illness-- a hypothesis for future investigation.
On longer timescales, the amount and type of Aβ oligomeric species (including dimers, cross-linked dimers, trimers, and 56 kDa oligomers) found in healthy brains change across the human life cycle (Lesné et al., 2013) and are heterogeneous and elevated in AD patients (Izzo et al., 2014a; Kostylev et al., 2015). Although the precise makeup of Aβ species present in healthy and AD brains has remained difficult to quantify (Benilova et al., 2012), some studies have indicated that short (dimers, trimers) Aβ oligomers are more enriched in the early, mild cognitive impairment (MCI) stages of AD, while longer oligomers predominate in the CSF at later clinical stages of AD (De et al., 2019). Similarly, AD progression is associated with increasingly large disruptions in sleep patterns, with patients exhibiting high levels of sleep fragmentation, a lack of circadian rhythm, night-time insomnia and irregular daytime napping throughout the day (Videnovic et al., 2014). One possibility consistent with our data is that sleep symptoms of both normal aging and AD may reflect changes in Aβ burden that lead to an altered balance in sleep- and wake-promoting signaling cascades. These signaling molecules might therefore be potential therapeutic targets for treating disrupted sleep early in AD progression, which may in turn slow disease progression.
Materials and methods
See the Key Resources Table (Appendix 1—key resources table) for details of reagents.
Zebrafish strains and husbandry
Request a detailed protocolZebrafish (Danio rerio) were raised under standard conditions at 28°C in a 14:10 light:dark cycle and all zebrafish experiments and husbandry followed standard protocols of the UCL Zebrafish Facility. AΒ, TL and AΒxTup wild-type strains were used in this study. prp1 (ua5003/ua5003), prp2 (ua5001/5001), adrb2a (u511/u511) and pgrmc1 (u512/u512) mutants were outcrossed multiple times, and pgrmc1 F2 and adrb2a F2 and later generations were used for behavior. Ethical approval for zebrafish experiments was obtained from the Home Office UK under the Animal Scientific Procedures Act 1986 with Project licence numbers 70/7612 and PA8D4D0E5 to JR.
Aβ preparations
Request a detailed protocolHFIP treated Aβ42 peptide (JPT Peptide Technologies) and Aβ42–1 reversed peptide (Sigma) were dissolved in DMSO, vortexed occasionally for 12 min at room temperature and sonicated for 5 min to obtain 100 μM solution. The stock solutions were aliquoted as 5 μl in individual tubes and are kept are −80°C. 1 μl of the 100 μM stock was diluted in (Phosphate buffered saline) PBS to yield 10 μM solutions which were incubated at 4°C, 25°C or 37°C for 24 hr (Kusumoto et al., 1998; Orbán et al., 2010; Whitcomb et al., 2015). 1 hr before injecting, this stock was diluted to 10 nM using 1:10 serial dilutions in PBS and kept at the respective temperature (4°C, 25°C, 37°C) until injecting.
Transmission Electron Microscopy (TEM)
Request a detailed protocol1 μl of (4°C, 25°C or 37°C incubated) 10 μM Aβ solution was loaded onto formvar/carbon coated 300 mesh grids from Agar Scientific. The grid was washed twice in 20 mM phosphate buffer for 10 s and negatively stained in 2% aqueous uranyl acetate for 30 s. After drying for 2–3 days, samples were imaged using a Phillips TEM. At least five micrographs were used for each condition to blindly measure the length of the Aβ42 oligomeric structures using at least 30 measurements/condition. Using FIJI, 30–50 measurements were taken for each condition by drawing a free-hand line on the fibril, which was then scaled using the scale bar.
Heart injections
Request a detailed protocolInjections were carried out blindly with a Pneumatic PicoPump (WPI) and glass capillary needles (Science Products Gmbh) prepared with a Micropipette Puller (Shutter Instruments). Five dpf larvae were anesthetized using 4% Tricaine (42 mg/L, Sigma) 30 min before injections. Larvae were immobilized in 1.8% low melting point agarose (ThermoFischer) in fish water on their sides on a slide. 1 nL of Aβ (10 nM starting concentration) was injected into the heart chamber of the fish along with a high molecular weight fluorescent dye (2000 kDa dextran-conjugated FITC (3 mg/ml, Sigma). We estimate that 1 nl of a 10 nM Aβ injection into a ~ 3.01 (±0.16) x108 µm3(285–317 nL) 5dpf larva yields a final monomeric brain/CSF concentration of ~28–32 pM. The success of the injection was checked under a standard fluorescent scope by the presence of fluorescence in the heart of the animal. Larvae were transferred to fresh fish water for 20 min to recover from Tricaine and transferred to sleep/wake behavior box. For drug blocking experiments, zebrafish larvae were soaked into 3 nM Chicago Sky Blue 6B (Sigma), 5 μM MPEP (Cambridge Biosciences), or 300 nM Saracatinib (Generon) 1 day before the injections (from 4 to 5 dpf). Fluorescently tagged HiLyte Fluor 647-labeled Aβ42 (Eurogentech LTD) was injected at 10 µM.
Behavioral experiments
Request a detailed protocolLarval zebrafish behavioral experiments were performed and analysed as described (Rihel et al., 2010). Briefly, 5 dpf larvae were transferred to 96 square-well plates and continuously illuminated with IR and white lights from 9 am to 11 pm in a Zebrabox (Viewpoint life sciences) for 24–48 hr. The movement of each larva was measured and duration of movement was recorded with an integration time of 10 s. Data were processed according to Rihel et al., 2010, and statistical tests were performed using MATLAΒ. Mutant larval zebrafish experiments were performed on siblings from heterozygous in-crosses, differing only in the mutation of the specific gene and genotyped at the end of the experiment.
Dark pulse experiments
Request a detailed protocolLarvae were placed in the behavior tracking boxes, and two or three dark pulses for 10 min with a 2–4 hr interval were introduced in four independent experiments. For data analysis, only the dark pulses after the acclimatization period in the late afternoon were combined for each genotype.
In situ hybridization
Request a detailed protocolRNA in situ hybridization (ISH) to detect c-fos and galanin was performed as described (Thisse and Thisse, 2008). Zebrafish larvae were fixed in 4% paraformaldehyde in PBS at 4°C overnight. A template for in vitro transcription was generated by PCR using a reverse primer that contains a T7 promoter sequence 5’-TAATACGACTCACTATAGGG-3’ from cDNA. A digoxygenin (DIG)-labelled antisense RNA probe was synthesized using the DIG labelling kit (Roche) and T7 RNA polymerase according to the manufacturer’s recommendations. The probe was detected with anti-DIG-AP antibody (1:2,000, Roche) and nitro-blue tetrazolium chloride (NBT)/5-bromo-4-chloro-3′-indolyphosphate (BCIP) substrate (Roche) according to published protocols. To detect the differences in expression between the mutant backgrounds and WTs after Aβshort and Aβlong injection, larvae were incubated and washed in the same tubes throughout the ISH procedure to avoid staining artefacts. To do this, larvae from different genotypes were marked by cutting the tail to allow identification after ISH. The brains were exposed by dissection, keeping the brain and spinal cord intact. Embryos were stored in 60% glycerol/PBS for imaging.
Baseline c-fos ISH
Request a detailed protocolZebrafish larval siblings were kept in 14:10 day/night normal or reverse-cycle incubators. 50 larvae were collected at each time point (ZT1, ZT13, and ZT19) and fixed in 4% paraformaldehyde in PBS overnight. RNA in situ hybridization (ISH) to detect c-fos was performed as described (Thisse and Thisse, 2008).
KASP genotyping
Request a detailed protocolFor rapid genotyping of mutant zebrafish harbouring the adrb2aΔ8 and pgrmc1Δ16 alleles, a mutant allele-specific forward primer, a wild-type allele-specific forward primer and a common reverse primer were used (LGC Genomics). The primer sequences were targeted against the following:
adrb2a
5’TTTTACTACTTACTGTTTGCACAAACCTATGTTAACTGTGTTAACGTGTTTTCTTCTGCTTTTCTTTCTTGATCTCTGTCAGGTCATGGGAAACATAAGGTCCTCAATACC[CGAAGATC/-]TTATCTGTCCAAACAATACTAATGCCTCCACCAAAAGCGAACTACAGATGACAGTGCTGGGCACACTCATGTCCATTCTTGTCTTGATCATCGTCTTTGGCAATGTGATGGTGATTACAGCCA-3’
pgrmc1
5’ATGGCTGAAGAAGCAGTCGAGCAAACTTCTGGAATCCTTCAGGAAATTTTCACGTCGCCACTGAACATCAGTTTGCTATGTCTTTGTTTGTTCCTACTTTACAAAATCATCCGCGGAGACAAGCC[TGCAGACTATGGCCCG/-]GYTGAGGAGCCGCTGCCCAAACTCAAGAAAAGAGATTTYACTTTAGCAGATCTGCAAGAGTACGATGGACTGAAAAACCCAAGAATCCTGATGGCTGTCAACGGG-3’
where [x/-] indicates the indel difference in [WT/mutant]. PCR amplification was performed using KASP Master mix (LGC Genomics) according to the manufacturer’s instructions. Fluorescence was read on a CFX96 Touch Real-Time PCR Detection System (Bio-Rad) and the allelic discrimination plot generated using Bio-Rad CFX Manager Software.
Time lapse confocal microscopy
Request a detailed protocolThree Casper larvae at five dpf were mounted dorsally on a slide in 1.5% agarose. 10 nl of Aβ42-Hi488 was intra-cardiac injected to embryos, control fish were untreated. Fish were imaged for 6 min taking 2-μm-thick stacks through the whole brain using a confocal microscope (Leica SP8). Each fish was imaged every 20 min for 8 hr.
pERK/tERK staining and activity Mapping
Request a detailed protocolLarvae were fixed overnight at 4°C in 4% paraformaldehyde (PFA) and 4% sucrose in PBS; permeabilized 45 min in 0.05% trypsin-EDTA on ice; blocked 6 hr at room temperature (RT) in phosphate buffered saline plus 0.05% Triton (PBT) plus 2% normal goat serum, 1% BSA, and 1% DMSO; and then incubated over sequential nights at 4°C in primary antibodies (Cell Signaling Technology 4370 and 4696; 1:500) and secondary antibodies conjugated with Alexa fluorophores (Life Technologies; 1:200) in PBT plus 1% BSA and 1% DMSO.
Larvae were mounted in 1.5% low melt agarose and imaged with a custom two-photon microscope (Bruker; Prairie View software) with a 203 water immersion objective (Olympus).
Images were noise filtered using a custom MATLAB (The MathWorks) scripts and registered into Z-Brain using the Computational Morphometry Toolkit (http://www.nitrc.org/projects/cmtk/) with the command string: -a -w -r 0102 l af -X 52 C 8 G 80 R 3 -A ‘–accuracy 0.4 –auto-multi-levels 4’ -W ‘–accuracy 1.6’ -T 4. Registered images were prepared using a custom MATLAB/MIJ (http://bigwww.epfl.ch/sage/soft/mij/) script to downsize, blur, and adjust the maximum brightness of each stack to the top 0.1% of pixel intensities to preserve dynamic range. Activity maps were generated using MATLAB scripts (Randlett et al., 2015).
Crispr/Cas9 mutant generation
Request a detailed protocolThe CRISPR design tool CHOPCHOP (http://chopchop.cbu.uib.no) was used to identify a target region in zebrafish adrb2a and pgrmc1 (Labun et al., 2019). The gene-specific oligomers were ordered from Thermofisher including the 5’ and 3’ tags:
For adrb2a:
5’ATTTAGGTGACACTATAGTTTGGACAGATAAGATCTTGTTTTAGAGCTAGAAATAGCAAG-3’
For pgrmc1:
5’ATTTAGGTGACACTATATGCAGACTATGGCCCGGTTGGTTTTAGAGCTAGAAATAGCAAG-3’
Constant oligomer:
5’AAAAGCACCGACTCGGTGCCACTTTTTCAAGTTGATAACGGACTAGCCTTATTTTAACTTGCTATTTCT AGCTCTAAAAC-3’
The constant oligomer and the gene-specific oligomer were annealed on a PCR machine and filled in using T4 DNA polymerase (NEB) (Gagnon et al., 2014). The template was cleaned up using a PCR clean-up column (Qiaquick) and the product was verified on a 2% agarose gel. The sgRNA was transcribed from this DNA template using Ambion MEGAscript SP6 kit (Gagnon et al., 2014). Cas9 mRNA and the purified sgRNA were co-injected into one-cell stage embryos at a concentration of 200 ng and 100 ng per embryo, respectively.
Caspase-3 staining
Request a detailed protocol5dpf larvae that were injected with Aβ oligomers or soaked in Camptothecin (1 µM; Sigma Aldrich) were fixed 5 hr after injection/drug treatment in 4% PFA and kept overnight at 4°C. Brains were dissected and dehydrated the next day and were washed three times in PDT buffer (0.3 Triton-X in PBST with 1% DMSO) and incubated with Caspase-3 antibody (1:500; BD Biosciences) at 4°C. The brains were incubated with Alexa Fluor 568 goat anti-rabbit antibody (1:200; Invitrogen) next day at 4°C overnight and imaged using a confocal microscope.
Statistical analyses
Request a detailed protocolFor data analyses, we used a Gardner-Altman estimation plot, which visualizes the effect size and displays an experimental dataset’s complete statistical information (Ho et al., 2019). The bootstrapped 95% confidence interval (CI) was calculated from 10,000 bootstrapped resamples (Ho et al., 2019).
Details of statistics used in each panel are also described in the figure legend. For multiple comparisons, data was first tested for normality by the Kogloromov-Smirnov (KS) statistic and extreme outliers were discarded by Grubb’s test (p≤0.01). Those that violated normality were analysed with the non-parametric Kruskal-Wallis test, with either Tukey-Kramer or Bonferonni post hoc testing; otherwise, data was analysed with one-way ANOVA followed by Tukey’s post-hoc testing. For dose response curves, a two-way ANOVA was performed to test the interaction effects between preparation type and dose. For return to baseline statistics, paired t-tests were performed. Survival curves were analysed with Kaplan-Meier log rank test. All statistical tests and graphs were generated in MATLAB (R2015a) loaded with the Statistical Toolbox. Injection and tracking experiments were performed blinded.
Appendix 1
Appendix 1—key resources table
| Reagent type (species) or resource | Designation | Source or reference | Identifiers | Additional information |
|---|---|---|---|---|
| Gene (Danio rerio) | prp1 | Leighton et al., 2018 PMID:29903907 | ZFIN ID: ZDB-GENE-041221-2 | |
| Gene (Danio rerio) | prp2 | Fleisch et al., 2013 PMID:23523635 | ZFIN ID: ZDB-GENE-041221-3 | |
| Gene (Danio rerio) | adrb2a | This paper | ZFIN ID: ZDB-GENE-100414-3 | |
| Gene (Danio rerio) | pgrmc1 | This paper | ZFIN ID: ZDB-GENE-041114-91 | |
| Strain background (Danio rerio) | AB | UCL Fish Facility | ||
| Strain background (Danio rerio) | TL | UCL Fish Facility | ||
| Strain background (Danio rerio) | ABxTup | UCL Fish Facility | ||
| Strain (Danio rerio) | prp1 (ua5003/ua5003) mutant | Leighton et al., 2018 PMID:29903907 | ZFIN ID: ZDB-ALT-181113-1 | |
| Strain (Danio rerio) | prp2 (ua5001/5001) mutant | Leighton et al., 2018 PMID:29903907 | ZFIN ID: ZDB-ALT-130724-2 | |
| Strain (Danio rerio) | adrb2a (u511/u511) mutant | This paper | Allele will be added to ZFIN upon publication acceptance | |
| Strain (Danio rerio) | pgrmc1 (u512/u512) mutant | This paper | Allele will be added to ZFIN upon publication acceptance | |
| Antibody | anti-DIG-AP antibody (Sheep) polyclonal | Roche | Cat # 14608125; RRID:AB_2734716 | (1:2000) |
| Antibody | anti-Active Caspase 3 (Rabbit) | BD Biosciences | Cat # 559565; RRID:AB_397274 | (1:500) |
| Antibody | p44/42 MAP Kinase (L34F12) Mouse mAb | Cell Signaling | Cat # 4696; RRID:AB_390780 | (1:500) |
| Antibody | Phospho-p44/42 MAPK(Erk1/2)(Thr202/Tyr204) Rabbit mAb | Cell Signaling | Cat # 4370; RRID:AB_2315112 | (1:500) |
| Antibody | Alexa Fluor 568 goat anti-mouse, polyclonal | Thermo Fisher Scientific | Cat # A-11031; RRID:AB_144696 | (1:200) |
| Antibody | Goat anti-Rabbit IgG Alexa 488, polyclonal | Thermo Fisher Scientific | Cat # A-11034; RRID:AB_2576217 | (1:200) |
| Sequence-based reagent | galanin probe | Chen et al., 2017 PMID:28648499 | Plasmid for galanin ISH riboprobe | |
| Sequence-based reagent | c-fos probe | Reichert et al., 2019 PMID:31537465 | Plasmid for c-fos ISH riboprobe | |
| Sequence-based reagent | adrb2a | This paper | Gene-specific oligomer for CRISPR | 5’ATTTAGGTGACACTATAGTTTGGACAGATAAGATCTTGTTTTAGAGCTAGAAATAGCAAG-3’ |
| Sequence-based reagent | pgrmc1 | This paper | Gene-specific oligomer for CRISPR | 5’ATTTAGGTGACACTATATGCAGACTATGGCCCGGTTGGTTTTAGAGCTAGAAATAGCAAG-3’ |
| Sequence-based reagent | gRNA constant region | Thermofisher | Constant oligomer for CRISPR | 5’AAAAGCACCGACTCGGTGCCACTTTTTCAAGTTGATAACGGACTAGCCTTATTTTAACTTGCTATTTCT AGCTCTAAAAC-3’ |
| Peptide, recombinant protein | Beta-Amyloid (1-42); HFIP treated | JPT Peptide Technologies | Cat# SP-Ab-07_0.5 | |
| Peptide, recombinant protein | Amyloid β 42-1 reverse human | Sigma Aldrich | Cat# SCP0048 | |
| Peptide, recombinant protein | ß-Amyloid (1-42), HiLyte Fluor 647-labeled | Eurogentech LTD | Cat# AS-64161 | |
| Commercial assay or kit | T4 DNA polymerase | NEB | Cat# M0203S | |
| Commercial assay or kit | PCR clean-up column kit | Qiaquick | Cat# 28104 | |
| Commercial assay or kit | Ambion MEGAscript SP6 kit | Ambion | Cat# AM1330 | |
| Chemical compound, drug | 2000 kDa dextran-conjugated FITC | Sigma Aldrich | Cat# 52471 | 3 mg/ml |
| Chemical compound, drug | Chicago Sky Blue 6B | Sigma Aldrich | Cat# C8679 | 3 nM |
| Chemical compound, drug | MPEP | Cambridge Biosciences | Cat# CAY14536 | 5 μM |
| Chemical compound, drug | Saracatinib | Generon | Cat# A2133 | 300 nM |
| Chemical compound, drug | Pentylenetetrazol (PTZ) | Sigma Aldrich | Cat# P6500 | 10 mM |
| Chemical compound, drug | Camptothecin | Sigma Aldrich | Cat# 208925 | 1 uM |
| Software, algorithm | Sleep analysis2 | Rihel et al., 2010 PMID:21111222 | ||
| Software, algorithm | Dabest estimation plots | Ho et al., 2019 PMID:31217592 |
Data availability
All data generated or analyzsed during this study are included in the manuscript and supporting files.
References
-
Zebrafish sleep: from geneZZZ to neuronZZZCurrent Opinion in Neurobiology 44:65–71.https://doi.org/10.1016/j.conb.2017.02.009
-
The toxic aβ oligomer and Alzheimer's disease: an emperor in need of clothesNature Neuroscience 15:349–357.https://doi.org/10.1038/nn.3028
-
Hypocretin (orexin) loss in Alzheimer's diseaseNeurobiology of Aging 33:1642–1650.https://doi.org/10.1016/j.neurobiolaging.2011.03.014
-
Memory impairment in transgenic alzheimer mice requires cellular prion proteinJournal of Neuroscience 30:6367–6374.https://doi.org/10.1523/JNEUROSCI.0395-10.2010
-
How (and why) the immune system makes us sleepNature Reviews Neuroscience 10:199–210.https://doi.org/10.1038/nrn2576
-
APPSw transgenic mice develop age-related A beta deposits and neuropil abnormalities, but no neuronal loss in CA1Journal of Neuropathology and Experimental Neurology 56:965–973.https://doi.org/10.1097/00005072-199709000-00002
-
Amyloid-β receptors: the good, the bad, and the prion proteinJournal of Biological Chemistry 291:3174–3183.https://doi.org/10.1074/jbc.R115.702704
-
Rapid behavior-based identification of neuroactive small molecules in the zebrafishNature Chemical Biology 6:231–237.https://doi.org/10.1038/nchembio.307
-
Amyloid-β peptide protects against microbial infection in mouse and worm models of alzheimer’s diseaseScience Translational Medicine 8:340ra72.https://doi.org/10.1126/scitranslmed.aaf1059
-
CHOPCHOP v3: expanding the CRISPR web toolbox beyond genome editingNucleic Acids Research 47:W171–W174.https://doi.org/10.1093/nar/gkz365
-
Prion gene paralogs are dispensable for early zebrafish development and have nonadditive roles in seizure susceptibilityJournal of Biological Chemistry 293:12576–12592.https://doi.org/10.1074/jbc.RA117.001171
-
Sleep is related to neuron numbers in the ventrolateral preoptic/intermediate nucleus in older adults with and without Alzheimer’s diseaseBrain : A Journal of Neurology 137:2847–2861.https://doi.org/10.1093/brain/awu222
-
Disturbances of sleep and cognitive functioning in patients with dementiaNeurobiology of Aging 3:371–377.https://doi.org/10.1016/0197-4580(82)90025-2
-
Using the zebrafish model for alzheimer's disease researchFrontiers in Genetics 5:189.https://doi.org/10.3389/fgene.2014.00189
-
Fyn kinase inhibition as a novel therapy for Alzheimer’s diseaseAlzheimer's Research & Therapy 6:8.https://doi.org/10.1186/alzrt238
-
Amyloid precursor protein processing and Alzheimer's diseaseAnnual Review of Neuroscience 34:185–204.https://doi.org/10.1146/annurev-neuro-061010-113613
-
Hypocretin/orexin overexpression induces an insomnia-like phenotype in zebrafishJournal of Neuroscience 26:13400–13410.https://doi.org/10.1523/JNEUROSCI.4332-06.2006
-
Whole-brain activity mapping onto a zebrafish brain atlasNature Methods 12:1039–1046.https://doi.org/10.1038/nmeth.3581
-
Identification of a compound that disrupts binding of Amyloid-β to the prion protein using a novel Fluorescence-based assayJournal of Biological Chemistry 290:17020–17028.https://doi.org/10.1074/jbc.M115.637124
-
Disruption of the Sleep-Wake cycle and diurnal fluctuation of -Amyloid in Mice with Alzheimer's Disease PathologyScience Translational Medicine 4:150ra122.https://doi.org/10.1126/scitranslmed.3004291
-
Novel, gel-free proteomics approach identifies RNF5 and JAMP as modulators of GPCR stabilityMolecular Endocrinology 27:1245–1266.https://doi.org/10.1210/me.2013-1091
-
In vivo and in vitro assessment of cardiac beta-adrenergic receptors in larval zebrafish (Danio rerio)Journal of Experimental Biology 214:1445–1457.https://doi.org/10.1242/jeb.052803
-
WebsiteFast release clones: a high throughput expression analysisZFIN Direct Data Submission . Accessed July 7, 2020.
-
Alzheimer amyloid-β oligomer bound to postsynaptic prion protein activates Fyn to impair neuronsNature Neuroscience 15:1227–1235.https://doi.org/10.1038/nn.3178
-
'The clocks that time us'--circadian rhythms in neurodegenerative disordersNature Reviews Neurology 10:683–693.https://doi.org/10.1038/nrneurol.2014.206
-
Binding of amyloid β peptide to beta2 adrenergic receptor induces PKA-dependent AMPA receptor hyperactivityFASEB Journal : Official Publication of the Federation of American Societies for Experimental Biology 24:3511–3521.https://doi.org/10.1096/fj.10-156661
Article and author information
Author details
Funding
University College London (Excellence Fellowship)
- Jason Rihel
European Research Council (282027)
- Jason Rihel
Alzheimer's Research UK
- Jason Rihel
Alzheimer Society of Alberta and Northwest Territories
- W Ted Allison
Alberta Prion Research Institute of Alberta Innovates
- W Ted Allison
Alzheimer Society of Canada
- Patricia LA Leighton
Alberta Innovates
- Patricia LA Leighton
Wellcome (217150/Z/19/Z)
- Jason Rihel
The funders had no role in study design, data collection and interpretation, or the decision to submit the work for publication.
Acknowledgements
We thank Tom Hawkins and Mark Turmaine for assistance with TEM, Gaia Gestri for assistance with heart injections and Marcus Ghosh for assistance with tERK/pERK experiments. We also thank Dervis Salih, Steve Wilson, and John Hardy for their comments and all first-floor fish lab members for their input throughout the project.
Ethics
Animal experimentation: Ethical approval for zebrafish experiments was obtained from the Home Office UK under the Animal Scientific Procedures Act 1986 with Project licence numbers 70/7612 and PA8D4D0E5 to JR.
Copyright
© 2020, Özcan et al.
This article is distributed under the terms of the Creative Commons Attribution License, which permits unrestricted use and redistribution provided that the original author and source are credited.
Metrics
-
- 3,432
- views
-
- 389
- downloads
-
- 38
- citations
Views, downloads and citations are aggregated across all versions of this paper published by eLife.
Citations by DOI
-
- 38
- citations for umbrella DOI https://doi.org/10.7554/eLife.53995
Download links
A two-part list of links to download the article, or parts of the article, in various formats.
Downloads (link to download the article as PDF)
Open citations (links to open the citations from this article in various online reference manager services)
Cite this article (links to download the citations from this article in formats compatible with various reference manager tools)
Sleep is bi-directionally modified by amyloid beta oligomers
eLife 9:e53995.
https://doi.org/10.7554/eLife.53995


