Movement initiation and grasp representation in premotor and primary motor cortex mirror neurons
- Department of Clinical and Movement Neurosciences, UCL Institute of Neurology, United Kingdom
- Gatsby Computational Neuroscience Unit, University College London, United Kingdom
Figures
Figure 1
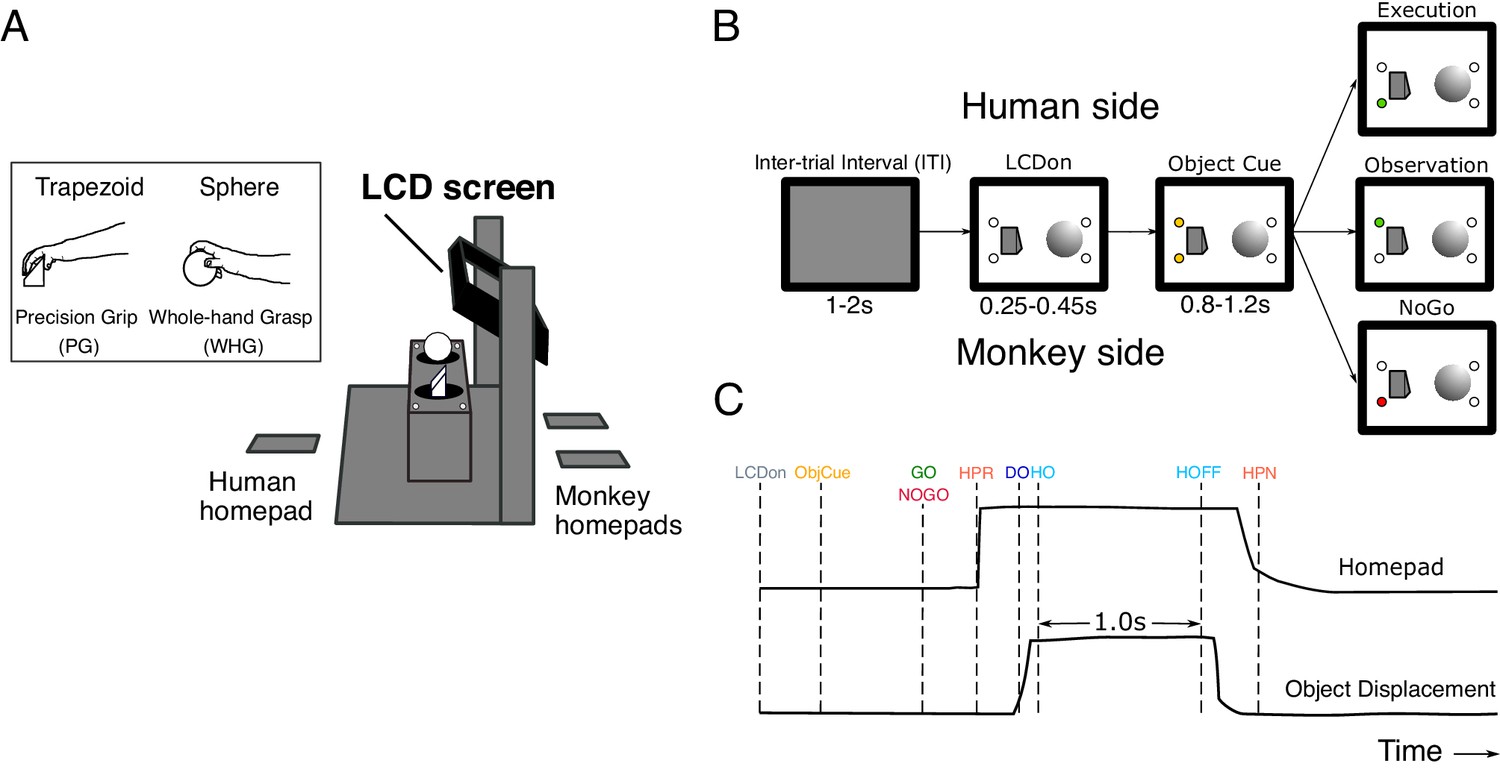
Experimental task design.
(A) Schematic of the custom-built experimental box, showing target objects, their corresponding LEDs, LCD screen, and homepads. Inset shows the trapezoid and sphere objects, and the respective precision and whole-hand grasps performed by the monkeys on execution trials. (B) Pseudo-random trial presentation sequence, shown as 2-D schematic. All trials began in the same way, with the object area illuminated (LCDon), and upcoming object/grasp cued (e.g. trapezoid, precision grip [PG]). Each trial was then indicated as Execution (green LED on monkey side), Observation (green LED on human experimenter side), or NoGo (red LED on monkey side). (C) Homepad and object displacement signals on Go trials, and digital task events. LCDon LCD screen becomes transparent, ObjCue, object cue (amber LED); Go/NoGo, green/red LED; HPR, homepad release; DO, displacement onset; HO, hold onset; HOFF, hold offset; HPN, homepad return.
Figure 2 with 1 supplement

EMG during task.
(A) Average execution EMG traces during a single session in M48. Top panels show pre-processed, rectified, and normalized EMG activity for different muscles with clean recordings for precision grip (PG) (left), and whole-hand grasp (WHG) (right). Bottom panels show corresponding average homepad and object displacement signals. Vertical markers at top of each trace indicate median time of task events relative to Go/NoGo cue (vertical dashed lines); colour coded as in Figure 1C. ECU, extensor carpi ulnaris; EDC, extensor digitorum communis; FCU, flexor carpi ulnaris; FDP, flexor digitorum profundus; FCR, flexor carpi radialis; 1DI, first dorsal interosseous; AbDM, abductor digiti minimi; HH, human homepad; ML, monkey left homepad; MR, monkey right homepad; PG precision grip; WHG, whole-hand grasp. (B) 2-D boxplot representation of Euclidean distance across muscles from mean baseline EMG. Blue dots show median value for each session (n = 93 total), dashed grey line denotes unity. (C) Distance from mean baseline of Observation React (top) and NoGo Reaction (bottom) periods vs. Execution Reaction.
Figure 2—figure supplement 1

Example EMG traces during all conditions.
(A) Example session normalized EMG, homepad, and displacement signals during execution, observation and NoGo. Execution traces are identical to those shown in Figure 2. Observation and NoGo EMG traces are averaged across both grasps, and plotted at 10x higher gain than execution. Vertical coloured markers denote median time of task events relative to Go or NoGo cues (vertical dashed lines), as in Figure 2. (B) Same as (A), but for M49.
Figure 3
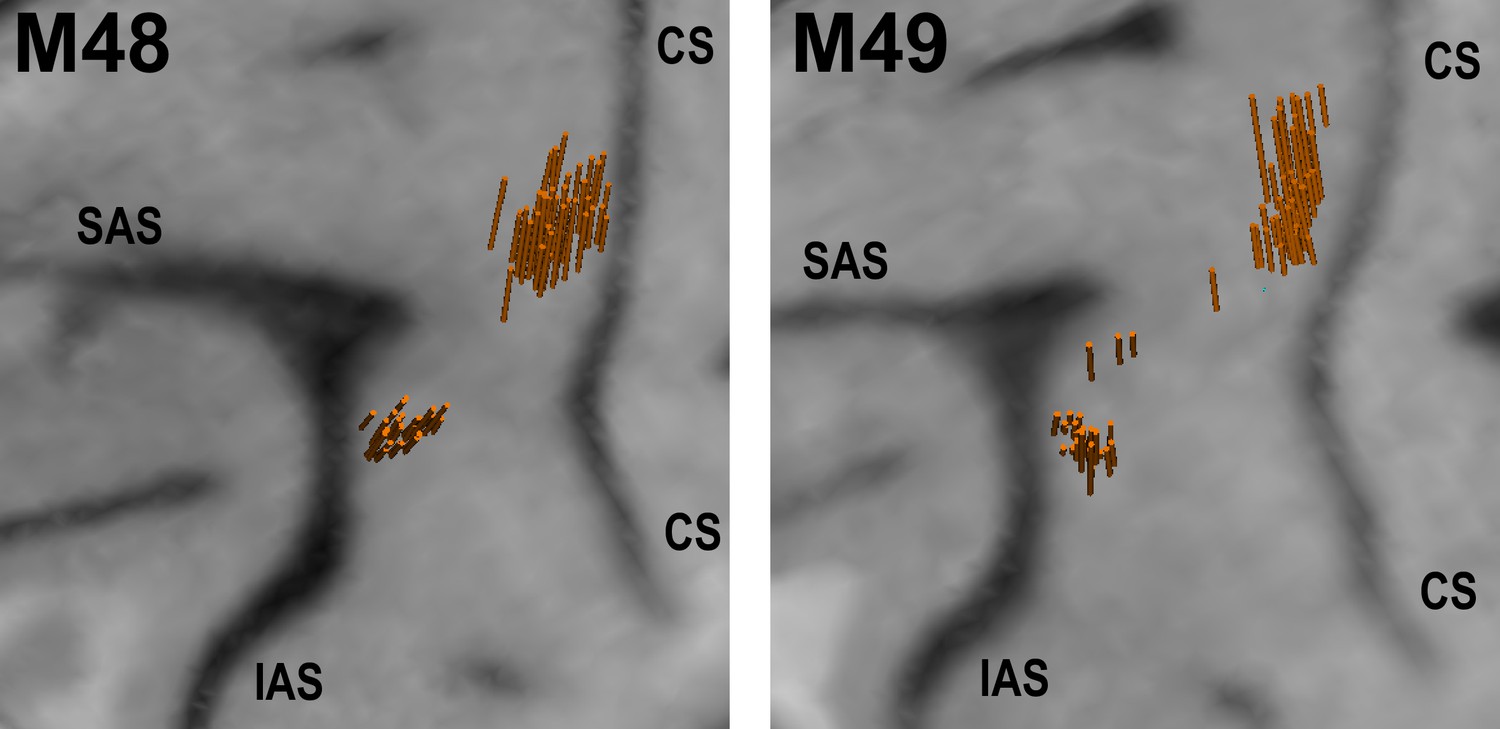
Structural MRI showing angle and location of electrode penetrations in which single-units were recorded in left F5 and M1 of M48 (left panel), and M49 (right panel).
The brain surface was estimated in the BrainsightVet software (Rogue Research Inc) using a curvilinear approximation method. Penetration locations and orientations were estimated via a geometrical transformation between recording drive and MRI coordinates. CS - central sulcus, SAS - superior limb of arcuate sulcus, IAS - inferior limb of arcuate sulcus.
Figure 4
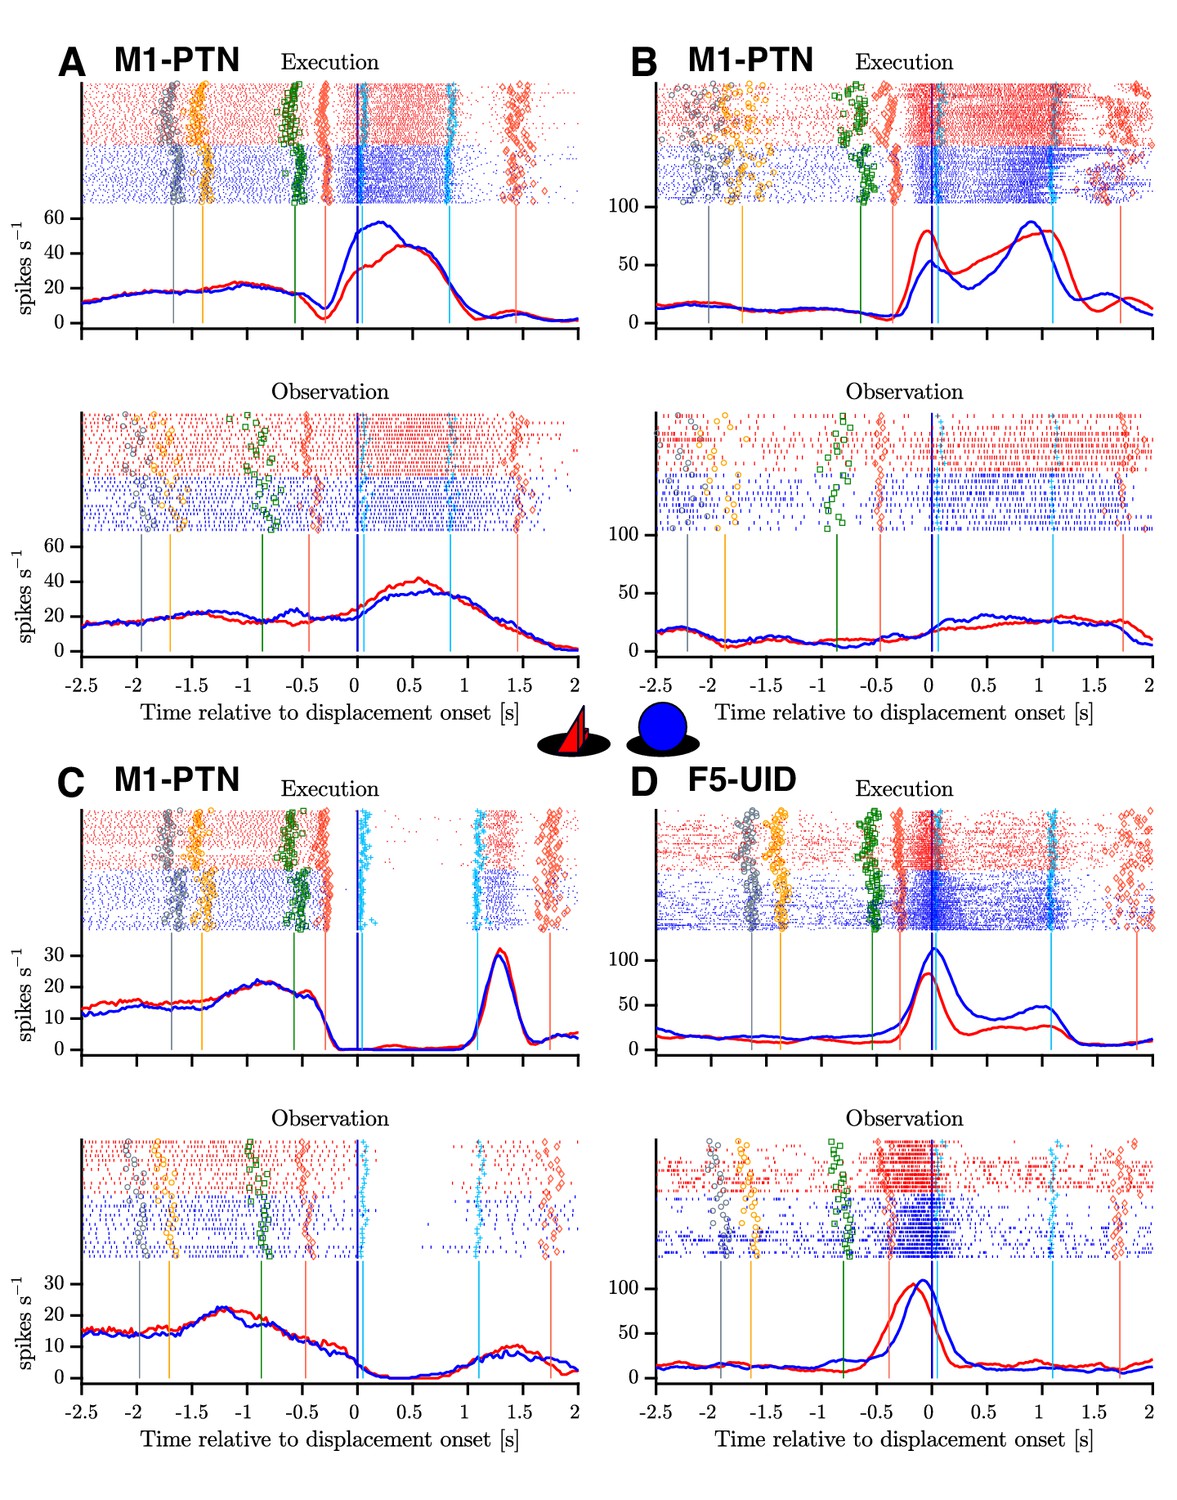
Example mirror neurons in M1 and F5.
Raster and histogram representations of single neuron activity during execution (top panels) and observation (bottom panels). (A–C) Three M1-PTNs, showing varying relationships between execution and observation activity. (D) F5-UID showing substantial modulation during both conditions. Units in (A), (C) and (D) were recorded in M48, (B) was recorded in M49. Activity is aligned to object displacement (DO). Rasters are split by grasp ( and , objects shown in central inset) and condition for visualization purposes, although trials were presented in a pseudo-randomised order during recording. Single trial events are indicated on raster plots (LCDon, Object Cue, Go, HPR, HO, HOFF, HPN), and median times relative to alignment are shown on histograms. Event colours are as shown previously (Figure 1C): LCDon - grey; Object Cue - orange; Go - green; HPR and HPN - magenta; HO and HOFF - cyan). For histograms, firing rates were calculated in 20 ms bins and boxcar-smoothed (200 ms moving average).
Figure 5 with 1 supplement
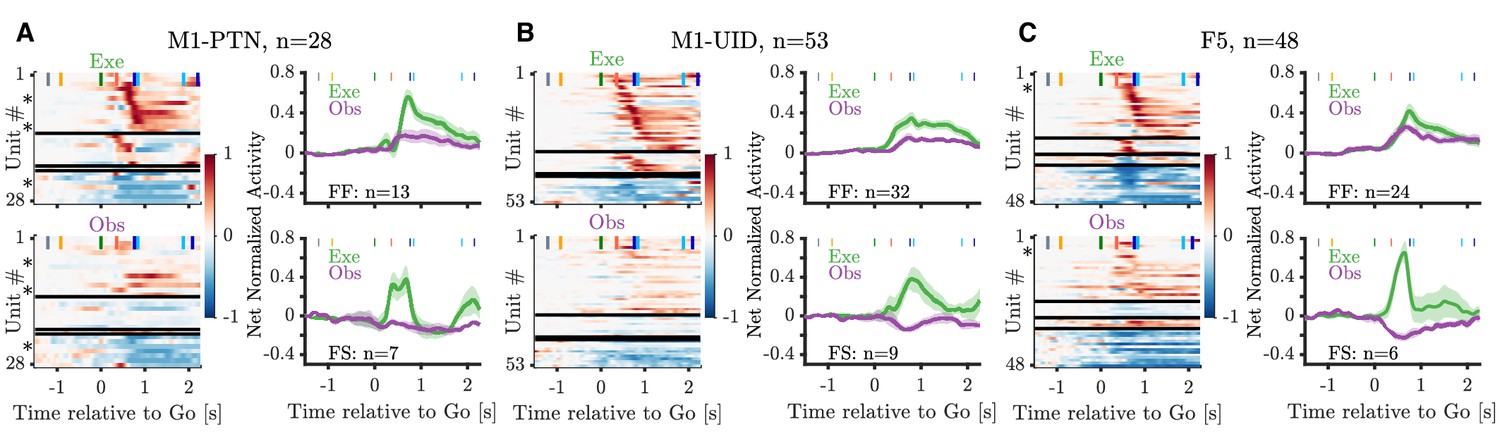
Mirror neuron population activity during PG.
(A) Left panels show heatmaps of net normalized activity of PG MNs within the M1-PTN population. Neurons are split into facilitation-facilitation, facilitation-suppression, suppression-facilitation, and suppression-suppression categories based on the sign of their modulation during action execution (top) and observation (bottom) relative to baseline. Horizontal black lines mark splits between categories. Within each category, neurons are sorted based on the latency of their absolute peak response during execution (peak calculated between GO and HO+0.5 s). Asterisks denote units shown in Figure 4. Population averages are shown for F-F (top right panel) and F-S categories (bottom right panel). (B) Same as (A) but for M1-UIDs. (C) Same as (A) but for F5.
Figure 5—figure supplement 1

WHG Heatmaps and population averages.
Heatmaps and population averages for MN sub-categories and populations during WHG. All plotting conventions as in Figure 5.
Figure 6 with 1 supplement
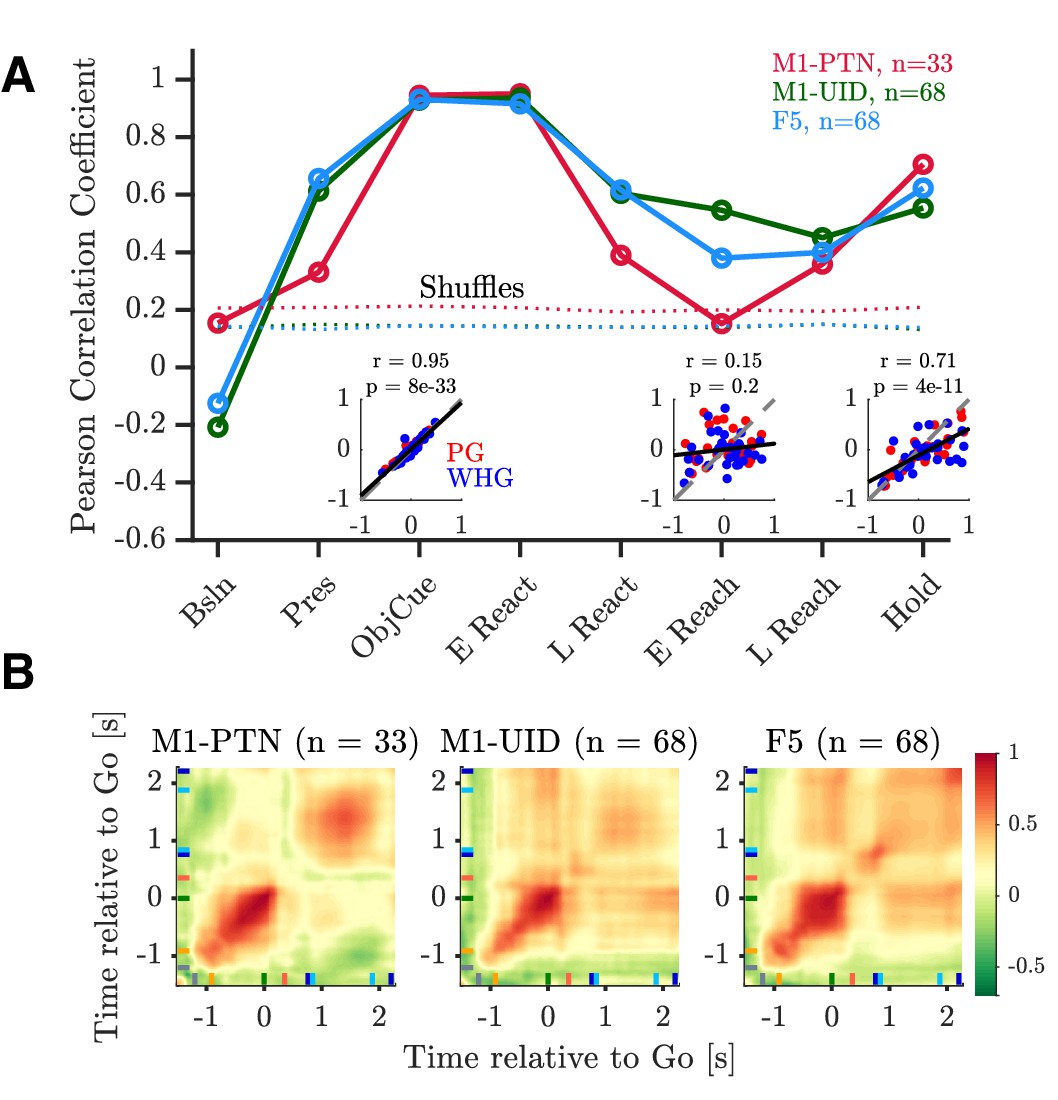
Relationship between execution and observation activity.
Pearson correlation coefficients of execution and observation activity shown for each epoch and MN sub-population. Dotted lines represent 95th percentiles of null distribution calculated via shuffling neurons. Insets show net normalized activity during execution and observation in M1-PTNs during Object Cue, Early Reach, and Hold epochs. PG and WHG are shown in and respectively, correlations are calculated across both grasps.
Figure 6—figure supplement 1

Execution and observation correlation scatter plots.
(A) Scatter plot showing correlation across neurons between execution and observation during the Object Cue period in M1-PTNs (left), M1-UIDs (middle), and F5 (right). Dashed grey lines denote unity, and solid black lines denote line of best fit to data. Pearson correlation R values and corresponding p-values are shown in lower right of each subplot. PG and WHG are shown in red and blue, respectively, correlations are calculated across both grasps. (B) Same as (A), but for Early Reach epoch. (C) Same as (A), but for Hold epoch. M1-PTN plots are identical to insets in Figure 6.
Figure 7 with 1 supplement
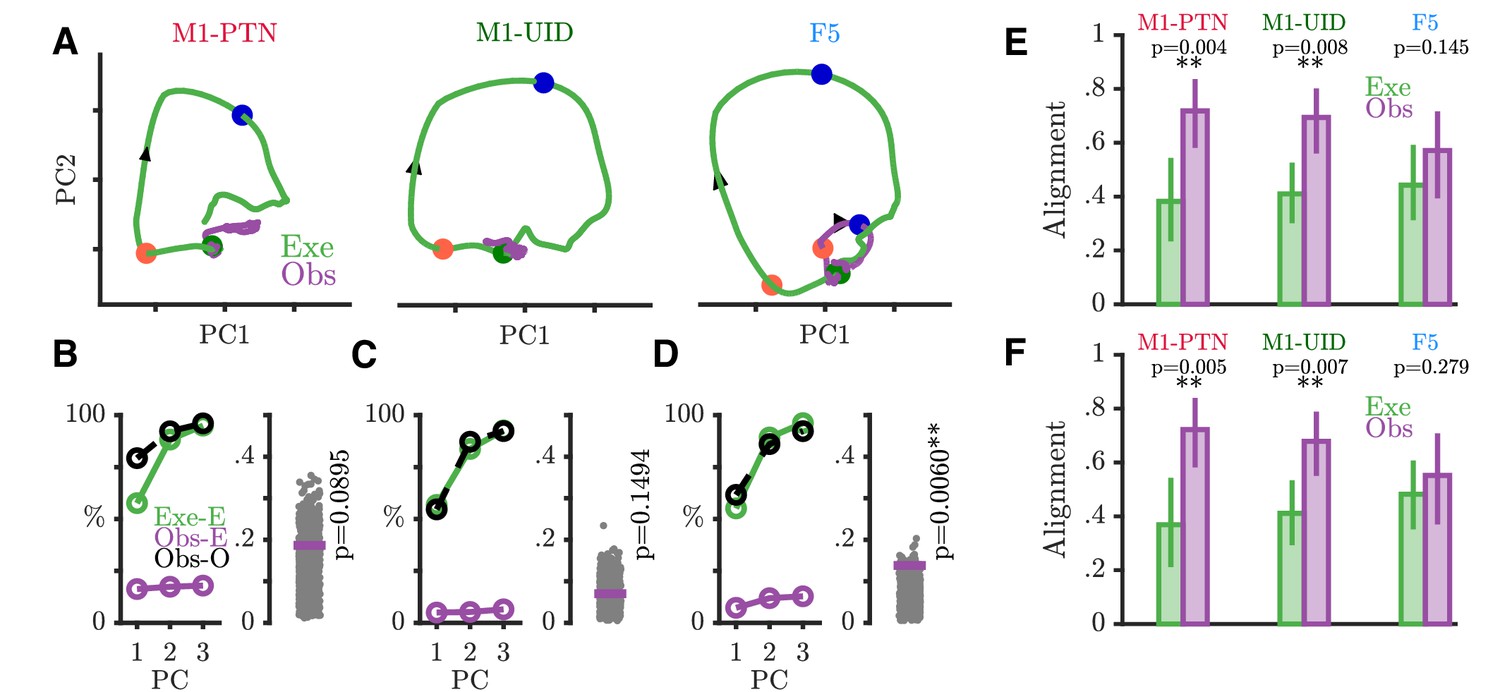
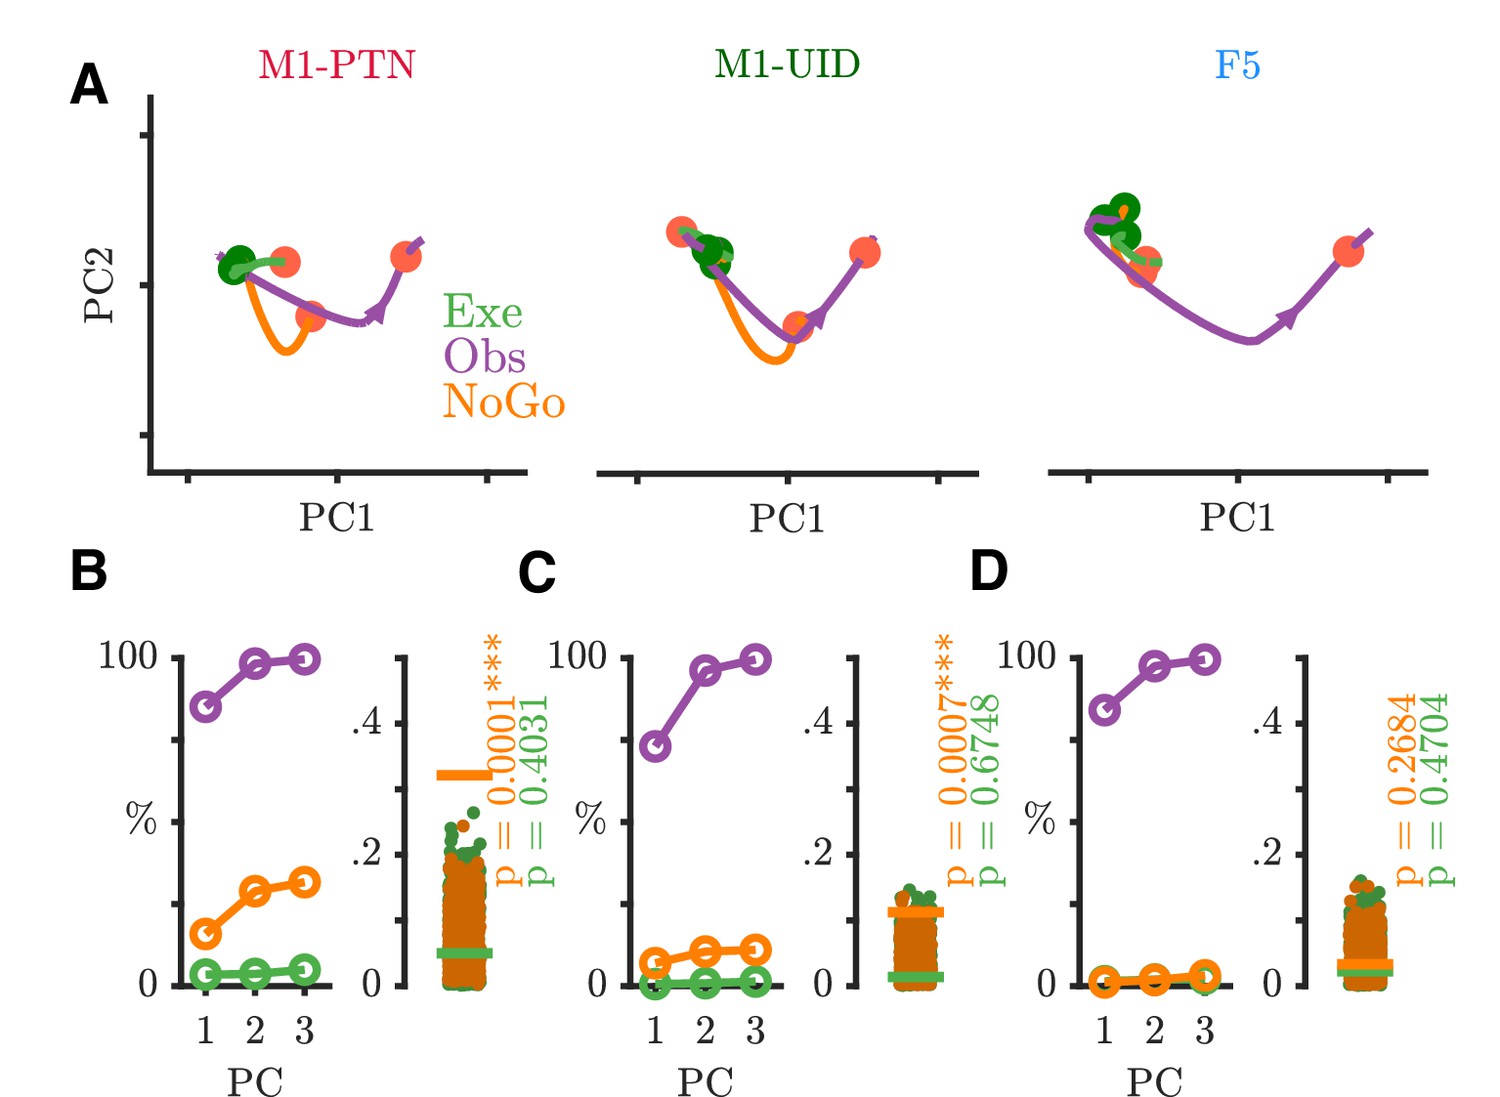
Execution and observation activity within a movement subspace.
(A) Traces showing the evolution of M1-PTN, M1-UID and F5 population activity within a 2-D movement subspace (defined by movement execution activity) across PG execution (green) and observation (purple) trial conditions. Larger coloured circles on each trajectory mark key events (green - Go, orange - HPR, blue - DO) used for multiple alignment of neural activity, and arrows on trajectories indicate direction of time. (B) M1-PTNs Left Panel: Cumulative variance captured by the first three principal axes. Exe-E (green), execution variance in execution subspace; Obs-E (purple), observation variance in execution subspace; Obs-O (black dashed line), observation variance in observation subspace. Exe-E and Obs-E projections correspond to those shown in (A), Obs-O projection corresponds to the denominator of alignment measure. Right Panel: Alignment index of observation activity in the movement subspace (purple horizontal line). Execution alignment index is equal to one by definition (not shown). Scattered grey points show alignment values from the null distribution, and p-values denote proportion of alignment values in null distribution greater than true alignment (C) Same as B., but for M1-UIDs. (D) Same as B, but for F5. (E) Bootstrap distributions of alignment values for WHG projected onto PG-defined axes, for execution and observation in each sub-population. P-values denote proportion of execution alignment values greater than observation values. (F) Same as (E), but for PG projected onto WHG axes.
Figure 7—figure supplement 1
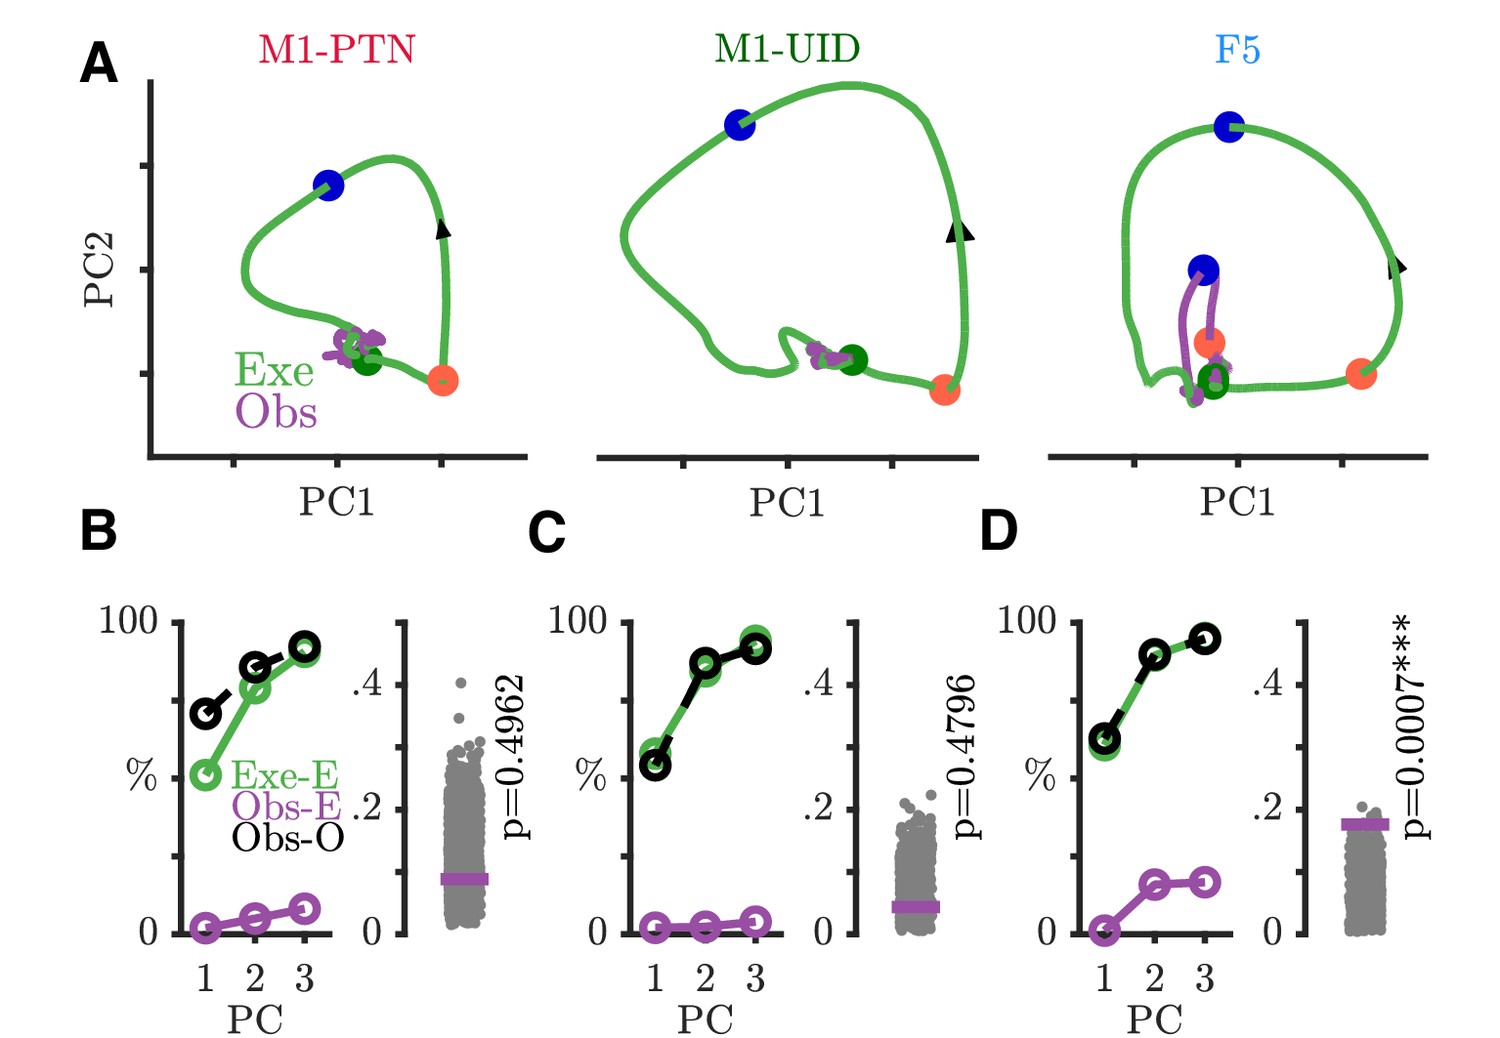
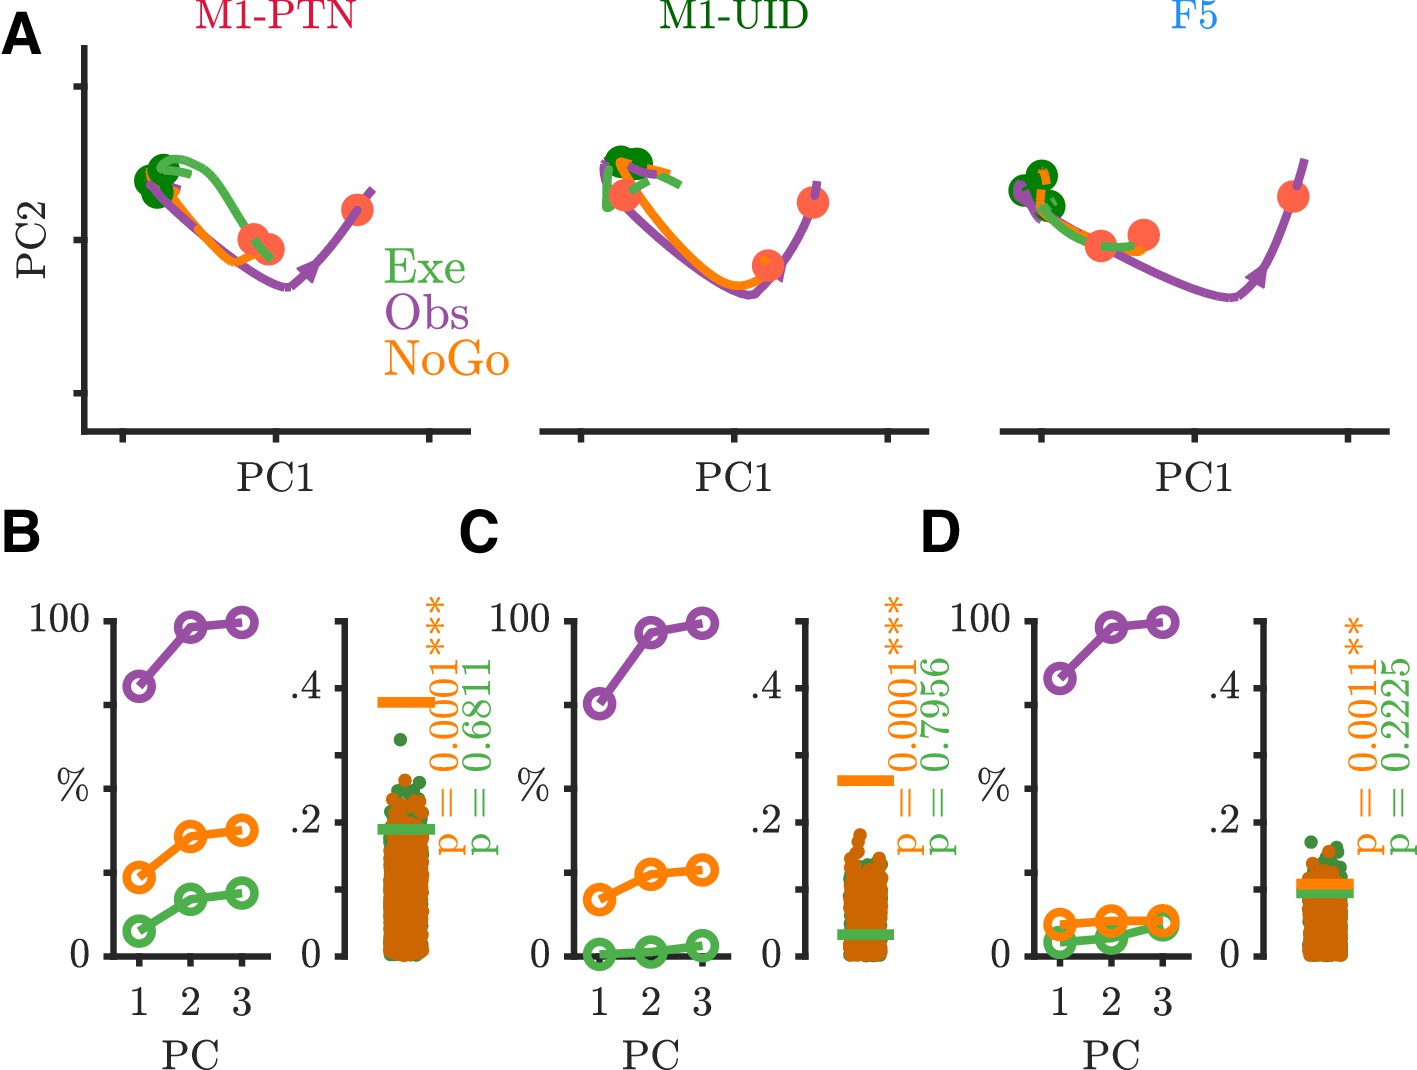
WHG execution and observation activity in execution movement subspace.
Evolution of neural trajectories through trial in WHG movement subspace. All plotting conventions as in Figure 7A–D.
Figure 8
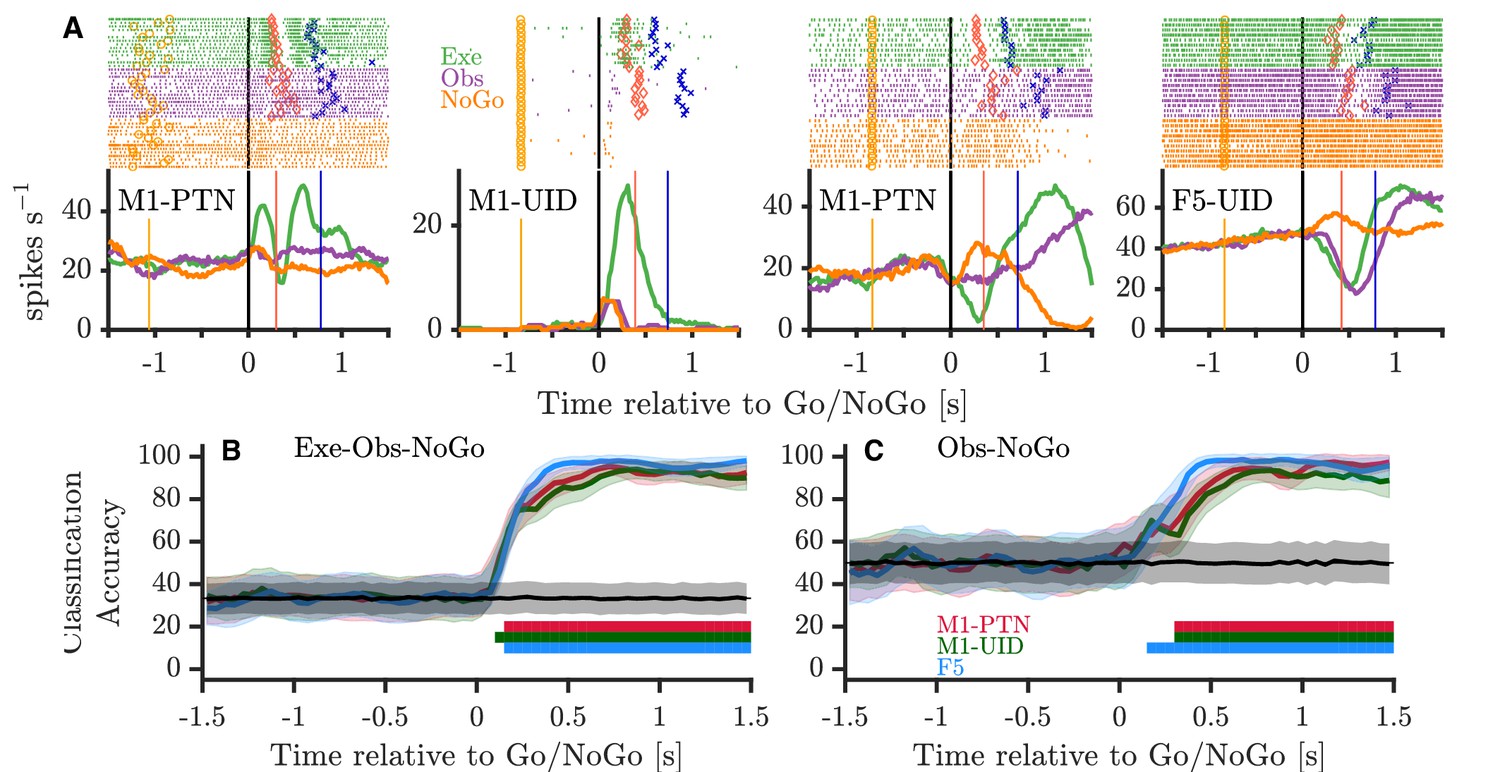
Activity during NoGo.
(A) Example single-neuron responses during execution, observation, and NoGo. Each subplot shows a raster and histogram representation of single-neuron activity during PG execution (green), observation (purple), and NoGo (orange), with single alignment to the Go/NoGo cue (vertical black lines). Rasters and histograms are compiled from a randomly selected subset of 10 trials in each condition. For histograms, firing rates were computed in 20 ms bins and boxcar-smoothed with a 200 ms moving average. Event markers colour-coded as shown previously (Figure 1C). (B) Classification accuracy of maximum correlation coefficient classifier decoding between execution, observation, and NoGo conditions within each population. Grey trace and shading shows mean ±1 SD of decoding accuracy following permutation shuffling, and coloured bars along bottom show period of consistent significant decoding for each population. (C) As for (B) but decoding between observation and NoGo only.
Figure 9 with 1 supplement
NoGo activity within an observation subspace.
(A) Traces showing the evolution of M1-PTNs, M1-UIDs and F5 population activity during PG execution (green), observation (purple) and NoGo (orange) conditions within the first 2 dimensions of an observation subspace spanning the 100–400 ms after the Go cue. Each trajectory shows the −100 to +400 ms period around the Go/NoGo cue (green/red circles). Average HPR time (across execution and observation) is also indicated on each trajectory by the orange filled circles. The purple arrow on observation trajectories indicates the direction of time. (B) M1-PTNs Left Panel: Cumulative variance captured within the first three principal axes for execution, observation, and NoGo. Right Panel: Alignment indices of execution and NoGo activity in the observation subspace shown as coloured lines (Execution - green, NoGo - orange). Observation alignment index is equal to one by definition (not shown). Scattered points show alignment values from null distributions for execution and NoGo separately, and p-values denote proportion of alignment values in null distribution greater than alignment in data. (C) Same as B., but for M1-UIDs. (D) Same as B, but for F5.
Figure 9—figure supplement 1
WHG observation and withholding.
Evolution of neural trajectories around Go/NoGo cue in WHG observation subspace. All plotting conventions as in Figure 9.
Author response image 1
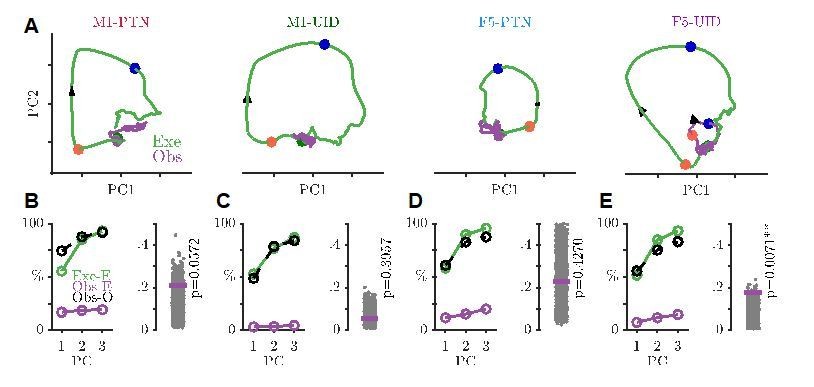
Projections of execution and observation activity onto PG execution subspace, in same format as Figure 7A-D, but showing F5-PTNs and F5-UIDs separately.
Firing rates were smoothed using a 25ms Gaussian, and normalization constant was set to 0 (i.e. no soft-normalization).
Tables
Table 1
Behaviour during recording sessions for basic mirror task.
RT, reaction time; MT, movement time. Reaction time was defined as the time between the Go cue and homepad release (HPR), and movement tie as the time between HPR and object displacement onset (displacement onset [DO]). Values denote mean ± SEM of median values from each session, rounded to nearest millisecond.
| M48 | M49 | |||||||
|---|---|---|---|---|---|---|---|---|
| Monkey | Human | Monkey | Human | |||||
| PG | WHG | PG | WHG | PG | WHG | PG | WHG | |
| RT (ms) | 310 ± 25 | 267 ± 22 | 469 ± 38 | 442 ± 44 | 272 ± 22 | 268 ± 16 | 412 ± 48 | 401 ± 41 |
| MT (ms) | 306 ± 20 | 279 ± 14 | 430 ± 31 | 374 ± 38 | 404 ± 23 | 351 ± 20 | 520 ± 39 | 532 ± 45 |
Table 2
Number of single-units recorded in each monkey and sub-population for at least 10 execution and 10 observation trials per grasp (after removal of contaminated trials).
| M48 | M49 | Total | |
|---|---|---|---|
| M1-PTN | 35 | 24 | 59 |
| M1-UID | 77 | 51 | 128 |
| F5 | 72 | 43 | 115 |
| Total | 184 | 118 | 302 |
Additional files
Download links
A two-part list of links to download the article, or parts of the article, in various formats.
Downloads (link to download the article as PDF)
Open citations (links to open the citations from this article in various online reference manager services)
Cite this article (links to download the citations from this article in formats compatible with various reference manager tools)
Movement initiation and grasp representation in premotor and primary motor cortex mirror neurons
eLife 9:e54139.
https://doi.org/10.7554/eLife.54139


