OTX2 represses sister cell fate choices in the developing retina to promote photoreceptor specification
- Department of Biology, The City College of New York, City University of New York (CUNY), United States
- PhD Program in Biology, The Graduate Center of the City University of New York (CUNY), United States
- PhD Program in Biochemistry, The Graduate Center of the City University of New York (CUNY), United States
Figures
Figure 1 with 1 supplement
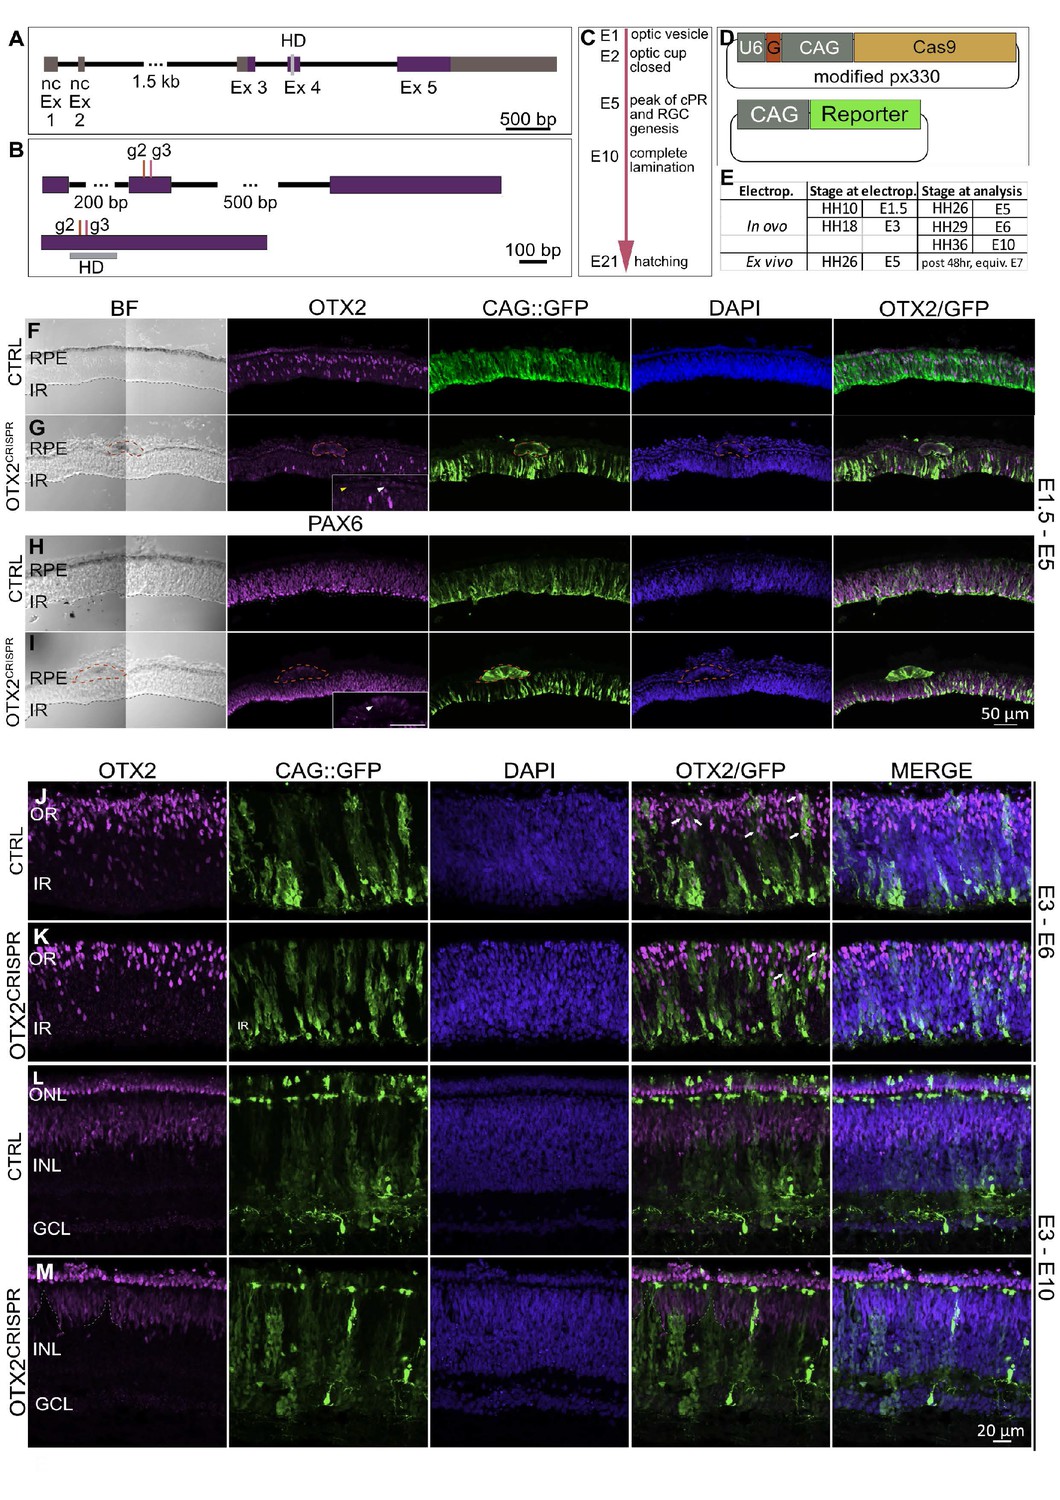
OTX2CRISPR guide design and targeted electroporation of the early chick eye yields severe abnormalities of the retina and RPE.
(A) Schematic representation of the Gallus gallus OTX2 genomic locus. Purple blocks represent coding exon regions. Gray blocks represent non-coding exon regions. Light grey bar in exon 4 represents homeodomain region. (B) Location of guides 2 and 3 relative to the unspliced (top) and spliced (bottom) OTX2 mRNA. Grey box shows the mRNA regions that encode the homeobox domain. (C) Key events in the developmental timeline of the eye development in chick. (D) Schematic of co-electroporated plasmids. U6 is the promoter for the guide RNA, denoted by G., CAG drives expression of Cas9 and fluorescent reporters. (E). Time points for electroporation of CRISPR plasmids and analysis. (F–I) Confocal microscopy analysis of CTRL and OTX2CRISPR g2-induced mutant retinal sections targeted at E1.5 and analyzed at E5. OTX2 protein expression in CTRL (F) as compared to Mutant (G). Mutant RPE is depigmented and cells with strong GFP and low levels of OTX2 are identified by red outline. White arrow in high magnification insert shows OTX2-positive cells, whereas the yellow arrow point to cells that are negative for OTX2. (H, I) CTRL (H) and Mutant (I) sections stained for PAX6. RPE structures in mutants are outlined by dotted lines and shown as a high magnification insert in (I). (J–M) Qualitative analysis of CTRL and g2 retinas electroporated in ovo at E3 and analyzed at E6 (J–K) and E10 (L–M). (J–K) White arrows denote examples of electroporated cells that are positive for OTX2. (L–M) GFP-positive, OTX2-negative patches (dotted lines) are present in the INL and PR layers of OTX2CRISPR mutants. Ex, Exon; nc, non-coding; HD, homeodomain; BF, brightfield; RPE, retinal pigment epithelium; IR, inner retina, OR, outer retina, ONL, outer nuclear layer, INL, inner nuclear layer, GCL, ganglion cell layer.
Figure 1—figure supplement 1
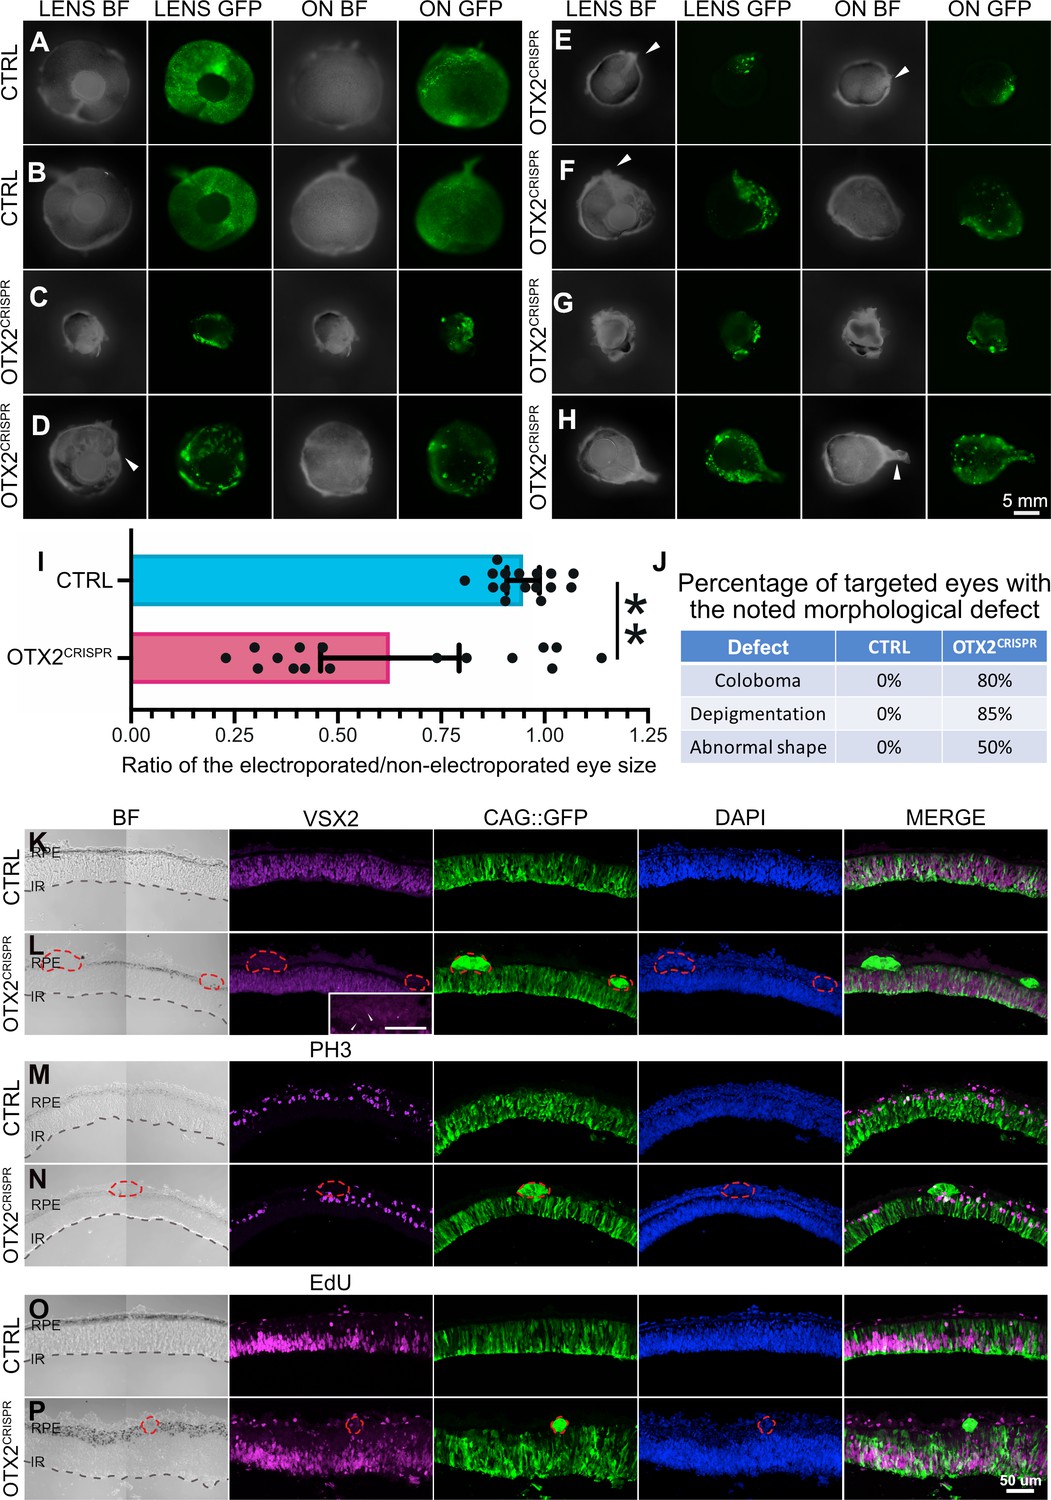
Effects of OTX2CRISPR mutation induced at the optic vesicle stage.
(A–H) Phenotypes observed after eye cups were electroporated with OTX2CRISPR g2 complex and CAG::GFP at E1.5/HH 10 and analyzed at E5/HH 26. Images were acquired from the frontal (LENS) and dorsal (ON) view of whole eyes. GFP signal shows electroporation efficiency of the CAG::GFP control plasmid. Control (CTRL) eyes in (A and B) were electroporated with an empty p18 plasmid and CAG::GFP. All mutants (C–H) display different degrees of microphthalmia, RPE depigmentation, while some show coloboma-like defects and abnormal shape of the eye (C, E, F). Arrowheads point to the incomplete closure of the optic stalk giving the coloboma appearance and abnormal shape. (I) Microphthalmia was measured as the ratio between the area of the electroporated eye and the non-electroporated one. Error bars are 95% confidence intervals. (J) Quantification of the morphological defects.( I, J) n = 16, ** signifies p<0.001. (K–N) Vertical sections of CTRL and mutant retinas imaged by confocal microscopy for GFP, DAPI and either VSX2 expression (K,L), PH3 (M,N) expression, or EdU (O,P). BF, brightfield, ON, optic nerve, RPE, retinal pigment epithelium, IR, inner retina.
Figure 2 with 1 supplement
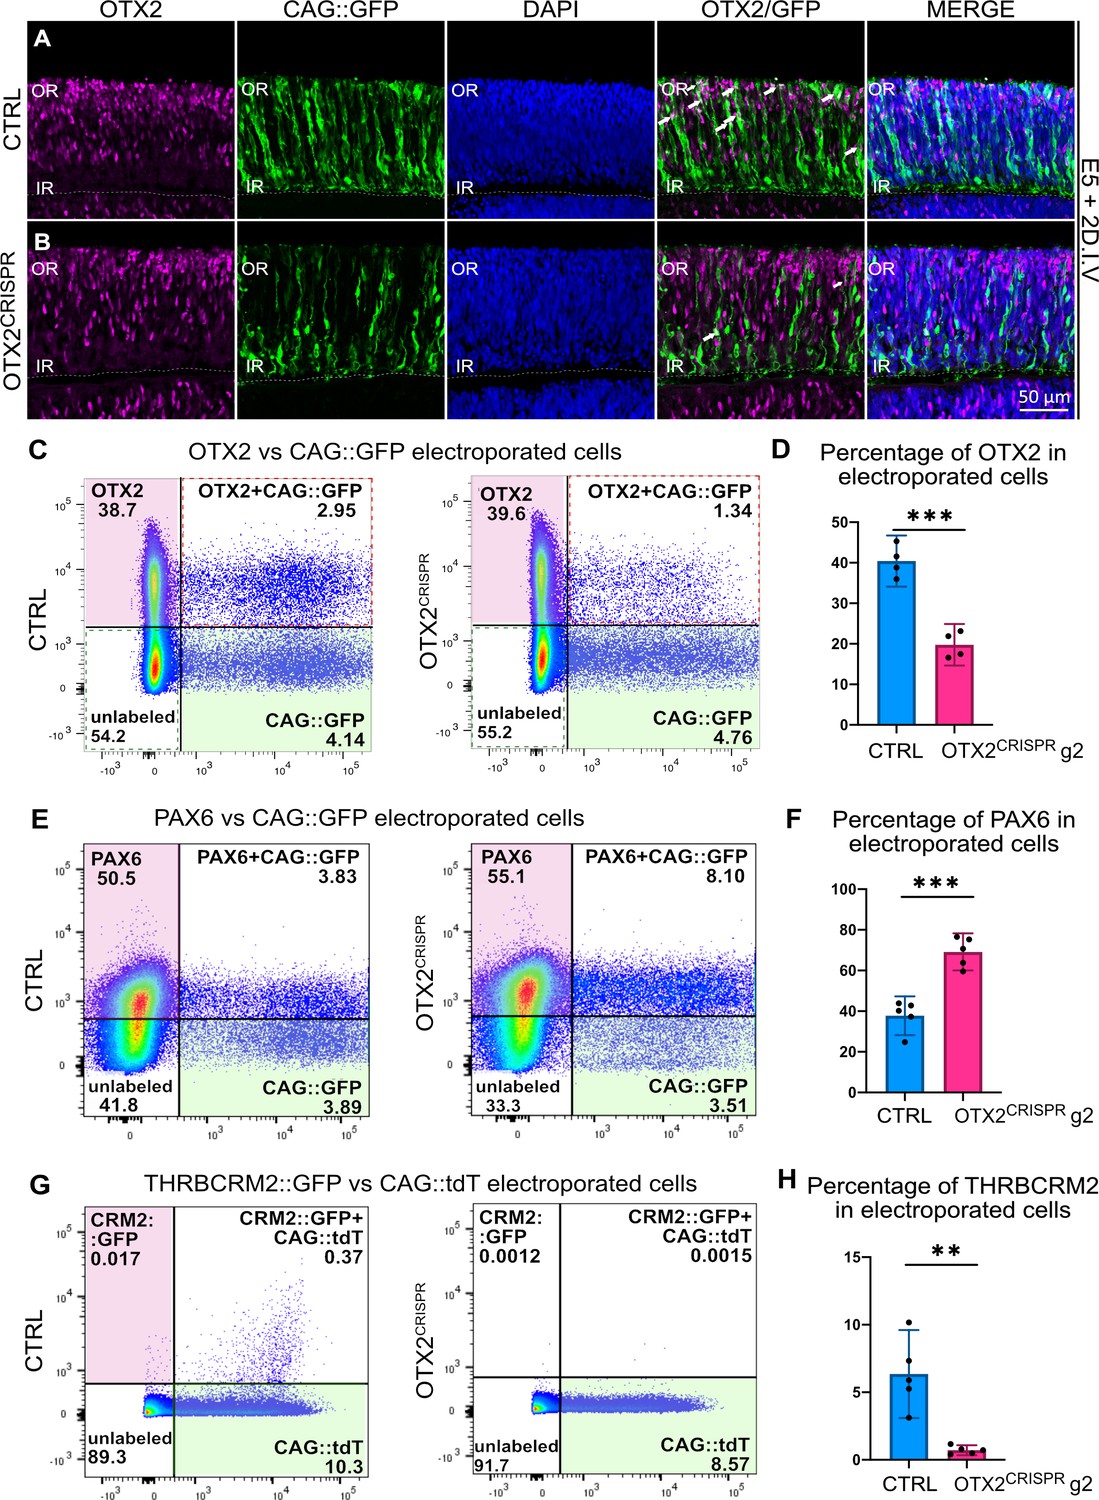
Highly effective CRISPR-induced mutation of OTX2 in E5 retinas yields severe reduction in photoreceptor markers and increase in the number of PAX6-positive cells.
(A–B) Confocal microscopy assessment of vertical sections of retinas co-electroporated with CAG::GFP and CRISPR plasmid, and then immunostained for OTX2 (magenta), GFP (green) and DAPI (blue) (A) Control (B) OTX2CRISPR g2. White arrows denote electroporated OTX2-positive cells. (C–H) Representative dot plots showing the overlap between OTX2 (C), PAX6 (E), and THRBCRM2::GFP (G) with CAG::GFP or CAG::tdT in CTRL and OTX2CRISPR g2 dissociated retinas. (D, F, H) Bar graph showing the average percentage of cells positive for each marker out of the total number of electroporated cells detected with GFP or tdT. Each point represents one biological replicate (n ≥ 4 for both CTRL and OTX2CRISPR g2 and error bars represent 95% confidence intervals. *** represents p<0.0001 and ** represents p<0.001; OR, outer retina; IR, inner retina. DIV, days in vitro.
Figure 2—figure supplement 1
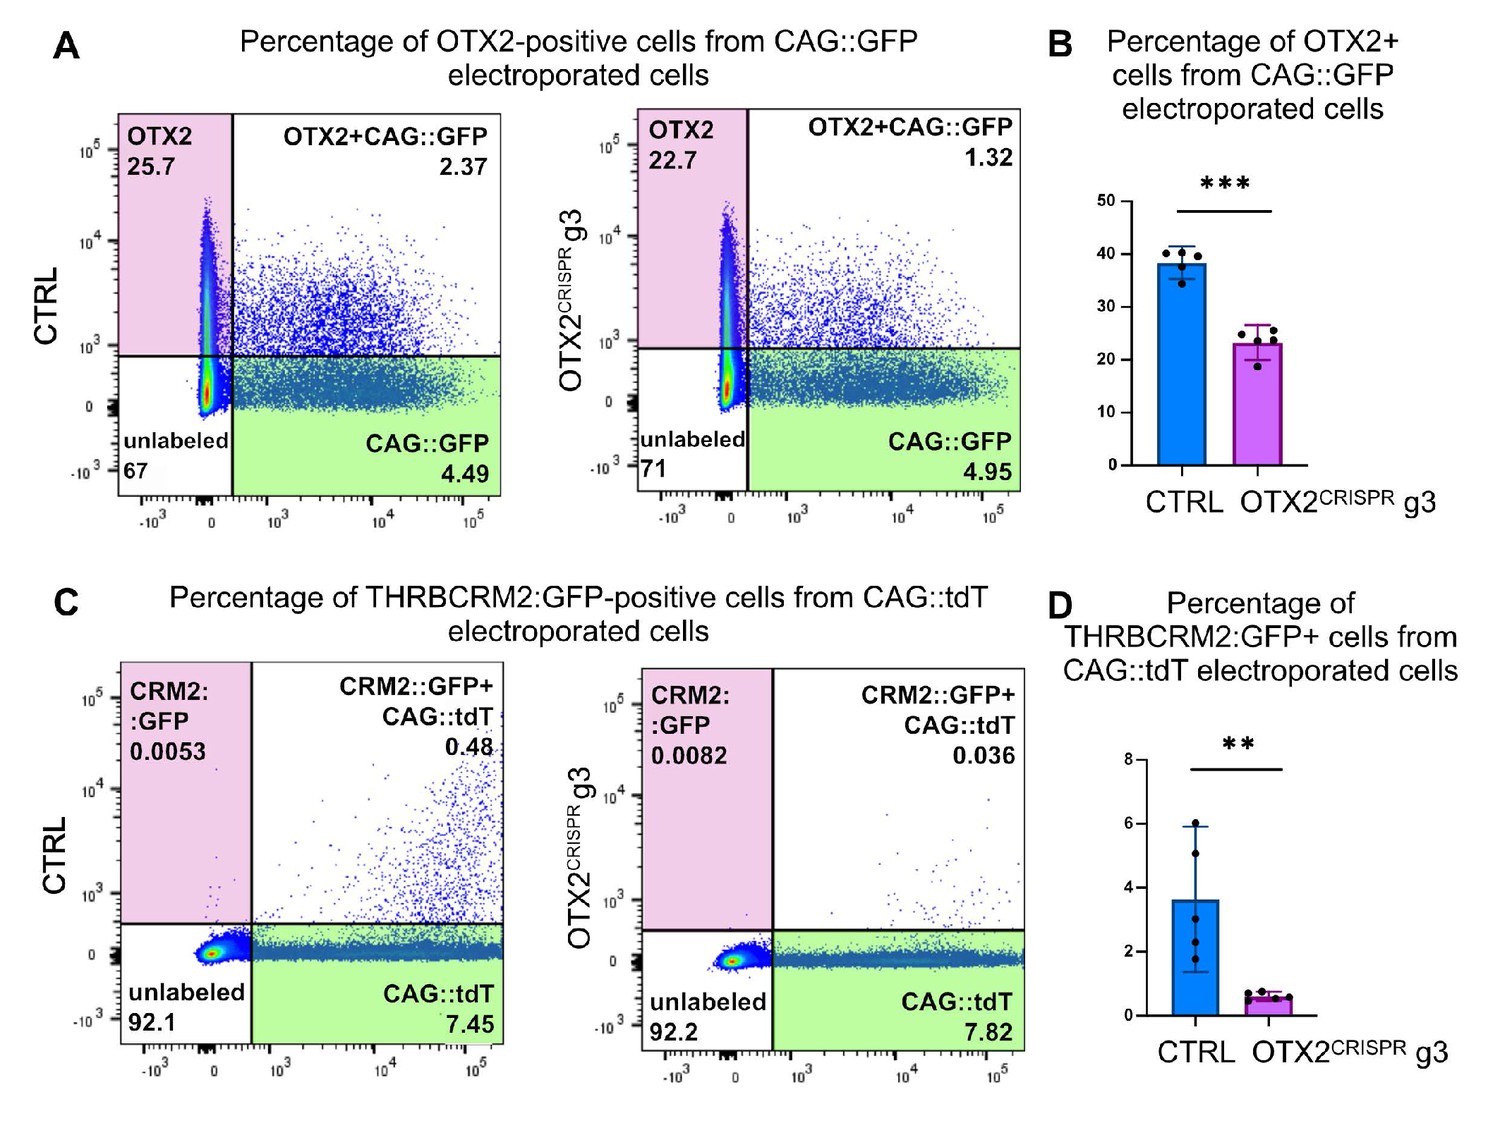
Flow cytometry quantification of OTX2 immunoreactivity and THRBCRM2 activity in OTX2CRISPR g3 retinas.
Representative dot plots showing the overlap between OTX2 immunoreactivity (A–B) and THRBCRM2::GFP (C–D) with CAG::GFP or CAG::tdT in CTRL and OTX2CRISPR g3 dissociated retinas. Percentage of cells positive for each marker were normalized to the total number of electroporated cells detected with GFP or tdT. *** signifies p<0.0001 and ** signifies p<0.001. Error bars represent 95% confidence intervals, n = 5 each for CTRL and OTX2CRISPR g3.
Figure 3
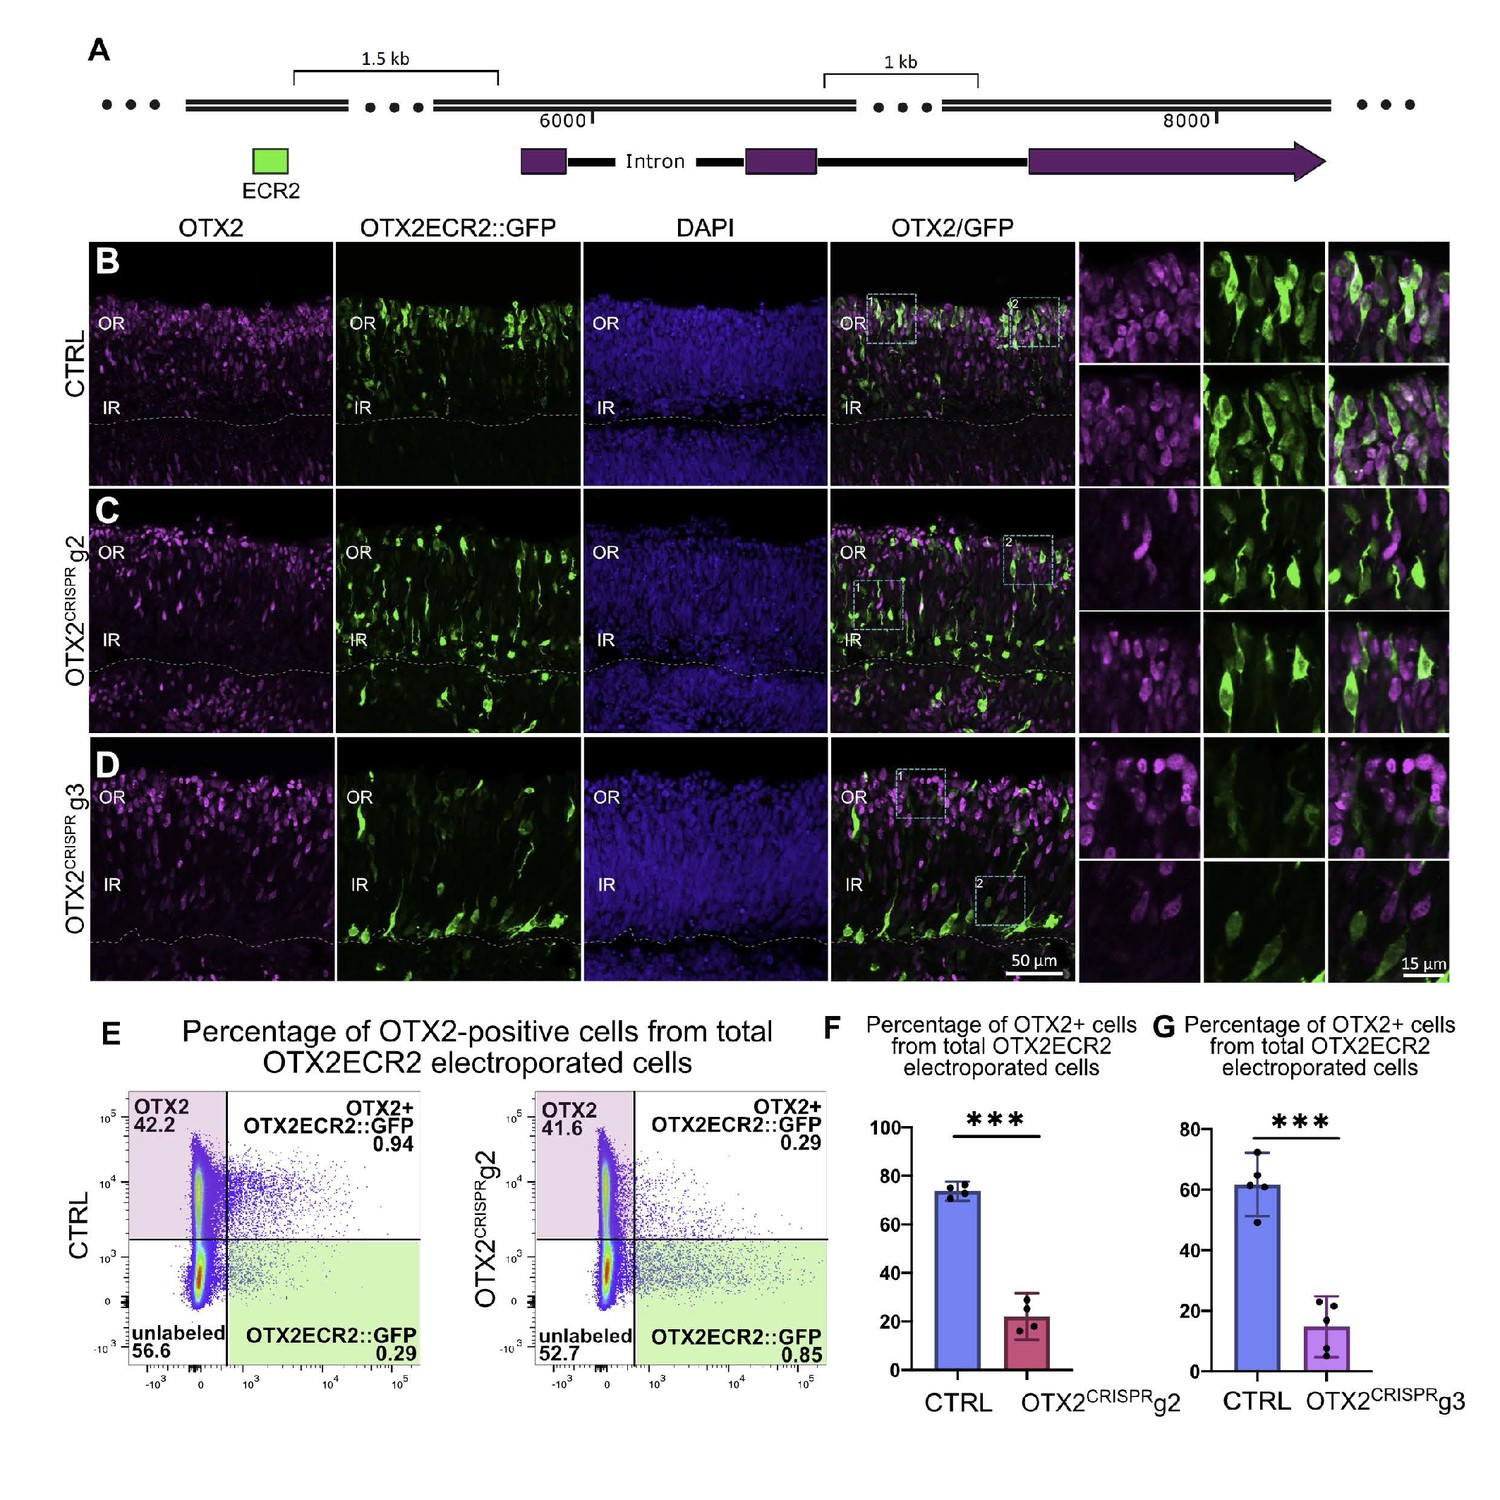
OTX2ECR2 reporter expression in CTRL and OTX2CRISPR retinas.
Retinas electroporated at E5 with OTX2ECR2::GFP and control or OTX2CRISPR plasmids and analyzed after 48 hr. (A) Schematic representation of the chick OTX2 genomic locus, and the location of the ECR2 element, 1.5 kb upstream of the start codon. (B–D) OTX2ECR2::GFP reporter predominantly labels cells in the outer CTRL retina (B). This population is markedly reduced in both OTX2CRISPR mutants (g2 in (C) and g3 in (D), and a new population located in the inner retina is formed. High magnification views of the regions boxed in the OTX2/GFP panels are shown in the rightmost panels. (E) Representative dot plots showing the overlap between OTX2ECR2::GFP (x-axis) and OTX2 protein (y-axis). The population of OTX2ECR2::GFP-positive cells that express OTX2 protein decreases in OTX2CRISPR g2 retinas. (F) Quantification of the OTX2+/GFP+ cells from the total GFP+ cells for OTX2CRISPR g2 (F) and g3 (G) compared to the controls. Error bars represent 95% confident intervals. *** represents p<0.0001, n ≥ 4 for both comparisons and each point represent one biological replicate. OR, outer retina; IR, inner retina.
Figure 4
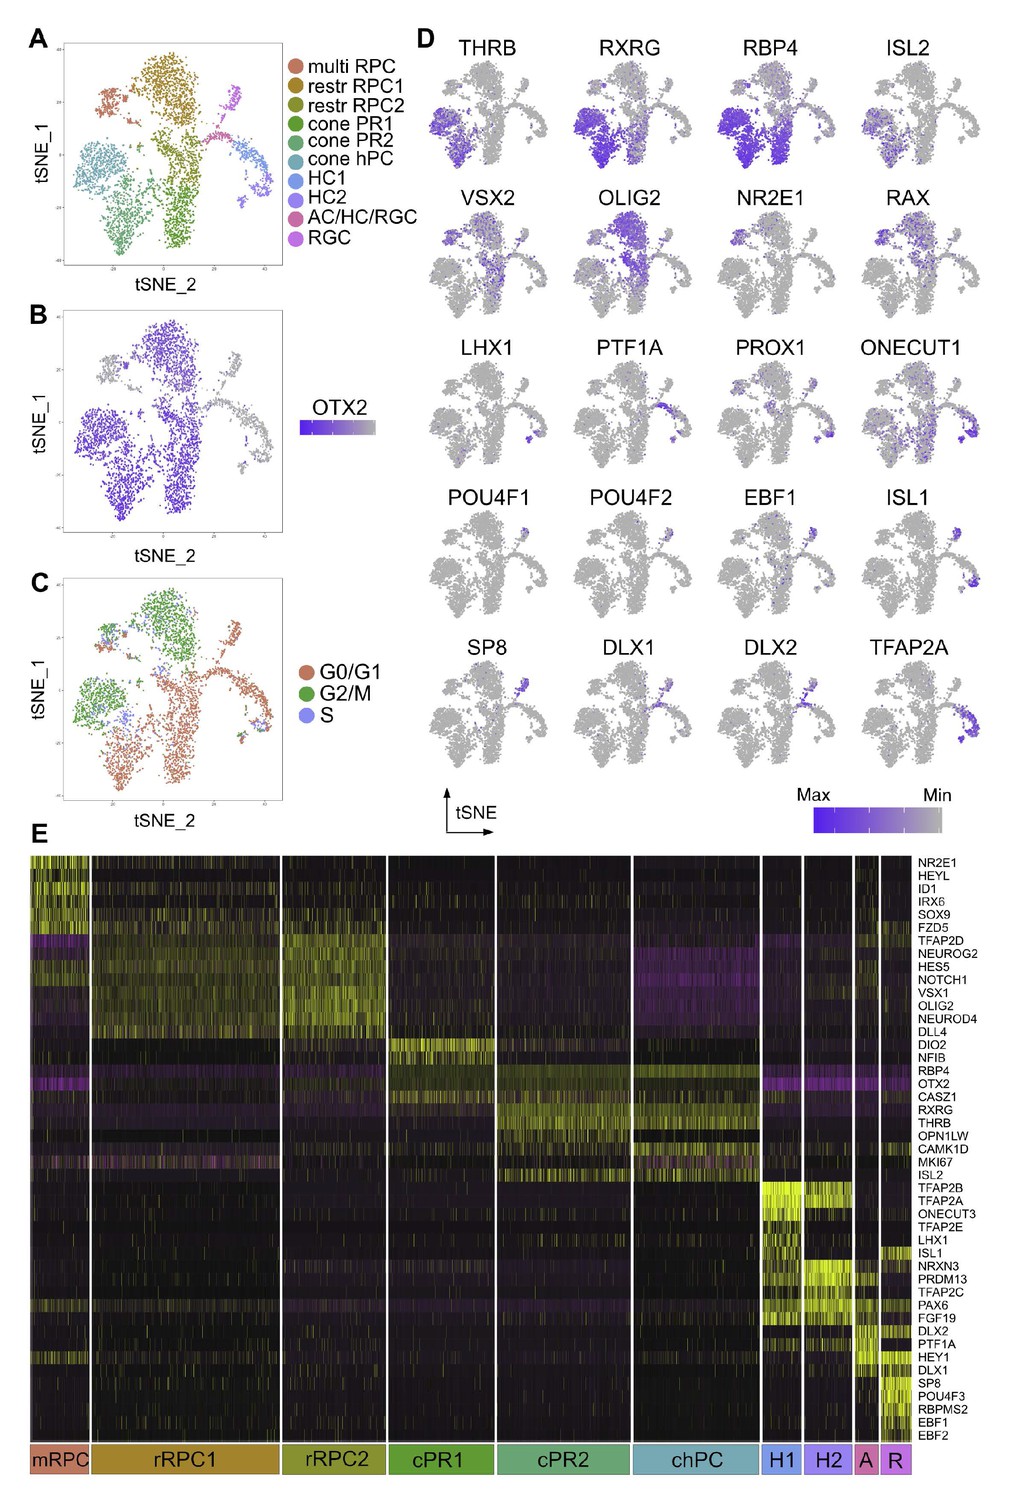
Single cell analysis of CTRL OTX2ECR2::GFP cells.
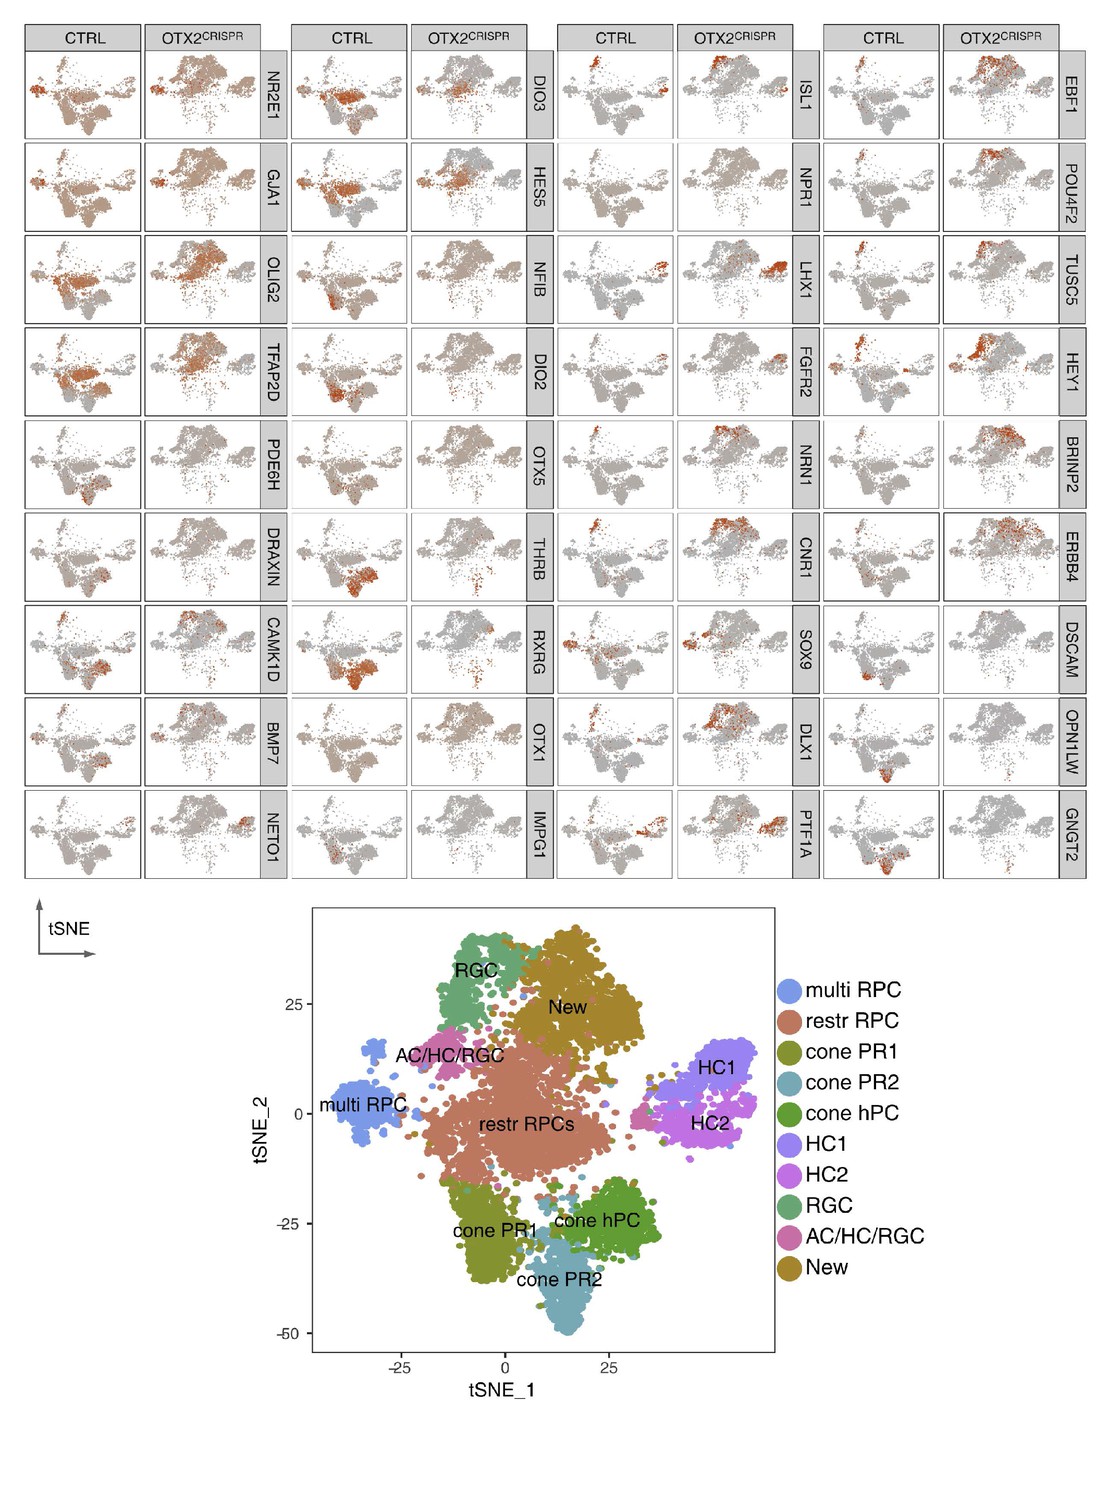
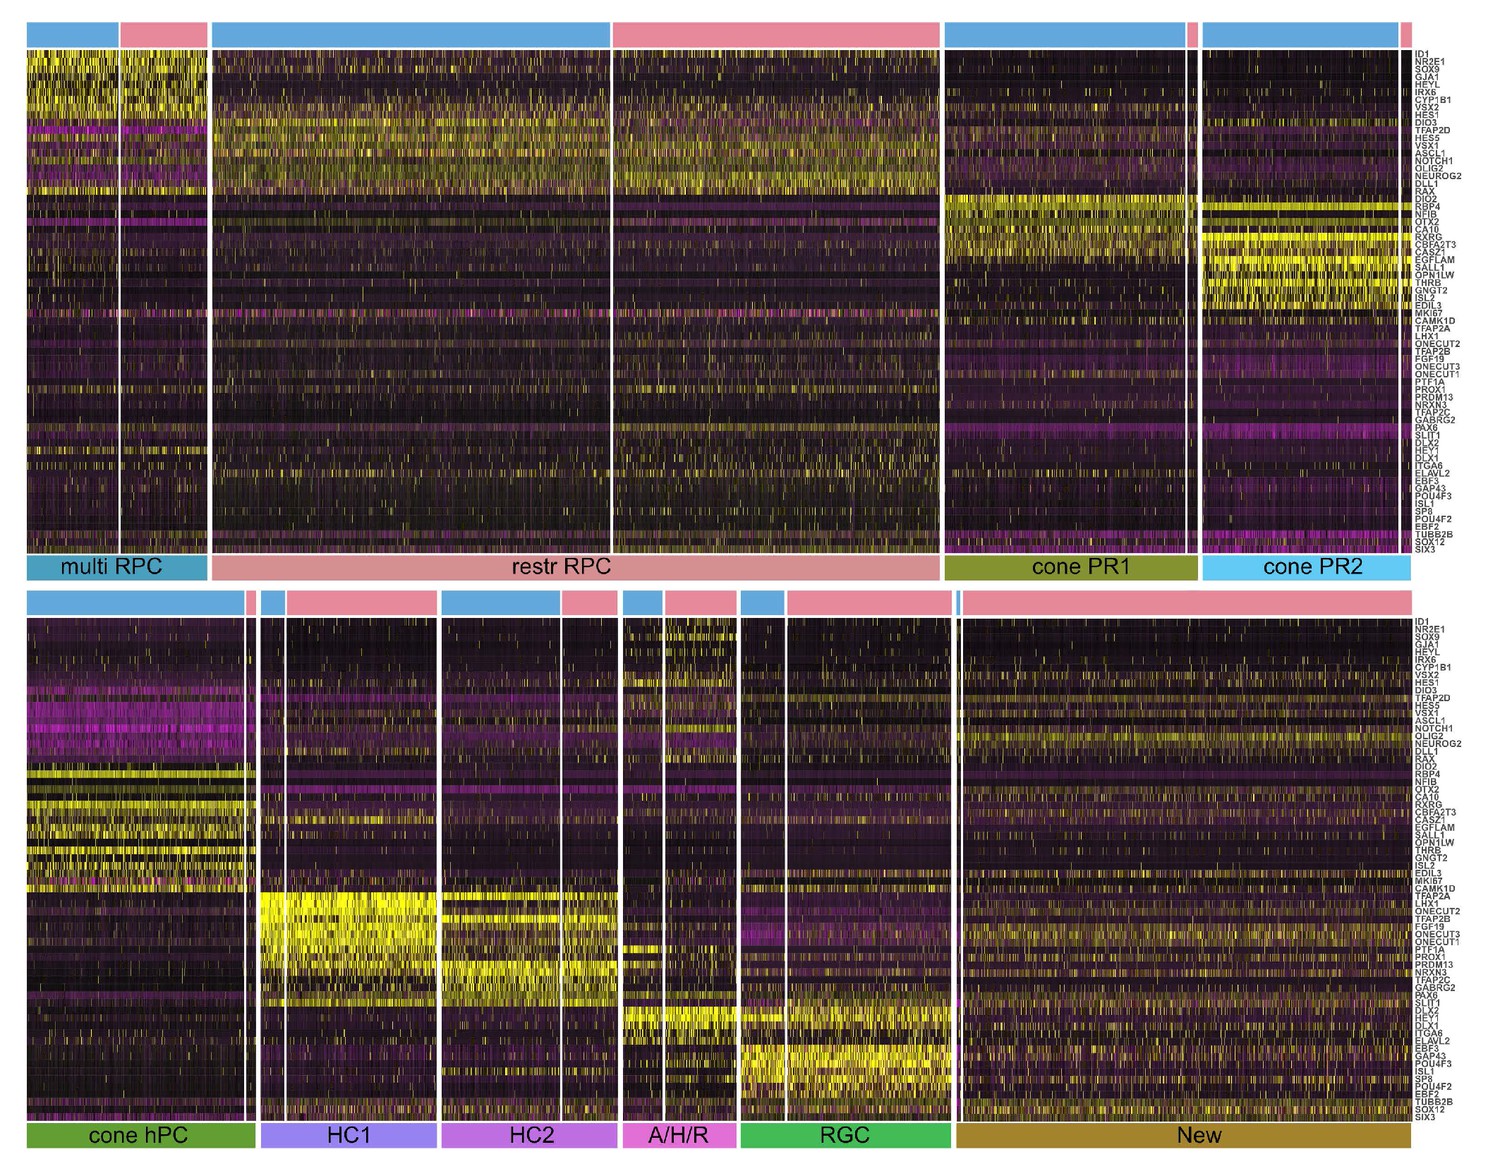
(A) TSNE plots of the 10 clusters generated by the unsupervised algorithm Seurat, based on the gene expression of each cell analyzed. (B) Heatmap of OTX2 expression (purple) in the cells analyzed. (C) TSNE plots of the clusters showing their cell cycle state, G1, G2M or S-phase. (D) Heatmaps showing the expression of different markers in the 10 clusters, in TSNE view. (E) Heatmap of differentially expressed genes across the 10 clusters, where purple represents low gene expression and yellow represents high expression. MultiRPC – multipotent RPC, restrRPC – restricted RPC.
Figure 5 with 3 supplements
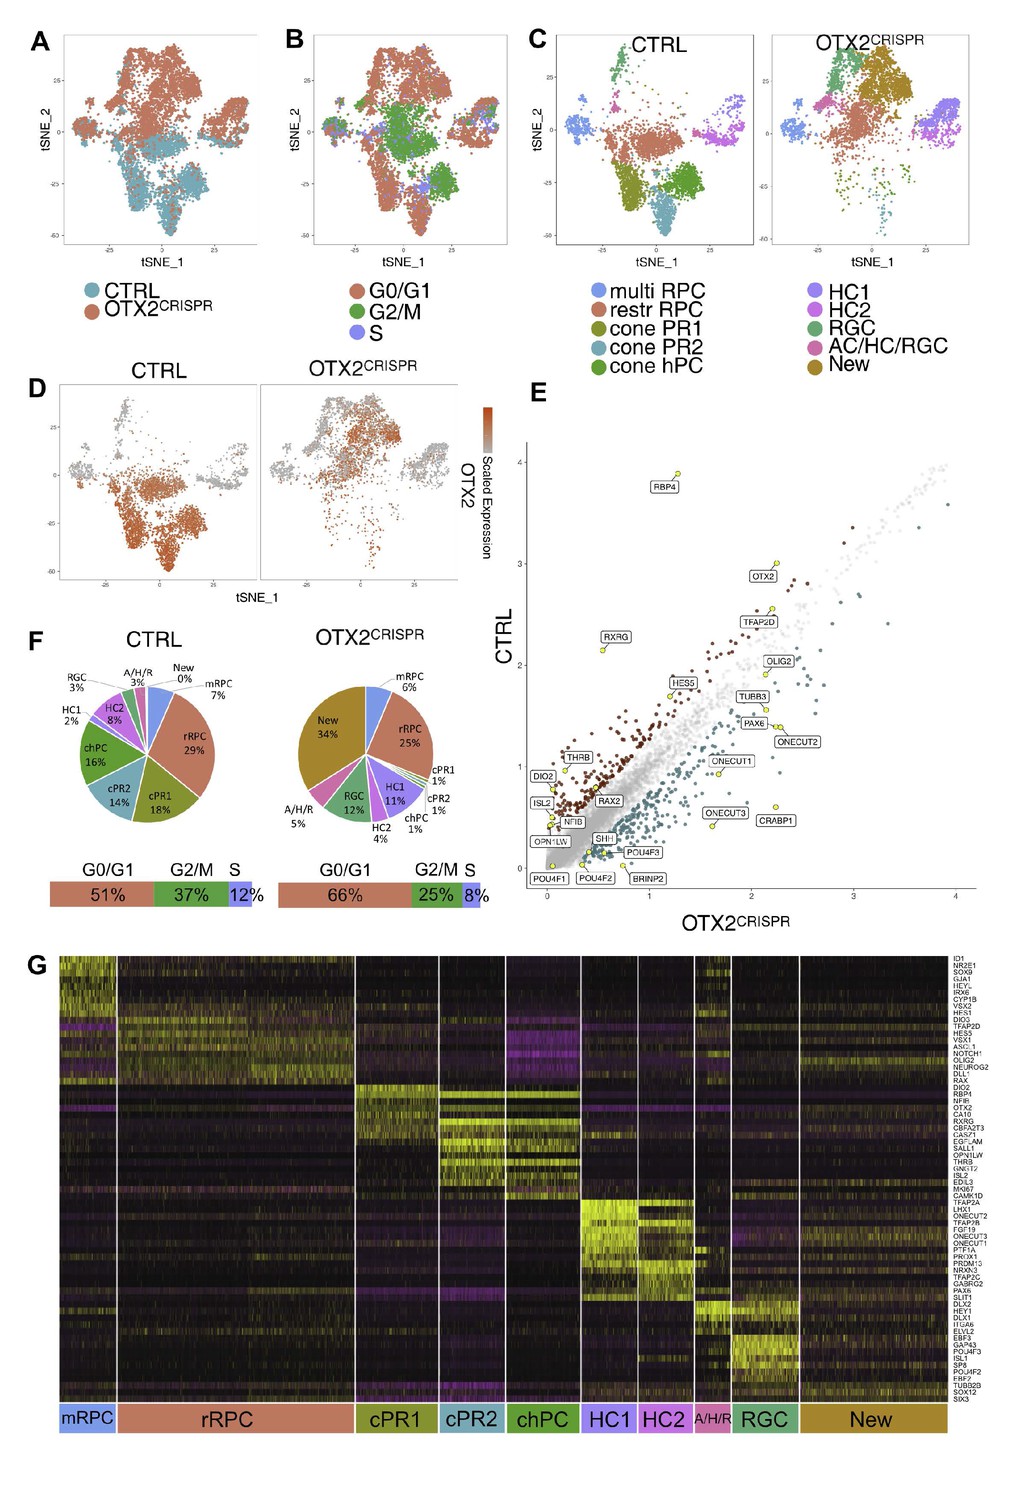
Combined single cell analysis from CTRL and OTX2CRISPR retinas labeled by OTX2ECR2::GFP reporter.
TSNE plots of the two datasets analyzed simultaneously (A) and labeled for their cell cycle signature (B). (C) TSNE plots of the 10 clusters determined by Seurat - multipotent RPCs (multiRPC), restricted RPCs (restrRPC), cone PR1 and 2, cone homotypical PC, HC clusters (HC1 and HC2), RGC, AC/HC/RGC and New, in the CTRL (left) and mutant (right) samples. (D) Heatmap of OTX2 expression across the two datasets. (E) Differentially expressed genes in the CTRL and OTX2CRISPR cells showing average reads per cell. (F) Pie charts showing the percentages of cells found in each cluster of the CTRL and mutant samples. Bars under the pie charts show distribution of cell cycle markers across the two datasets. (G) Heatmap of the differentially expressed genes across the clusters of both CTRL and OTX2CRISPR cells. Purple represents low gene expression and yellow represents high expression.
Figure 5—figure supplement 1
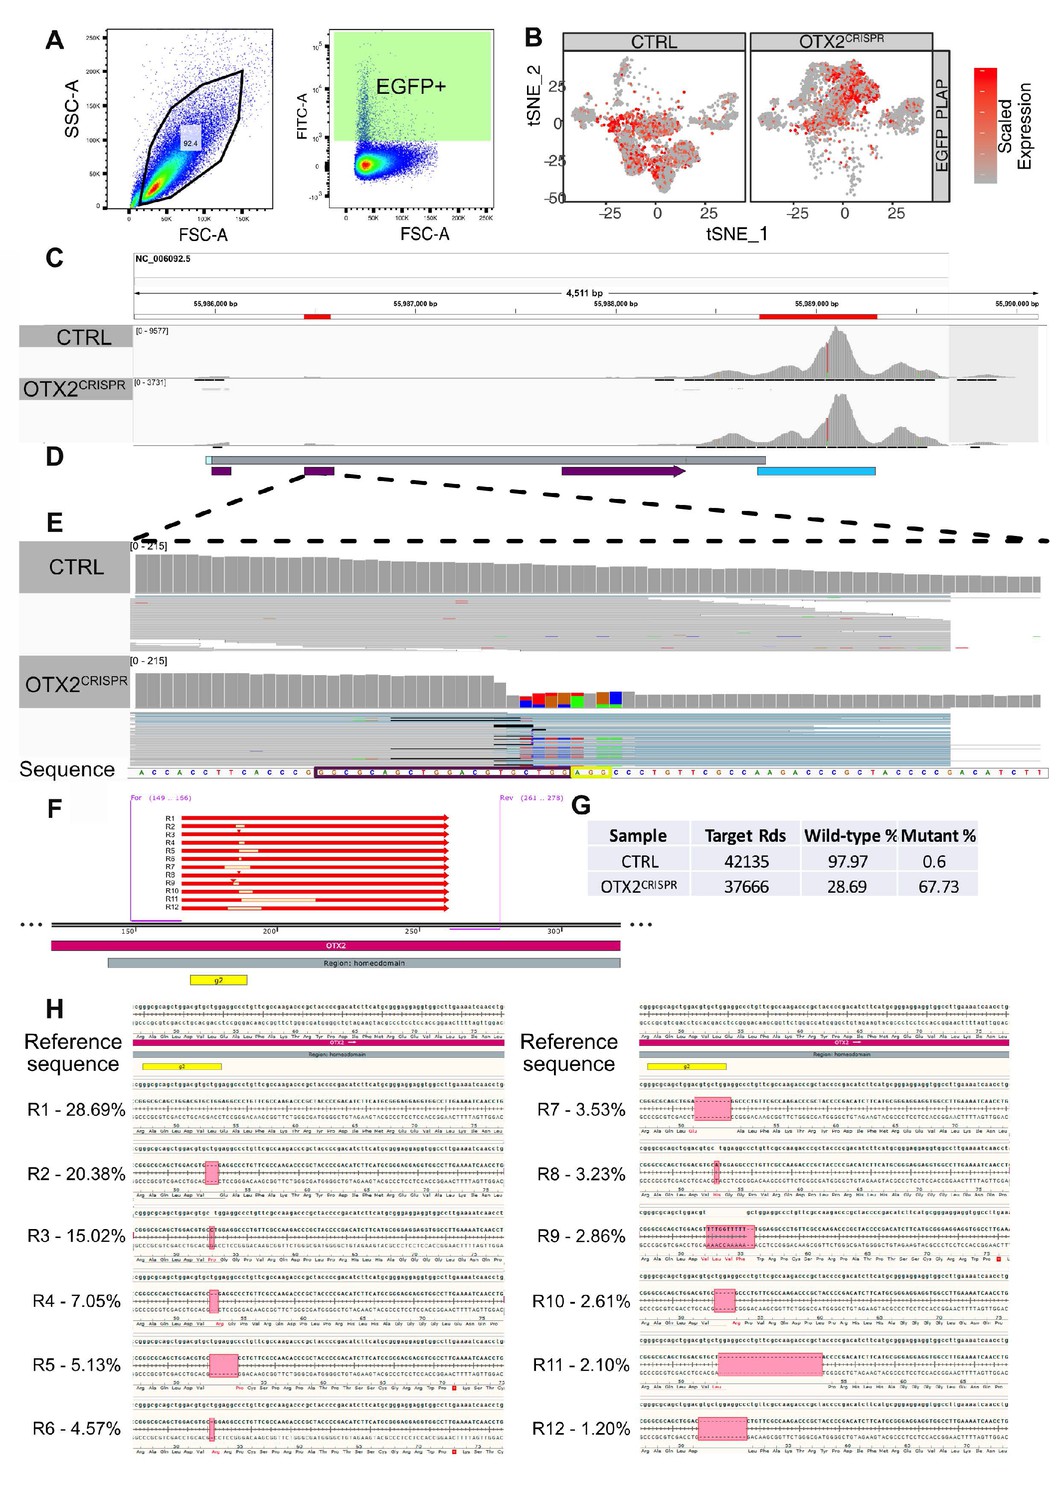
GFP collection gates, expression in the clustered cells and validation of the CRISPR-induced mutations in the analyzed mutant retinas.
(A) Flow cytometry plots showing the collection gates for the cells sorted prior to single cell library preparation. (B) Heatmap of GFP_IRES_PLAP reporter expression across both single cell datasets. (C) Analysis of the OTX2 reads aligned to the Gallus gallus genome, GRC6 assembly GCF_000002315.5) using IGV (Integrative Genomics Viewer) view of the OTX2 locus. First red box represents the second coding exon, while the last one represents the 3’ end of the gene. The majority of the reads are located at the 3’end, due to the specifics of the library preparation technique. (D) Aligned sequencing reads mapped to the OTX2 sequence. Bright blue box – 5’UTR, first grey box – OTX2 gene block, last grey box – 3’UTR. Purple boxes represent the exons. Turquoise box represents 3’ most region, with high number of reads aligned. (E) Increased magnification of the second coding exon. Grey vertical bars represent the reads aligned to that region of the gene. Purple box around the sequence highlights the Cas9 target DNA and the yellow box highlights the PAM motif. Colored vertical blocks in the OTX2CRISPR alignment represent the mismatches identified in the aligned reads; black horizontal fine lines show deletions of the aligned reads. (F) Summary of the amplicon deep sequencing results (right) and mapped reads to the amplified region; For, Rev primers used for the amplification of the sequence; g2, guide 2. (G–H) Quantification and detailed view of the mutations, including their impact on the reading frame. R, reads. The remaining reads (in table (G)), up to 100% from the total - 3.58% in the OTX2CRISPR and 1.43% in CTRL represent noisy reads.
Figure 5—figure supplement 2
Representative markers for each cluster in CTRL and OTX2CRISPR samples.
Figure 5—figure supplement 3
Heatmap of the differentially expressed genes across the clusters of both CTRL and OTX2CRISPR cells.
Differentially expressed genes are presented in a CTRL (blue bar above heatmap) vs OTX2CRISPR (pink bar above heatmap) comparison and scaled from the lowest expressed gene to the highest per cluster. Each cluster is represented below heatmaps. Within heatmaps, purple represents low gene expression and yellow represents high expression.
Figure 6 with 1 supplement
Quantitative validation in retinal sections of genes with altered expression in the single cell OTX2 mutation analysis.
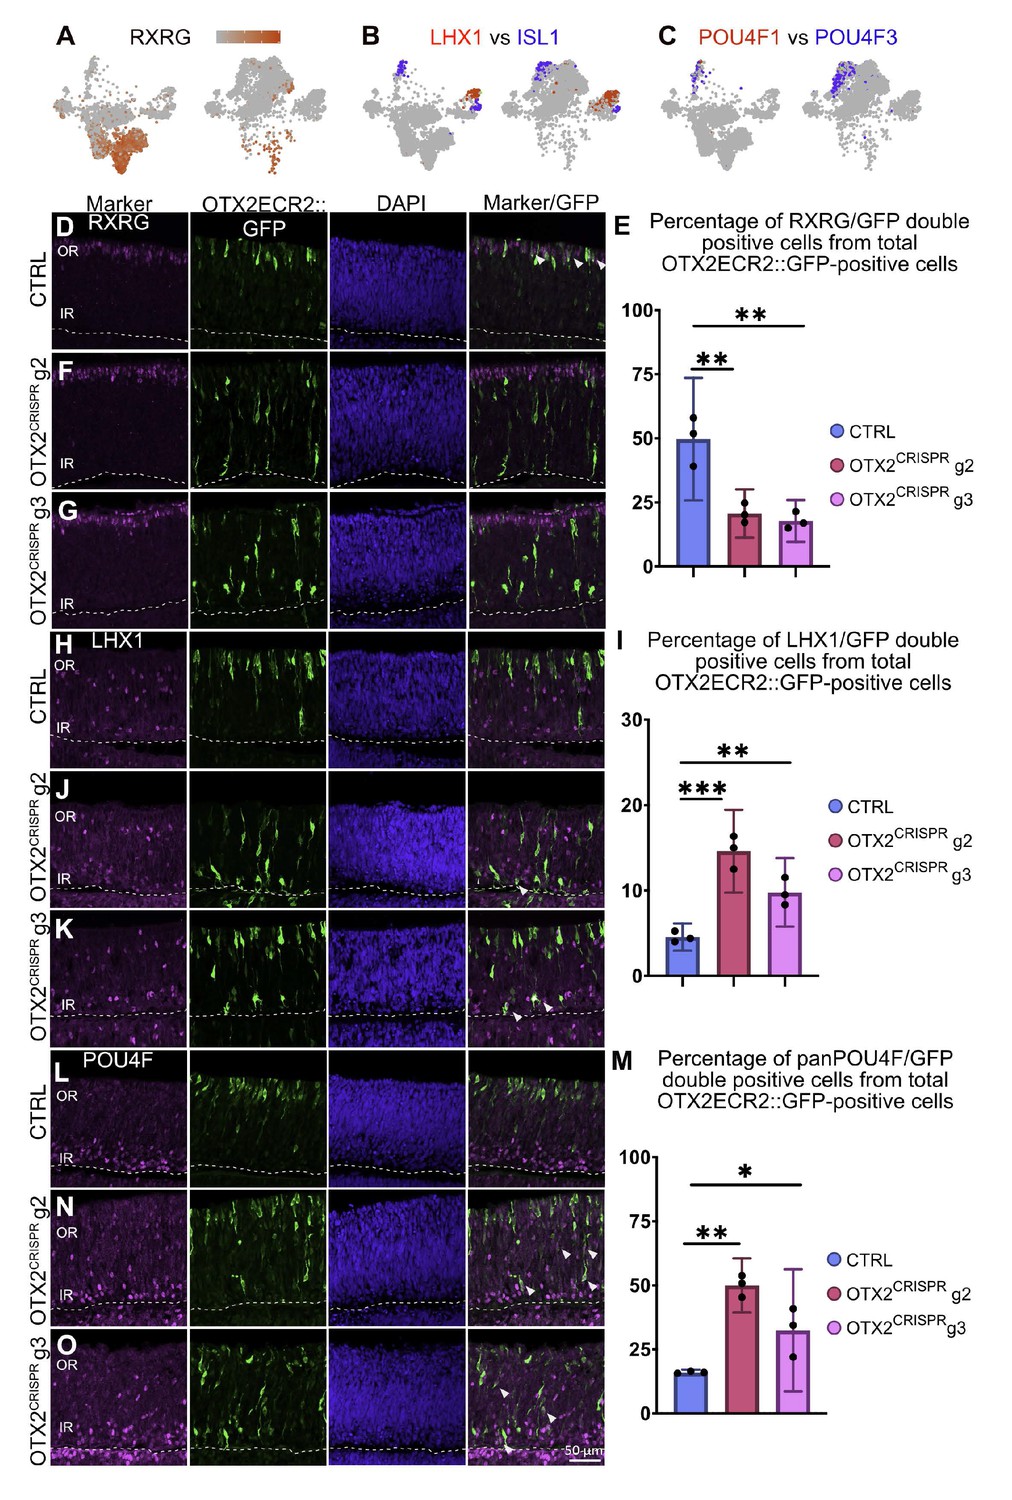
(A) Heatmap in a TSNE view of RXRG in the CTRL (left) and OTX2CRISPR (right). The expression of RXRG is severely reduced in the mutant dataset. (B) Comparative analysis of the simultaneous expression of LHX1 (red) and ISL1 (blue) in TSNE plots of CTRL (left) and OTX2CRISPR (right). (C) Comparative analysis of POU4F1 and POU4F2 in mutant and control retinas. Similarly, expression of POU4F1 remains restricted to a small number of cells, while POU4F2 (blue) is expressed by an increased number of cells in the OTX2CRISPR sample. (D–O) Quantitative analysis of the RXRG, LHX1 and panPOU4F proteins in the CTRL (D, H, L) and both g2 (F, J, M) and g3 (G, K, O) mutant retinas. Bar graphs represent mean percentages of OTX2ECR2::GFP/marker-double positive cells from the total number of OTX2ECR2::GFP cells. Data points represent the biological replicates, n = 3 for each. Error bars represent 95% confidence intervals. OR, outer retina, IR, inner retina.
Figure 6—figure supplement 1
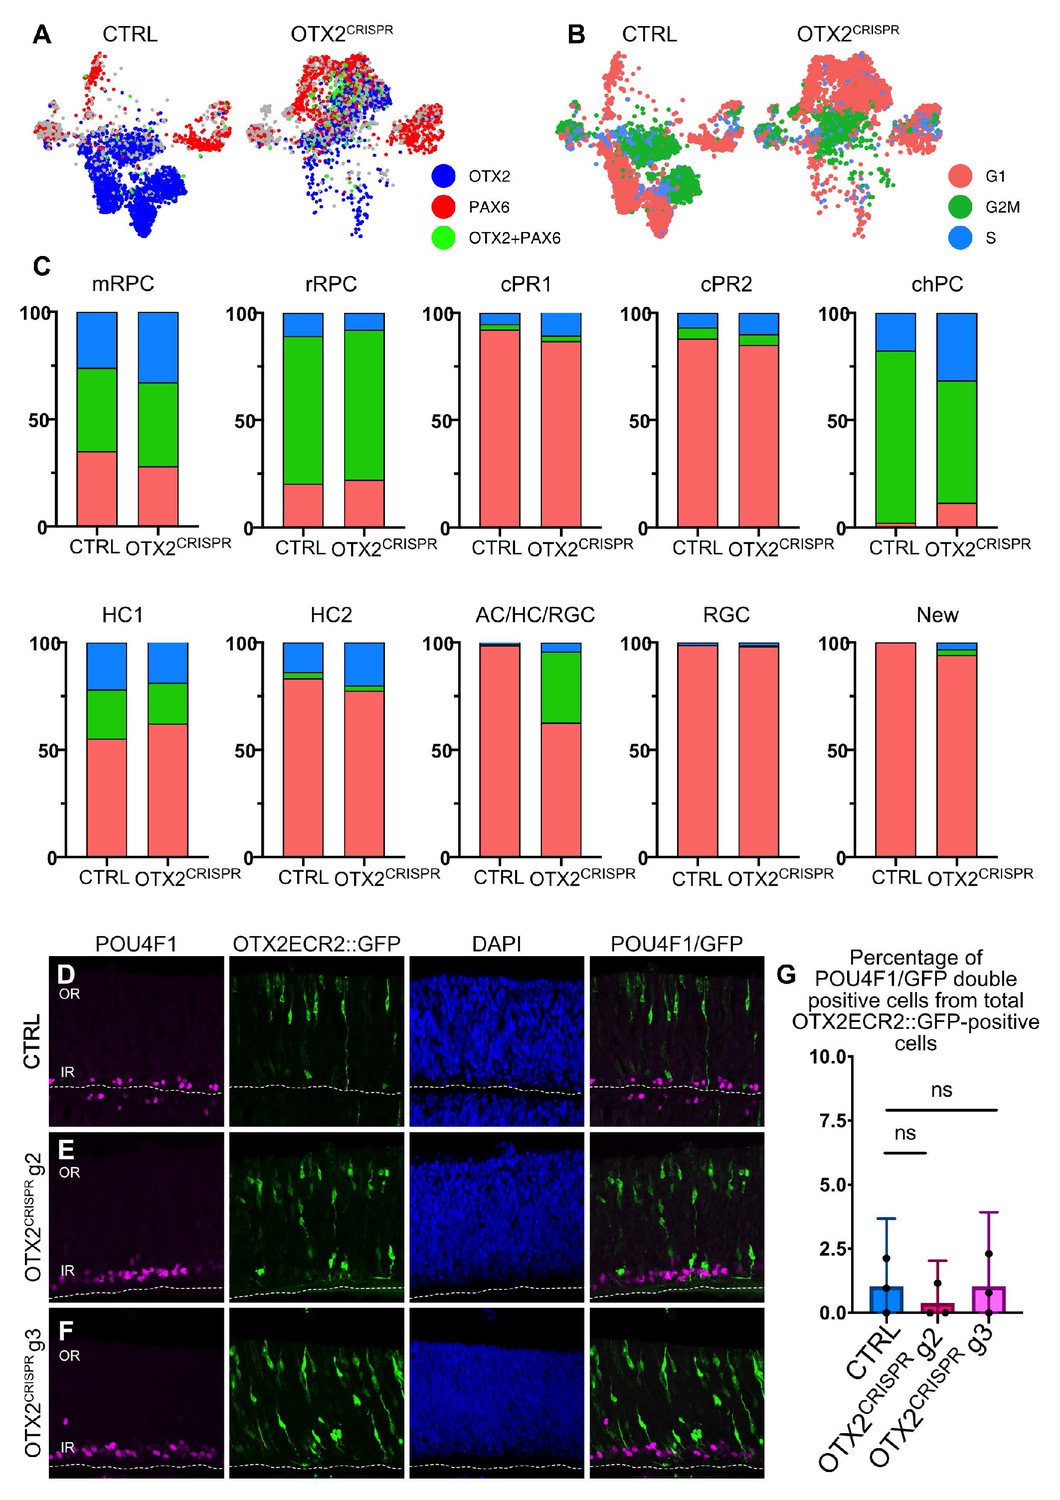
Mutually exclusive OTX2 and PAX6 expression, cell cycle distribution and POU4F1 colocalization with OTX2ECR2::GFP.
(A) Expression of OTX2 (blue) and PAX6 (red) in cells that express the respective markers exclusively. Cells marked with green in the TSNE plots of the CTRL and OTX2CRISPR have expression of both OTX2 and PAX6. (B) Distribution of cell cycle markers in the TSNE plots of the CTRL and OTX2CRISPR mutants. (C) Percentile distribution of cell cycle markers per each cluster in mutant and control datasets. (D–F) Confocal micrographs of vertical sections of CTRL (D), OTX2CRISPR g2 (E), and g3 (F) electroporated retinas that were immunostained for the detection of POU4F1, as well as GFP expressed in the OTX2ECR2::GFP cells. (G) Mean percentages of the OTX2ECR2::GFP/POU4F1 double positive cells from the total number of OTX2ECR2::GFP-positive cells. Error bars represent 95% confidence intervals, n = 3.
Figure 7
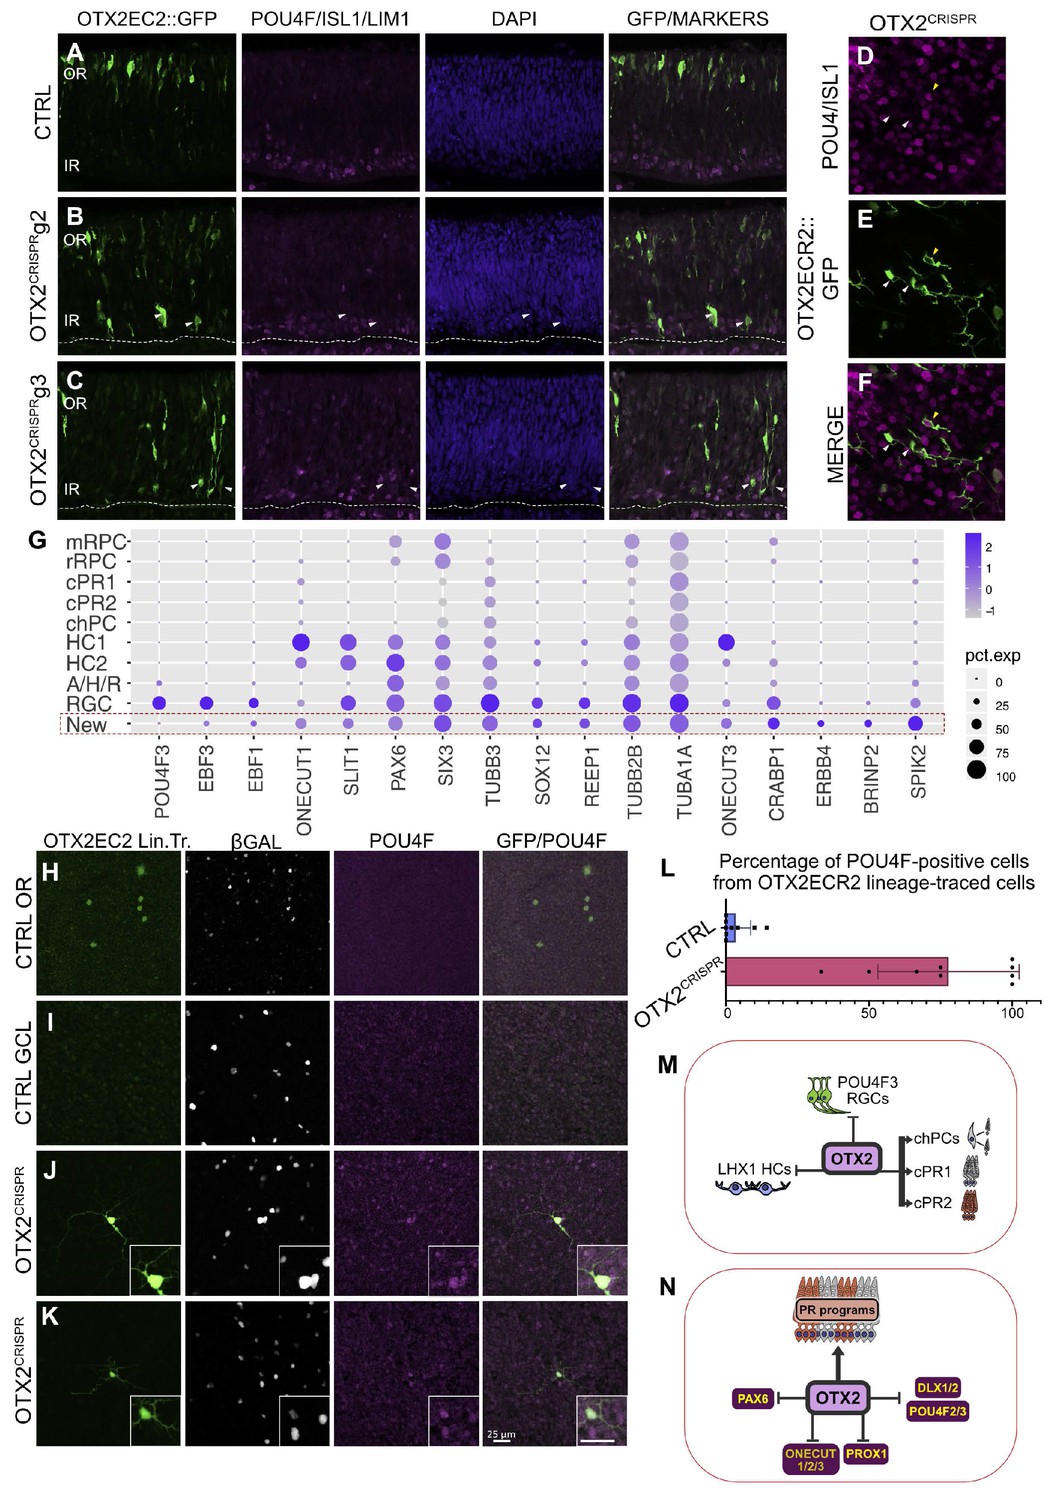
OTX2 mutation results in the generation of a cellular population with morphological features of RGCs but that does not express RGC markers at the time of the single cell analysis.
(A–C) Confocal micrographs of vertical sections of retinas electroporated with the OTX2ECR2::GFP reporter and respective CRISPR complex (control or with guide) at E5 and cultured for 2 days and immunostained simultaneously with panPOU4F, ISL1 and LHX1 along with GFP. White arrows show GFP-positive cells that are not positive for any of the three markers. (D–F) Confocal micrographs of whole mount retinas electroporated with the OTX2ECR2::GFP reporter and respective CRISPR g2 at E5 and cultured for 2 days and immunostained simultaneously with panPOU4F and ISL1, along with GFP. White arrows show cells that are not positive for the markers, while the yellow arrow shows a marker positive RGC. (G) Dot plot presenting representative markers for cluster New. The size of the dot corresponds to the percentage of cells expressing the marker (x-axes) in each cluster (y-axes). The blue color intensity represents the average of the expression level. (H–L) Lineage tracing of the OTX2ECR2 element shows predominantly RGCs in the OTX2CRISPR retina, compared to the PR-rich CTRL. OTX2ECR2 element drives the expression of PhiC31 recombinase, that, upon recombination of the attachment sites, results in GFP expression in all cell with past and present activity of the OTX2ECR2 element. OTX2ECR2 lineage-traced cells in the outermost half of a whole mount CTRL retina (H) and in the innermost half of the whole mount OTX2CRISPR retinas (J, K). (I) Micrograph of a CTRL WM retina imaged in the GCL shows no OTX2ECR2 lineage traced cells are amongst the β-Galactosidase (electroporation control marker) positive ones. (L) Quantitative analysis of whole retina thickness in both CTRL and mutant samples. Bar graph represents percentages of GFP/POU4F double-positive cells, from total number of GFP-positive cells. Datapoints represent a technical replicate from each retina counted (three technical replicates for each of the three biological replicates). (M–N) Contribution of OTX2 during the cell fate specification in the developing chick retina. (M) OTX2 is necessary for the generation of two PRs types, as well as one type of cone homotypic progenitor cell (chPCs), repressing the generation of subtypes of RGCs and HCs. (M). OTX2 activates genes required for formation of PRs, inhibiting regulators of RGC (POU4F2/3, DLX1/2), HC (ONECUT, PROX1) and PAX6 expression. WM, whole mount, OR, outer retina, GCL, ganglion cell layer.
Tables
Key resources table
| Reagent type (species) or resource | Designation | Source or reference | Identifiers | Additional information |
|---|---|---|---|---|
| Genetic reagent (Gallus gallus) | GRCg6a | International Chicken Genome Consortium | GCF_000002315.5 | |
| Transfected construct | Modified px330: P18/MG18 | Modified from the Cong et al., 2013 version | The original promoter of the px330 upstream of the Cas9 ORF was replaced with the CAG promoter | |
| Transfected construct | Modified px330 with OTX2 g2: MG10 | Lab made | ||
| Transfected construct | Modified px330 with OTX2 g3: MG233 | Lab made | ||
| Transfected construct | Modified Stagia3: ME1860 | Emerson and Cepko, 2011 | Mouse OTX2 ECR2 EGFP reporter as described in Emerson and Cepko (2011) | |
| Transfected construct | CAG::βGal | Cepko lab | Expression vector, nuclear βGalactosidase reporter driven by the CAG promoter | |
| Transfected construct | CAG::EGFP | Matsuda and Cepko, 2004 | RRID:Addgene_11150 | Expression vector, EGFP reporter driven by the CAG promoter |
| Transfected construct | CAG::iRFP | Buenaventura et al., 2018 | Expression vector, iRFP reporter driven by the CAG promoter | |
| Antibody | Anti-OTX2 Goat polyclonal | AF1979 | RRID:AB_1617988 | |
| Antibody | Anti- OTX1+OTX2 Rabbit polyclonal | ab21990 | RRID:AB_776930 | |
| Antibody | Anti-PAX6 Mouse IgG1 monoclonal | PAX6 | RRID:AB_528427 | |
| Antibody | Anti-BRN3A Mouse IgG1 monoclonal | Mab1585 | RRID:AB_94166 | |
| Antibody | Anti-panBRN3 Mouse IgG1 monoclonal | sc-390780 | ||
| Antibody | Anti-LIM1 Mouse IgG1 monoclonal | 4F2-C | RRID:AB_531784 | |
| Antibody | Anti-ISL1 Mouse monoclonal | 39.3F7 | RRID:AB_1157901 | |
| Antibody | Anti-PH3 Rabbit polyclonal | 06–570 | RRID:AB_10582726 | |
| Antibody | Anti-VSX2 Sheep polyclonal | x1180p | RRID:AB_2314191 | |
| Antibody | Anti-βGAL Chick polyclonal | ab37382 | RRID:AB_307210 | |
| Commercial assay | Click-iT EdU Alexa Fluor 647 imaging kit | Invitrogen | Cat#C10340 | |
| Reagent | O. C. T. Compound | Sakura Tissue-Tek | Cat#4583 | |
| Reagent | Fluoromount-G | Southern Biotech | Cat#0100–01 | |
| Reagent | Papain | Worthington | Cat#L5003126 | |
| Other | Raw matrix files | NCBI Gene Expression Omnibus | GEO: GSE142244 | |
| Software, algorithm | SnapGene | GSL Biotech; snapgene.com | ||
| Software, algorithm | Fiji | Schneider et al. (2012) | https://fiji.sc/ | |
| Software, algorithm | Affinity Designer | Affinity software | ||
| Software, algorithm | JASP 0.9.0.1 | |||
| Software, algorithm | GraphPad Prism | GraphPad software | https://www.graphpad.com/scientific-software/prism/ | |
| Software, algorithm | R | R Core Team | https://www.r-project.org/ | |
| Software, algorithm | Seurat | Macosko et al. (2015) | http://satijalab.org/seurat/ | |
| Software, algorithm | ChopChop | Montague et al. (2014); Labun et al. (2016) | https://www.chopchop.cbu.uib.no | |
| Software, algorithm | FlowJo 10.2 | https://www.flowjo.com | ||
| Sequence-based reagent | Sex det. forward | This paper | PCR primers | CCCAAATATAACACGCTTCACT |
| Sequence-based reagent | Sex det. reverse | This paper | PCR primers | GAAATGAATTATTTTCTGGCGAC |
| Sequence-based reagent | Sex det. Control region forward | This paper | PCR primers | AGCTCTTTCTCGATTCCGTG |
| Sequence-based reagent | Sex det. Control region reverse | This paper | PCR primers | GGGTAGACACAAGCTGAGCC |
| Sequence-based reagent | Amplicon sequencing forward | This paper | PCR primers | GGAGCGCACCACCTTCAC |
| Sequence-based reagent | Amplicon sequencing reverse | This paper | PCR primers | CTGCACTCTGGACTCGGGCTGCACTCTGGACTCGGG |
Additional files
-
Source code 1
R script for the analysis of the single cell RNA-sequencing on the CTRL sample.
- https://cdn.elifesciences.org/articles/54279/elife-54279-code1-v2.r.zip
-
Source code 2
R script for the analysis of the single cell.
RNA-sequencing on the combined analysis of the CTRL and OTX2CRISPR datasets.
- https://cdn.elifesciences.org/articles/54279/elife-54279-code2-v2.r.zip
-
Supplementary file 1
List of antibodies used in the study.
- https://cdn.elifesciences.org/articles/54279/elife-54279-supp1-v2.xlsx
-
Supplementary file 2
Detailed values used in the quantifications, including statistical analysis.
- https://cdn.elifesciences.org/articles/54279/elife-54279-supp2-v2.xlsx
-
Supplementary file 3
List of genes regressed in the single cell analysis.
- https://cdn.elifesciences.org/articles/54279/elife-54279-supp3-v2.xlsx
-
Supplementary file 4
Markers used for the assignment of the clusters in the CTRL dataset.
- https://cdn.elifesciences.org/articles/54279/elife-54279-supp4-v2.csv
-
Supplementary file 5
Markers used for the assignment of the clusters in the combined analysis of the CTRL and OTX2CRISPR datasets.
- https://cdn.elifesciences.org/articles/54279/elife-54279-supp5-v2.xlsx
-
Supplementary file 6
Markers expressed in the restricted RPC cluster.
- https://cdn.elifesciences.org/articles/54279/elife-54279-supp6-v2.csv
-
Transparent reporting form
- https://cdn.elifesciences.org/articles/54279/elife-54279-transrepform-v2.docx
Download links
A two-part list of links to download the article, or parts of the article, in various formats.
Downloads (link to download the article as PDF)
Open citations (links to open the citations from this article in various online reference manager services)
Cite this article (links to download the citations from this article in formats compatible with various reference manager tools)
OTX2 represses sister cell fate choices in the developing retina to promote photoreceptor specification
eLife 9:e54279.
https://doi.org/10.7554/eLife.54279


