Guanidine hydrochloride reactivates an ancient septin hetero-oligomer assembly pathway in budding yeast
- Department of Cell and Developmental Biology, University of Colorado Anschutz Medical Campus, United States
- Department of Biology, University of North Carolina at Chapel Hill, United States
- Laboratoire Physico Chimie Curie, Institut Curie, PSL Research University, CNRS UMR 168, France
- Sorbonne Université UPMC Univ Paris 06, France
Figures
Figure 1 with 1 supplement
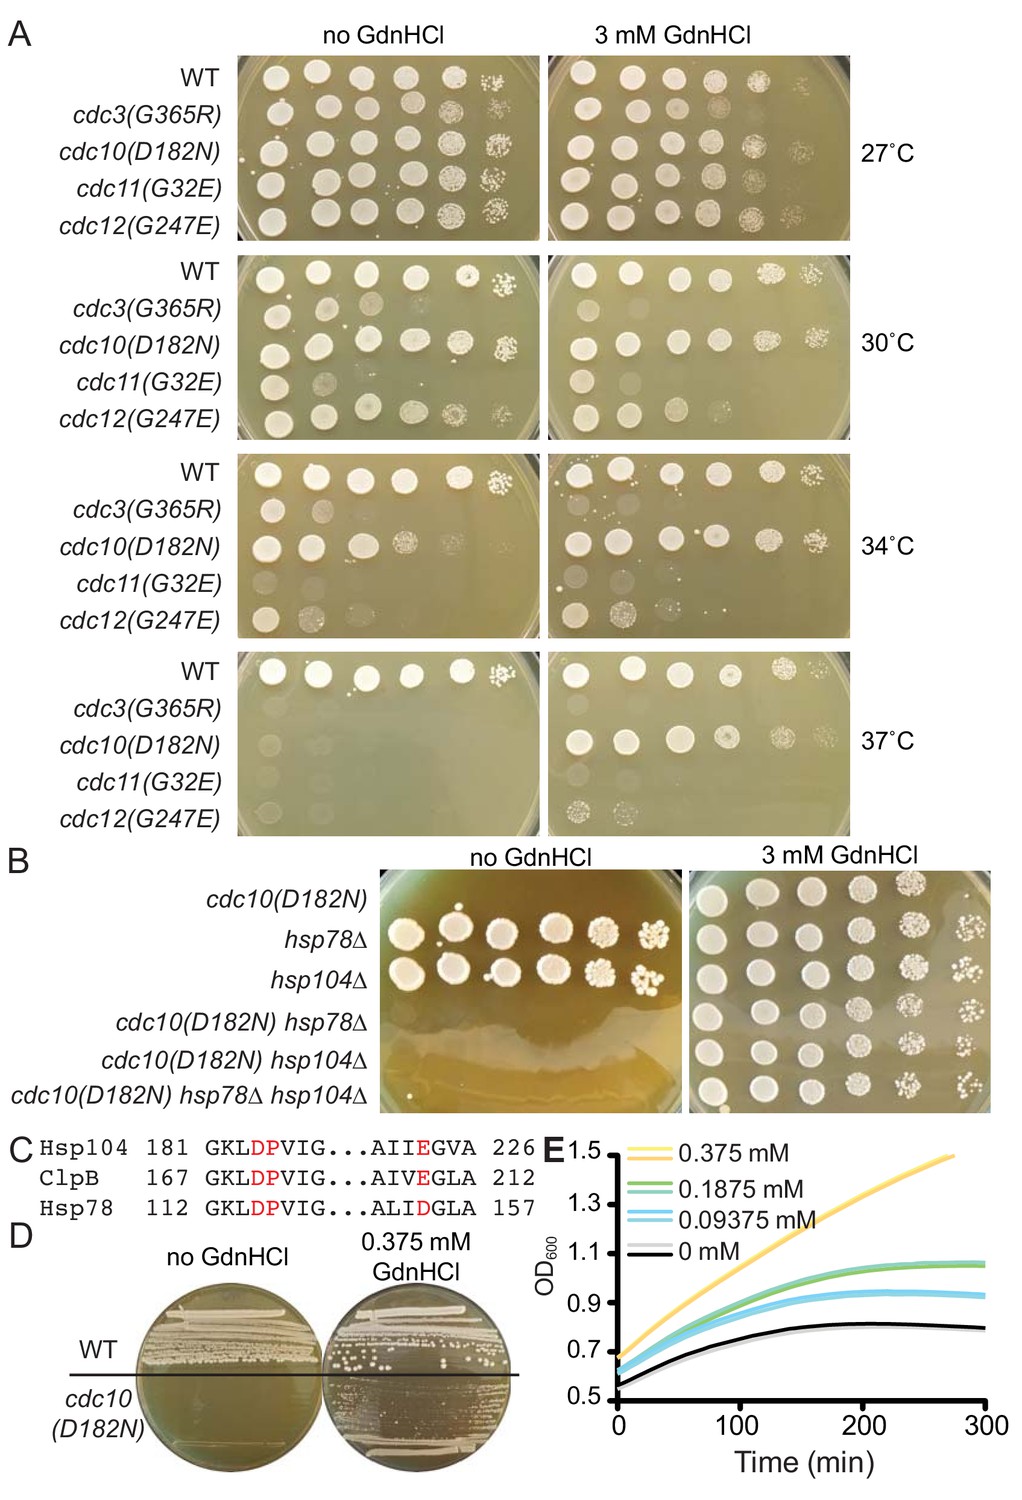
GdnHCl rescues the temperature-sensitive defects of cdc10(D182N) mutants in a manner that does not require Hsp104 or Hsp78.
(A) Dilution series of yeast cells spotted on rich (YPD) agar medium with or without 3 mM GdnHCl and incubated at the indicated temperatures for 3 days before imaging. Strains were: BY4741, CBY07236, CBY06417, CBY08756, and CBY05110. Effects of GdnHCl on septin ring formation and on the growth strains carrying other mutant alleles are provided in Figure 1—figure supplement 1. (B) As in (A), but only at 37°C and with strains of the indicated genotypes. (C) Amino acid alignment of regions S. cerevisiae Hsp104 and Hsp78 with Thermus thermophilus ClpB, showing conservation of residues (in red) that contact Gdm in the ClpB crystal structure (PDB 4HSE). (D) As in (A), but at 37°C and with BY4741 (‘WT’) or CBY06417 (‘cdc10(D182N)') cells and the indicated concentrations of GdnHCl. The cells were streaked with a toothpick, rather than spotted from dilutions. (E) Growth curves for the cdc10(D182N) strain CBY06417 at 37°C in the indicated concentrations of GdnHCl. The optical density at 600 nm (‘OD600’) was measured at 5 min intervals. Each line shows the mean for 12 replicate cultures in the same row of the 96-well plate. Duplicate rows were monitored for each GdnHCl concentration.
-
Figure 1—source data 1
Optical density readings of culture growth for Figure 1E.
- https://cdn.elifesciences.org/articles/54355/elife-54355-fig1-data1-v2.xlsx
Figure 1—figure supplement 1
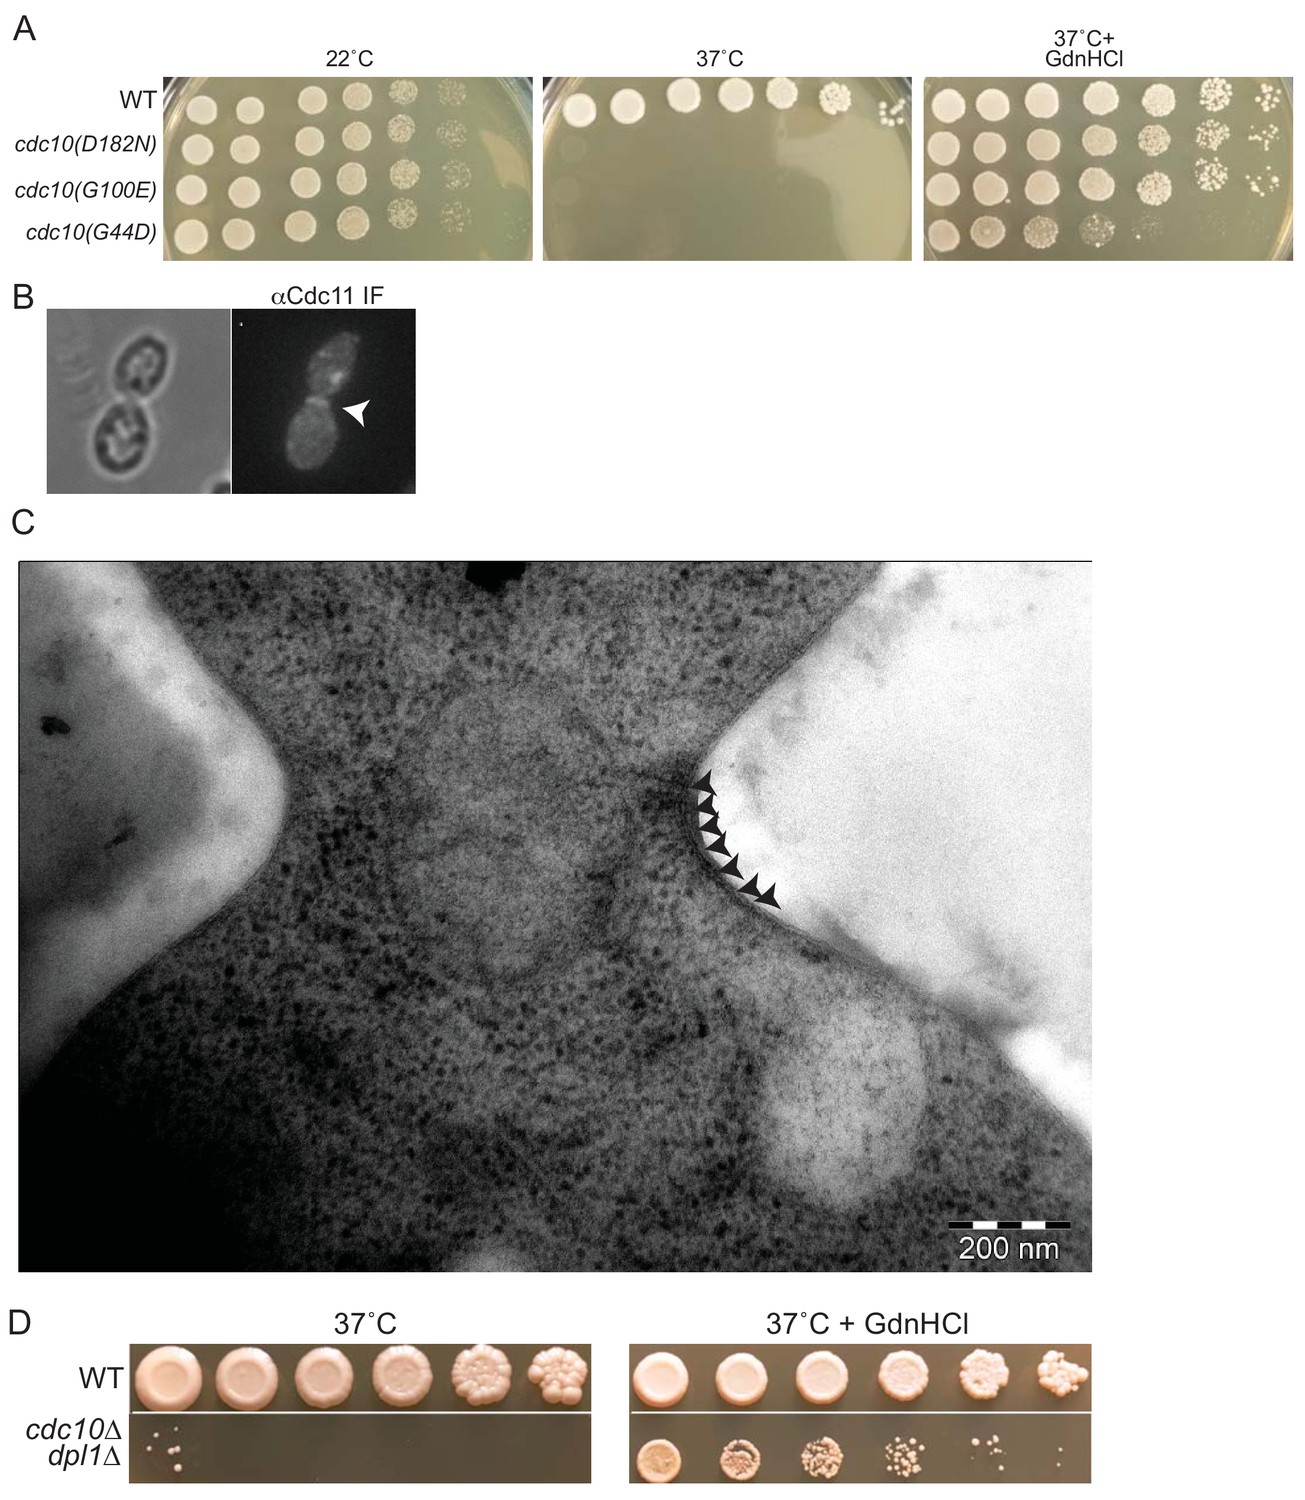
GdnHCl rescues high-temperature septin function and neck filament assembly in cdc10 mutants.
(A) Dilution series of cells of the indicated genotypes (strains BY4741, CBY06417, CBY06420, or CBY06424) spotted on YPD plates with or without 3 mM GdnHCl and incubated at the indicated temperatures for 3–4 days. (B) anti-Cdc11 antibodies were used to stain cdc10∆ cells cultured at 37°C in 3 mM GdnHCl. Arrowhead, septin ring. (C) Cells of the cdc10(D182N)-GFP strain JTY3986 were cultured at 37°C in liquid YPD with 3 mM GdnHCl, cryo-fixed, cryo-substituted, sectioned, and stained with uranyl acetate prior to imaging by EM. Arrowheads indicate neck filaments tightly apposed to the plasma membrane. (D) As in (A), but with cells of strain BY4741 (‘WT’) or MMY0370 (‘cdc10∆ dpl1∆'). An intervening area of the plates was cropped from the images.
Figure 2
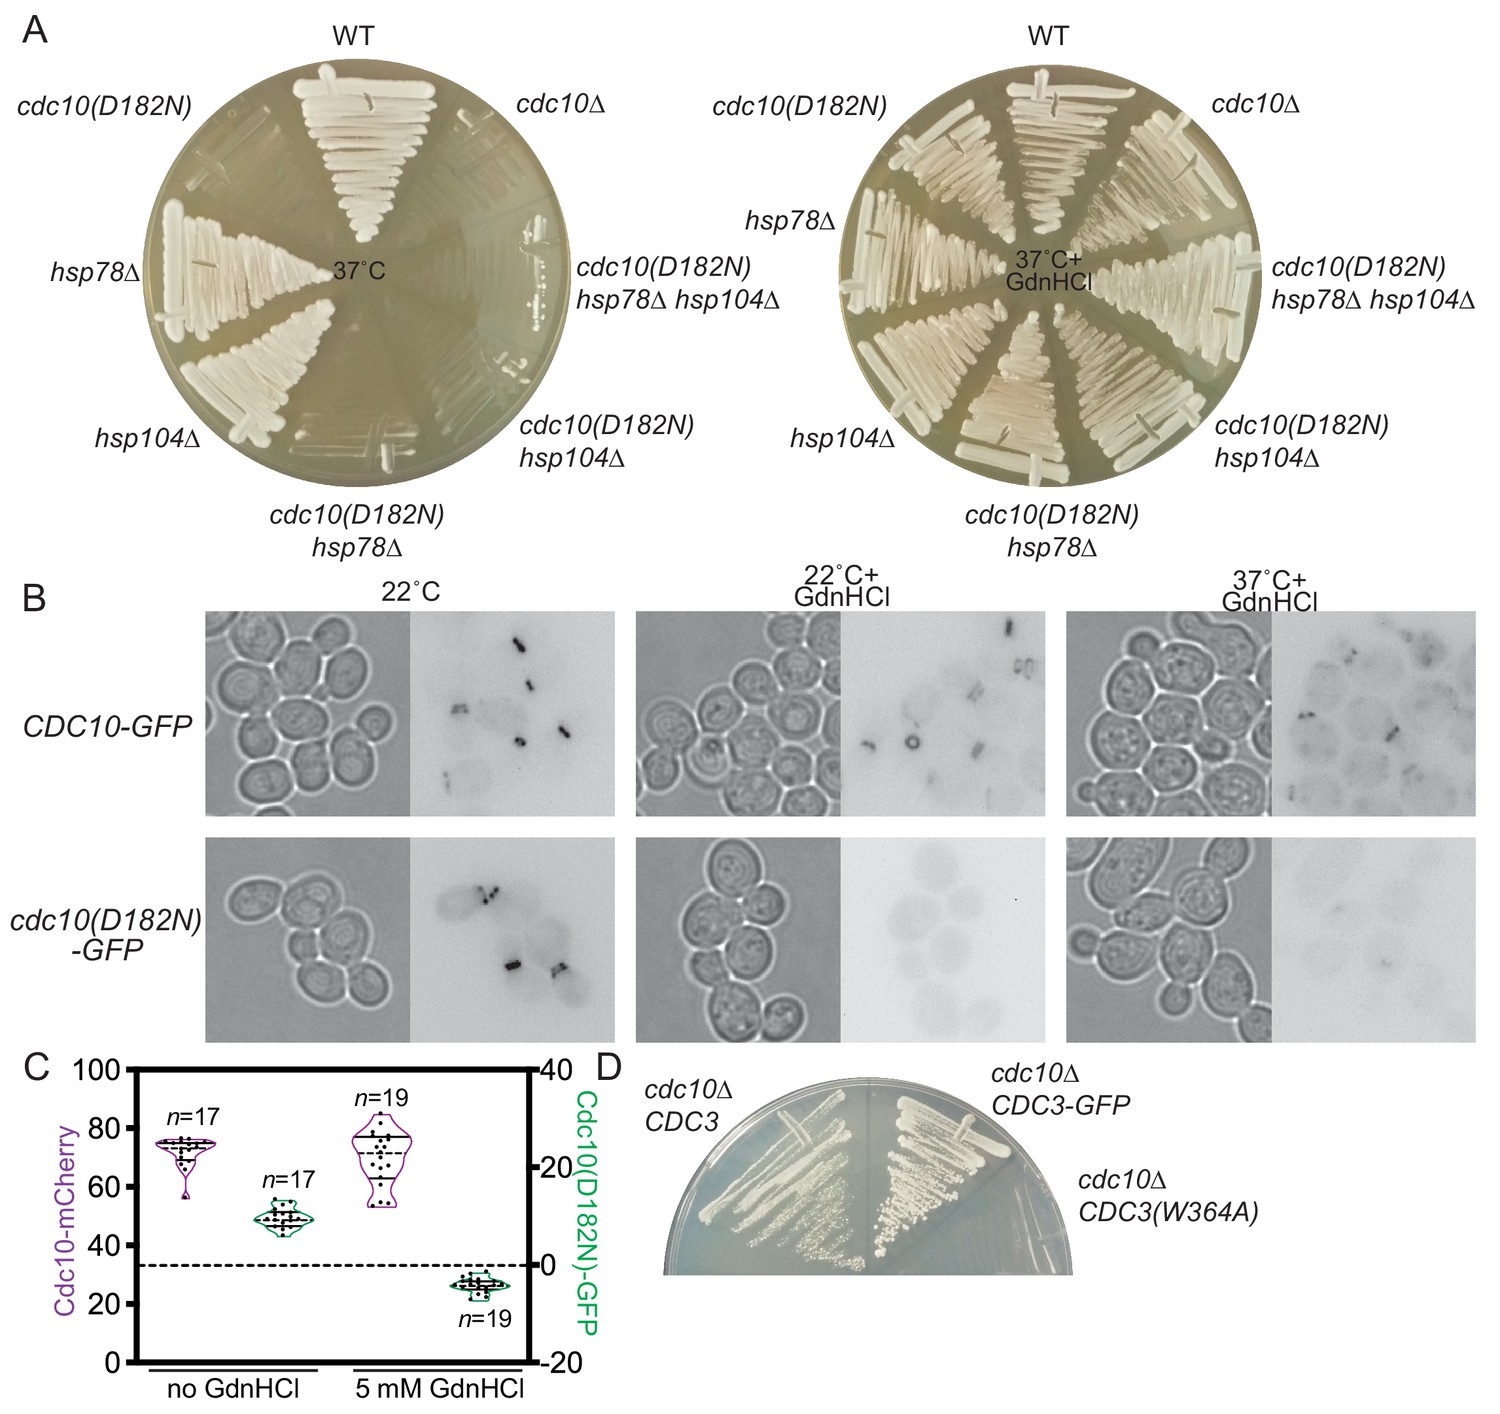
GdnHCl promotes exclusion of mutant Cdc10 molecules from higher-order septin assemblies.
(A) As in Figure 1B, but with the addition of cdc10∆ cells, and the cells were streaked with a toothpick, rather than spotted from dilutions. (B) Cultures of the strains JTY3985 (‘CDC10-GFP’) or JTY3986 (‘cdc10(D182N)-GFP’) were grown overnight in liquid culture at the indicated temperatures with or without 3 mM GdnHCl and then imaged by microscopy with transmitted light (left images) or for GFP fluorescence (right images). Fluorescence images were inverted to improve visibility. (C) Cells of the strain JTY4020 were cultured at 37°C with or without 5 mM GdnHCl and imaged as in (B), then line scans of bud neck fluorescence were performed for the indicated numbers of cells to quantify levels of Cdc10-mCherry (purple) or Cdc10(D182N)-GFP (green). For each data point, cytosolic signal was subtracted from bud neck signal; negative values thus indicate cytosolic signal greater than septin ring signal. In violin plots, solid lines indicate quartiles and dashed lines are medians. (D) In strain JTY5104, the chromosomal sources of Cdc3 and Cdc10 are eliminated by deletion and Cdc3(W364A) and Cdc10 are supplied by LYS2- or URA3-marked plasmids, respectively. Following introduction of LEU2-marked plasmid encoding WT Cdc3 (pFM831) or Cdc3-GFP (pML109), the transformants were passaged on medium with α-aminoadipate to select for loss of the CDC3(W364A) plasmid. These clones were then streaked, along with cells of the original strain JTY5104 carrying both plasmids (‘cdc10∆ CDC3(W364A)”), on medium with 3 mM GdnHCl and 5-fluoro-orotic acid (FOA, to select for loss of the CDC10 plasmid) and incubated for 4 days at 22°C.
-
Figure 2—source data 1
Intensity values of tagged septins at septin rings for Figure 2C.
- https://cdn.elifesciences.org/articles/54355/elife-54355-fig2-data1-v2.xlsx
Figure 3
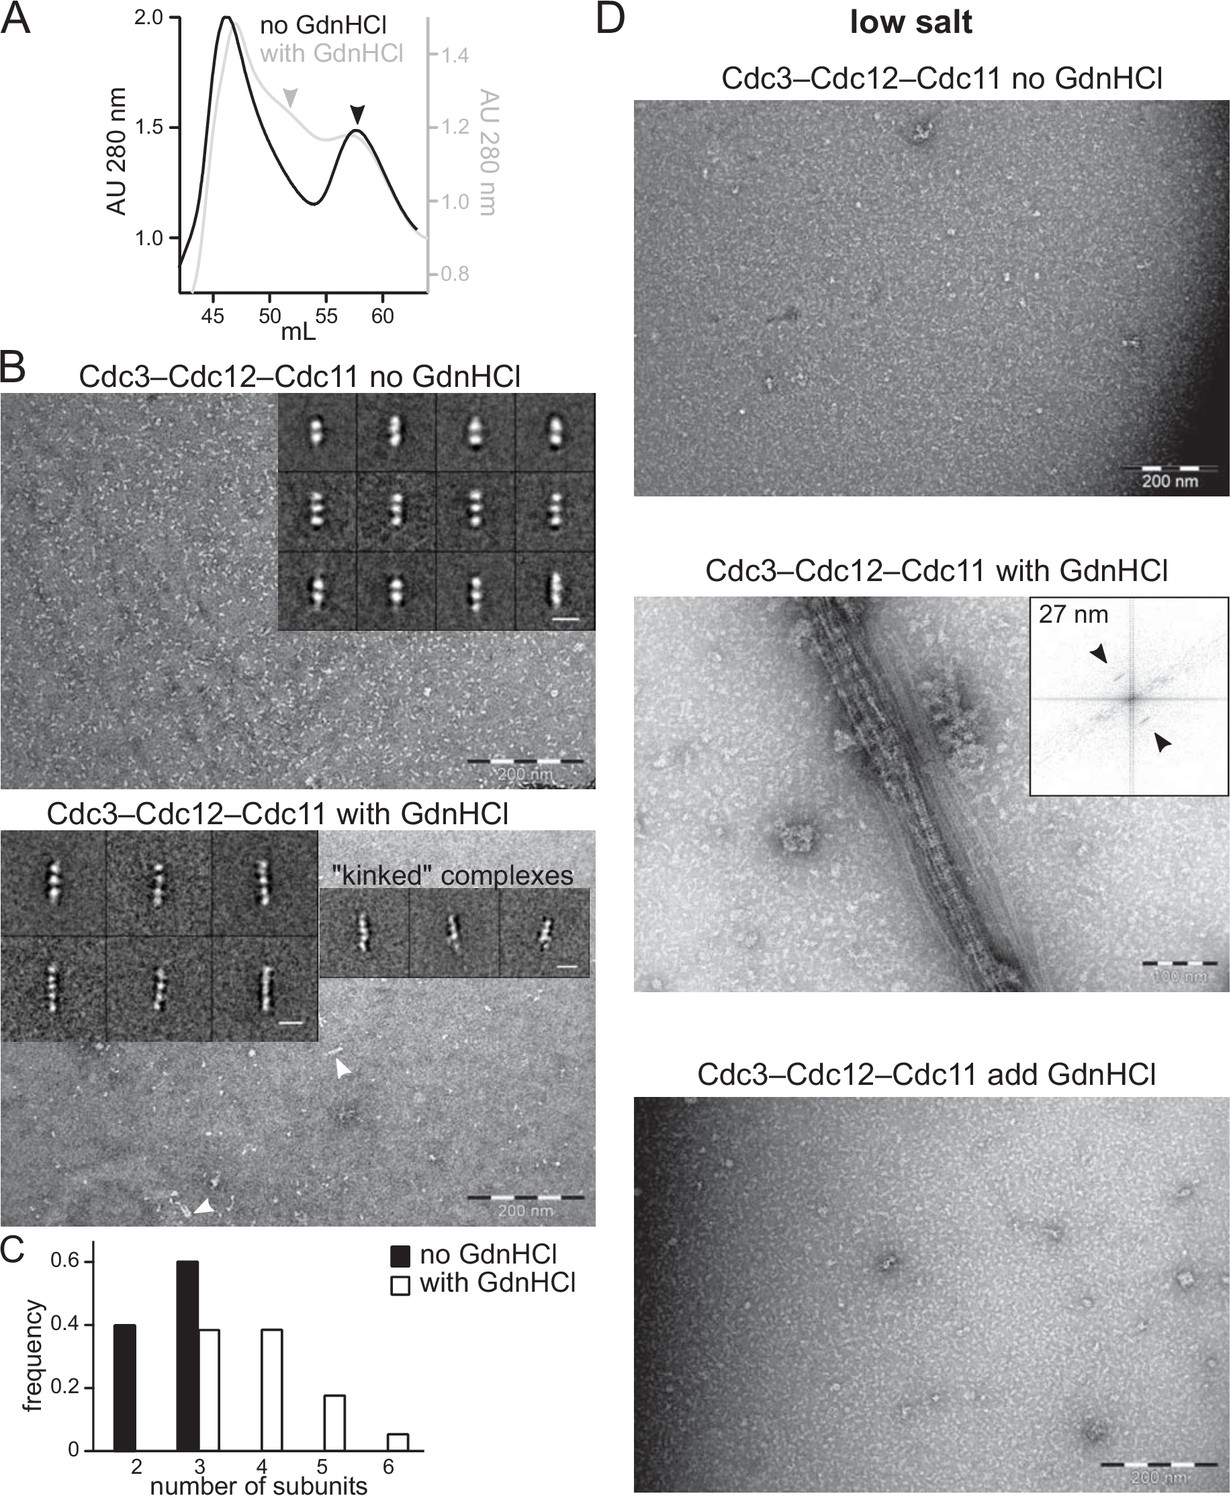
GdnHCl promotes higher-order assembly by recombinant Cdc10-less septin hexamers produced in E. coli.
Complexes purified from E. coli cells co-expressing Cdc3, Cdc11, and 6xHis-Cdc12 in the absence or presence of 50 mM GdnHCl, as indicated, were analyzed by size-exclusion chromatography (SEC) in high-salt (300 mM NaCl) buffer, to prevent filament polymerization, and fractions containing the peak of protein, as judged by absorbance at 280 nm, were examined with an electron microscope. (A) SEC elution profiles overlaid to illustrate the appearance of a new peak of larger particles (eluting at ~ 52 mL) in the samples prepared with GdnHCl. Arrowheads indicate the peaks from which fractions were taken for EM analysis. The void volume (~46 mL) contains protein aggregates. ‘AU’, absorbance units. (B) EM analysis of samples indicated in (A) were exchanged into non-polymerizing high-salt buffer (50 mM Tris-HCl pH 8, 300 mM NaCl with or without 50 mM GdnHCl). Arrowheads point to complexes longer than trimers. Inserts display representative class averages resulting from image processing, with 10 nm scale bars. (C) Frequency distribution of sizes of particles found in high-salt samples, from 4233 particles of the sample produced without GdnHCl and 3247 particles produced with GdnHCl. (D) As in (B) but following dilution into polymerizing (‘low salt’, 50 mM Tris-HCl pH 8, 50 mM NaCl with or without GdnHCl) conditions. Insert shows the Fourier transform of a bundle of filaments as in the image beneath it, with arrows pointing at diffraction peaks reflecting repetitive distances of 27 nm. The bottom panel shows complexes synthesized and purified in the absence of GdnHCl to which GdnHCl was added to 50 mM prior to dilution in low salt buffer also containing 50 mM GdnHCl.
-
Figure 3—source data 1
Absorbance values at 280 nm at each elution volume for Figure 3A.
- https://cdn.elifesciences.org/articles/54355/elife-54355-fig3-data1-v2.xlsx
-
Figure 3—source data 2
Particle size values for Figure 3C.
- https://cdn.elifesciences.org/articles/54355/elife-54355-fig3-data2-v2.xlsx
Figure 4 with 1 supplement
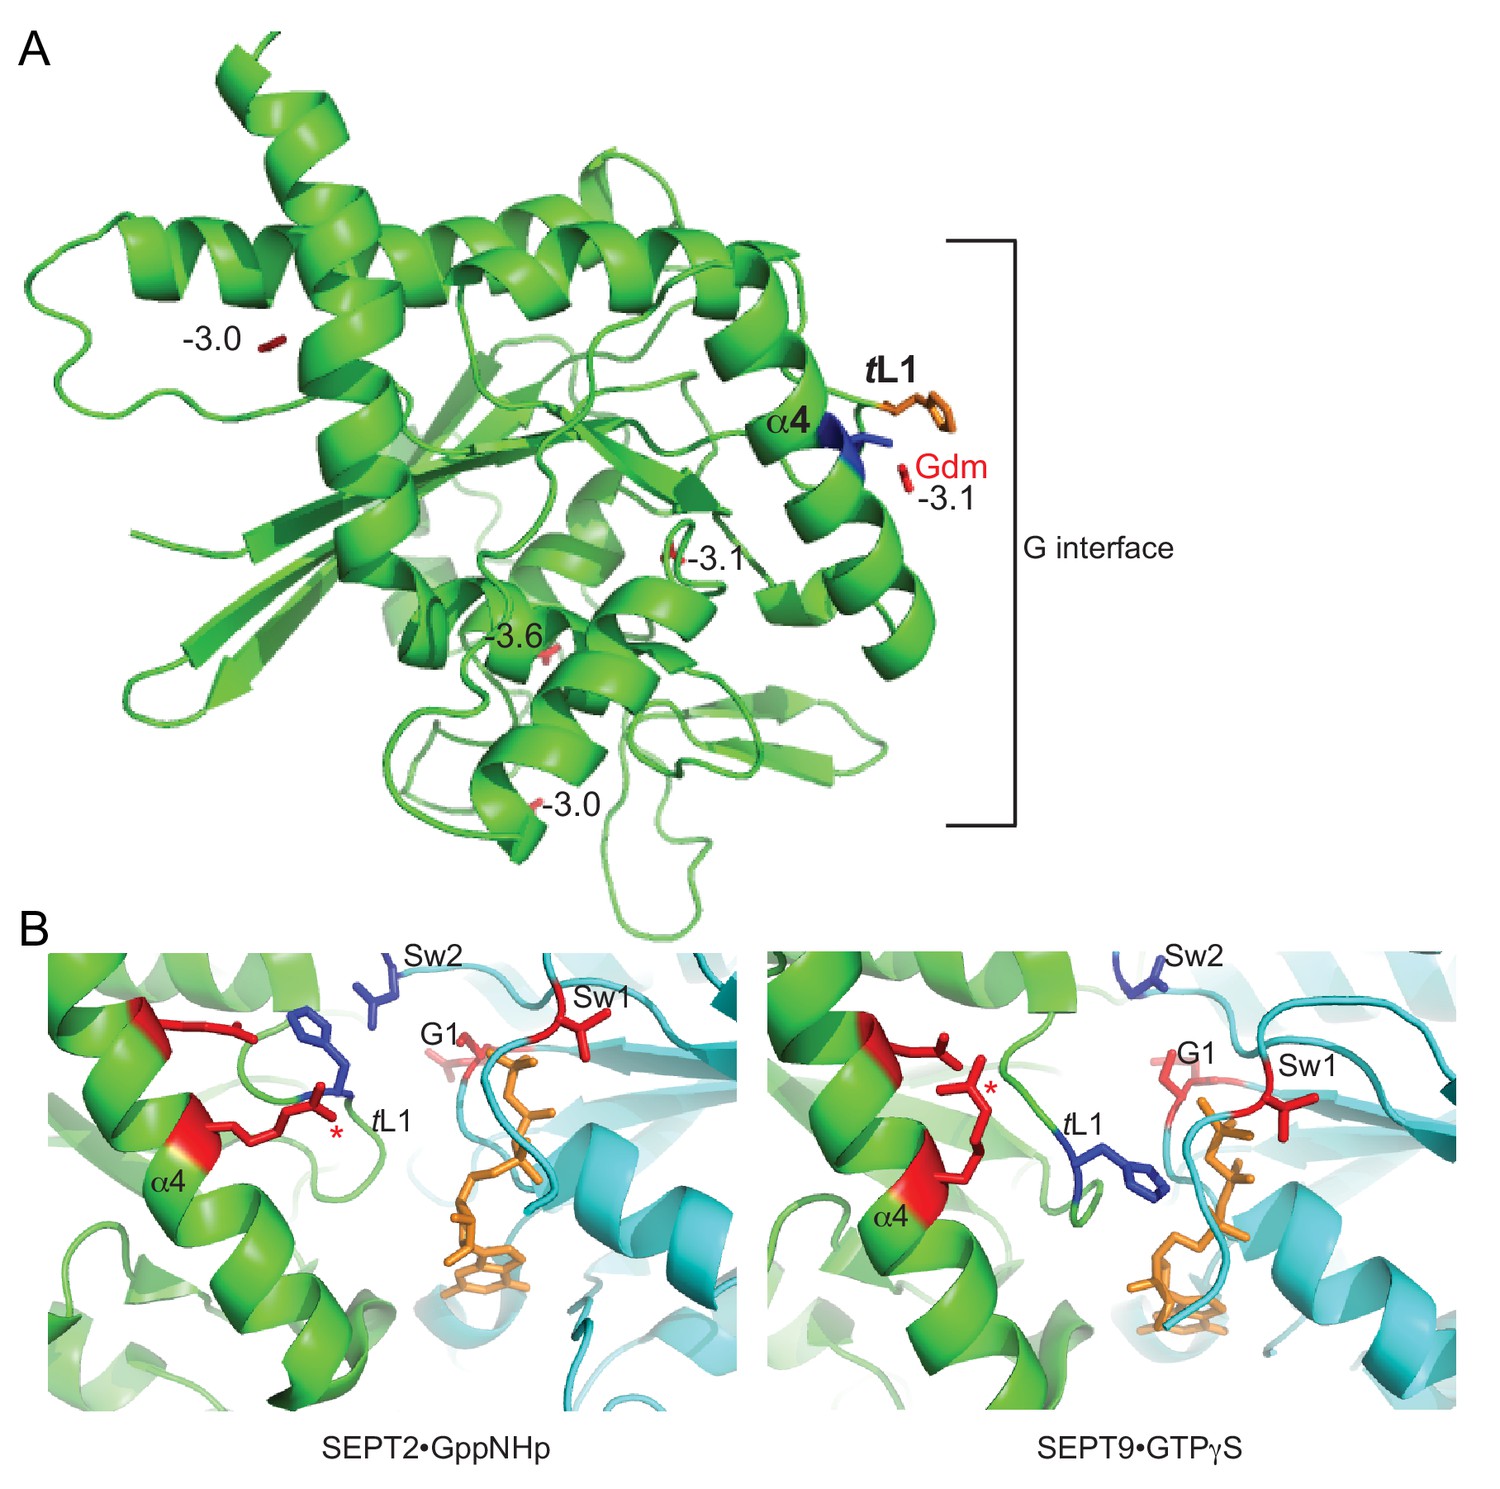
Parallel in silico modeling and phylogenetic analysis independently point to Gdm binding near Thr302 and His262 in Cdc3.
(A) A model of the structure of Cdc3 based on SEPT2•GppNHp (PDB 3FTQ) was used for unbiased in silico docking of Gdm. The top 5 predicted sites of Gdm binding are shown (red), labeled with predicted free energies of binding, in kcal/mol. Thr302 is in blue, His262 in orange. ‘α4’, α4 helix; ‘tL1’, trans loop 1. (B) Cartoon ribbon view of human septin G homodimer crystal structures showing selected side chains. Red, residues corresponding to the non-conservative changes seen in the phylogenetic analysis in Figure 4—figure supplement 1B. Blue, conserved His residue of trans loop 1 and Asp residue of Switch II region. Orange, GTP analog. Red asterisk, Arg in α4 helix. ‘α4’, α4 helix; ‘tL1’, trans loop 1; ‘Sw1’, Switch I; ‘Sw2’, Switch II; ‘G1’, G1 motif/P-loop.
Figure 4—figure supplement 1
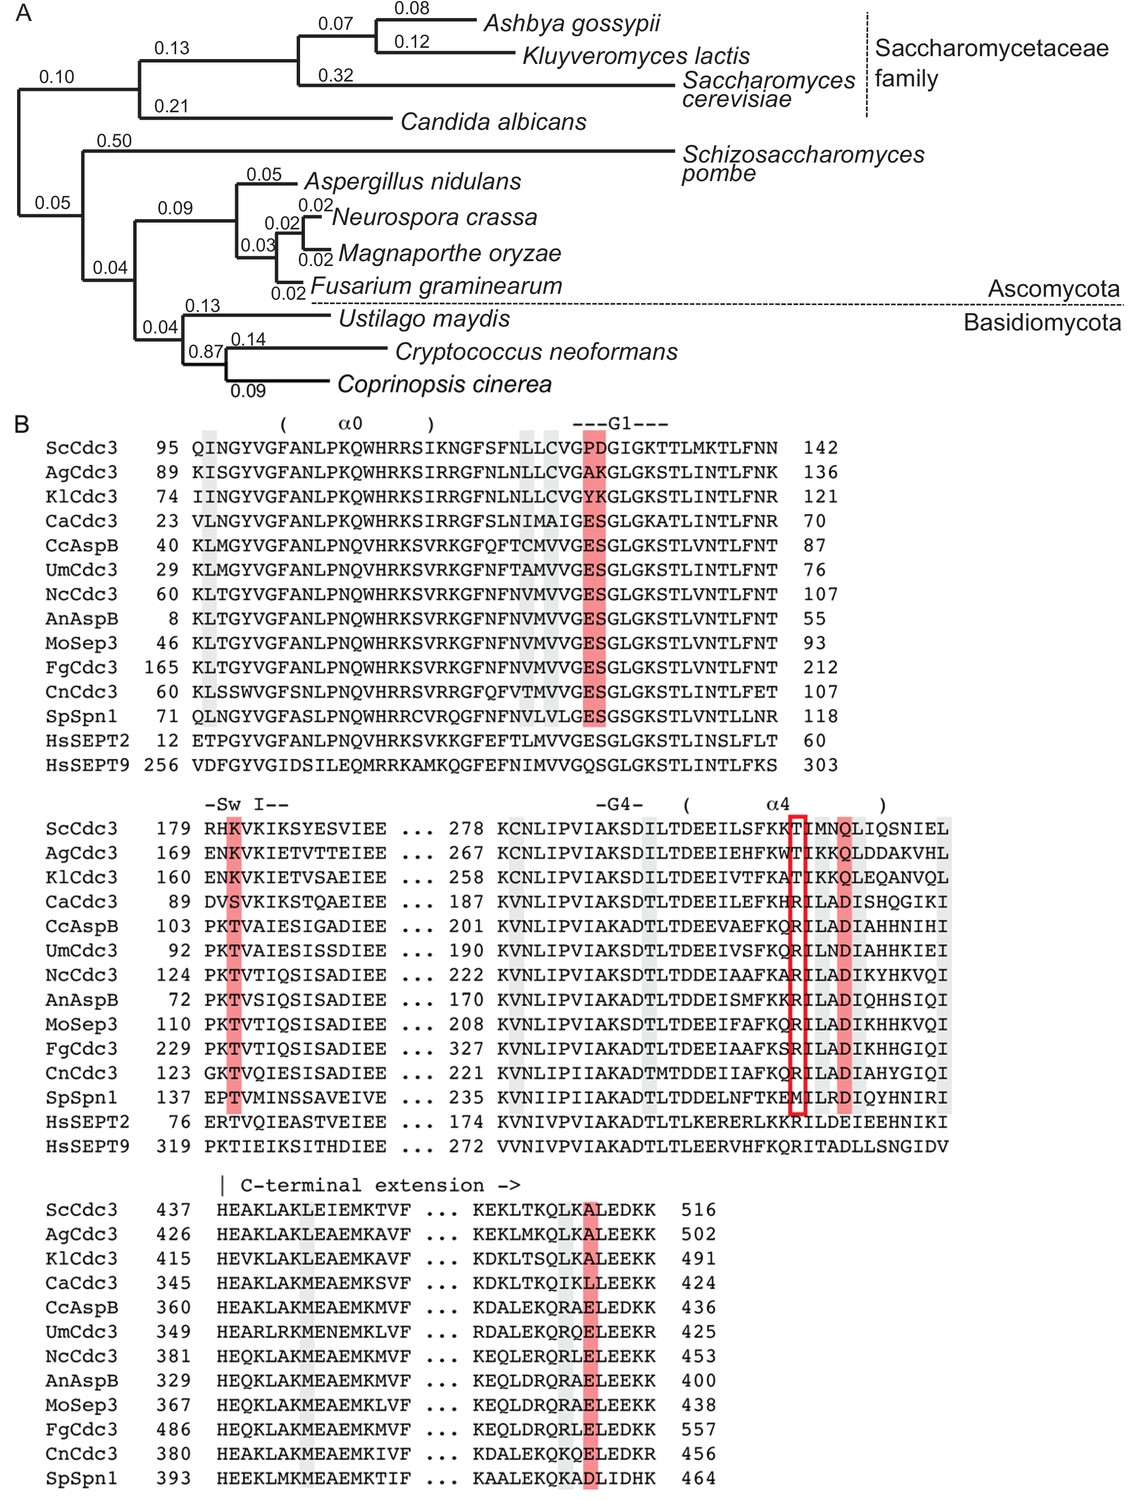
Co-variation during evolution of Cdc3 residues clustered around the trans loop 1 of the G dimerization interface identifies an Arg residue ‘missing’ in species that poorly tolerate cdc10∆.
(A) Phylogenetic tree illustrating the relatedness at the protein sequence level for Cdc3 homologs from fungal species for which the phenotypic consequences of deletion or mutation of CDC10 have been characterized in relation to deletion or mutation of CDC3. See (B) for protein accession numbers. Branch length values are substitutions per site. Selected taxonomic information is provided at right. (B) Amino acid alignment of sequences of Cdc3 and its homologs in fungal species. Names of species and the protein homologous to Cdc3 are color-coded: blue, species for which mutation of the CDC10 homolog is as severe as mutation of the CDC3 homolog; orange, species for which mutation of CDC10 is clearly less severe than mutation of the CDC3 homolog. Non-CTE human septin sequences are shown below for comparison with crystal structures of those septins shown in Figure 4B. Shading or boxing indicates residues that are either the same in S. cerevisiae, A. gossypii, and K. lactis and something different in the other fungal species, and/or the same in the other species and something different in S. cerevisiae, A. gossypii, and K. lactis. Gray, conservative changes; red, non-conservative changes. Red box: position 302 in ScCdc3. Key structural features are indicated above each group of sequences; ‘α0’, α0 helix; ‘α4’, α4 helix; ‘Sw I’, Switch I loop; ‘G1’, G1 motif; ‘G4’, G4 motif. Sc, S. cerevisiae (KZV09558); Ag, A. gossypii (NP_985658); Kl, K. lactis (CAH00343), Ca, C. albicans (EEQ42751); An, A. nidulans (AAB41233); Cn, C. neoformans (XP_012050631); Fg, F. graminearum (ESU11253); Nc, N. crassa (ESA42882); Sp, S. pombe (CAB11714); Um, U. maydis (KIS68154); Mo, M. oryzae (ELQ45022); Cc, C. cinerea (XP_001828599); HsSEPT2, H. sapiens SEPT2 (AAH33559); HsSEPT9, H. sapiens SEPT9 (AAH54004).
Figure 5
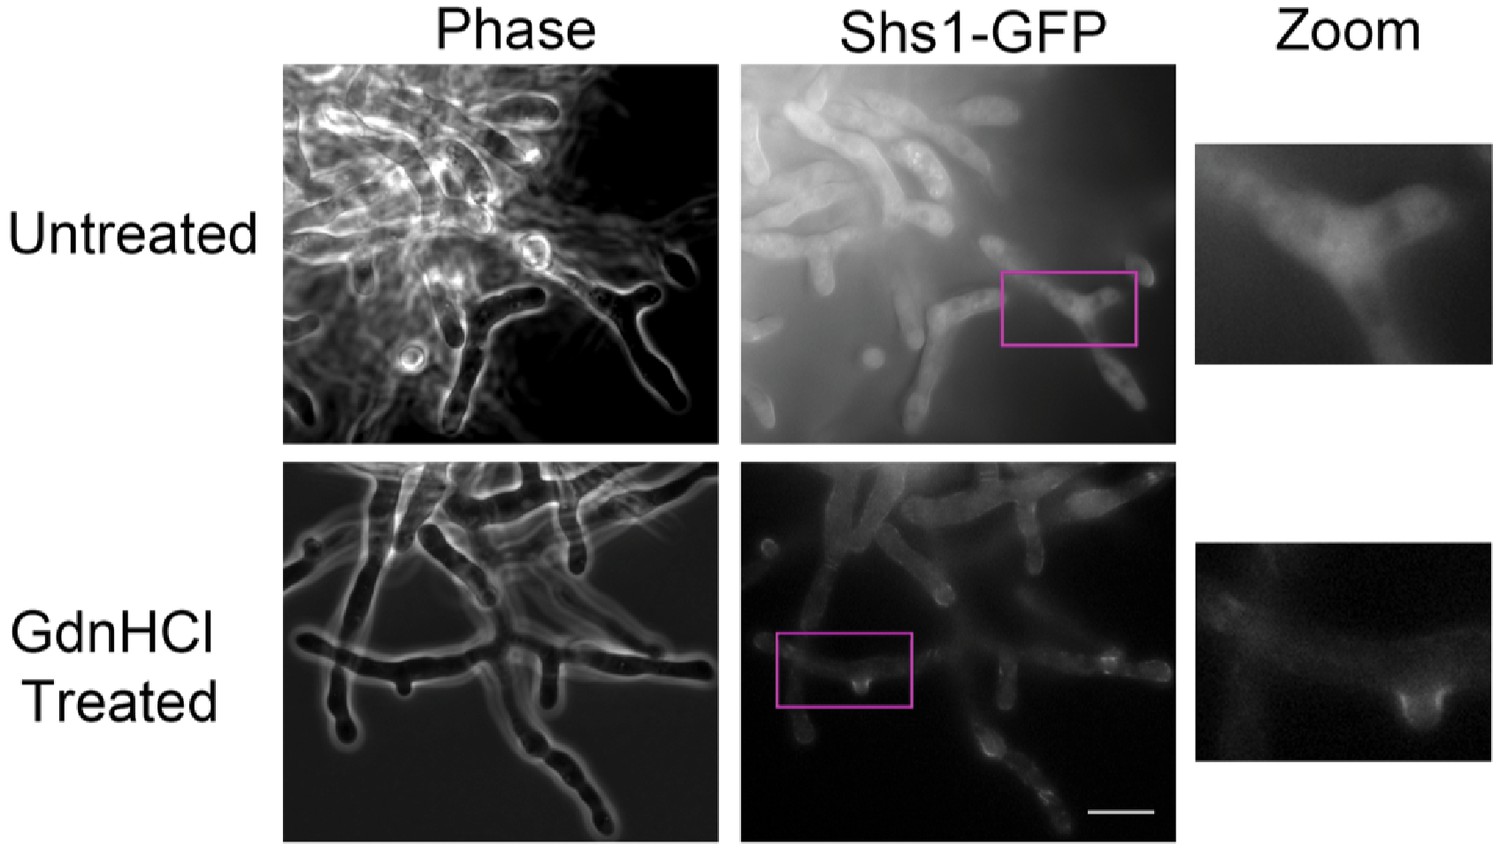
GdnHCl rescues cdc10∆ in A. gossypii.
AgSHS1-GFP Agcdc10∆ strain AG135 was grown with shaking for 15 hr at 37°C in complete (AFM) medium, after which the culture was split in two and GdnHCl was added to one aliquot to 30 mM final concentration. Cells were imaged after an additional 3 hr growth with shaking. Purple rectangles indicate the approximate region enlarged at right (‘Zoom’). Scale bar, 10 μm.
Figure 6
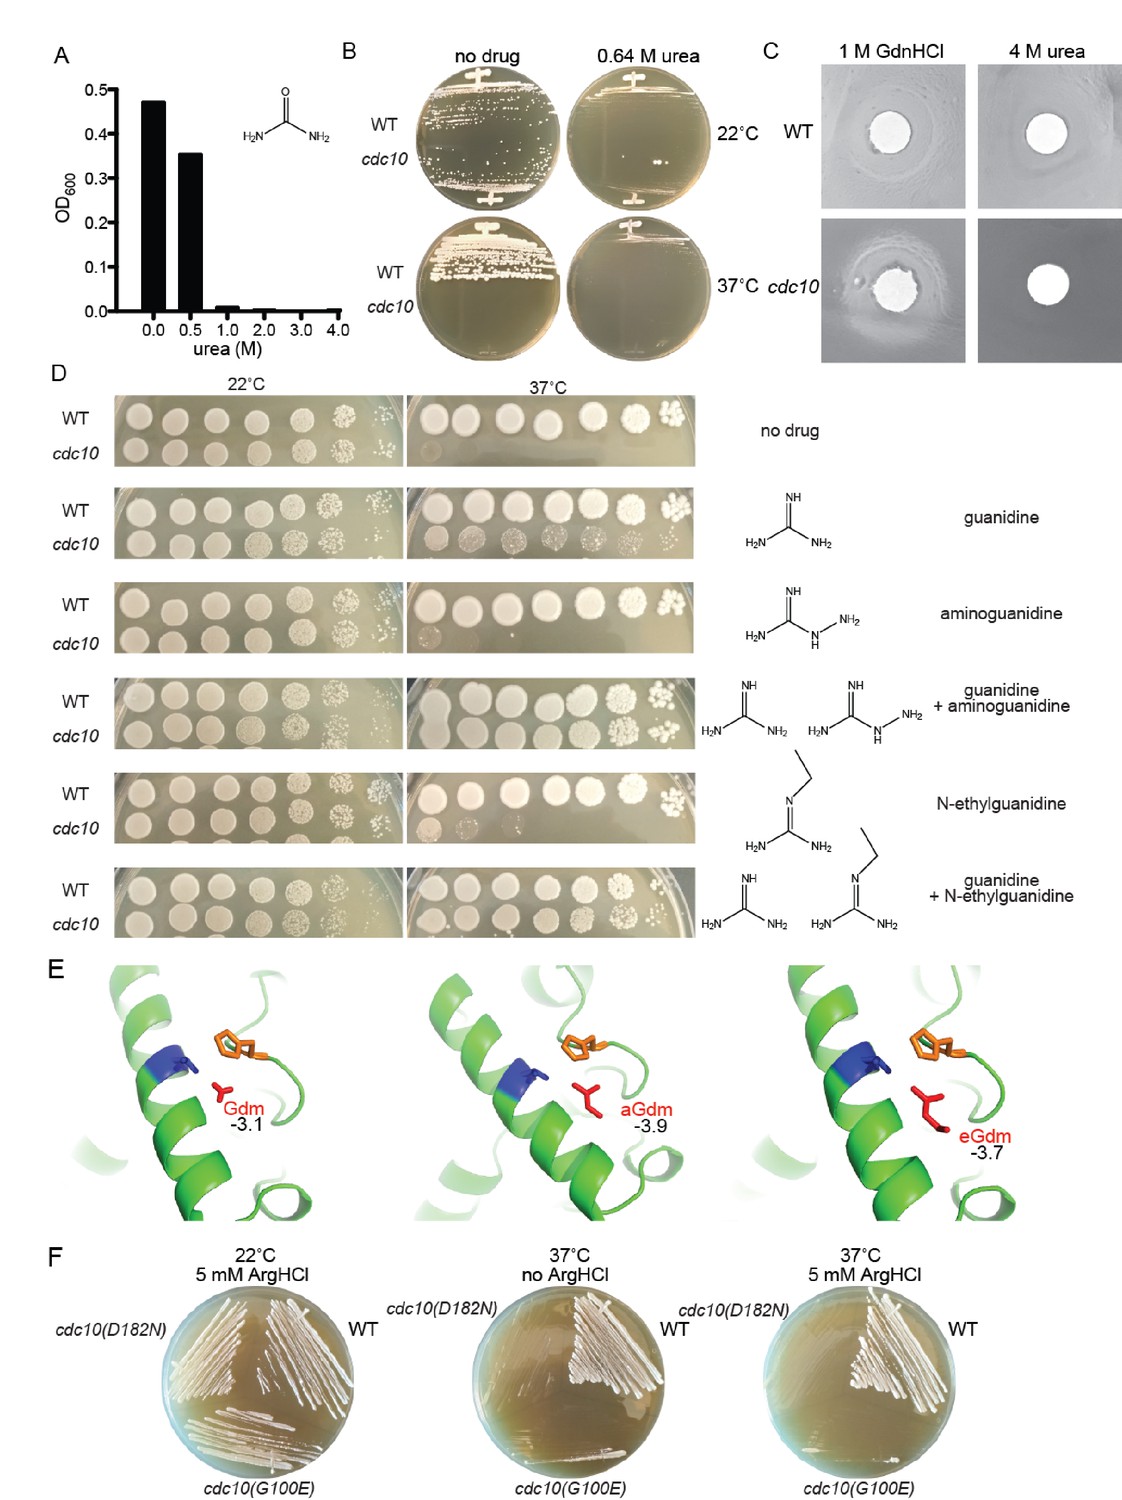
Partial rescue of TS defects by GdnHCl derivatives.
(A) WT strain BY4741 was cultured overnight in rich (YPD) medium containing the indicated concentrations of urea, and the density of each culture was determined with a spectrophotometer. (B) BY4741 (‘WT’) or the cdc10(D182N) strain CBY06417 (‘cdc10’) were streaked on plates containing no or 0.64 M urea and incubated at the indicated temperature for 3 days before imaging. (C) Cells from saturated YPD cultures of strains used in (A) were plated to form a monolayer on the surface of a rich (YPD) agar plate, and a 1-cm-diameter filter disk spotted with 5 µL of the indicated drug was placed in the center of the plate. The plate was imaged after incubation at 37°C for 3 days. (D) As in Figure 1A, for strains of the indicated genotypes grown on medium containing 0 or 0.375 mM of each indicated drug. (E) As in Figure 4A, but zoomed into the area between Thr302 and His262, and including the Gdm derivatives aminoguanidine (‘aGdm’) and N-ethylguanidine (‘eGdm’). (F) As in (B), but with the addition of strain CBY06420 (‘cdc10(G100E)') and with arginine hydrochloride instead of urea.
Figure 7
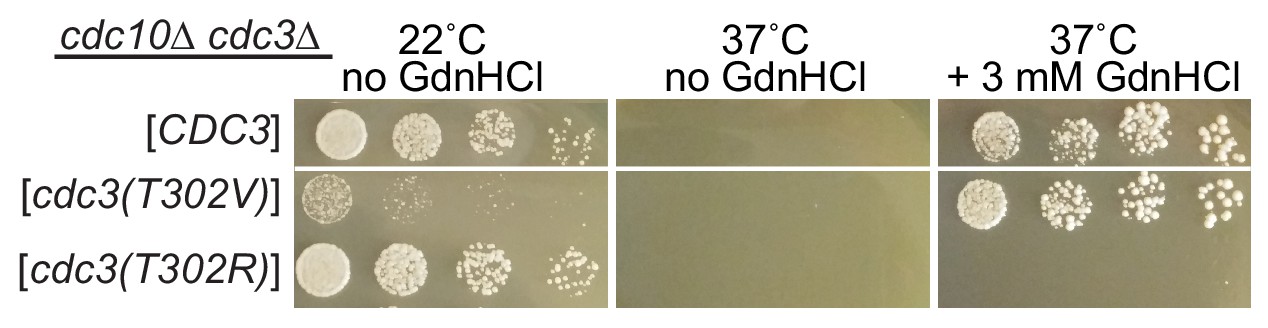
Arg at position 302 in Cdc3 blocks rescue of cdc10 by GdnHCl.
As in Figure 2D, strain JTY5104 was transformed with a plasmid encoding GFP-tagged Cdc3 (pML109) or derivatives in which the residue at position 302 was mutated from Thr to Val or Arg, followed by selection for loss of the plasmids encoding wild-type Cdc3 and Cdc10. Serial dilutions of the resulting strains were spotted on rich (YPD) medium at the indicated temperatures and containing GdnHCl where indicated, and imaged after 3 days.
Figure 8 with 2 supplements
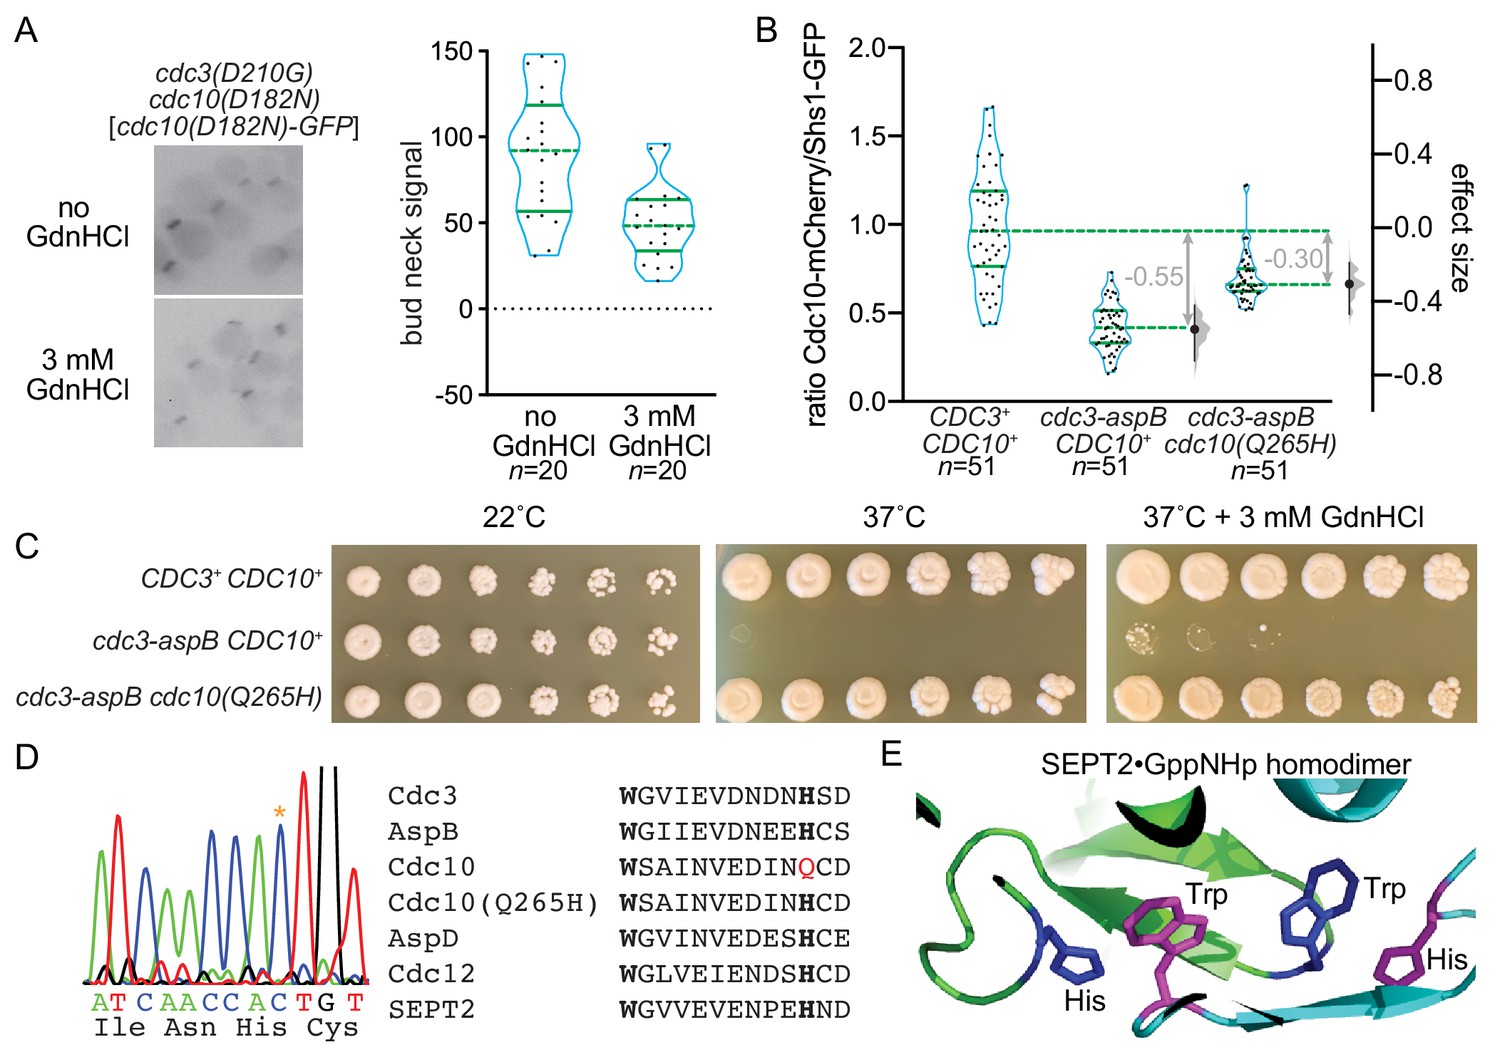
Reversing evolution to reactivate Cdc3 GTPase activity allows Cdc10 bypass during septin hetero-oligomerization.
(A) Strain MMY0130, which carries the mutations cdc3(D210G) cdc10(D182N), was transformed with plasmid YCpK-Cdc10-1-GFP and cultured in rich (YPD) medium containing G-418 for plasmid selection in the presence or absence of GdnHCl. Bud neck fluorescence was measured as in Figure 2B. (B) Haploid strains of the indicated genotypes expressing Cdc10-mCherry and Shs1-GFP were imaged as in (A) but in the absence of GdnHCl and for both mCherry and GFP fluorescence. For each cell, the ratio of mCherry to GFP signal was calculated; values are plotted on the left axis, with overlaid blue violin plots to show how the data are distributed, and median (dashed lines) and quartiles (solid lines) shown in green. The right axis shows the median difference (‘effect size’) for comparisons of the mutant strains against the shared wild-type control, plotted as bootstrap sampling distributions (gray violin plots). Each median difference is depicted as a block dot, with the value of that difference given in gray. Each 95% confidence interval is indicated by the ends of the vertical error bars. Strains were: MMY0342, MMY0343, and MMY0350. Protein sequence differences between the versions of Cdc3 present in these strains are detailed in Figure 8—figure supplement 1. Effects of specific individual substitutions on Cdc10-mCherry incorporation are shown in Figure 8—figure supplement 2. (C) Serial dilutions of the strains in (B) were spotted on rich (YPD) agar media with or without GdnHCl and incubated for 4 days at the indicated temperatures. (D) A portion of the CDC10 coding sequence was amplified by PCR and sequenced. Asterisk in the chromatograph at left shows the mutation resulting in the amino acid change Q265H. Right, alignment of septin sequences surrounding the conserved Trp (bold) of the Sep4 motif and the His (bold) with which this Trp interacts across the G interface in the SEPT2 homodimer, as illustrated in (E). Red, Gln265 in wild-type Cdc10. (E) The Trp and His residues of the Sep4 motif in the SEPT2•GppNHp homodimer crystal structure (PDB 3FTQ).
-
Figure 8—source data 1
Cdc10(D182N)-GFP septin ring intensity values for Figure 8A.
- https://cdn.elifesciences.org/articles/54355/elife-54355-fig8-data1-v2.xlsx
-
Figure 8—source data 2
Cdc10-mCherry/Shs1-GFP ratios for Figure 8B.
- https://cdn.elifesciences.org/articles/54355/elife-54355-fig8-data2-v2.xlsx
Figure 8—figure supplement 1
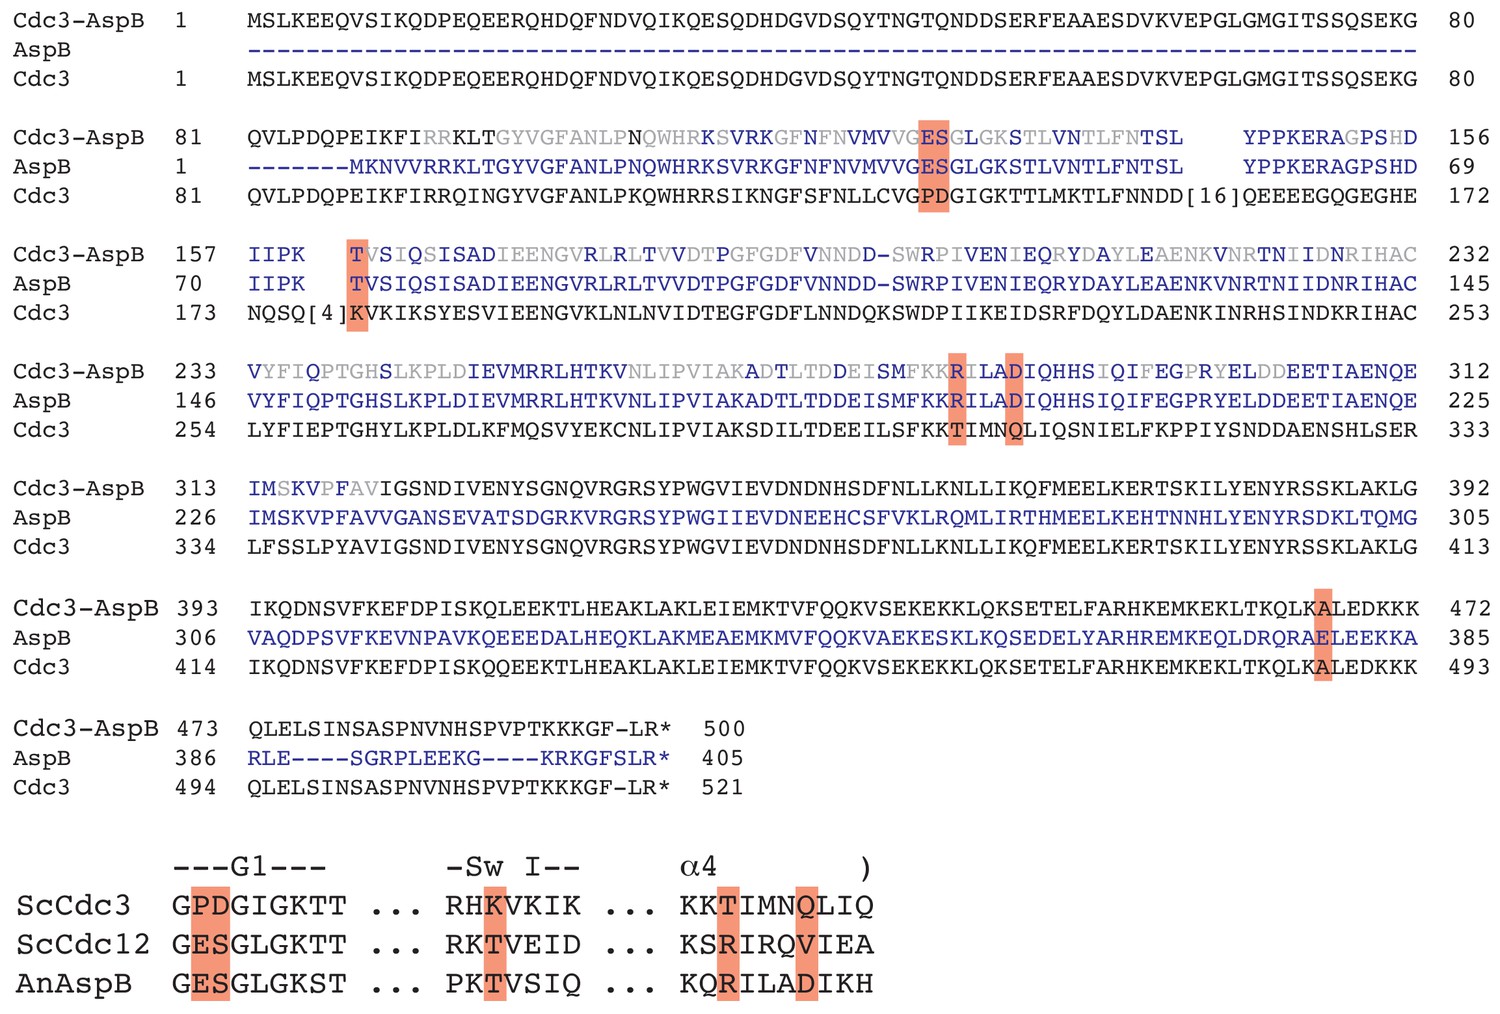
Sequence of the Cdc3-AspB chimeric protein and comparison of key residues between Cdc3, AspB, and Cdc12.
Alignments of S. cerevisiae Cdc3 with Aspergillus nidulans AspB and the Cdc3-AspB chimera (above), and with S. cerevisiae Cdc12 and A. nidulans AspB (below). Red highlighting indicates positions that covary with the catalytic Thr in Cdc3 homologs, as in Figure 4—figure supplement 1B.
Figure 8—figure supplement 2
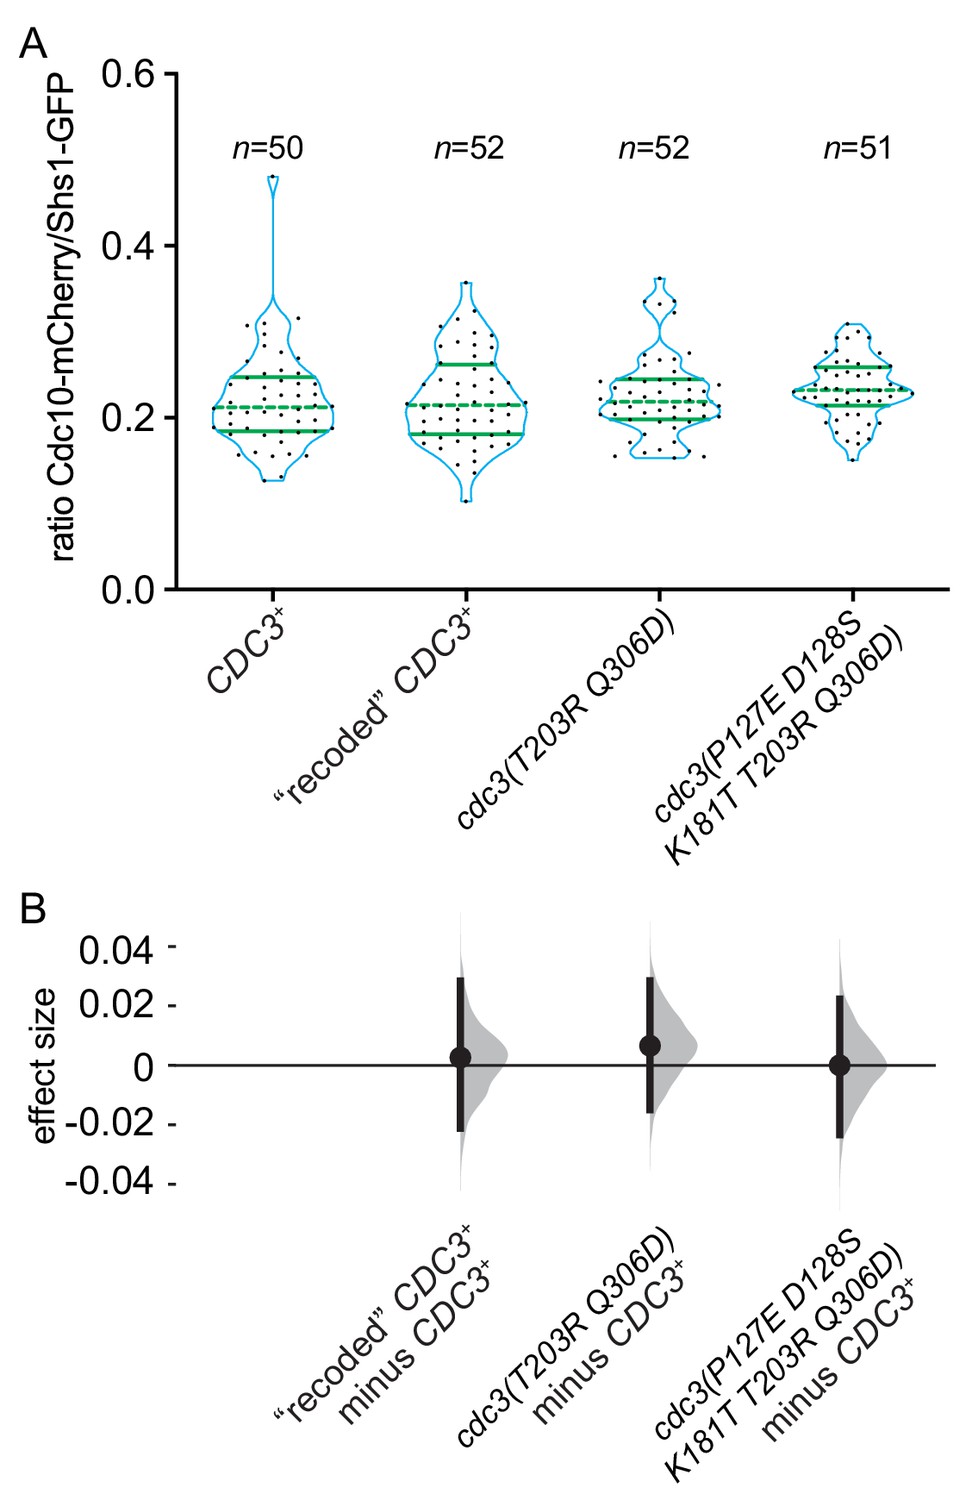
Five substitutions in the GTPase domain of Cdc3 are insufficient to promote bypass of Cdc10 during septin assembly.
Strains of the indicated genotypes (JTY5397, MMY0361, MMY0362 and MMY0363) were grown to mid-logarithmic phase in liquid rich (YPD) medium and levels of Shs1-GFP and Cdc10-mCherry within septin rings were measured as in Figure 8B and plotted in (A) with effect size (median difference) distributions plotted in (B).
-
Figure 8—figure supplement 2—source data 1
Cdc10-mCherry/Shs1-GFP ratios for Figure 8—figure supplement 2.
- https://cdn.elifesciences.org/articles/54355/elife-54355-fig8-figsupp2-data1-v2.xlsx
Figure 9 with 1 supplement
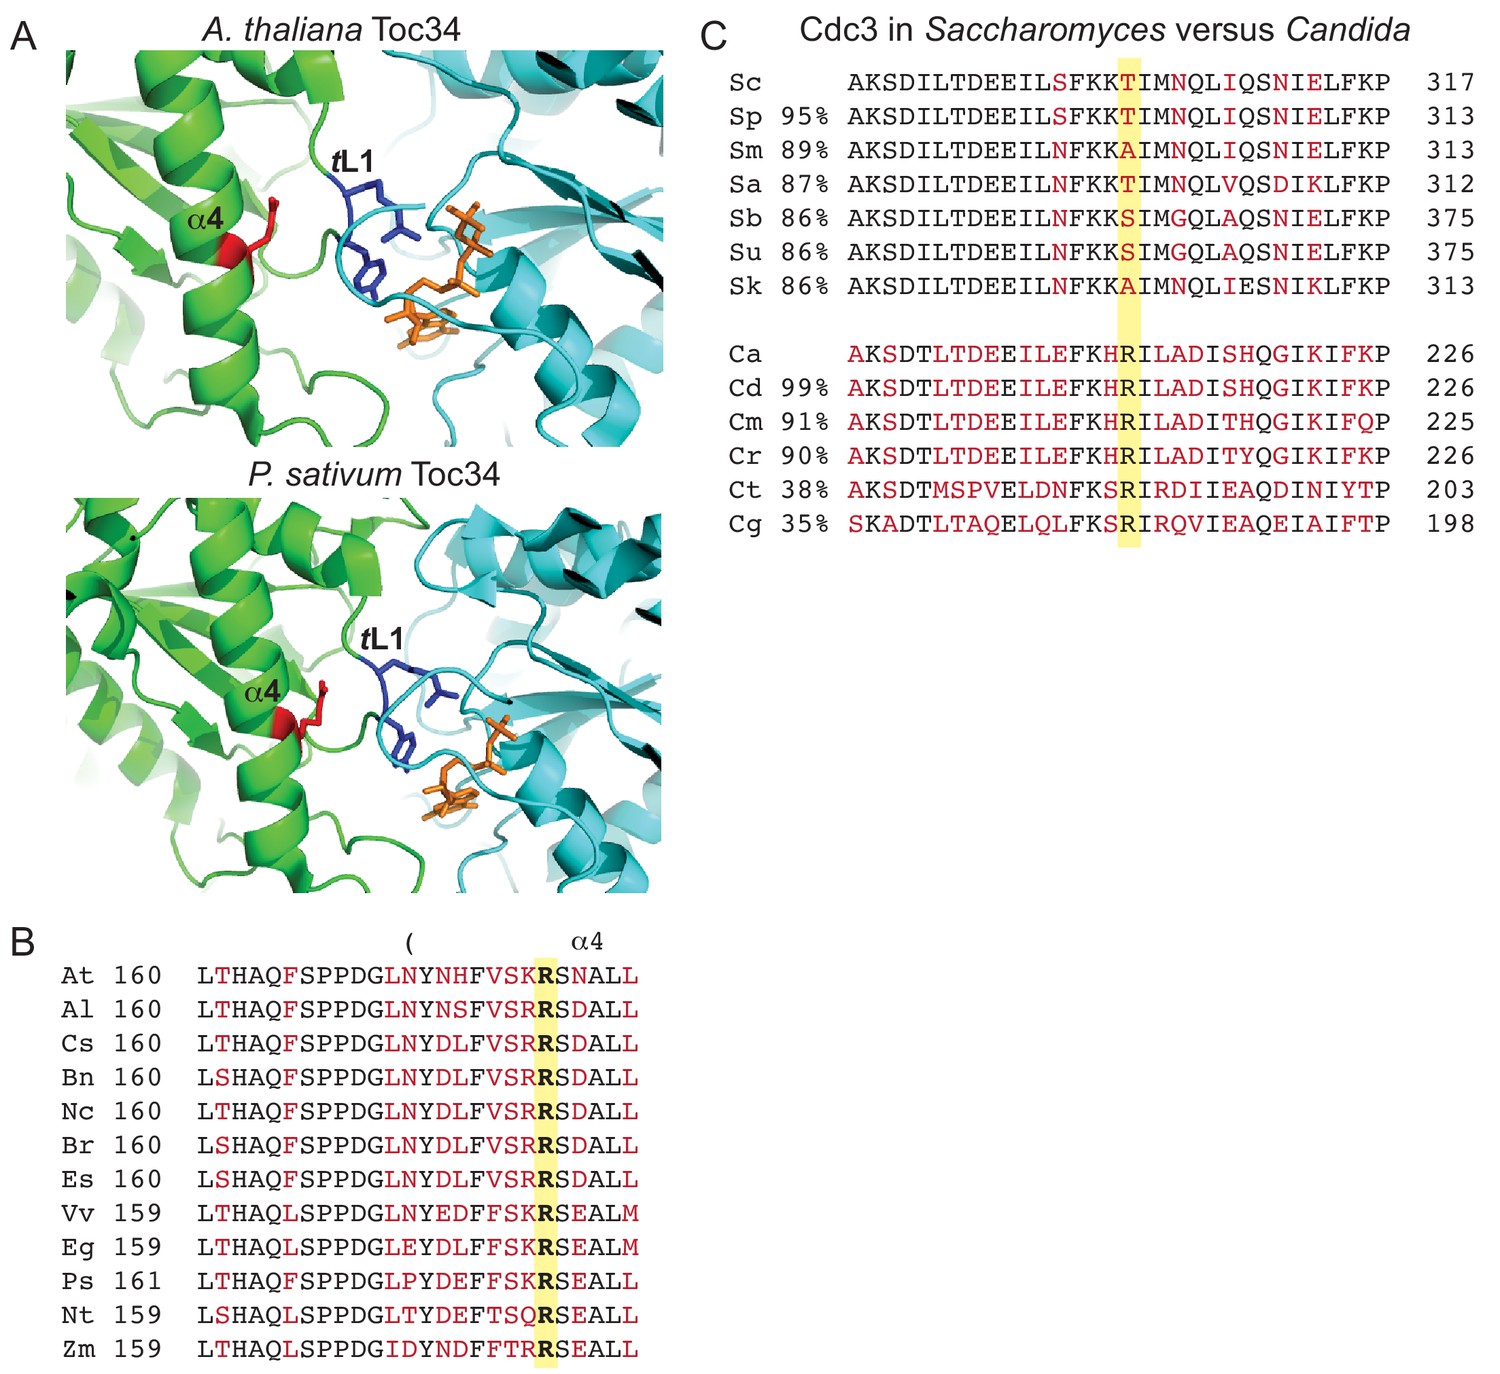
Conservation of contacts between α4 Arg and trans loop 1 in the distant septin relative Toc34 and among Candida species, and drift at the α4 Arg position in Saccharomyces species.
(A) Structures of homodimer interface of Toc34 from Arabidopsis thalianai (GppNHp-bound, PDB 3bb3, top) and Pisum sativum (GDP-bound, PDB 1h65, bottom) with nucleotide in orange, α4 Arg in red and nucleotide-contacting trans loop 1 (‘TL1’) residues in blue. (B) Sequence alignment of a region in and around the α4 helix of Toc34 homologs in various plant species, with identical and variable amino acids in black and red, respectively, and the α4 Arg in bold. A. thaliania, At (NP_196119); A. lyrata, Al (XP_002873181); Camelina sativa, Cs (XP_010423506); Brassica napus, Bn (CDX98810); Noccaea caerulescens, Nc (JAU73517); B. rapa, Br (XP_009130855); Eutrema salsugineum, Es (XP_006398957); Vitis vinifera, Vv (XP_002274573); Eucalyptus grandis, Eg (XP_010063039); P. sativum, Ps (Q41009); Nicotiana tabacum, Nt (XP_016456518); Zea mays, Zm (ACG34570). (C) Sequence alignments of a region surrounding ScCdc3 Thr302 (highlighted in yellow), with identical and variable amino acids in black and red, respectively. Percent sequence identity over the entirety of Cdc3, relative to ScCdc3 or CaCdc3, is given at left. Alignments of Saccharomyces species were performed using the Saccharomyces Genome Database (http://www.yeastgenome.org). Sc, S. cerevisiae; Sp, S. paradoxus; Sm, S. mikatae; Sa, S. aboricola; Sb, S. bayanus; Su, S. uvarum; Sk, S. kudriavzevii. Candida alignments were performed at the NCBI Blast server. Ca, C. albicans (EEQ42751); Cd, C. dubliniensis (CAX44656); Cm, C. maltosa (EMG46918); Cr, C. tropicalis (XP_002550438); Ct, C. tenuis (EGV60285); Cg, C. glabrata (CAG57768). Figure 9—figure supplement 1 presents a speculative model for how the position corresponding to ScCdc3 Thr302 and other relevant molecular features may have changed during septin evolution.
Figure 9—figure supplement 1
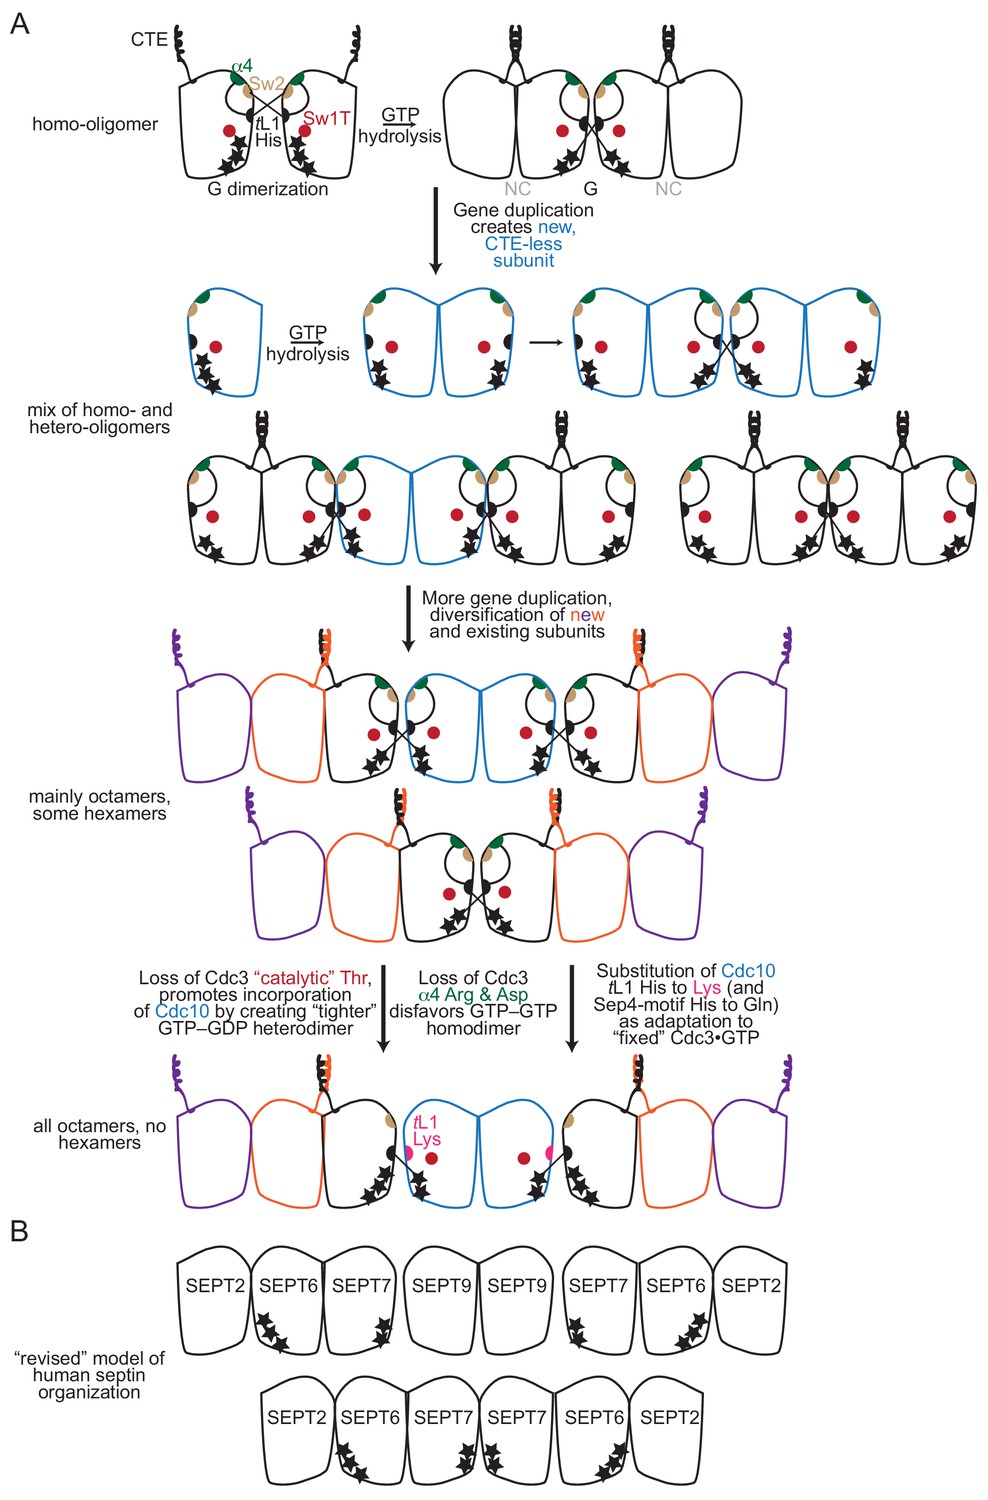
Model for the roles of key molecular features during the evolution of septin complexes.
(A) A model of the evolution of septin hetero-octamers in S. cerevisiae from an ancestral homo-oligomer. Stars indicate the number of phosphate groups on bound nucleotide. Abbreviations: ‘CTE’, carboxy-terminal extension; ‘α4’, Arg and Asp residues of the α4 helix; ‘Sw2’, Switch II region; ‘tL1’, trans loop 1’. (B) Illustration of the ‘revised’ order of septin subunits in human hetero-octamers and hetero-hexamers, including the predicted phosphorylation state of bound nucleotides, as indicated by the number of black stars. SEPT9 is given as an example SEPT3-group subunit.
Tables
Table 1
Residues in close proximity to the positions corresponding to ScCdc3 Thr302 or His262 for other septins with solved crystal structures.
| PDB entry, Septin•nucleotide (oligomeric state) | Residues within 5 Å (capitalized) of position corresponding to ScCdc3 Thr302* | Residues within 5 Å (capitalized) of His corresponding to ScCdc3 His262 |
|---|---|---|
| 2QNR, HsSEPT2•GDP (G dimer) | trans loop 1 (pfgHGlkp) | α4 (reRLkkRildE) |
| 2QA5, HsSEPT2•GDP (G dimer) | trans loop 1 (pfgHglkp) | α4 (rerLkkRilde) |
| 3FTQ, HsSEPT2•GppNHp (G dimer) | trans loop 1 (pfgHGlkp) | α4 (rerLkkRildE), Switch I (kieRtvq)†, Switch II (dtpgygDain)† |
| 4Z51, HsSEPT3•GppNHp (monomer) | trans loop 1 (ptGHSlrp) | α4 (kseFkqRvrkE) |
| 3SOP, HsSEPT3•GDP (G dimer) | trans loop 1 (ptGHSlrp) | α4 (kseFkqRvrke),, P-loop (gqSGlgk)†, Switch I (vIPKtve)† |
| 4Z54, HsSEPT3•GDP (G dimer) | trans loop 1 (ptGHSlrp) | α4 (kseFkqRvrkE), P-loop (gqSGlgk)†, Switch I (eeKIPKtve)† |
| 3T5D, HsSEPT7•GDP (G dimer) | trans loop 1 (psgHGlkp) | α4 (qqFkkQim), P-loop (geSGlgk)† |
| 3TW4, HsSEPT7•GDP (G dimer) | trans loop 1 (psgHGLkp) | α4 (qqFkkQim), P-loop (geSGlgk)† |
| 5CYO, HsSEPT9•GDP (G dimer) | trans loop 1 (atGHSlrp) | α4 (rvhFkqRItad), P-loop (gqSGlgk)†, Switch I (eeRIPKtie)† |
| 5CYP, HsSEPT9•GTPγS (G dimer) | trans loop 1 (atgHSLrp) | α4 (rvhFkqRItad), P-loop (gqsGlgk)†, Switch I (eeRIPKtie)† |
| 4KV9, SmSEPT10•GDP (G dimer) | trans loop 1 (ptGHSlks) | α4 (lqkFkaRilse), P-loop (geTGigk)† |
| 4KVA, SmSEPT10•GTP (G dimer) | trans loop 1 (ptGHSlks) | α4 (lqkFkaRilse), P-loop (geTgigk)† |
| 5AR1, ScCdc11•empty (quasi-G dimer)‡ | trans loop 1 (ptgHGlke) | α4 (lklnkkLimeD) |
-
*Residues at positions corresponding to ScCdc3 Thr302 were identified based on structure-guided alignments. SEPT2, Arg198; SEPT3, Arg224; SEPT7, Gln210; SEPT9, Arg442; SEPT10, Arg199; Cdc11, Leu187.
†Residues from the other protomer across the G interface.
-
‡Dimer in solution is mediated by the C-terminal extension, and is unaffected by G interface mutations, thus contacts across the G interface are presumably crystal-induced.
Table 2
Co-variation among fungal species of the “catalytic Thr” in Cdc3 homologs and His in the Cdc10 trans loop 1.
| Species | Amino acid at position corresponding to ScCdc3 Lys181 | Amino acid at position corresponding to ScCdc10 Lys155 | Amino acid at position corresponding to ScCdc10 Gln265 |
|---|---|---|---|
| S. cerevisiae | Lys | Lys | Gln |
| A. gossypii | Lys | Lys | Gln |
| K. lactis | Lys | Lys | Gln |
| C. albicans | Ser | Gln | Gln |
| A. nidulans | Thr | His | His |
| C. cinerea | Thr | His | His |
| U. maydis | Thr | His | His |
| N. crassa | Thr | His | His |
| M. oryzae | Thr | His | His |
| F. graminearum | Thr | His | His |
| C. neoformans | Thr | His | His |
| S. pombe | Thr | His | His |
Additional files
-
Supplementary file 1
Key resources table.
- https://cdn.elifesciences.org/articles/54355/elife-54355-supp1-v2.docx
-
Transparent reporting form
- https://cdn.elifesciences.org/articles/54355/elife-54355-transrepform-v2.pdf
Download links
A two-part list of links to download the article, or parts of the article, in various formats.
Downloads (link to download the article as PDF)
Open citations (links to open the citations from this article in various online reference manager services)
Cite this article (links to download the citations from this article in formats compatible with various reference manager tools)
Guanidine hydrochloride reactivates an ancient septin hetero-oligomer assembly pathway in budding yeast
eLife 9:e54355.
https://doi.org/10.7554/eLife.54355


