Identifying the immune interactions underlying HLA class I disease associations
- Department of Infectious Disease, Imperial College London, United Kingdom
- Cambridge Institute for Therapeutic Immunology and Infectious Disease, University of Cambridge, United Kingdom
- Johns Hopkins University, United States
- Faculty of Medicine, University of Southampton, United Kingdom
- Rho, Chapel Hill, United States
- Division of Cancer Epidemiology and Genetics, National Cancer Institute, United States
Figures
Figure 1
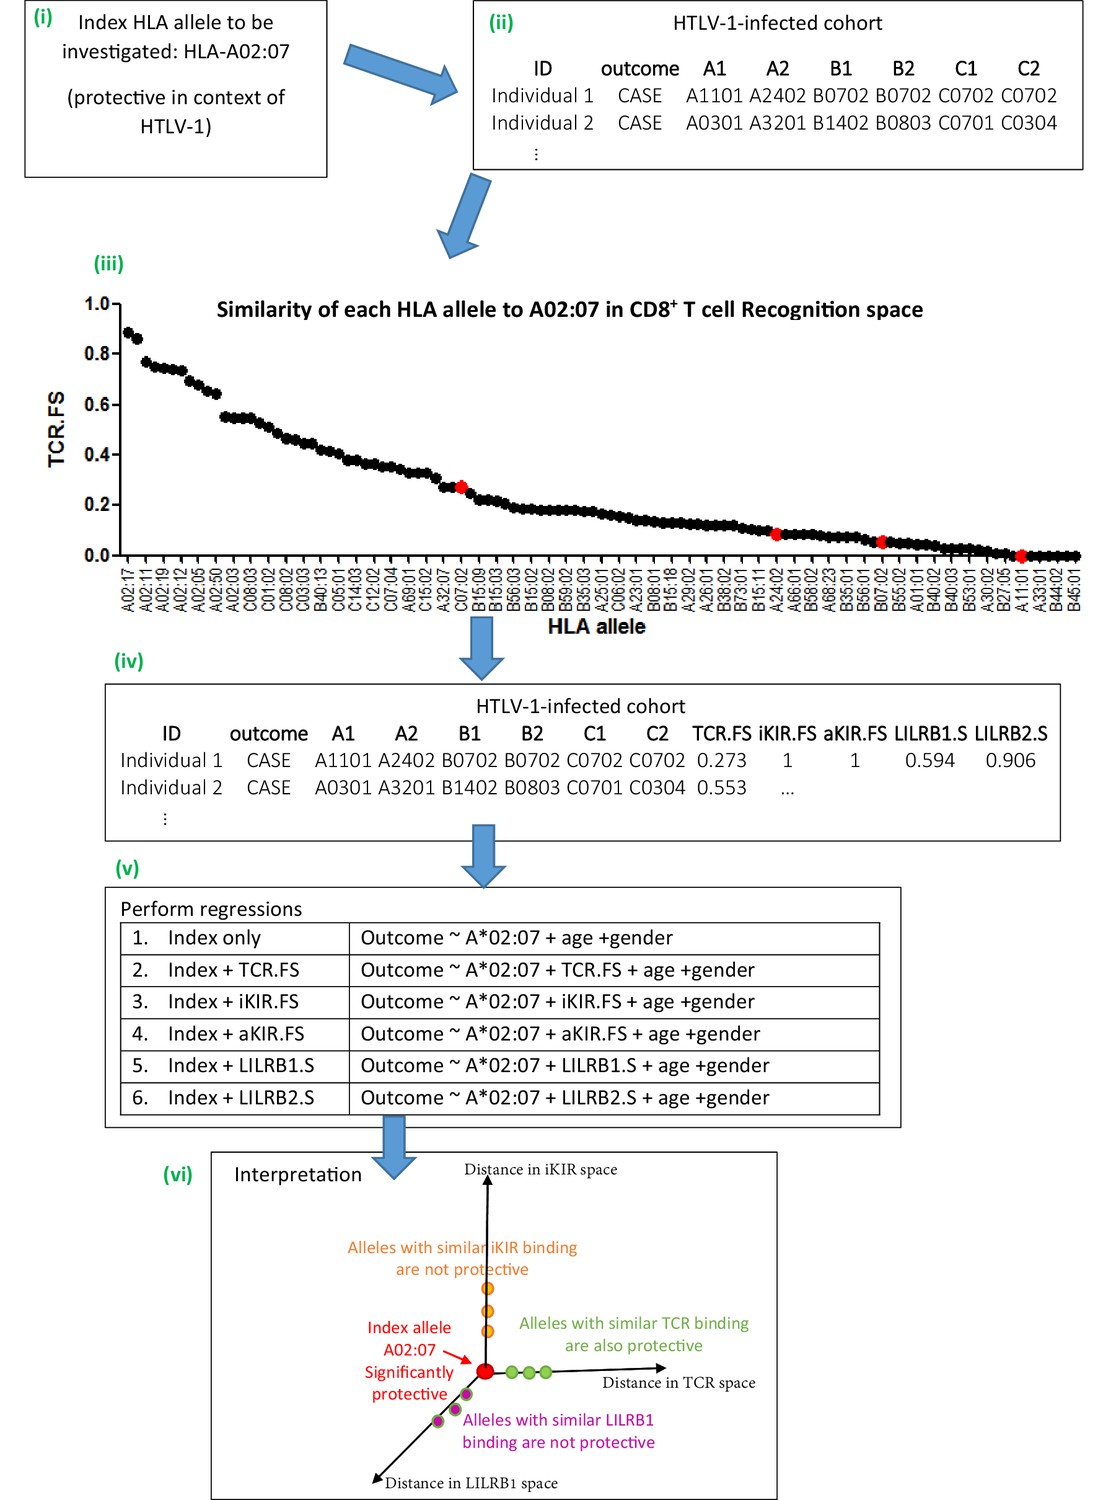
Schematic of method.
An overview of the method using the example given in Appendix 1 Supplementary Methods ‘Worked example of the Fraction Shared’. More details can be found in the Materials and methods and Appendix 1 Supplementary Methods. (i) Consider the example of investigating the mechanism underlying the association between HLA-A*02:07 and reduced risk of disease (HAM/TSP) in the context of HTLV-1 infection. (ii) Take the HTLV-I cohort and for each individual calculate their nearness to A*02:07 in ‘CD8 T cell recognition space’ (i.e. calculate TCR.FS). (iii) The graph shows the similarity to A*02:07 (TCR.FS) for each HLA allele in the cohort ranked from most similar on the left to least similar on the right. Individual 1 is homozygous at both their HLA-B and HLA-C loci so they have 4 unique alleles (A*11:01, A*24:02, B*07:02, C*07:02). We calculate the similarity of A*02:07 to each of these HLA alleles, they are marked on the graph as red dots. The most similar allele to A*02:07 in terms of CD8 recognition carried by individual 1 is C*07:02 with a TCR.FS = 0.273. Individual 1 thus has a TCR.FS with A*02:07 of 0.273. (iv) This is repeated for all individuals in the cohort and all 5 metrics and the cohort table completed. The table relates only to nearness to A*02:07 for the HTLV-1 proteome, for another index allele (or another proteome) the process will need to be repeated to complete the table (v) multiple regression is then performed on the cohort. Each metric is included in turn as a predictor variable. To investigate the independence or relative importance of different predictors they should be included in the regression model together (vi) Results of the regression are then interpreted. In this case the index A*02:07 is protective; other HLA class I alleles with similar TCR-HLA:peptide binding to the index allele are also protective that is, TCR.FS is a significant (protective) predictor of outcome; whereas HLA class I alleles with similar iKIR-HLA:peptide and LILRB1-HLA binding show no protective associations. Only three dimensions are sketched; similarity in aKIR and LILRB2 binding-space are also computed (and near alleles were not protective). We conclude that A*02:07-associated protection is most likely to be attributable to its TCR binding properties.
-
Figure 1—source data 1
Data underlying Figure 1.
- https://cdn.elifesciences.org/articles/54558/elife-54558-fig1-data1-v2.csv
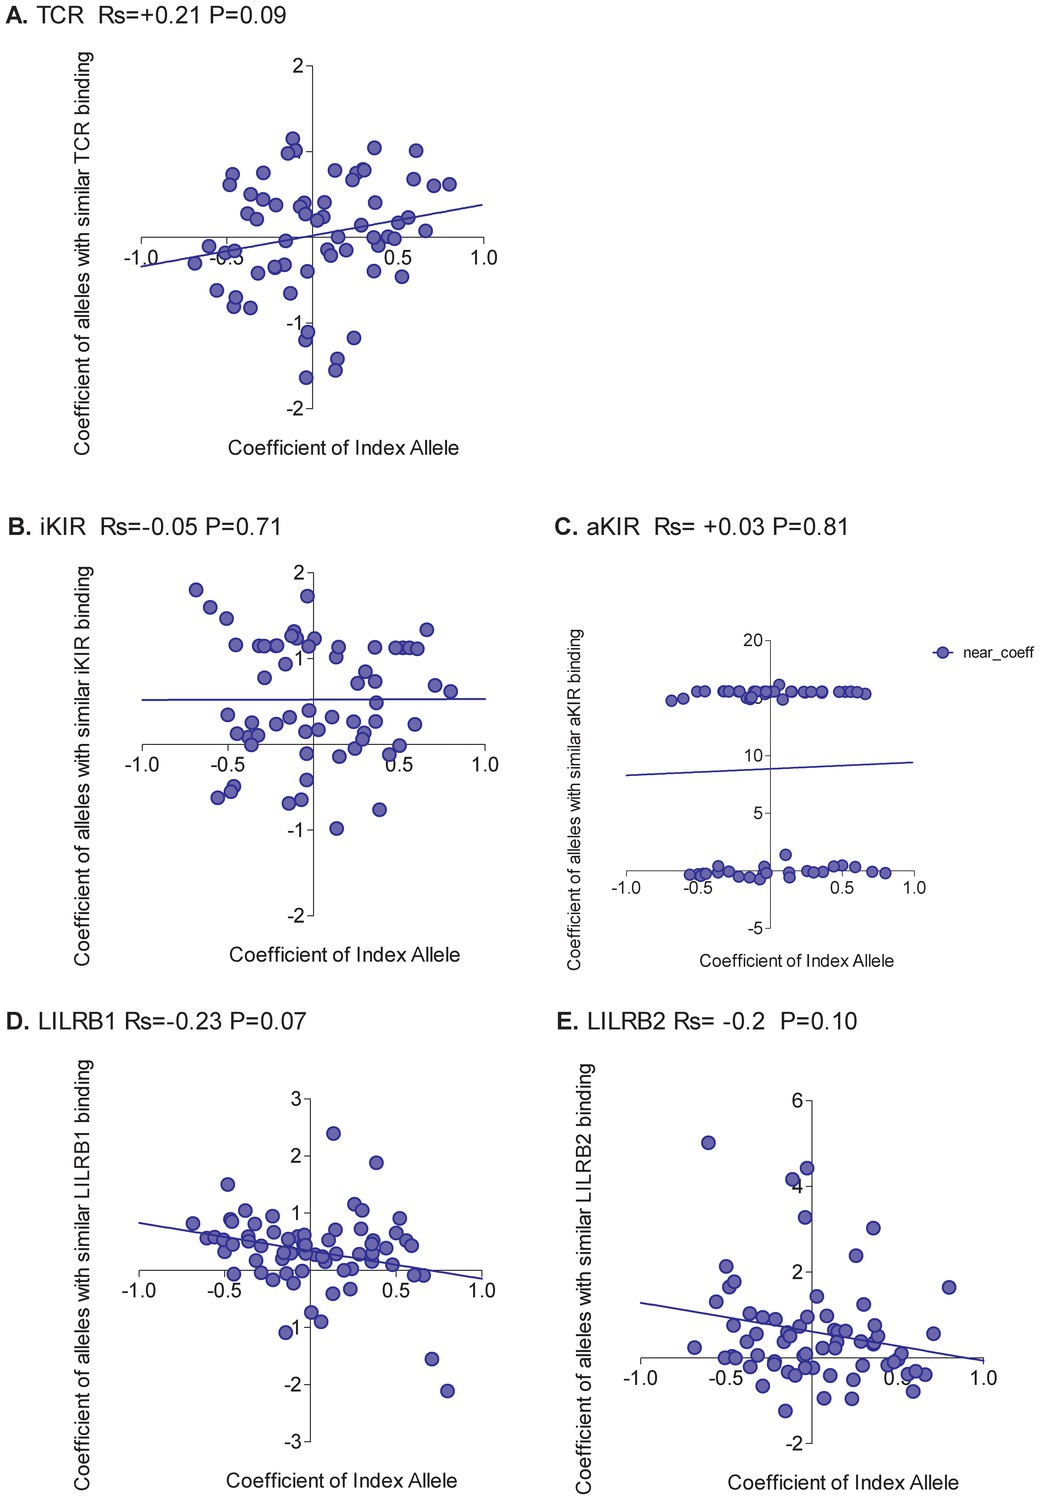
Figure 2

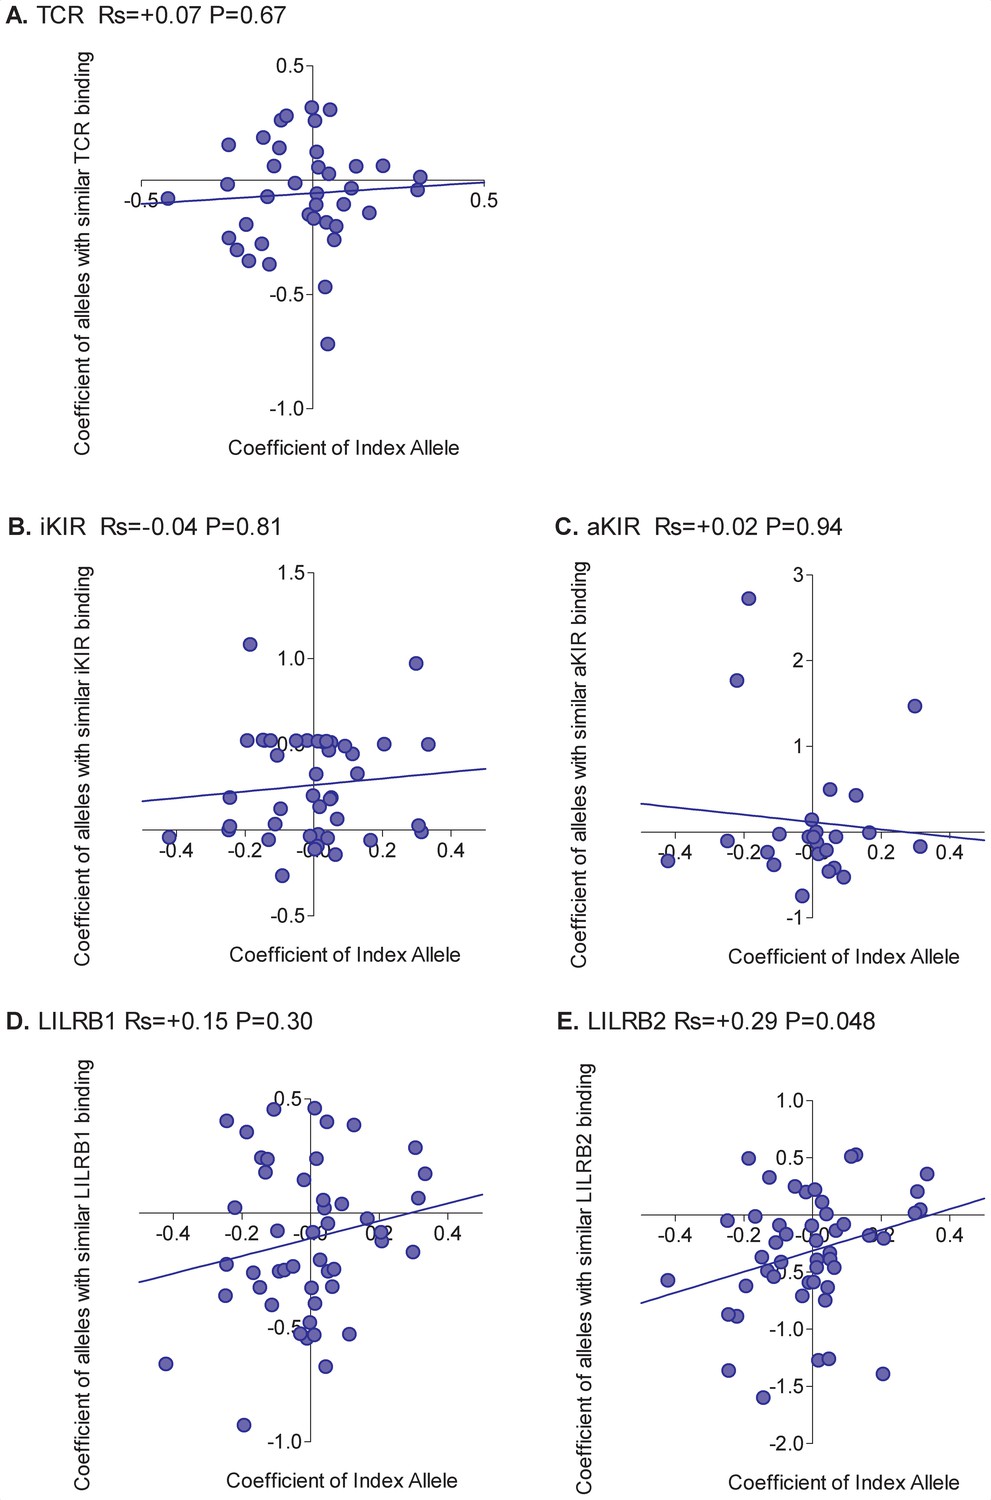
Correlation between the risk of HAM/TSP associated with an allele and the risk associated with similar alleles.
The risk of HAM/TSP associated with an HLA class I allele (“Coefficient of Index Allele, x axis) was compared with the coefficient of HLA class I alleles with (A) similar TCR binding, (B) similar iKIR binding, (C) similar activating KIR binding, (D) similar LILRB1 binding and (E) similar LILRB2 binding. All alleles in the cohort of a sufficient frequency (N > 15) and with sufficient near alleles (N > 15 with 50% or more similarity) were considered. The Spearman correlation coefficient (Rs) and corresponding P value are reported in the title bar for each plot. There is a very striking positive correlation for TCR binding, i.e. the risk of HAM/TSP associated with an allele is strongly correlated with the risk associated with other alleles that share similar TCR binding properties. No such correlation was observed for any of the other metrics.
-
Figure 2—source data 1
Data underlying Figure 2A.
- https://cdn.elifesciences.org/articles/54558/elife-54558-fig2-data1-v2.csv
-
Figure 2—source data 2
Data underlying Figure 2B.
- https://cdn.elifesciences.org/articles/54558/elife-54558-fig2-data2-v2.csv
-
Figure 2—source data 3
Data underlying Figure 2C.
- https://cdn.elifesciences.org/articles/54558/elife-54558-fig2-data3-v2.csv
-
Figure 2—source data 4
Data underlying Figure 2D.
- https://cdn.elifesciences.org/articles/54558/elife-54558-fig2-data4-v2.csv
-
Figure 2—source data 5
Data underlying Figure 2E.
- https://cdn.elifesciences.org/articles/54558/elife-54558-fig2-data5-v2.csv
Figure 3
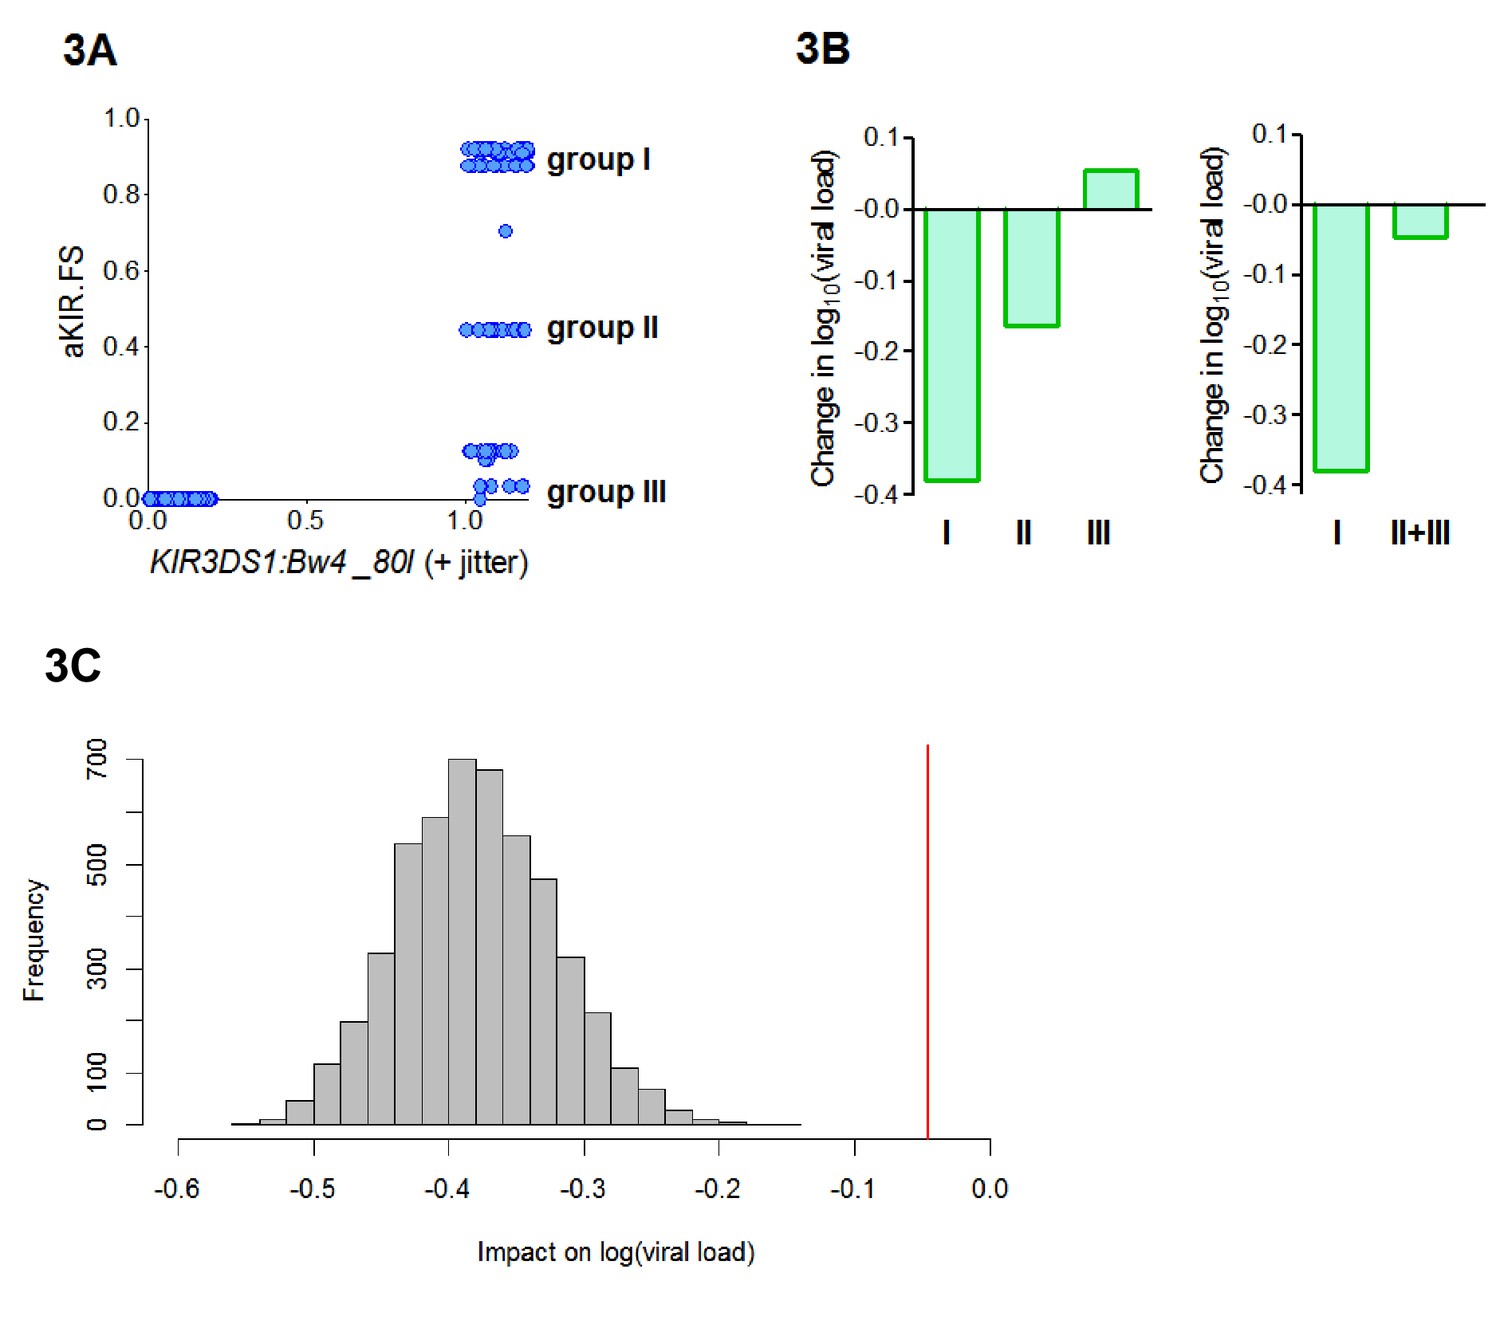
aKIR. FS reveals subtleties within the KIR3DS1:Bw4-80I grouping.
When considering alleles with similar activating KIR binding properties to HLA-B*57 we found that the fraction shared (aKIR.FS) was more informative than the traditional KIR3DS1:Bw4-80I compound genotype grouping. (A) On plotting individuals’ KIR3DS1:Bw4-80I content against their aKIR fraction shared it can be seen that whilst KIR3DS1:Bw4-80I is a simple binary 1 or 0 (people either have the compound genotype or they do not), aKIR.FS has more subtlety and people with KIR3DS1 and Bw4-80I can be segregated into three distinct groups (labelled group I, group II and group III in panel A). These three groupings have different impacts on viral load (i.e. different coefficients in the multivariate regression; B, left hand plot) and only group I is actually significantly protective (Coeff = −0.4 p=0.007 **) although all three groupings have identical KIR3DS1:Bw4-80I status. Group I is larger (N = 47 individuals) than group II (N = 19) or group III (N = 20). To check that lack of significance in group II and group III was not simply due to cohort size we pooled group II and group III (B) right hand plot), group II and III were still not significantly protective. Furthermore, when we downsampled the people in group I so that there were 39 people (i.e. exactly the same size as group II+group III) and calculated the impact on log[viral load] there was never an instance in 5000 runs when the estimated protective effect (decrease in log viral load) was as small as that seen in group II+III. This is illustrated in (C). The grey histogram is the distribution of coefficients seen upon repeated downsampling of group I and the vertical red line is the coefficient associated with group II+III. It can be seen that in 5000 runs the protective effect in the group I individuals far exceeds that in group II+III individuals despite (artificially) matched cohort size. Note in panel A jitter (a random number between 0 and 0.2) has been added to the KIR3DS1:Bw4-80I variable on the x axis since this number only takes value 0 or 1, plotting without jitter simply overlays the datapoints and information about the number of points in the clusters is obscured.
-
Figure 3—source data 1
Data underlying Figure 3A.
- https://cdn.elifesciences.org/articles/54558/elife-54558-fig3-data1-v2.csv
-
Figure 3—source data 2
Data underlying Figure 3B.
- https://cdn.elifesciences.org/articles/54558/elife-54558-fig3-data2-v2.csv
-
Figure 3—source data 3
Data underlying Figure 3C.
- https://cdn.elifesciences.org/articles/54558/elife-54558-fig3-data3-v2.csv
Appendix 4—figure 1
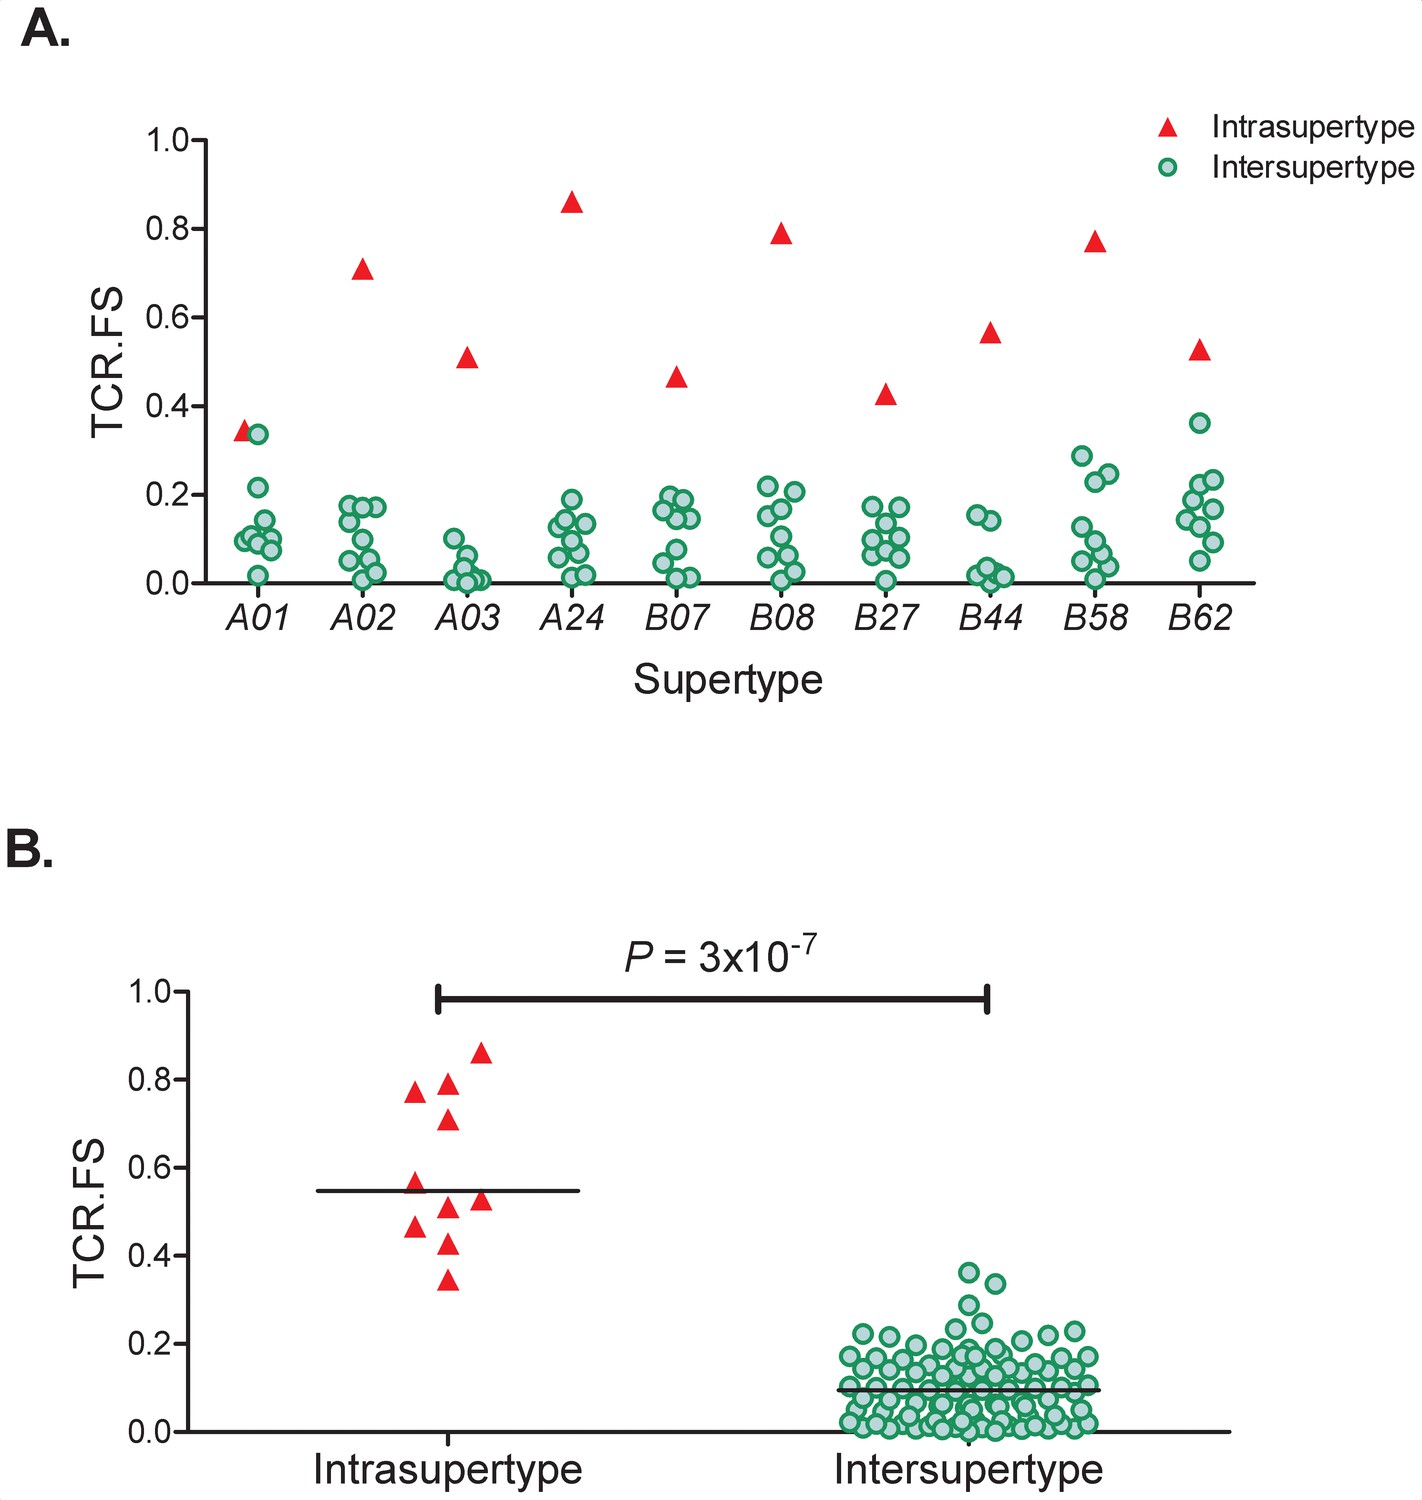
TCR. FS Intra-Supertype and Inter-Supertype.
(A) For each of the 10 supertypes (x axis) we calculated the similarity (median TCR.FS, y axis) to alleles within that supertype (red triangles) and to alleles within all other 9 supertypes (green circles). It can be seen that for every supertype the intra-supertype similarity is larger than all the inter-supertype similarities for that supertype. (B) Pooling the intra-supertype similarities and comparing them with pooled inter-supertype similarities we find that the intra-supertype similarities are significantly higher (p=3×10⁻⁷, Wilcoxon two tailed test), horizontal lines represent the medians of the two groups.
-
Appendix 4—figure 1—source data 1
Data underlying Appendix 4—figure 1A.
- https://cdn.elifesciences.org/articles/54558/elife-54558-app4-fig1-data1-v2.csv
-
Appendix 4—figure 1—source data 2
Data underlying Appendix 4—figure 1B.
- https://cdn.elifesciences.org/articles/54558/elife-54558-app4-fig1-data2-v2.csv
Appendix 4—figure 2

Is the rank order of ‘average’ HLA class I alleles robust?
For each cohort and each outcome measure (panels A-F) the cohort was split in half and the correlation between the protection/susceptibility for the average alleles was calculated using Pearson’s method; this process was repeated 500 times (resulting in 500 correlation coefficients and 500 P values). The distribution of the correlation coefficients (left hand plot in each panel) and the corresponding P values (right hand plot in each panel) was calculated and plotted (green shading). The distributions for randomly paired alleles were also calculated (red shading). In every case the observed distributions were significantly different from random (p<10−16). However, although distinct from random, the observed correlations were not always significant (histogram of green observed P values, right hand plots, contains a number of P values > 0.05). The percentage of runs with P values < 0.05 are as follows: HTLV-1 disease 62.6%, HTLV-1 proviral load asymptomatic carriers 22%, HTLV-1 proviral load HAM/TSP patients 30.6%, IAVI early viral load set point 98.6%, IAVI time to low CD4 count 99.0%, HCV odds of spontaneous clearance 93.8%.
-
Appendix 4—figure 2—source data 1
Data underlying Appendix 4—figure 2A.
- https://cdn.elifesciences.org/articles/54558/elife-54558-app4-fig2-data1-v2.rds
-
Appendix 4—figure 2—source data 2
Data underlying Appendix 4—figure 2A.
- https://cdn.elifesciences.org/articles/54558/elife-54558-app4-fig2-data2-v2.rds
-
Appendix 4—figure 2—source data 3
Data underlying Appendix 4—figure 2B.
- https://cdn.elifesciences.org/articles/54558/elife-54558-app4-fig2-data3-v2.rds
-
Appendix 4—figure 2—source data 4
Data underlying Appendix 4—figure 2B.
- https://cdn.elifesciences.org/articles/54558/elife-54558-app4-fig2-data4-v2.rds
-
Appendix 4—figure 2—source data 5
Data underlying Appendix 4—figure 2C.
- https://cdn.elifesciences.org/articles/54558/elife-54558-app4-fig2-data5-v2.rds
-
Appendix 4—figure 2—source data 6
Data underlying Appendix 4—figure 2C.
- https://cdn.elifesciences.org/articles/54558/elife-54558-app4-fig2-data6-v2.rds
-
Appendix 4—figure 2—source data 7
Data underlying Appendix 4—figure 2D.
- https://cdn.elifesciences.org/articles/54558/elife-54558-app4-fig2-data7-v2.rds
-
Appendix 4—figure 2—source data 8
Data underlying Appendix 4—figure 2D.
- https://cdn.elifesciences.org/articles/54558/elife-54558-app4-fig2-data8-v2.rds
-
Appendix 4—figure 2—source data 9
Data underlying Appendix 4—figure 2E.
- https://cdn.elifesciences.org/articles/54558/elife-54558-app4-fig2-data9-v2.rds
-
Appendix 4—figure 2—source data 10
Data underlying Appendix 4—figure 2E.
- https://cdn.elifesciences.org/articles/54558/elife-54558-app4-fig2-data10-v2.rds
-
Appendix 4—figure 2—source data 11
Data underlying Appendix 4—figure 2F.
- https://cdn.elifesciences.org/articles/54558/elife-54558-app4-fig2-data11-v2.rds
-
Appendix 4—figure 2—source data 12
Data underlying Appendix 4—figure 2F.
- https://cdn.elifesciences.org/articles/54558/elife-54558-app4-fig2-data12-v2.rds
Appendix 4—figure 3
Correlation between the HIV-1 viral load associated with an allele and the viral load associated with similar alleles.
The early viral load set point associated with an HLA class I allele ('Coefficient of Index Allele, x axis) was correlated with the coefficient of HLA class I alleles with similar TCR binding (A), similar iKIR binding (B), similar activating KIR binding (C), similar LILRB1 binding (D) and similar LILRB2 binding (E). All alleles in the cohort of a sufficient frequency (N > 15) and with sufficient near alleles (N > 15 with 50% or more similarity) were considered. The Spearman correlation coefficient (Rs) and corresponding P value are reported in the title bar for each plot. Unlike HTLV-1 infection, and more in line with expectation, the picture was mixed with no single interaction able to explain all HLA associations. The only significant correlation was between the protection offered by an alleles and the protection offered by alleles with similar LILRB2 binding (E). However, the correlation was weak and there were plenty of alleles which did not conform to the pattern.
-
Appendix 4—figure 3—source data 1
Data underlying Appendix 4—figure 3A.
- https://cdn.elifesciences.org/articles/54558/elife-54558-app4-fig3-data1-v2.csv
-
Appendix 4—figure 3—source data 2
Data underlying Appendix 4—figure 3B.
- https://cdn.elifesciences.org/articles/54558/elife-54558-app4-fig3-data2-v2.csv
-
Appendix 4—figure 3—source data 3
Data underlying Appendix 4—figure 3C.
- https://cdn.elifesciences.org/articles/54558/elife-54558-app4-fig3-data3-v2.csv
-
Appendix 4—figure 3—source data 4
Data underlying Appendix 4—figure 3D.
- https://cdn.elifesciences.org/articles/54558/elife-54558-app4-fig3-data4-v2.csv
-
Appendix 4—figure 3—source data 5
Data underlying Appendix 4—figure 3E.
- https://cdn.elifesciences.org/articles/54558/elife-54558-app4-fig3-data5-v2.csv
Appendix 4—figure 4
Correlation between the odds of HCV clearance associated with an allele and the odds associated with similar alleles.
The odds of spontaneous clearance of HCV associated with an HLA class I allele (“Coefficient of Index Allele", x axis) was correlated with the coefficient of HLA class I alleles with similar TCR binding (A), similar iKIR binding (B), similar activating KIR binding (C), similar LILRB1 binding (D) and similar LILRB2 binding (E). All alleles in the cohort of a sufficient frequency (N > 15) and with sufficient near alleles (N > 15 with 50% or more similarity) were considered. The Spearman correlation coefficient (Rs) and corresponding P value are reported in the title bar for each plot. Unlike HTLV-1 infection, and more in line with expectation, the picture was mixed with no single interaction able to explain all HLA associations. The strongest positive correlation was seen for alleles with similar TCR binding but the correlation is weak and not significant indicating that although the protection conferred by some alleles is attributable to TCR binding there are many alleles where the protection is better explained by another interaction.
-
Appendix 4—figure 4—source data 1
Data underlying Appendix 4—figure 4A.
- https://cdn.elifesciences.org/articles/54558/elife-54558-app4-fig4-data1-v2.csv
-
Appendix 4—figure 4—source data 2
Data underlying Appendix 4—figure 4B.
- https://cdn.elifesciences.org/articles/54558/elife-54558-app4-fig4-data2-v2.csv
-
Appendix 4—figure 4—source data 3
Data underlying Appendix 4—figure 4C.
- https://cdn.elifesciences.org/articles/54558/elife-54558-app4-fig4-data3-v2.csv
-
Appendix 4—figure 4—source data 4
Data underlying Appendix 4—figure 4D.
- https://cdn.elifesciences.org/articles/54558/elife-54558-app4-fig4-data4-v2.csv
-
Appendix 4—figure 4—source data 5
Data underlying Appendix 4—figure 4E.
- https://cdn.elifesciences.org/articles/54558/elife-54558-app4-fig4-data5-v2.csv
Author response image 1

Tables
Table 1
Interactions underlying HLA class I disease associations in HTLV-1 infection.
Four HLA class I alleles are associated with disease (HAM/TSP) in HTLV-1 infection (model 1, index only). For each HLA allele we sought to determine the underlying mechanism by performing 5 multivariate logistic regressions (model 2–6), one for each of the distance metrics. The coefficient (Coeff) and P value for the index allele and the nearby alleles (similarity metric) are recorded below. For each of the index HLA alleles considered TCR.FS was associated with disease and in the same direction as the index allele; that is when the index was protective alleles with similar TCR binding (high TCR.FS) were protective and when the index was detrimental TCR.FS was detrimental (see row ‘TCR.FS’ in model 2, shaded). Furthermore, inclusion of TCR.FS in the multivariate analysis actually strengthened the effect of the index allele in every case (compare the magnitude of the coefficient for index in model 1 and index in model 2) indicating that removal of near alleles from the baseline made the ‘background’ alleles more dissimilar to the index. None of the other metrics were significant for any of the index alleles considered. Coeff <0 indicates reduced risk of HAM/TSP (i.e. a protective effect, ‘P’), Coeff >0 indicates increased risk of HAM/TSP (i.e. a detrimental effect, ‘D’). The odds ratio = exp(Coeff). The additional covariates age and gender were included in the regressions. Significance codes: p<0.001 ***; p<0.01 **; p<0.05 *; p<0.1. ; P values are two tailed.
| | Index allele | |||||
|---|---|---|---|---|---|---|
| Model | Covariate | A*02:06 | A*02:07 | C*08:01 | B*54:01 | |
| 1. Index only | Index | Coeff | −0.55 P | −1.27 P | −0.52 P | 0.96 D |
| P val | 0.086 · | 0.0079 ** | 0.19 | 0.0056 ** | ||
| 2. Index + TCR.FS | Index | Coeff | −0.67 | −1.32 | −0.70 | 1.15 |
| P val | 0.042 * | 0.0057 ** | 0.086 · | 0.0014 ** | ||
| TCR.FS | Coeff | −5.48 P | −2.40 P | −1.66 P | 1.57 D | |
| P val | 0.00014 *** | 0.017 * | 0.075 · | 0.02 * | ||
| 3. Index + iKIR.FS | Index | Coeff | −0.55 | −1.26 | −0.72 | +0.82 |
| P val | 0.08 · | 0.009 ** | 0.083 · | 0.02 * | ||
| iKIR.FS | Coeff | −0.43 P | −0.36 P | −1.23 P | −0.87 P | |
| P val | 0.51 | 0.63 | 0.12 | 0.11 | ||
| 4. Index + aKIR.FS | Index | Coeff | −0.55 | −1.25 | −0.51 | +0.83 |
| P val | 0.08 · | 0.009 ** | 0.20 | 0.019 * | ||
| aKIR.FS | Coeff | −0.47 P | −0.41 P | 0.18 D | −0.64 P | |
| P val | 0.48 | 0.60 | 0.70 | 0.13 | ||
| 5. Index + LILRB1.S | Index | Coeff | −0.48 | −1.36 | −0.60 | 1.06 |
| P val | 0.15 | 0.008 ** | 0.16 | 0.005 ** | ||
| LILRB1.S | Coeff | 0.65 D | −0.47 P | −0.49 P | 0.92 D | |
| P val | 0.51 | 0.61 | 0.61 | 0.47 | ||
| 6. Index + LILRB2.S | Index | Coeff | −0.49 | −1.13 | −0.61 | 0.96 |
| P val | 0.15 | 0.029 | 0.14 | 0.009 ** | ||
| LILRB2.S | Coeff | 0.45 D | 0.84 D | −0.73 P | −0.05 P | |
| P val | 0.63 | 0.51 | 0.50 | 0.96 | ||
Table 2
Interactions underlying HLA class I disease associations in HIV-1 infection.
Four HLA class I alleles have been associated with early viral load set point in HIV-1 infection (model 1, index only). For each HLA allele we sought to determine the underlying mechanism by performing five multivariate linear regressions (model 2–6), one for each of the distance metrics. The coefficient (Coeff) and P value for the index allele and the similarity metric are recorded below. A Coeff >0 indicates an increase in viral load i.e. a detrimental effect (D), a Coeff <0 indicates a protective effect (P). In all cases gender was included as an additional covariate in the model. A slash (/) indicates that there were an insufficient number of alleles to perform the analysis. For B53:01 there were not enough similar alleles to perform the TCR or KIR analysis. Alleles with similar LILRB1 and LILRB2 binding to B53:01 were not similarly detrimental. For the protective B57 alleles, we found a clear picture that alleles with similar aKIR binding to B*57:01, B*57:02 and B*57:03 were significantly protective (model 4, ‘aKIR.FS’ row, shaded). There was also a trend for alleles with similar TCR binding and similar LILRB2 binding to be protective (model 2 TCR.FS row and model 6 LILRB2.S row). Significance codes: p<0.001 ***; p<0.01 **; p<0.05 *; p<0.1. ; P values are two tailed.
| | Index allele | |||||
|---|---|---|---|---|---|---|
| Model | COV. | B*53:01 | B*57:01 | B*57:02 | B*57:03 | |
| 1. Index only | index | Coeff | +0.23 D | / | −0.63 P | −0.46 P |
| P val | 0.02 * | / | 0.005 ** | 0.002 ** | ||
| 2. Index+TCR.FS | Index | Coeff | / | / | −0.65 | −0.48 |
| P val | / | / | 0.003 ** | 0.001 ** | ||
| TCR.FS | Coeff | / | −0.24 P | −0.33 P | −0.24 P | |
| P val | / | 0.069 · | 0.082 · | 0.15 | ||
| 3. Index+iKIR.FS | Index | Coeff | / | / | −0.64 | −0.47 |
| P val | / | / | 0.004 ** | 0.002 ** | ||
| iKIR.FS | Coeff | / | −0.12 P | −0.11 P | −0.08 P | |
| P val | / | 0.19 | 0.32 | 0.47 | ||
| 4. Index+aKIR.FS | Index | Coeff | / | / | −0.62 | −0.45 |
| P val | / | / | 0.005 ** | 0.002 ** | ||
| aKIR.FS | Coeff | / | −0.41 P | −0.43 P | −0.39 P | |
| P val | / | 0.006 ** | 0.017 * | 0.025 * | ||
| 5. Index+LILRB1.S | Index | Coeff | +0.21 | / | −0.67 | −0.49 |
| P val | 0.045 * | / | 0.003 ** | 0.001 ** | ||
| LILRB1.S | Coeff | −0.11 P | −0.25 P | −0.59 P | −0.5 P | |
| P val | 0.65 | 0.27 | 0.22 | 0.27 | ||
| 6. Index+LILRB2.S | Index | Coeff | +0.22 | / | −0.67 | −0.5 |
| P val | 0.03 * | / | 0.003 ** | 0.0007 *** | ||
| LILRB2.S | Coeff | −0.06 P | −0.40 P | −0.56 P | −0.7 P | |
| P val | 0.84 | 0.08 · | 0.08 · | 0.08 · | ||
Table 3
Interactions underlying HLA class I disease associations in HCV infection HLA-B*57 is associated with increased odds of spontaneous clearance of HCV.
In this cohort the protective effect is attributable to B*57:02 with B*57:03 and B*57:05 apparently following the same trend (though due to low numbers it is impossible to be certain). For each B*57 allele of interest we sought to determine the underlying mechanism by performing five multivariate linear regressions (model 2–6), one for each of the distance metrics. The coefficient (Coeff) and P value for the index allele and the similarity metric are recorded below. HBV seropositivity, mode of infection, SNP rs1297986 and subcohort were included as additional covariates in all models. A coefficient >0 indicates a protective allele (increased odds of spontaneous clearance, P). Unlike the B*57 protective effect in HIV-1 infection, in HCV infection there appeared to be no contribution from activating KIR i.e. HLA with similar aKIR binding to B*57 were never significant protective despite sufficient power (model 4). The protective effect here appears to be entirely attributable to CD8+ T cells (model 2, shaded). In all cases the protective effect of alleles with similar TCR binding is actually more significant than the protective effect of the B*57 alleles themselves (model 1, index only). Significance codes: p<0.001 ***; p<0.01 **; p<0.05 *; p<0.1. ; P values are two tailed.
| | Index allele | |||||
|---|---|---|---|---|---|---|
| Model | COV. | B*57:02 | B*57:03 | B*57:05 | ||
| 1. Index only | index | Coeff | 2.02 P | 0.57 P | 15.5 P | |
| P val | 0.08 · | 0.16 | 0.99 | |||
| 2. Index+TCR.FS | Index | Coeff | 2.10 | 0.67 | 15.9 | |
| P val | 0.07 · | 0.10 · | 0.99 | |||
| TCR.FS | Coeff | 1.04 P | 0.89 P | 1.19 P | ||
| P val | 0.05 * | 0.09 · | 0.04 * | |||
| 3. Index+iKIR.FS | Index | Coeff | 2.00 | 0.64 | 15.62 | |
| P val | 0.08 · | 0.12 | 0.99 | |||
| iKIR.FS | Coeff | 0.35 P | 0.40 P | 0.50 P | ||
| P val | 0.29 | 0.24 | 0.17 | |||
| 4. Index+aKIR.FS | Index | Coeff | 2.06 | 0.58 | 15.49 | |
| P val | 0.07 · | 0.15 | 0.99 | |||
| aKIR.FS | Coeff | 0.66 P | 0.29 P | 0.54 P | ||
| P val | 0.15 | 0.56 | 0.30 | |||
| 5. Index+LILRB1.S | Index | Coeff | 2.00 | 0.58 | 15.48 | |
| P val | 0.09 · | 0.16 | 0.99 | |||
| LILRB1.S | Coeff | −0.15 D | 0.15 P | −0.37 D | ||
| P val | 0.90 | 0.91 | 0.77 | |||
| 6. Index+LILRB2.S | Index | Coeff | 2.02 | 0.52 | 15.53 | |
| P val | 0.08 · | 0.20 | 0.99 | |||
| LILRB2.S | Coeff | −0.02 D | −0.81 D | −0.02 D | ||
| P val | 0.98 | 0.40 | 0.98 | |||
Table 4
Interactions underlying HLA class I disease associations in Crohn’s disease cases.
AH8.1 is associated with increased odds of good prognosis amongst Crohn’s disease cases. In our cohort two classical HLA class I alleles from this haplotype, B*08:01 and C*07:01 are associated with good prognosis (Appendix 3—table 7). For both B*08:01 and C*07:01 we sought to determine the underlying mechanism by performing 5 multivariate linear regressions (model 2–6), one for each of the distance metrics. The coefficient (Coeff) and P value for the index allele and the similarity metric are recorded below. Gender was included as an additional covariate in all models. A coefficient <0 indicates a protective effect (P, decreased odds of poor prognosis), a coefficient >0 indicates a detrimental effect (D, increased odds of poor prognosis). Despite good power, similar alleles by all 5 metrics were never significantly protective (indeed in some cases tended towards being detrimental e.g. similar alleles by TCR or LILRB1 binding). Inclusion of 3 non-MHC SNPs which were significant in a GWAS as covariates did not alter these conclusions. Significance codes: p<0.001 ***; p<0.01 **; p<0.05 *; p<0.1. ; P values are two tailed.
| | Index allele | |||||
|---|---|---|---|---|---|---|
| Model | COV. | B*08:01 | C*07:01 | |||
| 1. Index only | index | Coeff | −0.50 P | −0.34 P | ||
| P val | 3.56 × 10⁻⁷ **** | 0.0003 *** | ||||
| 2. Index+TCR.FS | Index | Coeff | −0.49 | −0.34 | ||
| P val | 9.96 × 10⁻⁷ **** | 0.0008 *** | ||||
| TCR.FS | Coeff | 0.65 D | 0.041 D | |||
| P val | 0.20 | 0.84 | ||||
| 3. Index+iKIR.FS | Index | Coeff | −0.50 | −0.34 | ||
| P val | 3.75 × 10⁻⁷ **** | 0.0007 *** | ||||
| iKIR.FS | Coeff | −0.08 P | 0.02 D | |||
| P val | 0.89 | 0.86 | ||||
| 4. Index+aKIR.FS | Index | Coeff | −0.50 | −0.34 | ||
| P val | 3.56 × 10⁻⁷ **** | 0.0003 *** | ||||
| aKIR.FS | Coeff | 0 | 0.001 D | |||
| P val | 1 | 0.99 | ||||
| 5. Index+LILRB1.S | Index | Coeff | −0.50 | −0.28 | ||
| P val | 1.46 × 10⁻⁶ **** | 0.007 ** | ||||
| LILRB1.S | Coeff | −0.001 P | 0.28 D | |||
| P val | 1 | 0.09 . | ||||
| 6. Index+LILRB2.S | Index | Coeff | −0.50 | −0.28 | ||
| P val | 2.28 × 10⁻⁶ **** | 0.007 ** | ||||
| LILRB2.S | Coeff | 0.007 P | 0.28 P | |||
| P val | 0.98 | 0.11 | ||||
Key resources table
| Reagent type (species) or resource | Designation | Source or reference | Identifiers | Additional information |
|---|---|---|---|---|
| Software, algorithm | Fraction shared | This paper | RRID:SCR_018250 | https://github.com/bjohnnyd/fs-tool |
| Software, algorithm | NetMHCpan v4.0 | https://services.healthtech.dtu.dk/service.php?NetMHCpan-4.0 |
Appendix 3—table 1
Which HLA subtype alleles are responsible for the allele group associations in HTLV-1 infection?
Risk of HAM/TSP was determined by logistic regression; we report the coefficient [odds ratio of HAM/TSP = exp(Coeff)], P value and number of individuals in the cohort with and without the HLA allele of interest. In all models, age and gender were included as additional covariates. Significance codes: p<0.001 ***; p<0.01 **; p<0.05 *; p<0.1. ; P values are two tailed.
| Risk of HAM/TSP | N | |||
|---|---|---|---|---|
| Coeff | P value | HLA+ | HLA- | |
| A*02 | −0.85 | 0.0014 ** | 150 | 242 |
| A*02:01 | −0.33 | 0.40 | 49 | 343 |
| A*02:06 | −0.55 | 0.086 · | 74 | 318 |
| A*02:07 | −1.27 | 0.0079 ** | 30 | 362 |
| C*08 | −0.70 | 0.064 · | 56 | 336 |
| C*08:01 | −0.52 | 0.19 | 50 | 342 |
| B*54 | 0.96 | 0.0056 ** | 82 | 310 |
| B*54:01 | 0.96 | 0.0056 ** | 82 | 310 |
Appendix 3—table 2
Which HLA subtype alleles are responsible for the allele group associations in HIV-1 infection?
Predictors of Log10(early viral load set point) were determined by linear regression. Other significant covariates (gender) were included in the model. A negative coefficient (Coeff) indicates a protective effect (decrease in log viral load associated with possession of the allele); a positive coefficient indicates a detrimental effect. Predictors of the rate of progression to CD4 cell count <350 cells/mm3 was determined by Cox regression; hazard ratio = exp(Coeff). Other significant covariates (age at infection, and HIV-1 clinic site which is essentially collinear with viral subtype but available for more subjects) were included in the model. A hazard ratio (HR) less than 1 indicates a protective effect (reduced risk of progression to low CD4 count associated with possession of the allele); a HR greater than 1 indicates a detrimental effect. N is the number of individuals with early viral load information (numbers with time to low CD4 cell count are slightly higher, total cohort size=568). Significance codes: p<0.001 ***; p<0.01 **; p<0.05 *; p<0.1. ; P values are two tailed.
| Early viral load set point | Time to low CD4 cell count | N | ||||||
|---|---|---|---|---|---|---|---|---|
| Coeff | P val | HR | P val | HLA+ | HLA- | |||
| B*57 | −0.51 | 0.00005 *** | 0.48 | 0.01 * | 50 | 474 | ||
| B*57:01 | Insufficient numbers for analysis | 1 | 523 | |||||
| B*57:02 | −0.63 | 0.005 ** | 0.40 | 0.07 | 15 | 509 | ||
| B*57:03 | −0.46 | 0.002 ** | 0.50 | 0.04 * | 36 | 488 | ||
| B*35Px | +0.23 | 0.02 * | 1.0 | 1.0 | 98 | 426 | ||
| B*35:02 | Insufficient numbers for analysis | 3 | 521 | |||||
| B*53:01 | +0.23 | 0.02 * | +0.93 | 0.7 | 95 | 429 | ||
Appendix 3—table 3
Interactions underlying HLA class I associations with disease progression in HIV-1 infection.
We investigated the interactions underlying HLA class I alleles which were significantly associated with disease progression in HIV-1 infection. HLA-B*53:01 was not included in this analysis as, in this cohort, it has no impact on progression to low CD4+ cell count (HR = 0.9, p=0.7).
| Index allele | |||||||
|---|---|---|---|---|---|---|---|
| Model | COV. | B*57:01 | B*57:02 | B*57:03 | |||
| 1. Index only | index | HR | / | 0.40 | 0.50 | ||
| P val | / | 0.07 · | 0.04 * | ||||
| 2. Index+TCR.FS | Index | HR | / | 0.40 | 0.49 | ||
| P val | / | 0.07 | 0.04 * | ||||
| TCR.FS | HR | 0.79 | 0.79 | 0.92 | |||
| P val | 0.33 | 0.5 | 0.8 | ||||
| 3. Index+iKIR.FS | Index | HR | / | 0.40 | 0.50 | ||
| P val | / | 0.07 · | 0.04 * | ||||
| iKIR.FS | HR | 0.97 | 1.01 | ||||
| P val | 0.87 | 0.97 | |||||
| 4. Index+aKIR.FS | Index | HR | / | 0.41 | 0.51 | ||
| P val | / | 0.08 · | 0.05 * | ||||
| aKIR.FS | HR | 0.60 | 0.61 | 0.61 | |||
| P val | 0.098 · | 0.17 | 0.16 | ||||
| 5. Index+LILRB1.S | Index | HR | / | 0.35 | 0.39 | ||
| P val | / | 0.04 * | 0.006 ** | ||||
| LILRB1.S | HR | 0.83 | 0.19 | 0.004 | |||
| P val | 0.67 | 0.06 · | 0.0001 *** | ||||
| 6. Index+LILRB2.S | Index | HR | / | 0.40 | 0.49 | ||
| P val | / | 0.07 · | 0.04 * | ||||
| LILRB2.S | HR | 0.95 | 0.92 | 0.79 | |||
| P val | 0.90 | 0.90 | 0.76 | ||||
Appendix 3—table 4
Impact on log10 viral load associated with different aKIR.FS groupings.
Investigation of individuals with similar aKIR binding to HLA*B57:01 revealed three distinct grouping (Figure 3A) which we named I, II and III. In a multivariate linear model to predict log10(viral load) these three different groupings (treated as three levels of a factor) had different coefficients, with only group I being significantly protective (top 3 rows of table below). Pooling groups II and III to increase the number of individuals in this grouping did not change the conclusion that only group I had a significant protective effect (bottom two rows of table below). Comparisons are with respect to the baseline (KIR3DS1:Bw4-80I- individuals, N = 438). In all cases gender was also included as a covariate in the model.
| Coefficient | P value | N in group | |
|---|---|---|---|
| Group I | −0.38 | 0.007 ** | 47 |
| Group II | −0.16 | 0.45 | 19 |
| Group III | +0.05 | 0.78 | 20 |
| Group I | −0.38 | 0.007 ** | 47 |
| Group II+III | −0.04 | 0.76 | 39 |
Appendix 3—table 5
Interactions underlying HLA class I associations with early viral load set point in HIV-1 infection in a KIR3DS1- cohort.
We investigated the interactions underlying HLA class I alleles which were significantly associated with early viral load set point in the absence of KIR3DS1 in HIV-1 infection. For all three alleles the winning model was one in which both TSC.FS and iKIR.FS were covariates (model 7) but in this case only TCR.FS (i.e. alleles with similar TCR binding, shaded) were significantly protective, alleles with similar iKIR binding actually tended to be detrimental (though not significantly) so they cannot explain the protective effect of the B*57 alleles.
| Index allele | |||||
|---|---|---|---|---|---|
| Model | COV. | B*57:01 | B*57:02 | B*57:03 | |
| 1. Index only | index | Coeff | / | −0.58 | −0.39 |
| P val | / | 0.027 * | 0.019 * | ||
| 2. Index+TCR.FS | Index | Coeff | / | −0.59 | −0.43 |
| P val | / | 0.023 * | 0.011 * | ||
| TCR.FS | Coeff | −0.22 | −0.32 | −0.29 | |
| P val | 0.13 | 0.12 | 0.11 | ||
| 3. Index+iKIR.FS | Index | Coeff | / | −0.59 | −0.40 |
| P val | / | 0.025 * | 0.017 * | ||
| iKIR.FS | Coeff | −0.09 | −0.088 | −0.05 | |
| P val | 0.37 | 0.47 | 0.65 | ||
| 4. Index+aKIR.FS | Index | Coeff | / | −0.58 | −0.39 |
| P val | / | 0.027 * | 0.019 * | ||
| aKIR.FS | Coeff | / | / | / | |
| P val | / | / | / | ||
| 5. Index+LILRB1.S | Index | Coeff | / | −0.68 | −0.42 |
| P val | / | 0.01 * | 0.013 * | ||
| LILRB1.S | Coeff | −0.46 | −1.22 | −0.51 | |
| P val | 0.058 · | 0.02 * | 0.3 | ||
| 6. Index+LILRB2.S | Index | Coeff | / | −0.66 | −0.46 |
| P val | / | 0.012 * | 0.006 ** | ||
| LILRB2.S | Coeff | −0.56 | −0.80 | −1.04 | |
| P val | 0.023 * | 0.02 * | 0.02 * | ||
| 7. Index+TCR.FS+iKIR.FS | Index | Coeff | / | −0.57 | −0.42 |
| P val | / | 0.027 * | 0.01 * | ||
| TCR.FS | Coeff | −0.86 | −0.62 | −0.81 | |
| P val | 0.046 * | 0.087 · | 0.022 * | ||
| iKIR.FS | Coeff | 0.48 | 0.21 | 0.38 | |
| P val | 0.12 | 0.32 | 0.086. | ||
Appendix 3—table 6
Which HLA subtype alleles are responsible for the protective effects of HLA-B*57 in HCV infection?
Odds of spontaneous clearance of HCV was determined by logistic regression; we report the coefficient (Coeff), P value and number of individuals in the cohort with and without the HLA allele of interest. In all models, HBV seropositivity, mode of infection, SNP rs1297986 and subcohort were included as additional covariates. A coefficient >0 indicates a protective allele (increased odds of spontaneous clearance). The odds ratio of spontaneous clearance = exp(Coeff). Significance codes: p<0.001 ***; p<0.01 **; p<0.05 *; p<0.1. ; P values are two tailed.
| Odds of spontaneous clearance | N | |||
|---|---|---|---|---|
| Coeff | P value | HLA+ | HLA- | |
| B*57 | 0.62 | 0.01 * | 84 | 698 |
| B*57:01 | 0.41 | 0.20 | 49 | 733 |
| B*57:02 | 2.02 | 0.08 · | 5 | 777 |
| B*57:03 | 0.57 | 0.16 | 29 | 753 |
| B*57:05 | 15.53 | 0.99 | 1 | 781 |
Appendix 3—table 7
Which HLA class I alleles of the AH8.1 haplotype are associate with reduced odds of poor prognosis?
Odds of poor prognosis was determined by logistic regression; we report the Coefficient (Coeff), Odds ratio (OR), P value and number of individuals in the cohort with and without the HLA class I allele of interest. OR = exp(Coeff). An OR <1 (or equivalently a Coeff <0) indicates a protective allele (odds of poor prognosis reduced). To maximise power, only individuals missing information at loci of interest were removed hence there is some variation in cohort size depending on the analysis. 1 3 SNPs included: rs5929166, rs147856773 and rs75764599. See Lee et al., 2017 for details. In all cases gender was included as a covariate. Since inclusion of the 3 SNPs had little impact on the OR but reduced power (due to a loss of individuals) we do not include the 3 SNPs as covariates in subsequent analysis but we do check that results are robust to their inclusion.
| Odds of poor prognosis | N | |||||
|---|---|---|---|---|---|---|
| HLA | Coeff | OR | P value | HLA+ | HLA- | Total |
| A*01:01 | −0.08 | 0.92 | 0.33 | 859 | 1643 | 2502 |
| B*08:01 | −0.48 | 0.62 | 4.75 × 10⁻⁷ **** | 620 | 1837 | 2457 |
| C*07:01 | −0.29 | 0.75 | 9.8 × 10⁻⁴ *** | 784 | 1866 | 2650 |
| 1 With inclusion of three non-MHC SNPs significant in GWAS as covariates | ||||||
| A*0101 | −0.05 | 0.95 | 0.55 | 813 | 1531 | 2344 |
| B*08:01 | −0.43 | 0.65 | 1.57 × 10⁻⁵ **** | 584 | 1714 | 2298 |
| C*07:01 | −0.24 | 0.78 | 8.3 × 10⁻³ ** | 740 | 1738 | 2478 |
Additional files
-
Supplementary file 1
Worked examples of the fraction shared calculations.
- https://cdn.elifesciences.org/articles/54558/elife-54558-supp1-v2.docx
-
Transparent reporting form
- https://cdn.elifesciences.org/articles/54558/elife-54558-transrepform-v2.docx
-
Appendix 4—figure 1—source data 1
Data underlying Appendix 4—figure 1A.
- https://cdn.elifesciences.org/articles/54558/elife-54558-app4-fig1-data1-v2.csv
-
Appendix 4—figure 1—source data 2
Data underlying Appendix 4—figure 1B.
- https://cdn.elifesciences.org/articles/54558/elife-54558-app4-fig1-data2-v2.csv
-
Appendix 4—figure 2—source data 1
Data underlying Appendix 4—figure 2A.
- https://cdn.elifesciences.org/articles/54558/elife-54558-app4-fig2-data1-v2.rds
-
Appendix 4—figure 2—source data 2
Data underlying Appendix 4—figure 2A.
- https://cdn.elifesciences.org/articles/54558/elife-54558-app4-fig2-data2-v2.rds
-
Appendix 4—figure 2—source data 3
Data underlying Appendix 4—figure 2B.
- https://cdn.elifesciences.org/articles/54558/elife-54558-app4-fig2-data3-v2.rds
-
Appendix 4—figure 2—source data 4
Data underlying Appendix 4—figure 2B.
- https://cdn.elifesciences.org/articles/54558/elife-54558-app4-fig2-data4-v2.rds
-
Appendix 4—figure 2—source data 5
Data underlying Appendix 4—figure 2C.
- https://cdn.elifesciences.org/articles/54558/elife-54558-app4-fig2-data5-v2.rds
-
Appendix 4—figure 2—source data 6
Data underlying Appendix 4—figure 2C.
- https://cdn.elifesciences.org/articles/54558/elife-54558-app4-fig2-data6-v2.rds
-
Appendix 4—figure 2—source data 7
Data underlying Appendix 4—figure 2D.
- https://cdn.elifesciences.org/articles/54558/elife-54558-app4-fig2-data7-v2.rds
-
Appendix 4—figure 2—source data 8
Data underlying Appendix 4—figure 2D.
- https://cdn.elifesciences.org/articles/54558/elife-54558-app4-fig2-data8-v2.rds
-
Appendix 4—figure 2—source data 9
Data underlying Appendix 4—figure 2E.
- https://cdn.elifesciences.org/articles/54558/elife-54558-app4-fig2-data9-v2.rds
-
Appendix 4—figure 2—source data 10
Data underlying Appendix 4—figure 2E.
- https://cdn.elifesciences.org/articles/54558/elife-54558-app4-fig2-data10-v2.rds
-
Appendix 4—figure 2—source data 11
Data underlying Appendix 4—figure 2F.
- https://cdn.elifesciences.org/articles/54558/elife-54558-app4-fig2-data11-v2.rds
-
Appendix 4—figure 2—source data 12
Data underlying Appendix 4—figure 2F.
- https://cdn.elifesciences.org/articles/54558/elife-54558-app4-fig2-data12-v2.rds
-
Appendix 4—figure 3—source data 1
Data underlying Appendix 4—figure 3A.
- https://cdn.elifesciences.org/articles/54558/elife-54558-app4-fig3-data1-v2.csv
-
Appendix 4—figure 3—source data 2
Data underlying Appendix 4—figure 3B.
- https://cdn.elifesciences.org/articles/54558/elife-54558-app4-fig3-data2-v2.csv
-
Appendix 4—figure 3—source data 3
Data underlying Appendix 4—figure 3C.
- https://cdn.elifesciences.org/articles/54558/elife-54558-app4-fig3-data3-v2.csv
-
Appendix 4—figure 3—source data 4
Data underlying Appendix 4—figure 3D.
- https://cdn.elifesciences.org/articles/54558/elife-54558-app4-fig3-data4-v2.csv
-
Appendix 4—figure 3—source data 5
Data underlying Appendix 4—figure 3E.
- https://cdn.elifesciences.org/articles/54558/elife-54558-app4-fig3-data5-v2.csv
-
Appendix 4—figure 4—source data 1
Data underlying Appendix 4—figure 4A.
- https://cdn.elifesciences.org/articles/54558/elife-54558-app4-fig4-data1-v2.csv
-
Appendix 4—figure 4—source data 2
Data underlying Appendix 4—figure 4B.
- https://cdn.elifesciences.org/articles/54558/elife-54558-app4-fig4-data2-v2.csv
-
Appendix 4—figure 4—source data 3
Data underlying Appendix 4—figure 4C.
- https://cdn.elifesciences.org/articles/54558/elife-54558-app4-fig4-data3-v2.csv
-
Appendix 4—figure 4—source data 4
Data underlying Appendix 4—figure 4D.
- https://cdn.elifesciences.org/articles/54558/elife-54558-app4-fig4-data4-v2.csv
-
Appendix 4—figure 4—source data 5
Data underlying Appendix 4—figure 4E.
- https://cdn.elifesciences.org/articles/54558/elife-54558-app4-fig4-data5-v2.csv
Download links
A two-part list of links to download the article, or parts of the article, in various formats.
Downloads (link to download the article as PDF)
Open citations (links to open the citations from this article in various online reference manager services)
Cite this article (links to download the citations from this article in formats compatible with various reference manager tools)
Identifying the immune interactions underlying HLA class I disease associations
eLife 9:e54558.
https://doi.org/10.7554/eLife.54558


