Ca2+ entry through NaV channels generates submillisecond axonal Ca2+ signaling
- Department of Axonal Signaling, Netherlands Institute for Neuroscience (NIN), Royal Netherlands Academy of Arts and Sciences (KNAW), Netherlands
- Cell Biology, Neurobiology and Biophysics, Department of Biology, Faculty of Science, Utrecht University, Netherlands
Figures
Figure 1 with 1 supplement
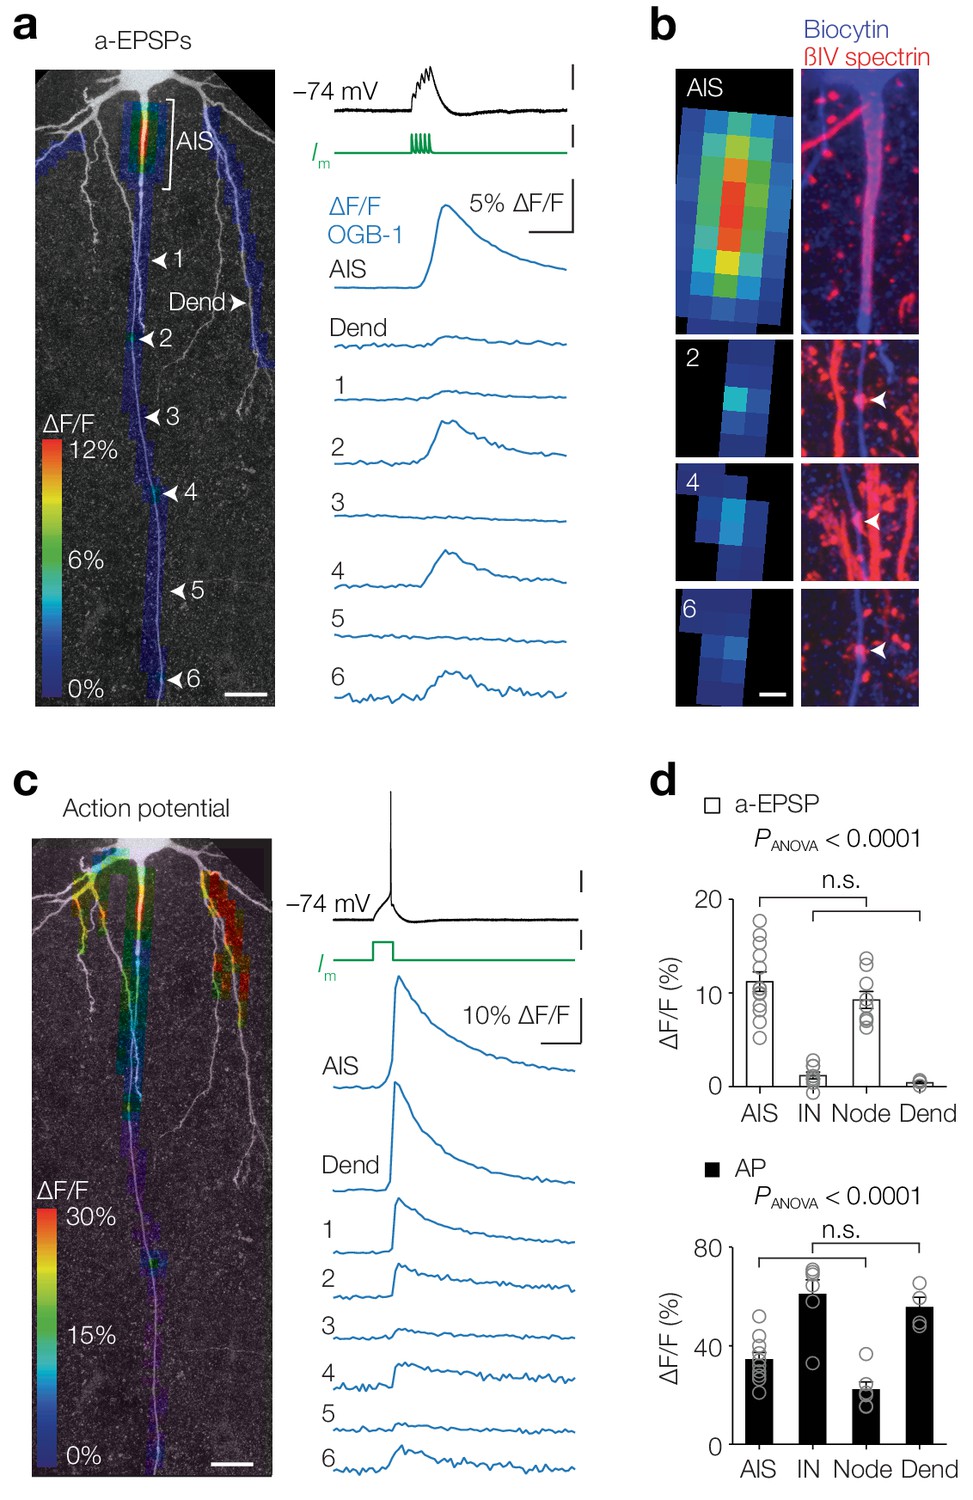
Activity-dependent compartmentalized Ca2+ entry in layer five axons.
(a) Left, Color-coded maximal ∆F/F of OGB-1 imaged in a L5 pyramidal neuron axon in response to an a-EPSP (five subthreshold current injections at 100 Hz) overlaid with a z-projection of biocytin-streptavidin (grey) of the same neuron. White arrowheads indicate regions of interest from which example traces are shown right. Scale bar, 20 µm. Right, ∆F/F traces from locations specified left. For illustrative purposes, ∆F/F traces represent averages of ~400 trials. Top to bottom scale bars, 10 mV, 1 nA, 5% ∆F/F, 100 ms. (b) Left, higher magnification of the regions of interest shown in a. Right, maximal z-projection of biocytin-streptavidin (blue) and ßIV spectrin (red). White arrows indicate nodes or Ranvier. Sites with a-EPSP-evoked [Ca2+]i transients were all positive to ßIV spectrin (n = 15 AISs and 23 nodes from n = 15 axons). Scale bar, 5 µm. (c) Same axon and locations as in a with color-coded maximal ∆F/F in response to an AP. Scale bars, 20 mV, 0.5 nA, 10% ∆F/F, 100 ms and 20 µm. (d) Top, Population data for peak ∆F/F in response to a-EPSPs in the AIS (n = 13), first internode (IN, n = 9), the first Node (n = 9) and basal dendrite (Dend, n = 4), one-way ANOVA with Tukey’s multiple comparisons test, p<0.0001, Bottom, peak ∆F/F in response to a single AP in the AIS (n = 10), first internode (IN, n = 6), the first Node (n = 6) and basal dendrite (Dend, n = 4), one-way ANOVA with Tukey’s multiple comparisons test, p<0.0001. Open circles represent individual cells and bars show the population mean ± s.e.m. Data available in Figure 1—source data 1. See also Figure 1—figure supplement 1.
-
Figure 1—source data 1
Activity-dependent compartmentalized Ca2+ entry in layer five axons.
- https://cdn.elifesciences.org/articles/54566/elife-54566-fig1-data1-v2.xlsx
Figure 1—figure supplement 1
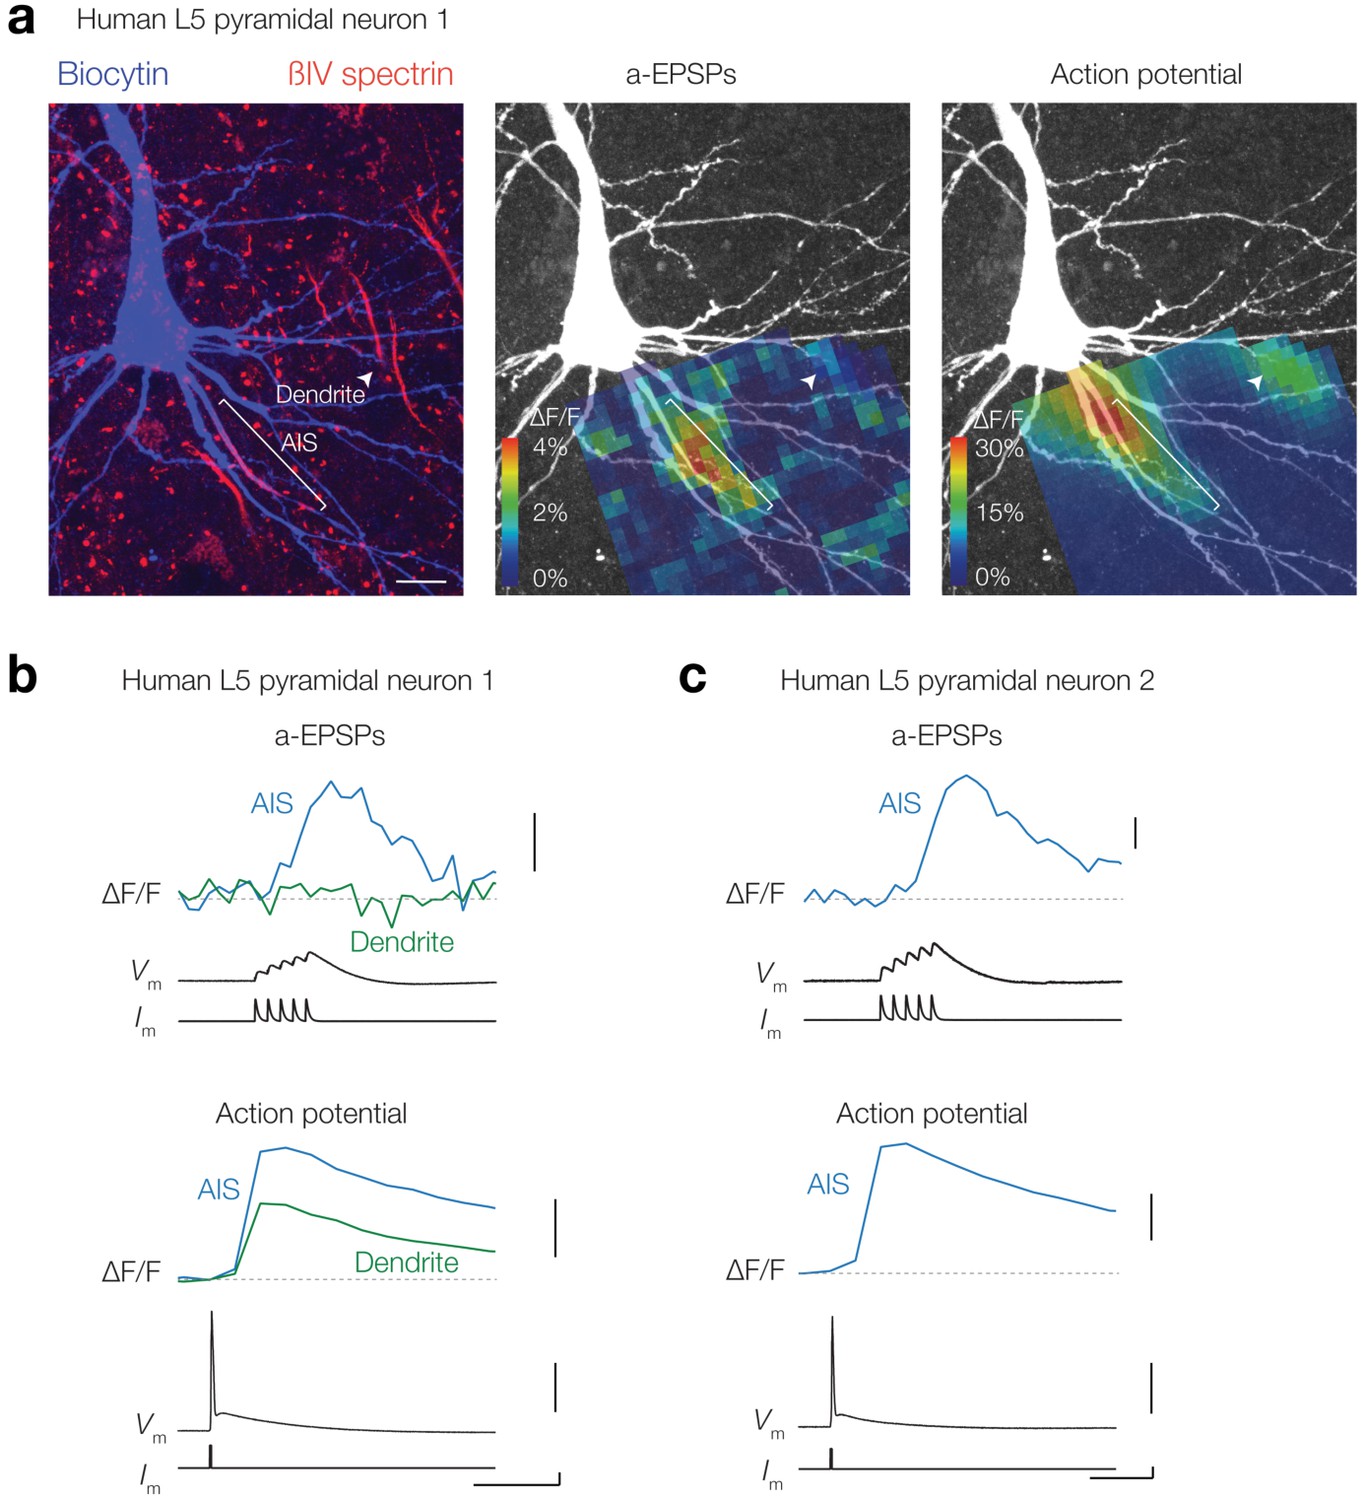
EPSP-evoked evoked Δ[Ca2+]i in human layer five pyramidal neuron AIS.
(a) Left, z-projection of a human temporal lobe L5 pyramidal neuron stained with biocytin/streptavidin (blue) and βIV-spectrin (red). Middle and right, peak ∆F/F (OGB-1, 100 μM) in response to an a-EPSP and AP overlaid with a z-projection of biocytin-streptavidin (white) . Note that not all regions visible in the confocal scan (left) are from the same focal plane and thus visible in the ∆F/F plot. The AIS (white line) and a part of a basal dendrite (white arrow) were in focus. Scale bar, 10 μm. (b) Example traces from AIS (blue) and dendrite (green) in response to an a-EPSP (top) and AP (bottom) from locations indicated in a. Note the absence of a-EPSP evoked Ca2+ influx in the dendrite. From top to bottom scale bars, 1% ΔF/F, 10% ΔF/F, 10 mV, 1 nA and 50 ms. (c) Example ∆F/F traces from another neuron AIS (blue) in response to an a-EPSP (top) and AP (bottom). From top to bottom scale bars, 1% ΔF/F, 10% ΔF/F, 10 mV, 1 nA and 50 ms.
Figure 2
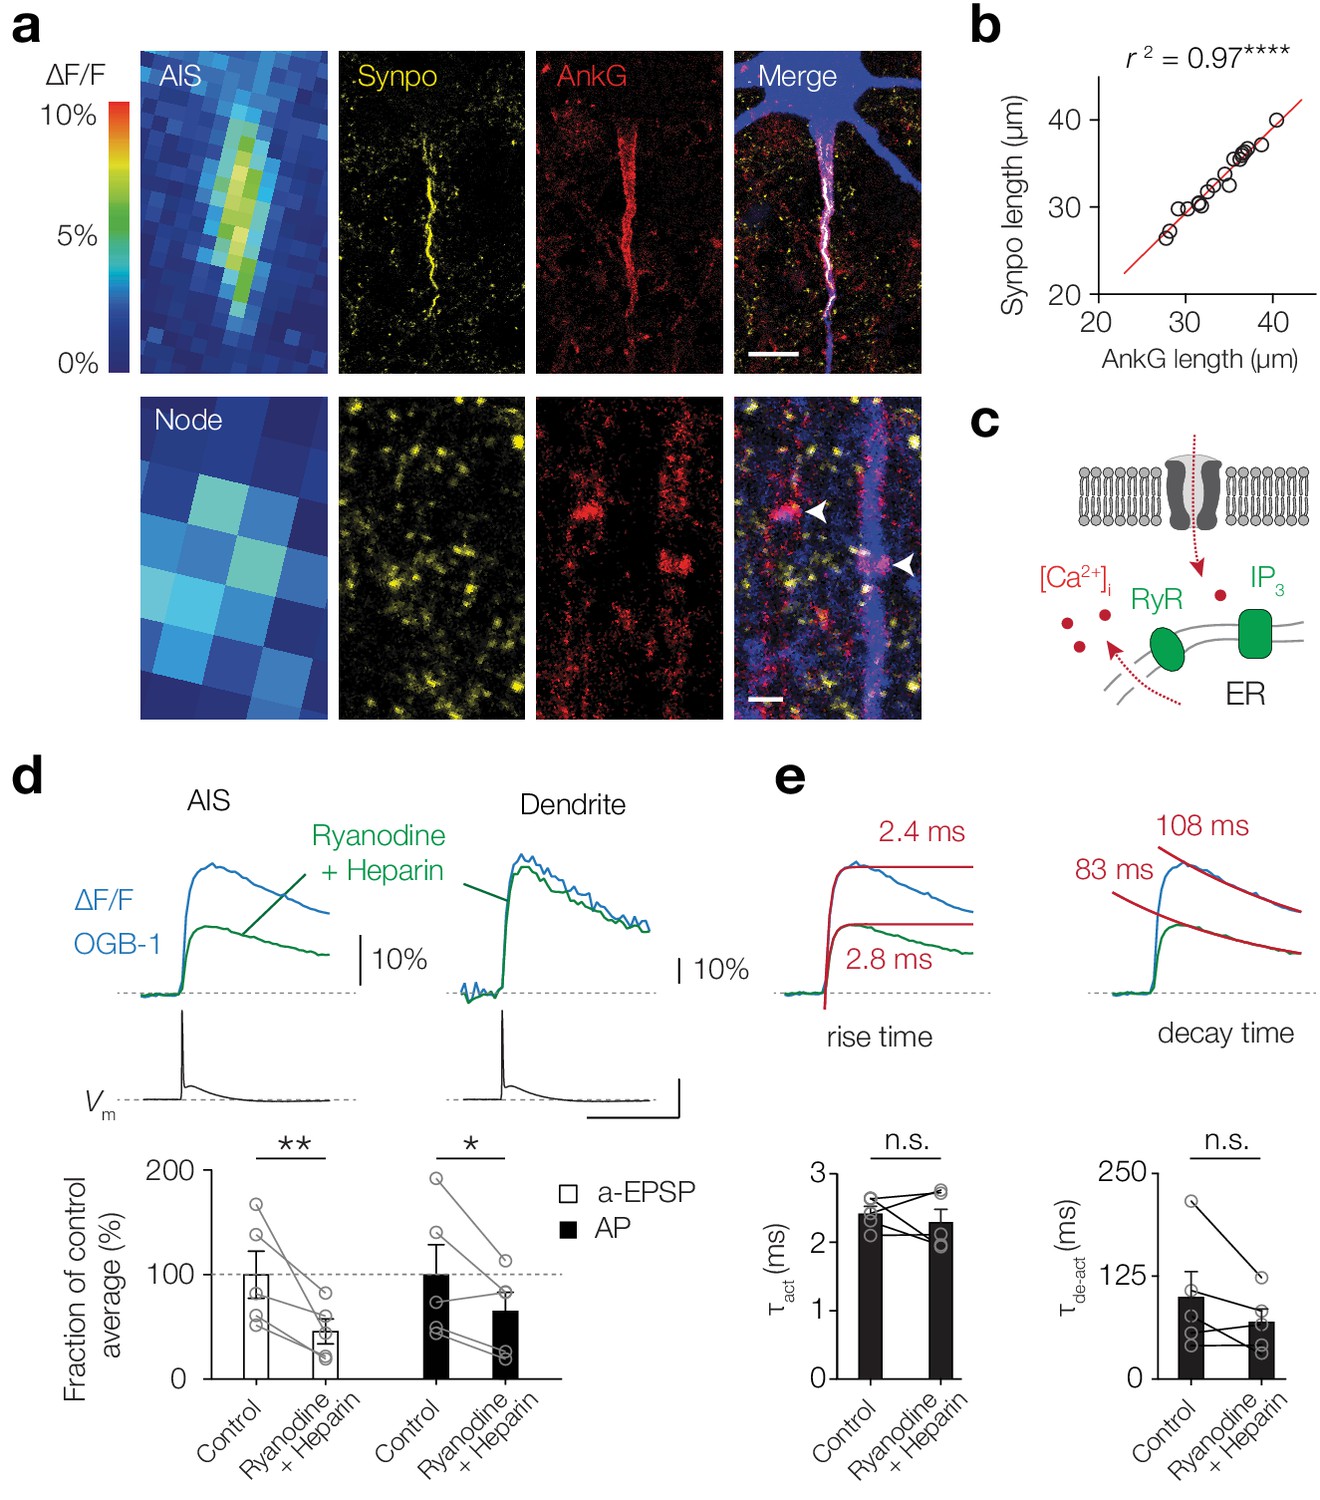
Giant saccular organelle amplifies activity-dependent Δ[Ca2+]i in the AIS.
(a) Example color-coded maximal ∆F/F profile (100 μM OGB-1) in response to a-EPSPs in the AIS (top) and Node (bottom) compared to z-projections for synaptopodin (Synpo, yellow), Ankyrin-G (AnkG, red) and biocytin/streptavidin (blue) of the same axon. White arrows indicate the locations of nodes, in the imaged axon (blue) and a neighboring one, both without synaptopodin. The many small Synpo positive puncta are likely co-localized with subclasses of spines (Benedeczky et al., 1994; Bas Orth et al., 2007). Scale bars, 10 µm and 1 µm. (b) The length of synaptopodin fluorescence linearly scales with Ankyrin G length. Red trace, linear regression fit with y = 1.005 x – 0.95, r2 = 0.966, ****p<0.0001, n = 19. (c) Schematic of Ca2+-induced Ca2+ release by internal ER stores. (d) Top, example ∆F/F (OGB-1) transients from AIS (left) and dendrite (right) in response to an AP (Vm, black) in control conditions (blue) and re-patched with blockers (green). Scale bars, 10% ∆F/F, 50 mV and 50 ms. Bottom, population data of the peak ∆F/F in the AIS in response to a-EPSP (white bars) and AP (black bars) before and after store release block, one-tailed ratio paired t-tests, **p=0.0060, *p=0.021, n = 5. Open circles and connecting lines represent paired recordings from individual cells and bars show the population mean ± s.e.m. (e) Top, Ca2+ transients fitted with a single exponential function (red) to the rise (left) and decay time (right) in response to an AP, red number indicates the τ. Bottom, comparison of the rise and decay time (two-tailed paired t-tests, τact, p=0.52, τde-act, p=0.18, n = 5). Open circles and connecting lines represent paired recordings from individual cells and bars show the population mean ± s.e.m. Data available in Figure 2—source data 1.
-
Figure 2—source data 1
Giant saccular organelle amplifies activity-dependent Δ[Ca2+]i in the AIS.
- https://cdn.elifesciences.org/articles/54566/elife-54566-fig2-data1-v2.xlsx
Figure 3
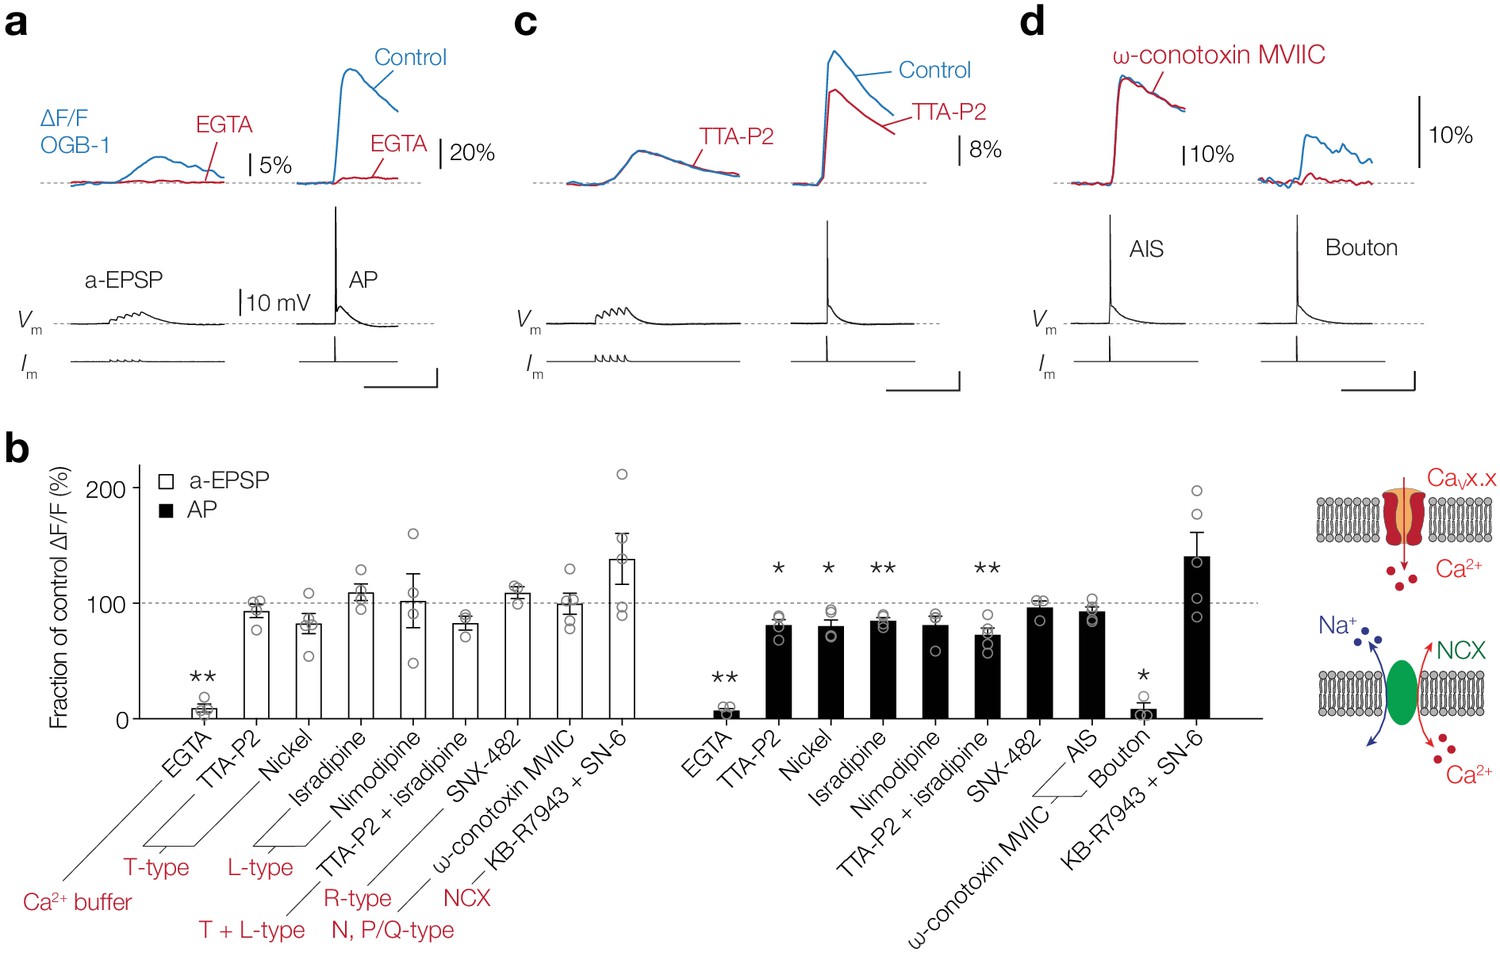
CaV channels play a partial role in activity-dependent Ca2+ entry at the AIS.
(a) Top, example traces of ∆F/F (100 μM OGB-1) in the AIS evoked by an a-EPSP (left) and AP (right), before (blue) and after (red) bath application of EGTA (2.5 mM). Bottom, somatic Vm and current-clamp protocols. Scale bars bottom right, 20 mV, 100 ms. (b) Left, population data for the effect of an extracellular Ca2+ buffer, CaV channel blockers and NCX on the peak ∆[Ca2+]i signal in the AIS in response to an a-EPSP (open bars) and AP stimulation (closed bars). Data are shown as ratio to the pre-drug peak Ca2+ responses measured in the same neuron. One-tailed ratio paired t-tests, *p<0.05 and **p<0.01. Open circles represent individual cells and the bars show the mean ± s.e.m. Right, schematics of Ca2+ entry in the axoplasm via CaV channels (top) or NCX (bottom). (c) Top, example traces of ∆F/F in the AIS evoked by an a-EPSP (left) and AP (right), before (blue) and after (red) bath application of TTA-P2 (1 µM). Bottom, somatic Vm and current-clamp protocols. Scale bar, 20 mV, 100 ms. (d) Top, example traces of ∆F/F evoked by an AP in the AIS (left) and presynaptic bouton of the same neuron (right), before (blue) and after (red) puff application of ω-conotoxin MVIIC (2 µM). Bottom, somatic Vm and current-clamp protocols. Scale bar, 20 mV, 100 ms. Data available in Figure 3—source data 1.
-
Figure 3—source data 1
CaV channels play a partial role in activity-dependent Ca2+ entry at the AIS.
- https://cdn.elifesciences.org/articles/54566/elife-54566-fig3-data1-v2.xlsx
Figure 4
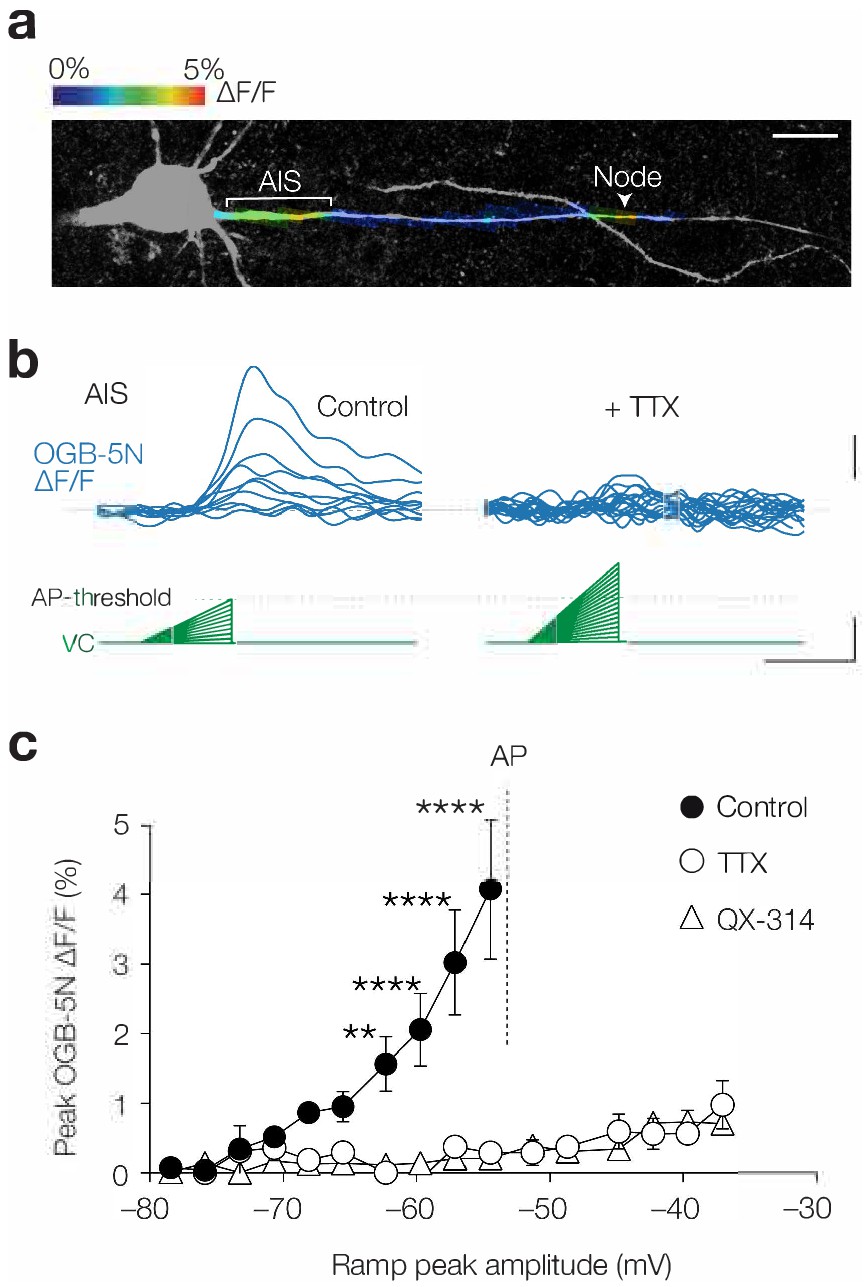
Subthreshold [Ca2+]i changes are TTX sensitive.
(a) Example image of color-coded maximal ∆F/F (1 mM OGB-5N) along the proximal axon in response to a voltage ramp from –78.5 mV to maximally –54.5 mV. Acquisition rate was 125 Hz. The color-coded image is overlaid with a maximal z-projection of a confocal scan of biocytin/streptavidin staining (grey) of the same axon. Note the compartmentalized Ca2+ influx at the AIS and node (indicated by a white arrow). Scale bar, 20 µm. (b) Example traces of OGB-5N ΔF/F reveal increasing Ca2+ responses to voltage ramps with increasing incline in control (left) but not in TTX (1 µM, right). Traces filtered with one-pass binomial (three point). Scale bars, 1% ∆F/F, 10 mV and 50 ms. (c) Population data for maximal OGB-5N ΔF/F versus voltage ramp peaks in control (closed circles, n = 4), in TTX (open circles, n = 4) or QX-314 (open triangles, 6 mM, n = 4). Two-way ANOVA with Tukey’s multiple comparisons test, **p<0.01, ****p<0.0001. AP threshold is indicated with a gray line. Data are shown as mean ± s.e.m. Data available in Figure 4—source data 1.
-
Figure 4—source data 1
Subthreshold [Ca2+]i changes are TTX sensitive.
- https://cdn.elifesciences.org/articles/54566/elife-54566-fig4-data1-v2.xlsx
Figure 5 with 1 supplement
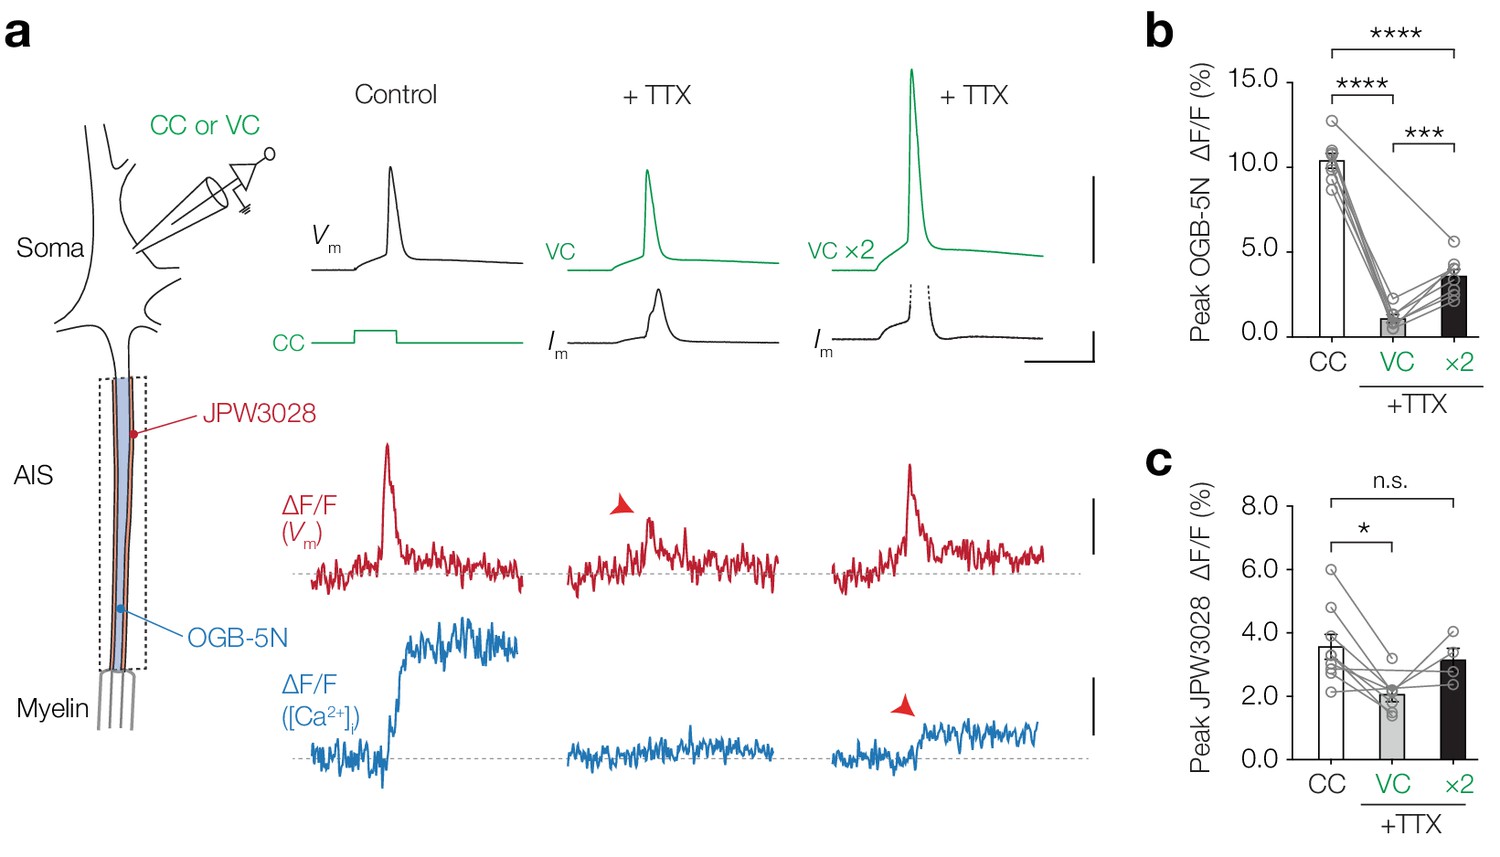
AP-evoked [Ca2+]i changes are TTX sensitive.
(a) Left, schematic of the experimental setup; electrophysiological recording from the soma and fluorescence recording from AIS. Right, example traces from electrophysiology (recorded traces in black, applied commands in green), ∆F/F JPW3028 (red) for voltage imaging and ∆F/F OGB-5N (blue) for Ca2+ imaging. Left panel shows example traces from a current clamp recording, middle panel was performed in AP-clamp in the presence of TTX (1 µM) and right panel was performed in AP-clamp scaled two-fold (VC ×2) in the presence of TTX. The JPW3028 and OGB-5N experiments were performed in separate cells. Scale bars from top to bottom, 100 mV, 5 nA, 5 ms, 2% ∆F/F and 5% ∆F/F. (b) Peak OGB-5N ΔF/F in response to an AP (n = 8), AP clamp + TTX (VC, n = 7) and double AP clamp + TTX (VC ×2, n = 8). One-way ANOVA with Tukey’s multiple comparisons test, ***p=0.0005, ****p<0.0001, n = 8. Circles and connecting lines represent paired recordings in individual cells and bars show the population mean ± s.e.m. (c) Peak JPW3028 ΔF/F in response to an AP (n = 9), AP clamp + TTX (VC, n = 7) and double AP clamp + TTX (VC ×2, n = 4). One-way ANOVA with Tukey’s multiple comparisons test, *p=0.014. Circles and connecting lines represent paired recordings in individual cells and bars show the population mean ± s.e.m. Data available in Figure 5—source data 1. See also Figure 5—figure supplement 1.
-
Figure 5—source data 1
AP-evoked [Ca2+]i changes are TTX sensitive.
- https://cdn.elifesciences.org/articles/54566/elife-54566-fig5-data1-v2.xlsx
Figure 5—figure supplement 1
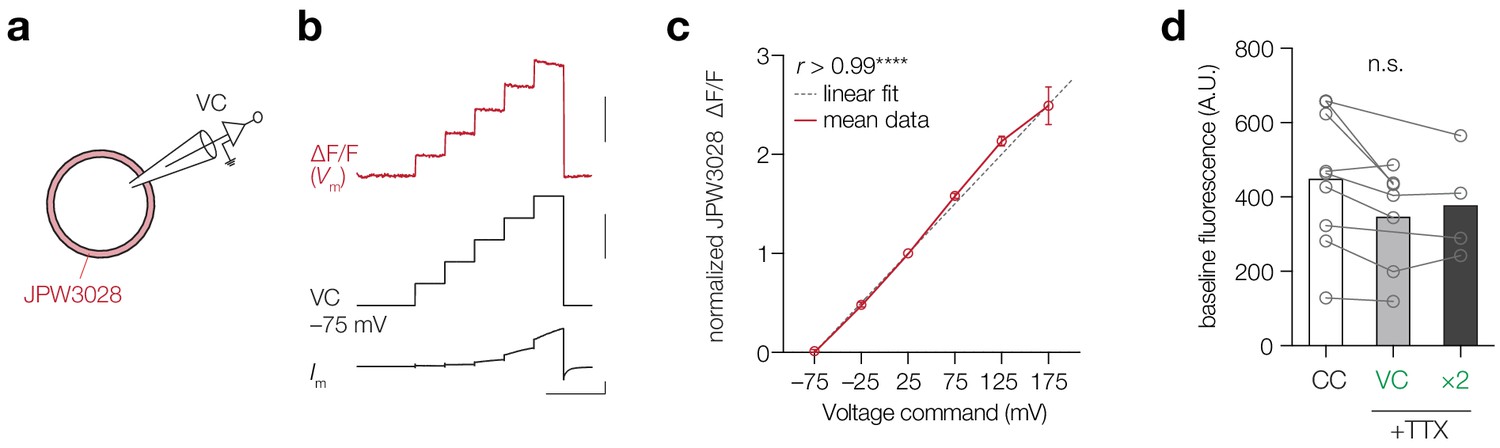
JPW3028 fluorescence linearly increases with membrane potential over a wide range of voltages.
(a) Schematic of the experiment; whole-cell voltage clamp of HEK-293 cells filled with 0.8 mM JPW3028. (b) Top, example ∆F/F JPW3028 trace (red), middle, voltage command potentials, bottom, recorded current. Slow outward rectification was visible with depolarizing steps > 150 mV. Scale bars, from top to bottom: 1% ∆F/F, 100 mV, 2 nA, 200 ms. (c) Mean ∆F/F of the first 20 frames of each voltage step normalized to ∆F/F of the 100 mV step plotted versus the applied voltage revealed a highly linear relationship between Vm and ∆F/F, with r indicating Pearson’s correlation coefficient, ****p<0.0001, n = 3. Grey dotted line is a linear fit between voltage –75 and +25 (approximate Vm range of an AP), data plotted as mean (red line and open circles)± s.e.m. (d) The baseline fluorescence of JPW presented in Figure 5 remained stable throughout the recording. One-way ANOVA, p=0.45, Tukey’s multiple comparisons test, CC (n = 9) vs. VC (n = 7), p=0.44, CC vs. VC × 2 (n = 4), p=0.74, VC vs. VC × 2, p=0.95. Data available in Figure 5—source data 1.
Figure 6 with 1 supplement
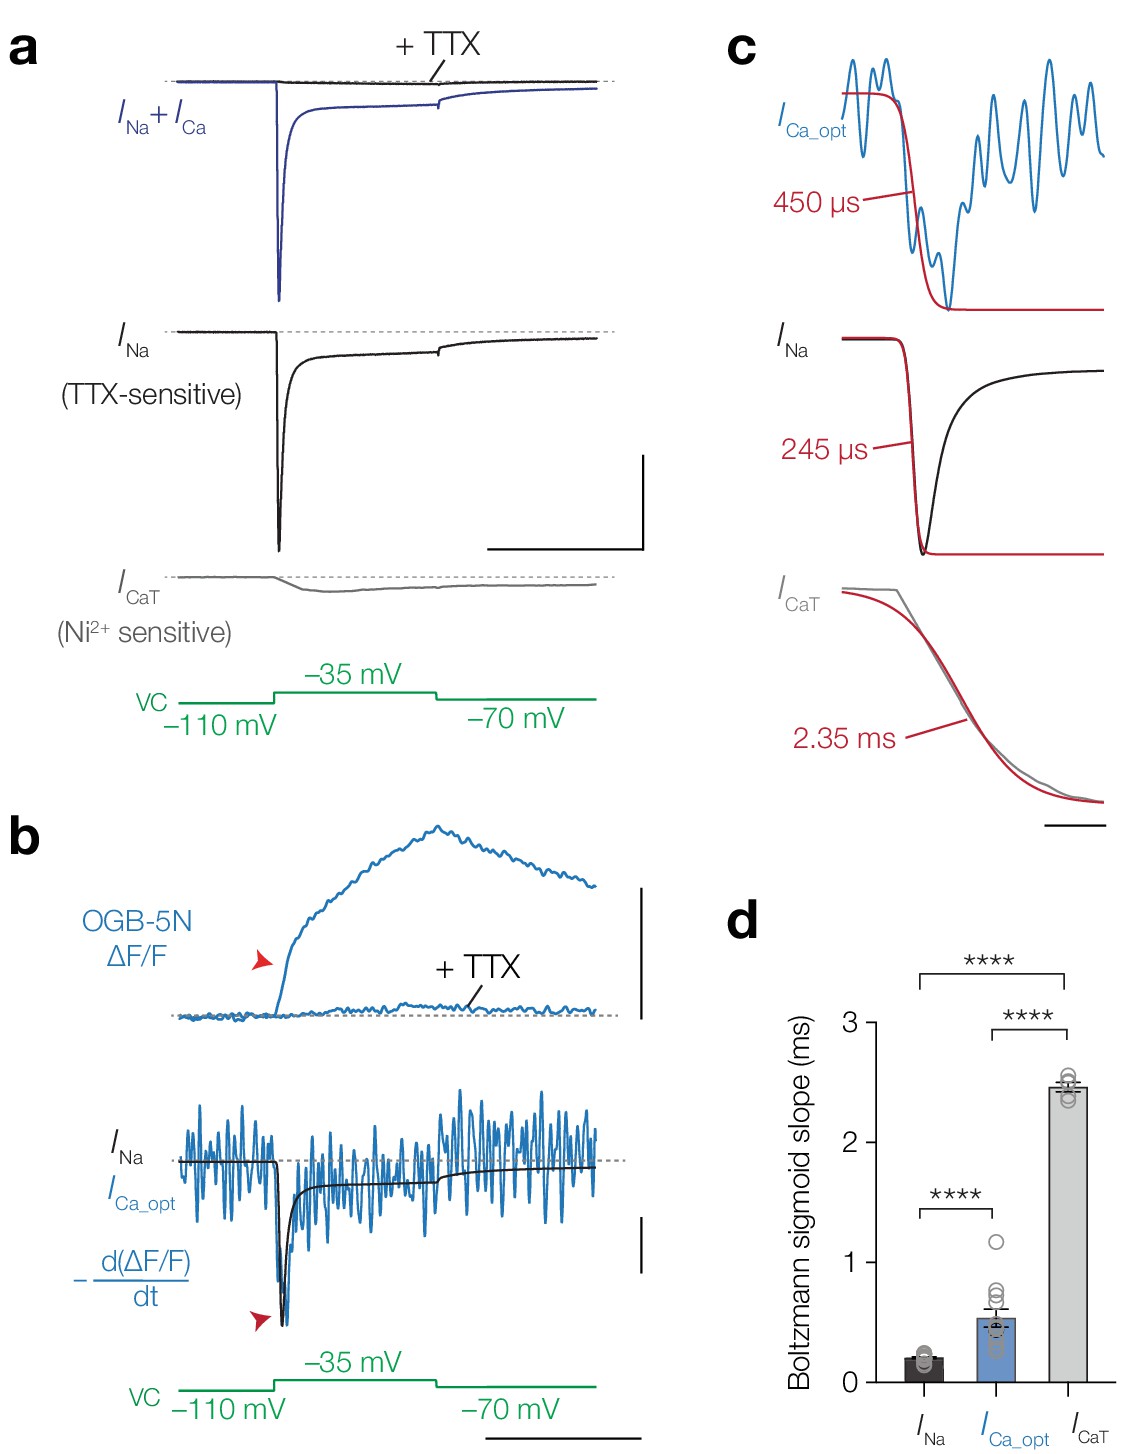
Temporal derivative of AIS [Ca2+]i mirrors the opening kinetics of NaV channels.
(a) Top to bottom, total inward current in response to a voltage-clamp step to –35 mV (blue) and after application of 1 μM TTX (black), INa; the difference between the total current and the TTX-sensitive current, ICaT, obtained after application of 100 μM Ni2+, voltage clamp protocol (green). Scale bars, 10 nA and 50 ms. (b) Top to bottom: ΔF/F OGB-5N of an AIS imaged at 20 kHz before and after application of 1 μM TTX, the electrically recorded somatic INa of the same neuron overlaid with the first temporal derivative of ΔF/F (–d(ΔF/F) dt-1) representing ICa_opt, voltage clamp protocol. Optically and electrically recorded traces filtered with a 3-point binomial filter for 100 iterations. Red arrows indicate the rapid component visible in the ΔF/F and in the overlaid INa and ICa_opt. Scale bars, 20% ΔF/F, 10%–1/6.3 nA and 50 ms. (c) Top to bottom: ICa_opt, INa and ICaT fit with a Boltzmann sigmoid function (red). Slope values are indicated. Scale bar, 5 ms. (d) Population data for the slope values for INa (n = 17), ICa_opt (n = 10) and ICaT (n = 5). One-way ANOVA with Tukey’s multiple comparisons test, ****p<0.0001. Open circles represent individual cells, bars indicate the population mean ± s.e.m. Data available in Figure 6—source data 1. See also Figure 6—figure supplement 1.
-
Figure 6—source data 1
Temporal derivative of AIS [Ca2+]i mirrors the opening kinetics of NaV channels.
- https://cdn.elifesciences.org/articles/54566/elife-54566-fig6-data1-v2.xlsx
Figure 6—figure supplement 1
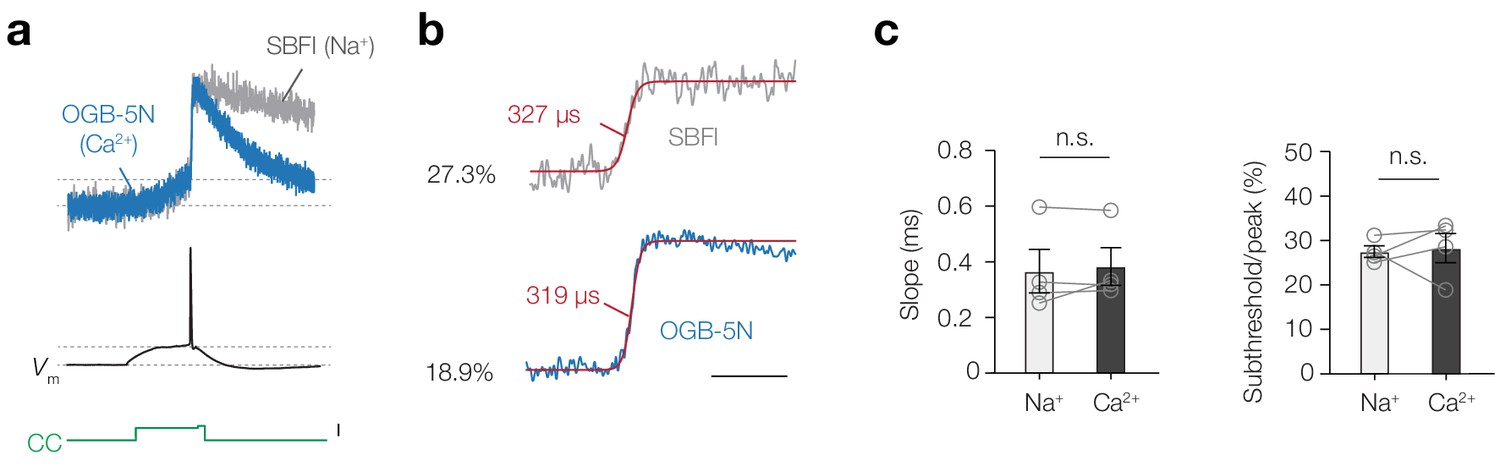
AP-evoked Ca2+ and Na+ entry follow identical kinetics.
(a) Neurons were co-loaded with OGB-5N (1 mM) and SBFI (1 mM) indicators to acquire Ca2+ (blue) and Na+ (grey) signals from the same AIS region at a rate of 20 kHz. The current-clamp step protocol (green) consisted of a 50 ms subthreshold square pulse followed by a brief 5 ms pulse at the end triggering an AP. Both subthreshold and AP evoked signals are visible for [Ca2+]i and [Na+]i. Scale bar, 500 pA. (b) The example traces from a. fitted with a sigmoidal function (red) with slopes values indicated (red). The percentages indicate the subthreshold-activated fraction of ion flux (ΔF/F prior to the AP normalized peak ΔF/F). Scale bar, 10 ms. (c) Population data of the rise times and subthreshold/peak ratio difference of Ca2+ and Na+ indicators. Slope, Wilcoxon matched-pairs signed rank test, n = 4, p>0.999, ratio subthreshold to peak, two-tailed paired t-test, n = 4, p=0.83. Open circles and connecting lines represent individual cells and bars show the mean ± s.e.m. Data available in Figure 6—source data 1.
Figure 7
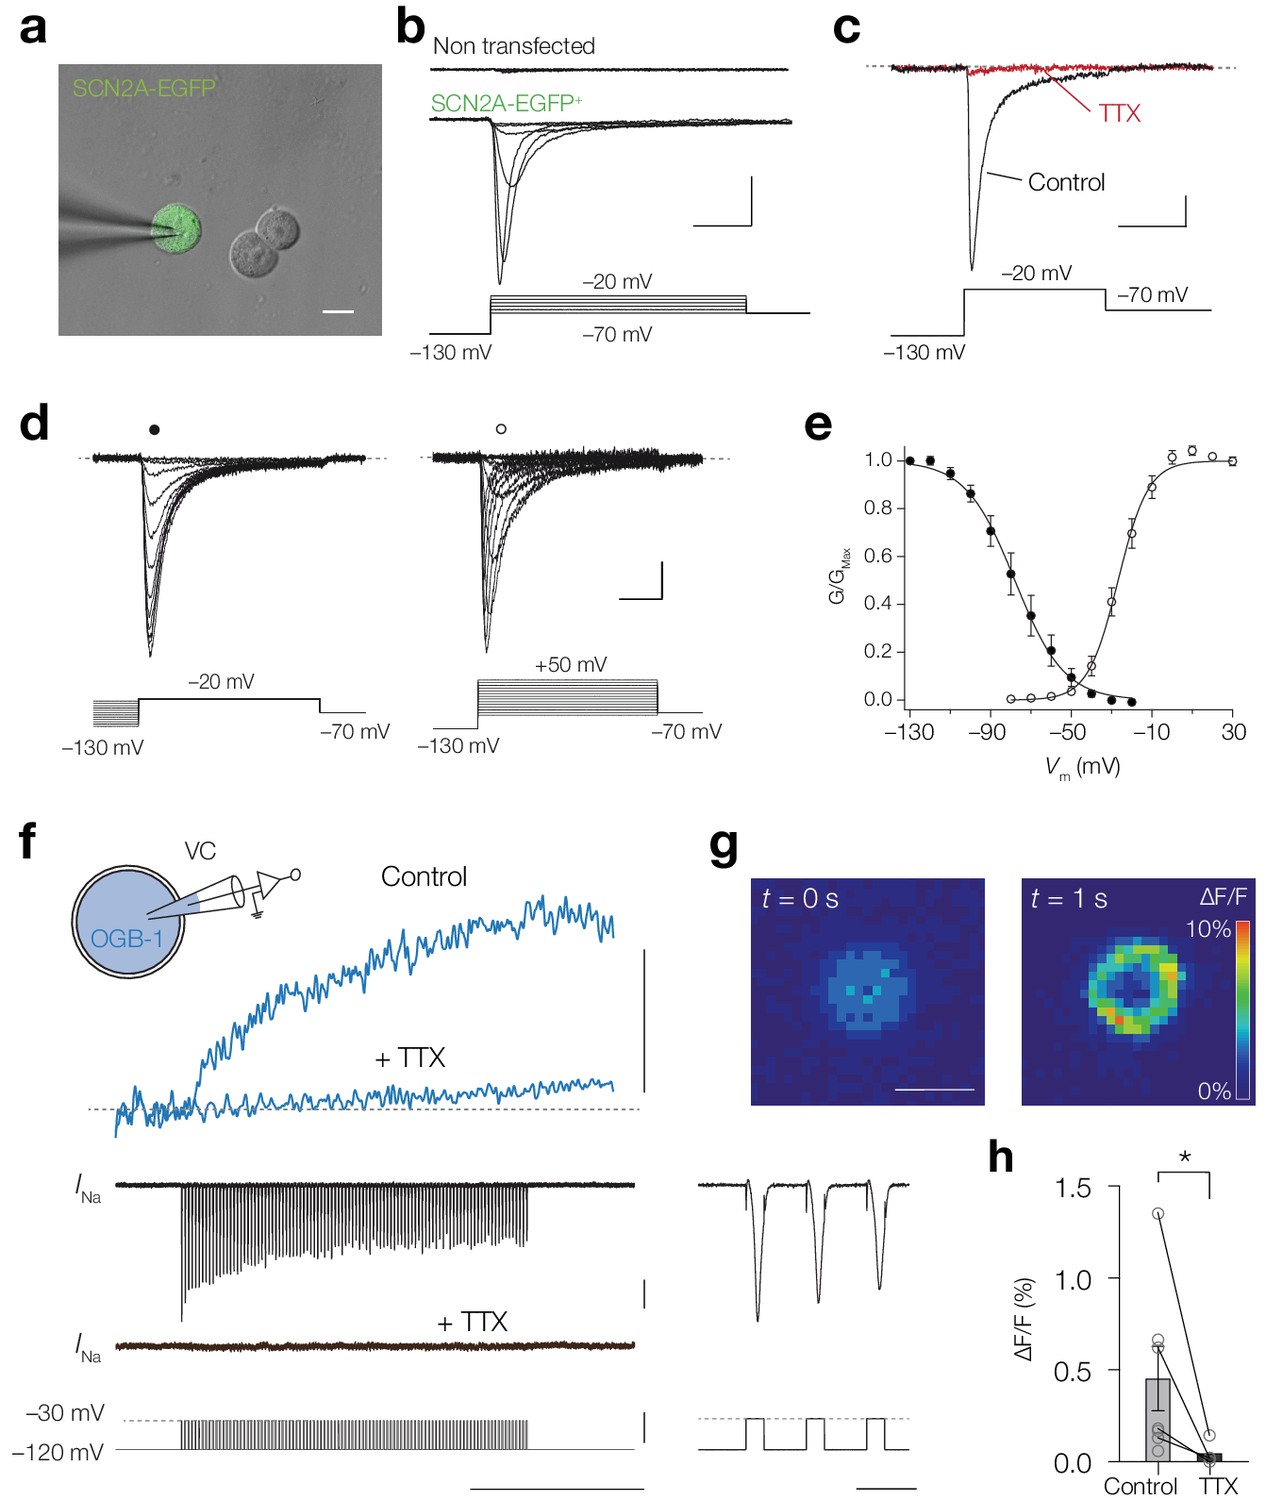
NaV1.2 channels mediate a Ca2+ influx.
(a) Combined brightfield and fluorescence image of a whole-cell recording from a SCN2A-EGFP+ HEK-293 cell (green). Scalebar, 10 μm. (b) Example traces of INa recorded in response to depolarizing voltage command potentials (bottom) for a non-transfected (top) and SCN2A-EGFP+ cell (middle), scale bars indicate 0.5 nA and 5 ms. (c) Peak INa traces before (black) and after TTX application (red) in response to a depolarizing voltage step (bottom), scale bars indicate 100 pA and 10 ms. (d) Example current traces of steady-state inactivation (left) and activation protocols (right), scale bars indicated 100 pA and 5 ms. (e) Population data for steady-state activation and inactivation curves, circles and error bars indicate mean ± s.e.m. Lines represent Boltzmann fits to the mean data. (f) Schematic of the experiment: a SCN2A-EGFP+ HEK-293 cell was recorded in voltage-clamp and filled with OGB-1 (0.1 mM) after which a train of depolarizing pules (–120 to –30 mV, 200 Hz, 1 s) was applied, top to bottom, ΔF/F before and after bath application of 1 μM TTX (blue), the recorded currents and voltage command potentials, right, magnification of the first three action currents, scale bars from top to bottom represent 1% ΔF/F, 0.5 nA, 100 mV, 500 ms and 10 ms. (g) Color-coded average ΔF/F of 100 frames before onset (left) and at the end (right) of the voltage command, scale bar indicates 10 μm. (h) OGB-1 ΔF/F is significantly higher in control (n = 7) than after application of TTX (n = 4), one-tailed Mann Whitney test, p=0.0121. Data available in Figure 7—source data 1.
-
Figure 7—source data 1
NaV1.2 channels mediate a Ca2+ influx.
- https://cdn.elifesciences.org/articles/54566/elife-54566-fig7-data1-v2.xlsx
Figure 8 with 2 supplements
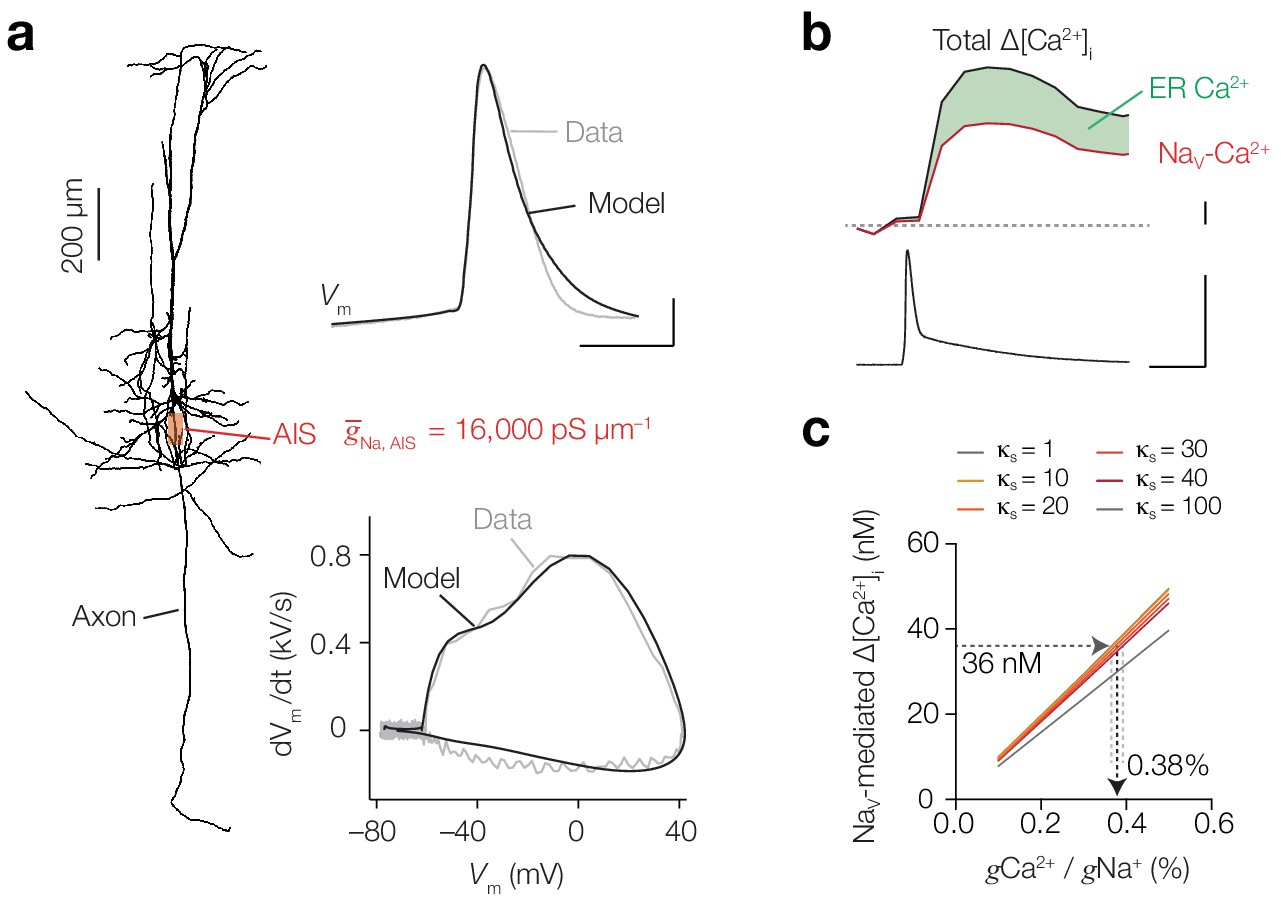
Computational simulation of Ca2+ conductivity by NaV channels predicts a conductivity ratio of 0.38%.
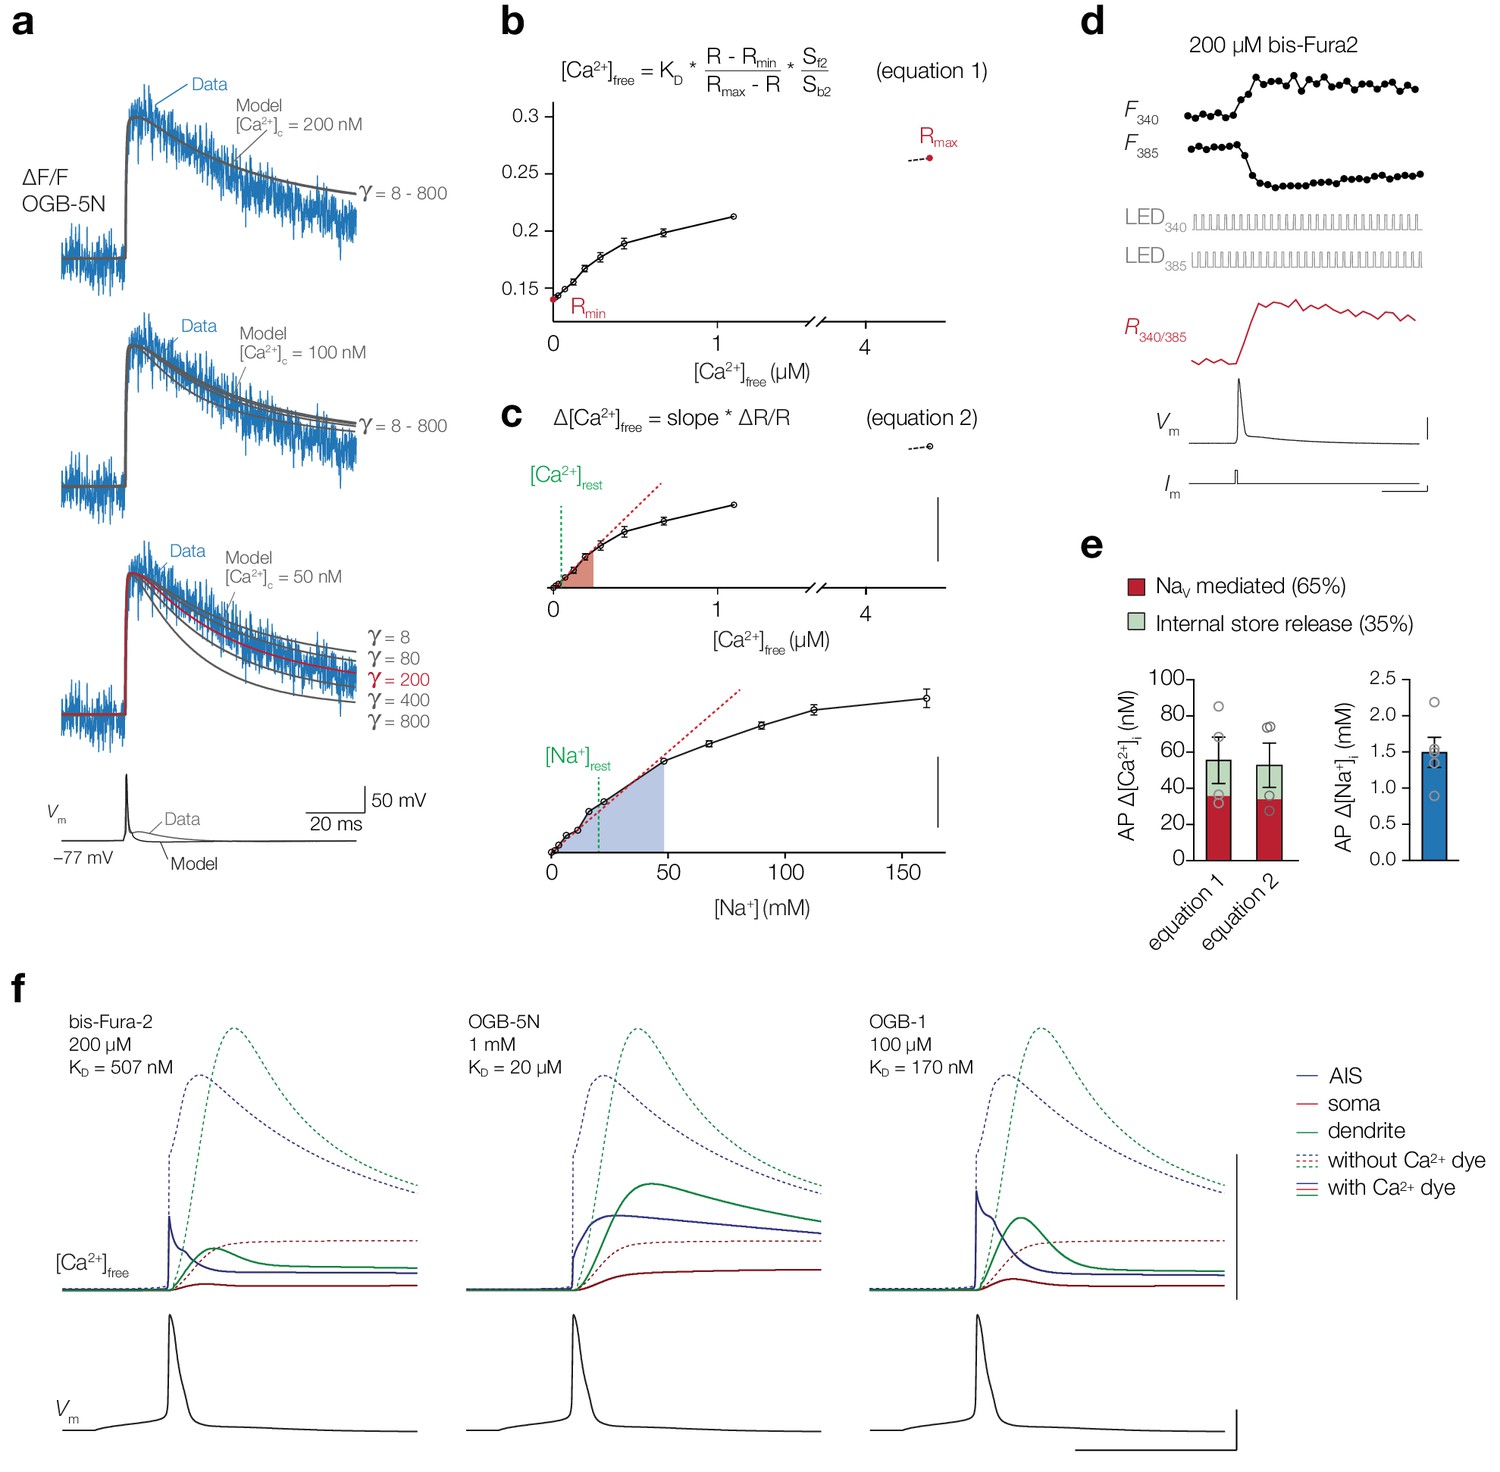
(a) Left, morphology of the conductance-based multi-compartmental model. Right, NaV channel density in the AIS was estimated by optimizing to Δ[Na+]i, Vm (top) and phase-plane plot (bottom) in simulation (black) to the experimental data (gray). Scale bars, 200 µm, 20 mV and 0.5 ms. (b) Example trace of calibrated ratiometric imaging of bis-Fura2 to measure absolute changes in Δ[Ca2+]i in response to a single AP (bottom), the experiment was performed in the presence of T- and L-type CaV blockers, so Δ[Ca2+]i is mediated by Nav channels (red) and amplified by internal store release (35%, green), scale bars indicate 10 nM, 100 mV and 10 ms. (c) Dependence of NaV-mediated peak AP Δ[Ca2+]i on conductance ratio (gCa/gNa) for varying endogenous buffer capacities (κs = 1–100). Δ[Ca2+]i was measured and modeled in a cell with 200 μM bis-Fura-2 present and T- and L-type CaV channels blocked. See also Figure 8—figure supplement 1 and Figure 8—figure supplement 2.
Figure 8—figure supplement 1
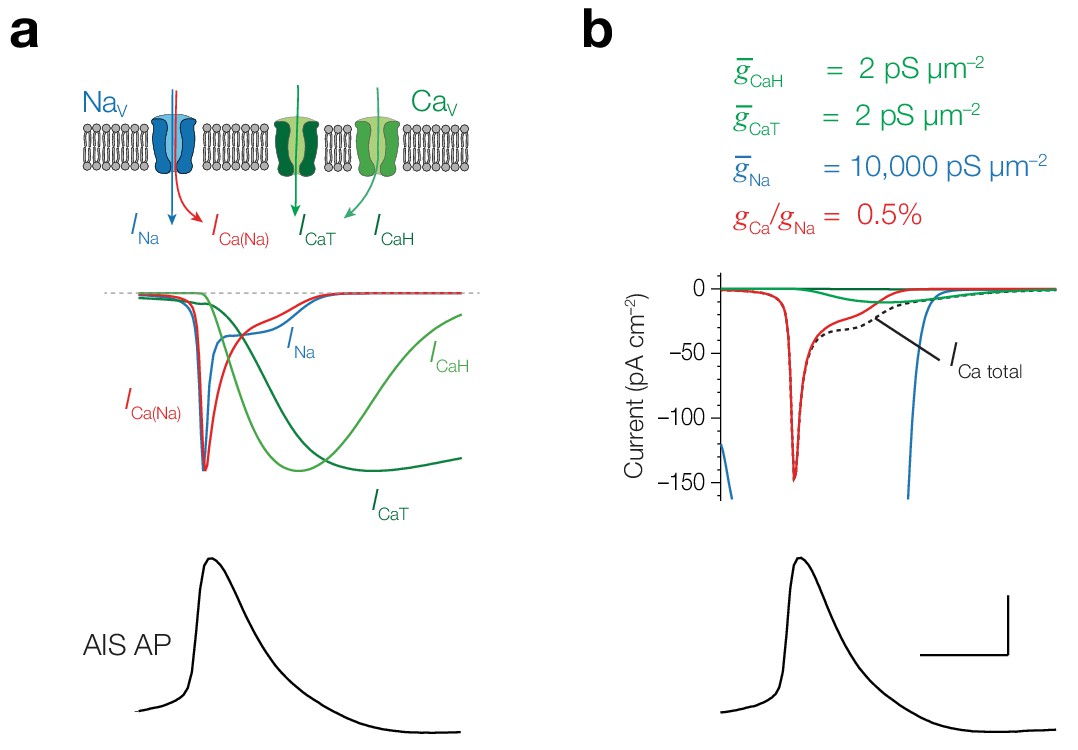
ICa compared to ICa(Na) in a single compartment model.
(a) From top to bottom, schematic of a NaV channel mediating Na+ and Ca2+ current (INa and ICa(Na)) and a CaV channel mediating ICaT and ICaH, peak normalized simulated currents (INa, ICa(Na), ICaH and ICaT) in a single compartment activated by an AIS AP waveform. Currents are normalized to peak amplitude. Note that ICa(Na) is ~10 fold more rapid compared to ICaH and ICaT. The difference in shape of ICa(Na) and INa reflects the different driving forces. Since the equilibrium potential for Ca2+ (+140 mV) is higher than for Na+ (+55 mV), the driving force for ICa(Na) is less affected during the voltage trajectory of the AP. (b) Absolute current amplitudes comparing ICa(Na) to ICaH and ICaT as well as the total ICa for typical channel densities (as noted above) and 0.5% conductivity ratio. INa is clipped to visually compare the Ca2+ currents. Note that ICa(Na) dominates the Ca2+ charge for rapid action potentials. Scale bars, 50 mV and 0.5 ms.
Figure 8—figure supplement 2
Calibration and modeling of [Ca2+]i.
(a) ∆F/F OGB-5N (1 mM, 20 kHz) traces from a representative cell AIS used to optimize Ca2+ extrusion in the model. Imaged ∆F/F (blue) overlaid with the simulated ∆F/F (grey) with varying Ca2+ extrusion thresholds ([Ca2+]c) and flux densities (γ) in the membrane. The optimal fit is indicated in red. (b) Calibration of ratiometric bis-Fura-2 (bF2) signals to solutions with known [Ca2+] to determine KD, Rmin and Rmax used in equation 1, which was subsequently used to convert ratiometric signals into absolute Δ[Ca2+]i. Data shown as mean ± s.e.m (three repetitions). (c) The relationship between changes in fluorescence ratio ΔR/R normalized to the ratio in Ca2+-free or Na+-free solutions, used in equation 2. Data shown as mean ± s.e.m (three repetitions), red dashed line is a linear fit through the mean ΔR/RbF2(0–193 nM, six concentrations) and ΔR/RSBFI(0–48 mM, eight concentrations). Scale bars, 40% and 100%. (d) Example traces of a ratiometric bF2 recording. Top to bottom: fluorescence transients from the AIS upon excitation with 340 and 385 nm (average of 38 trials), TTL pulses triggering the LEDs, fluorescence ratio R340/385, somatic AP and current injection. Scale bars, 40 mV, 4 nA and 10 ms. (e) Absolute increase in [Ca2+]i and [Na+]i in the AIS after 1 AP in the presence of 200 µM bF2 and 1.5 mM SBFI, respectively, separate for the 2 Ca2+ calibration methods from b and c. Bar and error bars represent the mean ± s.e.m., open circles are individual cells. (f) Simulation of distinct Ca2+ dyes on the [Ca2+]i, adjusting the KD and concentration of the simulated exogenous buffer, shown for the AIS (blue), soma (red) and dendrites (green) (locations as specified in Figure 9a) in response to an AP (bottom). Note that OGB-5N, due to its low-affinity, buffers [Ca2+]i more linear in comparison to bis-Fura-2 and OGB-1. Scale bars from top to bottom, 500 nM, 50 mV and 5 ms.
Figure 9
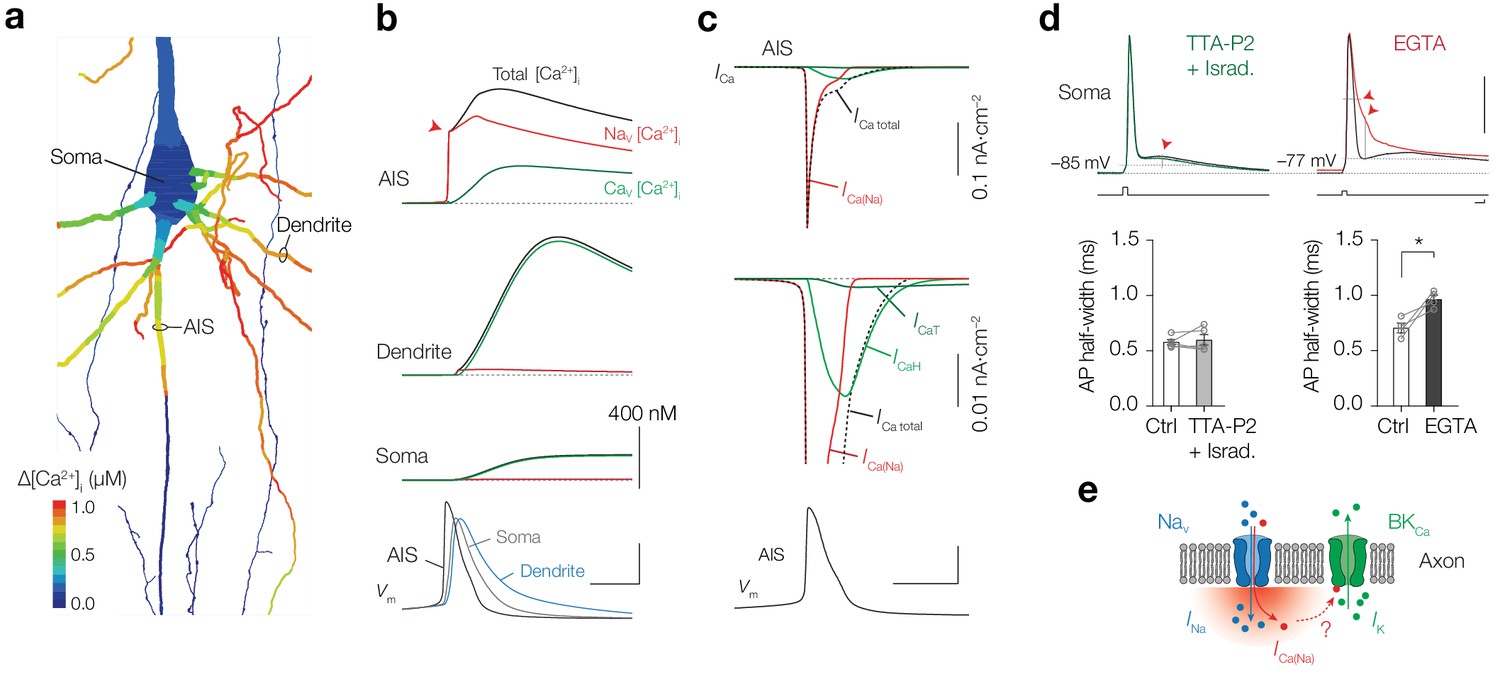
NaV channels produce submillisecond near-micromolar [Ca2+]i at the AIS.
(a) Color coded shape plot of simulated [Ca2+]i in the axon, dendrites and soma activated by an AP in current clamp without Ca2+ indicator. (b) The modeled [Ca2+]i in the AIS, Soma and Dendrite (locations specified in a). The total [Ca2+]i (black) is divided in a NaV (red) and CaV (green) channel mediated fraction. Bottom, Vm in the same compartments. Scale bars, 400 nM for all [Ca2+]i plots, 50 mV and 1 ms. (c) Top, ICa in response to an AP (bottom) in the AIS. Middle, ICa on expanded scale. Ca2+ extrusion contributes to ICa total, but is not shown. Scale bars bottom, 50 mV and 1 ms. (d) Top, example traces of somatic APs in control (black) and after bath application of TTA-P2 and Isradipine (green, left) and EGTA (red, right). Resting membrane potential and AP voltage threshold are indicated by the dotted grey lines. Red arrows indicate the significant changes in ADP (with TTA-P2 + Isradipine) and AP width and AHP (with EGTA). Capacitance transients are removed for clarity. Scale bars indicate 50 mV, 2.5 nA, 1 ms. Bottom, population data of AP half-width before and after blocking T– and L–type CaV channels (left, p=0.61, two-tailed paired t-test, n = 5) and before and after preventing Ca2+ influx by bath application of EGTA (right, *p=0.035, two-tailed paired t-test, n = 4), see also Table 1. (e) Schematic of Ca2+ permeation through a NaV channel activating a Ca2+–dependent BK channel.
Tables
Table 1
Effect of Ca2+ entry on AP waveform.
| RMP (mV) | AP threshold (mV) | AP amplitude (mV) | AP half-width (μs) | AHP (mV) | ADP (mV) | |
|---|---|---|---|---|---|---|
| Control | –77.4 ± 2.5 | –67.1 ± 3.0 | 110.9 ± 12.5 | 612.7 ± 24.7 | 5.6 ± 2.1 | 7.6 ± 2.5 |
| TTA-P2 + isradipine | –76.0 ± 2.9 | –65.0 ± 4.1 | 109.3 ± 3.3 | 634.5 ± 49.6 | 3.2 ± 2.9 | 4.6 ± 3.3 |
| Paired t-tests (n = 5) | p=0.32 | p=0.30 | p=0.33 | p=0.61 | p=0.055 | p=0.039* |
| Control | –70.4 ± 1.6 | –59.3 ± 3.9 | 102.4 ± 1.8 | 753.8 ± 45.9 | 3.7 ± 3.8 | 6.5 ± 3.4 |
| EGTA | –71.8 ± 3.6 | –65.4 ± 1.8 | 103.5 ± 2.4 | 1031.5 ± 39.6 | 25.5 ± 4.3 | 11.7 ± 1.5 |
| Paired t-tests (n = 4) | p=0.69 | p=0.19 | p=0.27 | p=0.035* | p=0.043* | p=0.17 |
-
Overview of mean and s.e.m. of AP properties compared between control and toxin experiments recorded at the soma. RMP, resting membrane potential, AHP, fast afterhyperpolarization, ADP, afterdepolarization. The APs were elicited by large and brief current injections (~6 nA for 0.5 ms) to obtain temporally aligned APs between trials and image OGB-1 fluorescence (Figure 3). AP amplitude, AHP and ADP were measured relative to the AP threshold. If the AHP or ADP was not detectable as a local peak, the membrane potential at the time point as in control was used (see EGTA example Figure 9d). P values are results of two-tailed paired t-tests before and after toxin application. Data available in Table 1—source data 1.
-
Table 1—source data 1
Effect of Ca2+ entry on AP waveform.
- https://cdn.elifesciences.org/articles/54566/elife-54566-table1-data1-v2.xlsx
Key resources table
| Reagent type (species) or resource | Designation | Source or reference | Identifiers | Additional information |
|---|---|---|---|---|
| Gene (human) | SCN2A | Genscript, USA (Ben-Shalom et al., 2017) | ||
| Gene (human) | SCN1B/SCN2B | Genscript, USA (Ben-Shalom et al., 2017) | ||
| Cell line (Homo-sapiens) | HEK-293T/17 | ATCC | Cat#: CRL-11268, RRID:CVCL_1926 | |
| Commercial assay or kit | GeneJET Plasmid Maxiprep kit | ThermoFisher, USA | Cat#: K0491 | |
| Chemical compound, drug | Ryanodine | Tocris | Cat#: 1329 | |
| Chemical compound, drug | Heparin | Tocris | Cat#: 2812 | |
| Chemical compound, drug | TTA-P2 | Alomone | Cat#: T-155 | |
| Chemical compound, drug | Isradipine | Tocris | Cat#: 2004 | |
| Chemical compound, drug | Nickel | Sigma | Cat#: N6136 | |
| Chemical compound, drug | Nimodipine | Tocris | Cat#: 0600/100 | |
| Chemical compound, drug | SNX-482 | Tocris | Cat#: 2945 | |
| Chemical compound, drug | ω-conotoxin MVIIC | Tocris | Cat#: 1084 | |
| Chemical compound, drug | KB-R7943 | Tocris | Cat#: 1244 | |
| Chemical compound, drug | SN-6 | Tocris | Cat#: 2184 | |
| Chemical compound, drug | TTX | Tocris | Cat#: 1069 | |
| Chemical compound, drug | QX-314 | Alomone | Cat#: Q-150 | |
| Chemical compound, drug | EGTA | Sigma | Cat#: E0396 (low extracellular Ca2+), Cat#: 3777 (HEK-cell experiments) | |
| Chemical compound, drug | CNQX | HelloBio | Cat#: HB0205 | |
| Chemical compound, drug | D-AP5 | HelloBio | Cat#: 0225 | |
| Chemical compound, drug | ZD-7288 | Tocris | Cat#: 1000 | |
| Chemical compound, drug | XE991 | Tocris | Cat#: 2000 | |
| Chemical compound, drug | Gabazine | Sigma | Cat#: S106 | |
| Chemical compound, drug | OGB-5N | Invitrogen | Cat#: O6812 | |
| Chemical compound, drug | OGB-1 | Invitrogen | Cat#: O6806 | |
| Chemical compound, drug | Bis-Fura2 | Biotium | Cat#: 50045 | Discontinued |
| Chemical compound, drug | SBFI | Invitrogen | Cat#: 10033152 | |
| Chemical compound, drug | JPW3028 | Potentiometric Probes | JPW3028 | |
| Antibody | anti-synaptopodin (Rabbit polyclonal) | Sigma | Cat#: S9442, RRID:AB261570 | (1:500) |
| Antibody | Anti-ankyrinG (mouse monoclonal) | Neuromab | Cat#: 75–146, RRID:AB_10673030) | (1:100) |
| Antibody | Anti-βIV spectrin (mouse monoclonal) | Neuromab | Cat#: 75–377, RRID:AB_2315818) | (1:250) |
| Other | streptavidin Alexa-488 conjugate | Invitrogen | Cat#: S32354, RRID:AB_2315383 | (1:500) |
| Software, algorithm | Neuroplex | RedShirt Imaging | RRID:SCR_016193 | |
| Software, algorithm | Axograph | Axograph | RRID:SCR_014284 | Version 1.7.0 |
| Software, algorithm | GraphPad Prism | GraphPad Prism | RRID:SCR_002798 | Version 8.4.2 |
| Software, algorithm | FIJI | Schindelin et al., 2012 | RRID:SCR_002285 | |
| Software, algorithm | μManager | Edelstein et al., 2014 | RRID:SCR_016865 | |
| Software, algorithm | NEURON | Hines and Carnevale, 2001 | RRID:SCR_005393 | |
| Software, algorithm | Maxchelator | Bers et al., 2010 | RRID:SCR_000459 | |
| Software, algorithm | FrameSplitter | Battefeld et al., 2018 | https://github.com/Kolelab/Image-analysis |
Additional files
Download links
A two-part list of links to download the article, or parts of the article, in various formats.
Downloads (link to download the article as PDF)
Open citations (links to open the citations from this article in various online reference manager services)
Cite this article (links to download the citations from this article in formats compatible with various reference manager tools)
Ca2+ entry through NaV channels generates submillisecond axonal Ca2+ signaling
eLife 9:e54566.
https://doi.org/10.7554/eLife.54566


