Approaching boiling point stability of an alcohol dehydrogenase through computationally-guided enzyme engineering
- Molecular Enzymology Group, University of Groningen, Netherlands
- Department of Biology and Biotechnology “L. Spallanzani”, University of Pavia, Italy
- MRC Laboratory of Molecular Biology, Francis Crick Avenue, Cambridge Biomedical Campus, United Kingdom
- c-LEcta GmbH, Germany
Figures
Figure 1
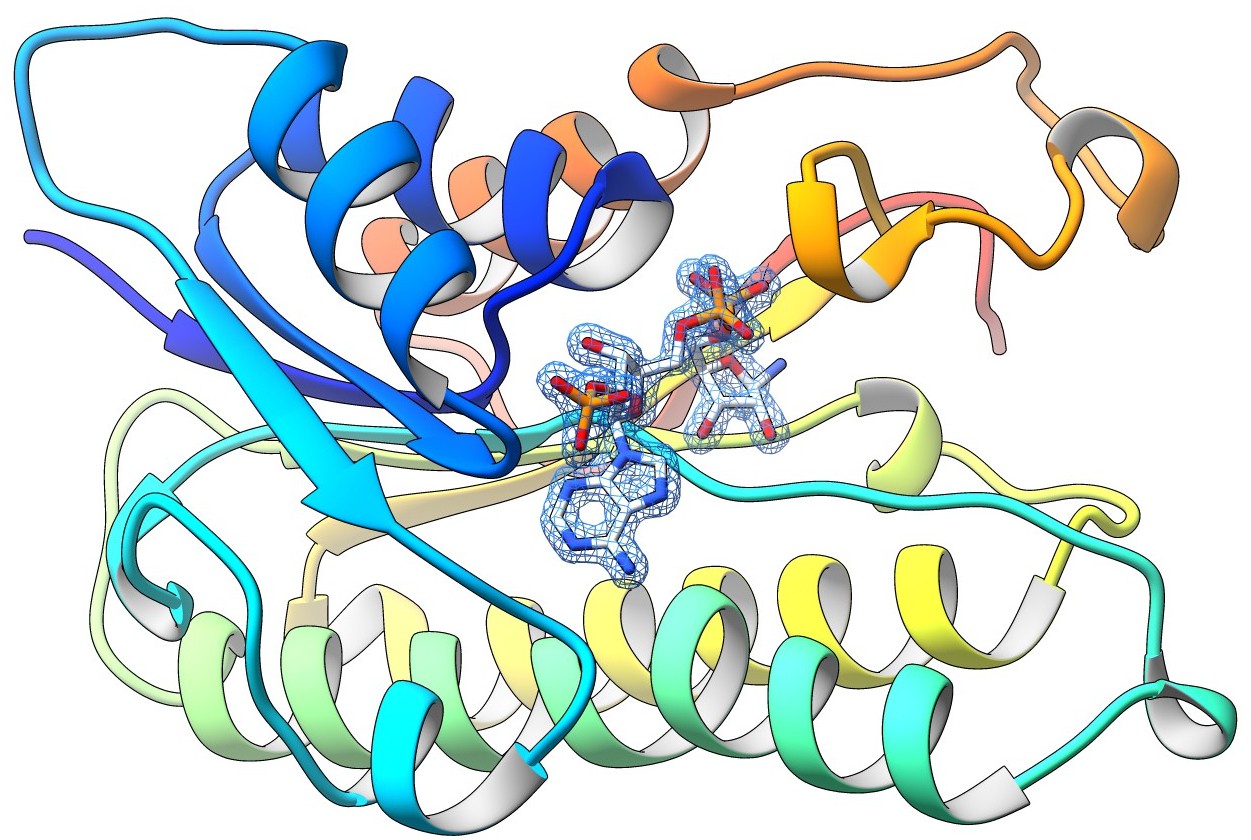
The crystal structure of ADHA.
The figure highlights the final weighted 2Fo-Fc map for NADP+ bound to a subunit of the wild-type ADHA (subunit A, contour level 1.2 σ). The nicotinamide moiety of the cofactor is disordered and was not included in the final model.
Figure 2 with 1 supplement

Difference in Tm for 151 FRESCO-predicted ADHA mutants.
The average of two measurements is given and the standard error. The Tm of wild-type ADHA is 43 °C (set as 0). The 10 stabilizing mutations with a red bar were combined. Melting curves of wild type and the final mutant (M9*) are depicted in Figure 2—figure supplement 1.
Figure 2—figure supplement 1
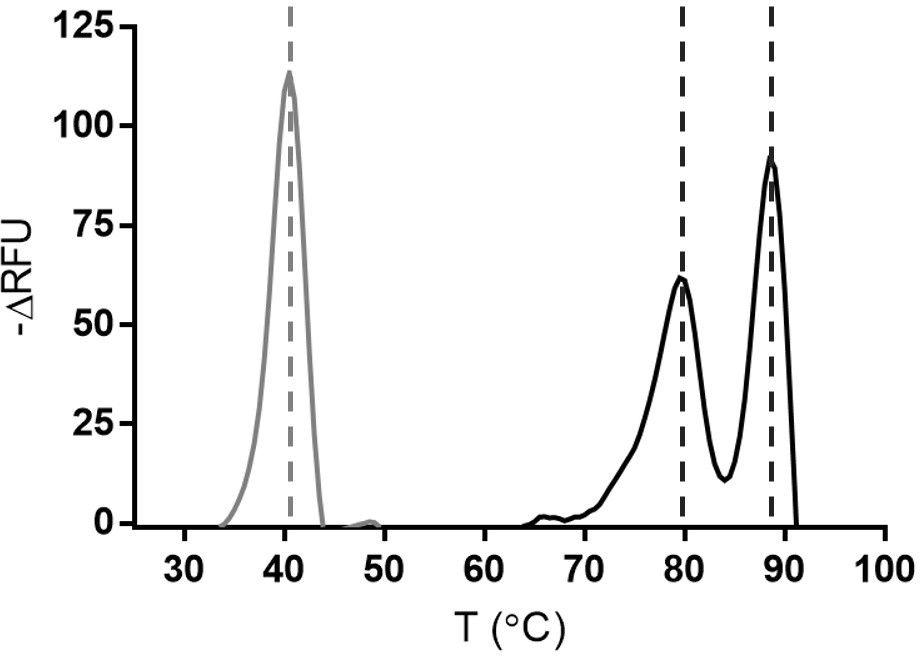
Melting curves.
Apparent melting temperatures of wild type (in grey) and M9* variant. RFU = relative fluorescence units. M9* displays a first melting peak at 79 °C, second peak at 88 °C. One curve is shown from three technical replicates.
Figure 3
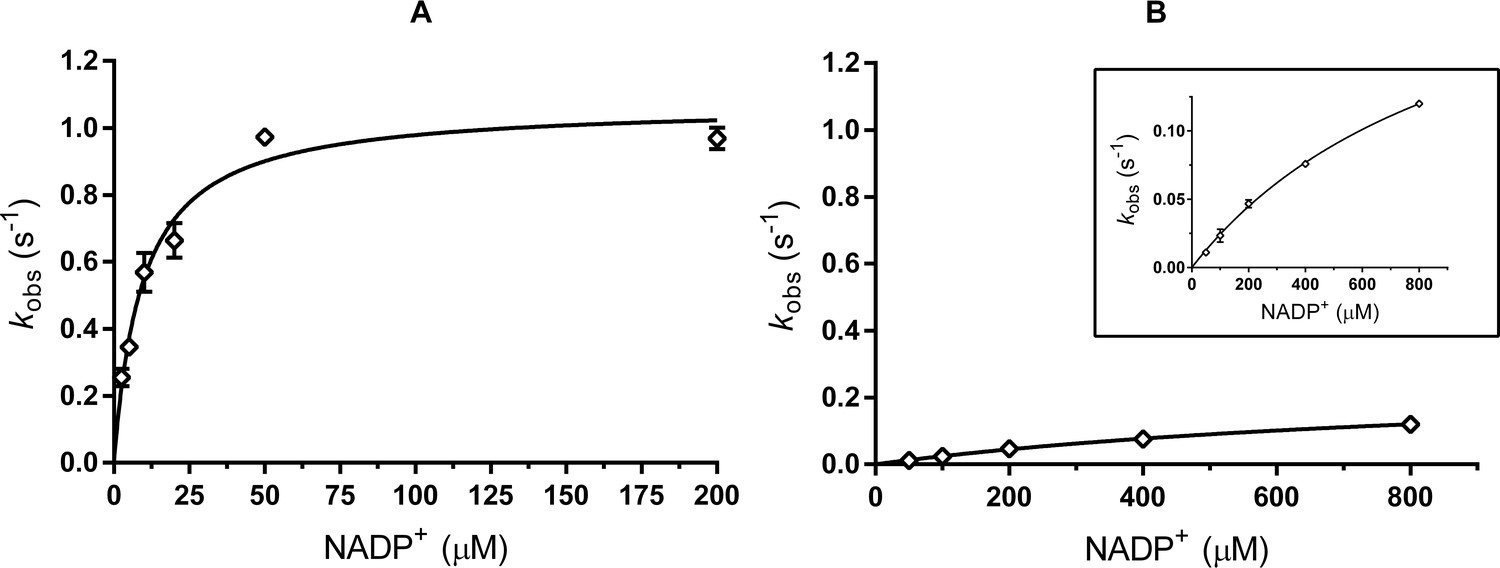
Michaelis-Menten plots for kinetics with NADP+.
(A) ADHA wild type (B) M9 mutant. Note that the X-axis scaling is different. The inset of B presents the same data with a different Y-axis scaling. Plots are fitted with Michaelis-Menten in GraphPad prism 6.07.
Figure 4
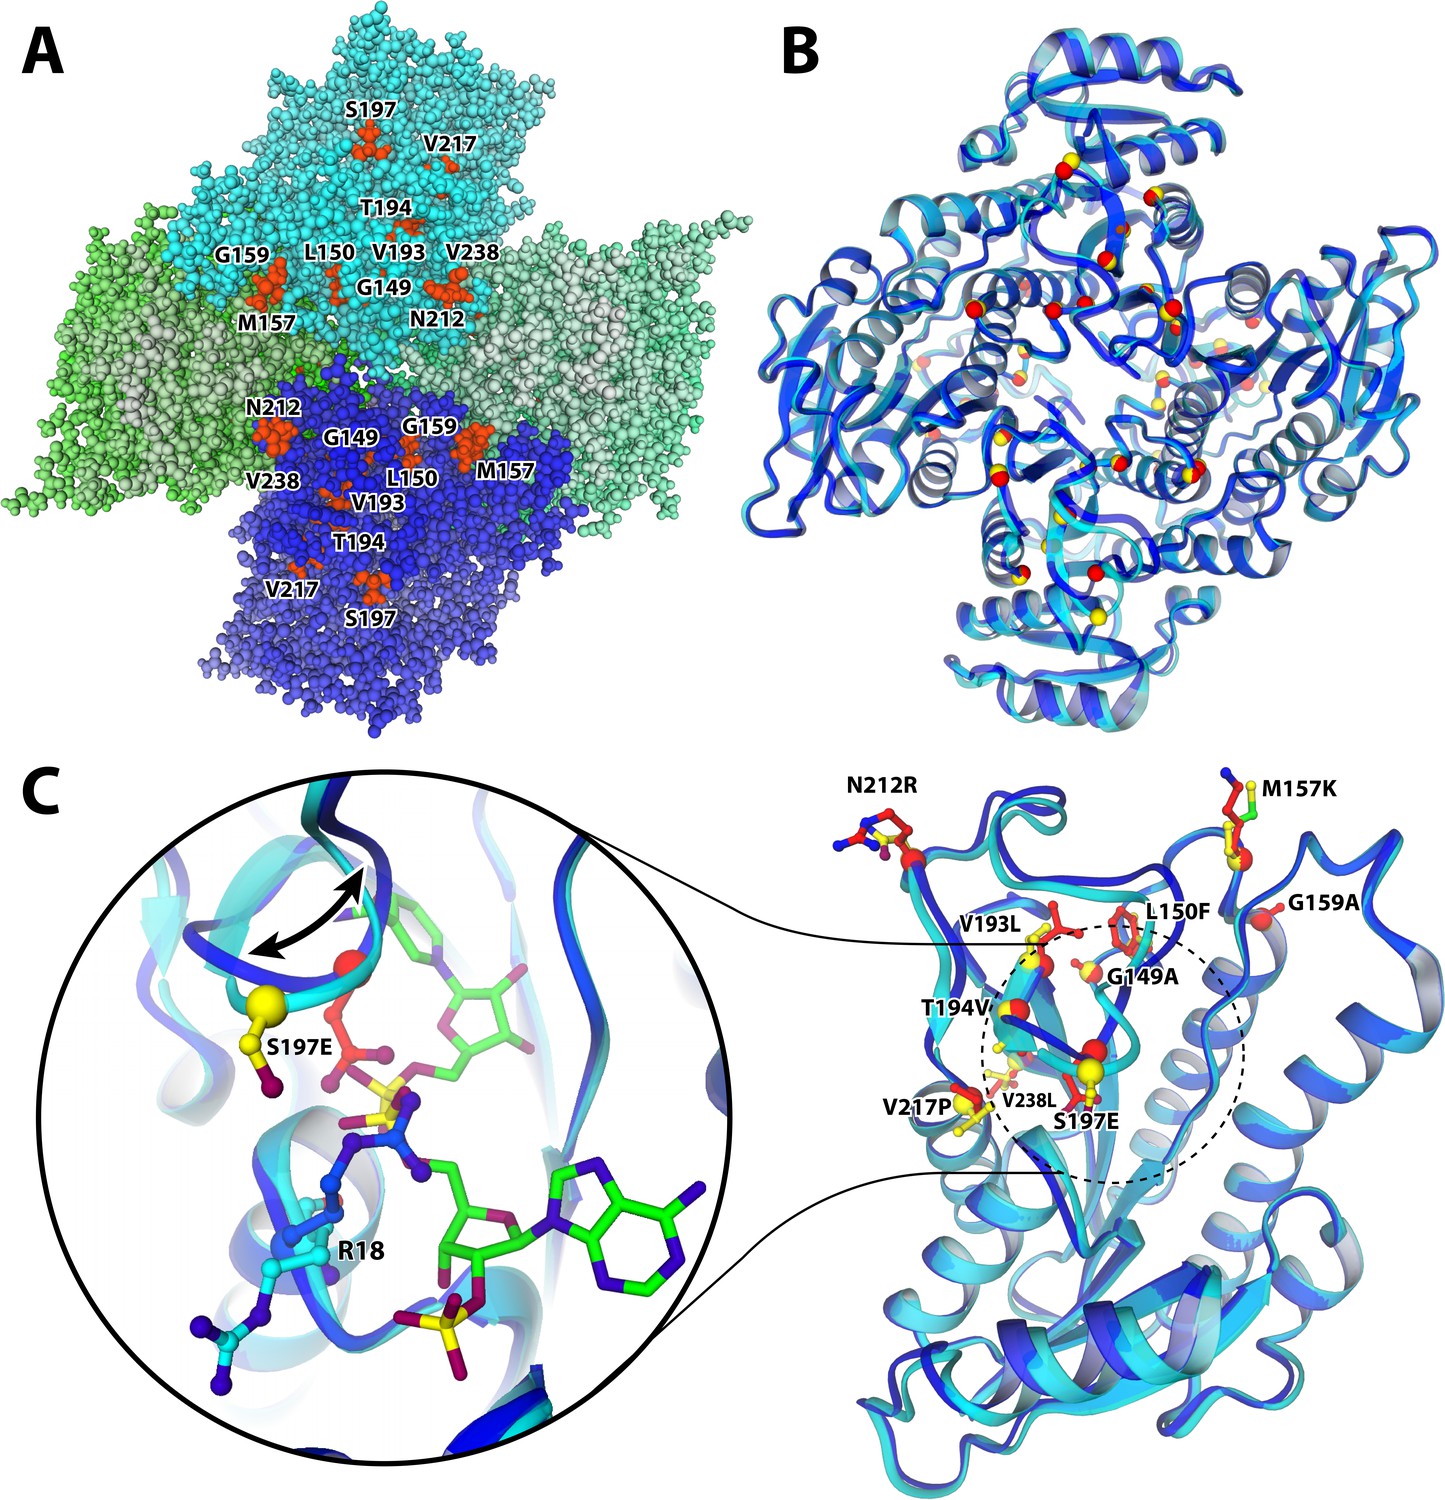
Structure of the M9 mutant of ADHA with mutated resides highlighted.
(A and B) quaternary structure of M9. The tetramer is organized such that the N-termini are on the outside (on the edge of the top-down view of A and B), whereas the C-termini all point inwards; which is where most and the most stabilizing mutations were found. (A) M9 structure with all atoms represented as balls. The four monomers are shaded in various colours, highlighting the particular clustering of the observed stabilizing mutations. (B) The structure as ribbon model, superimposing the mutant (blue ribbon, red spheres indicate mutated residue) and the wild type (cyan ribbon, yellow spheres). (C) Colour scheme as in B. The loop (196-214) that is dislocated as a result of the S197E mutation, compared to the structure of wild-type ADHA. The shift is accompanied by a flip of R18 into the NADP-binding pocket, likely due to an electrostatic attraction from the mutant glutamate. As a result, the cofactor (green carbons) is only bound in the wild type, while absent from the mutant structure.
Figure 5

Dimer interface with the V238L mutation (ΔTm = 7 ˚C).
(A and B) indicate the different monomers in the ADHA tetramer.
Figure 6
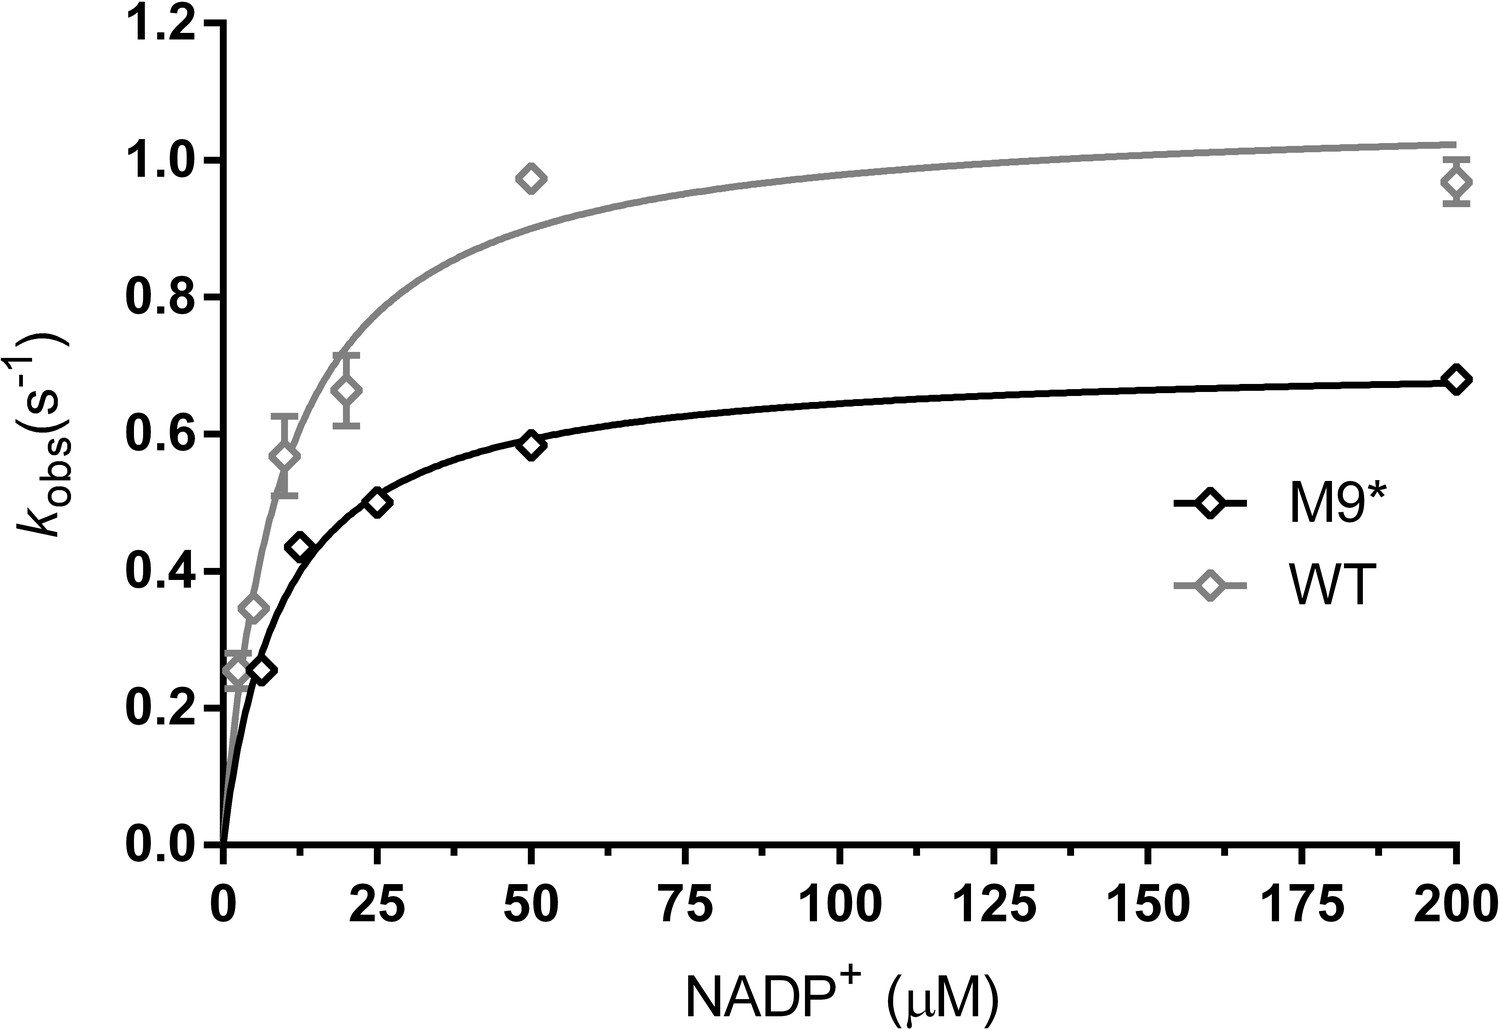
Michaelis-Menten plots for kinetics with NADP+.
ADHA wild type (grey, triangles) and M9* mutant (M9 with S197E reverted) (black, diamonds). Plots are fitted with the Michaelis-Menten equation in GraphPad prism 6.07.
Figure 7 with 1 supplement

Properties of wild-type and M9* ADHA.
(A) Temperature-activity profile using cyclohexanol as substrate. The dashed lines indicate the Tm of the wild type (at 43 °C) and apparent melting temperatures of M9* (78.5 °C and 88 °C) (B) Enzyme activity monitored over time at 37 °C (buffer composition: 50 mM Tris-HCl pH 7.5). Figure 7—figure supplement 1 depicts the enzyme activity over time for 18 days.
Figure 7—figure supplement 1
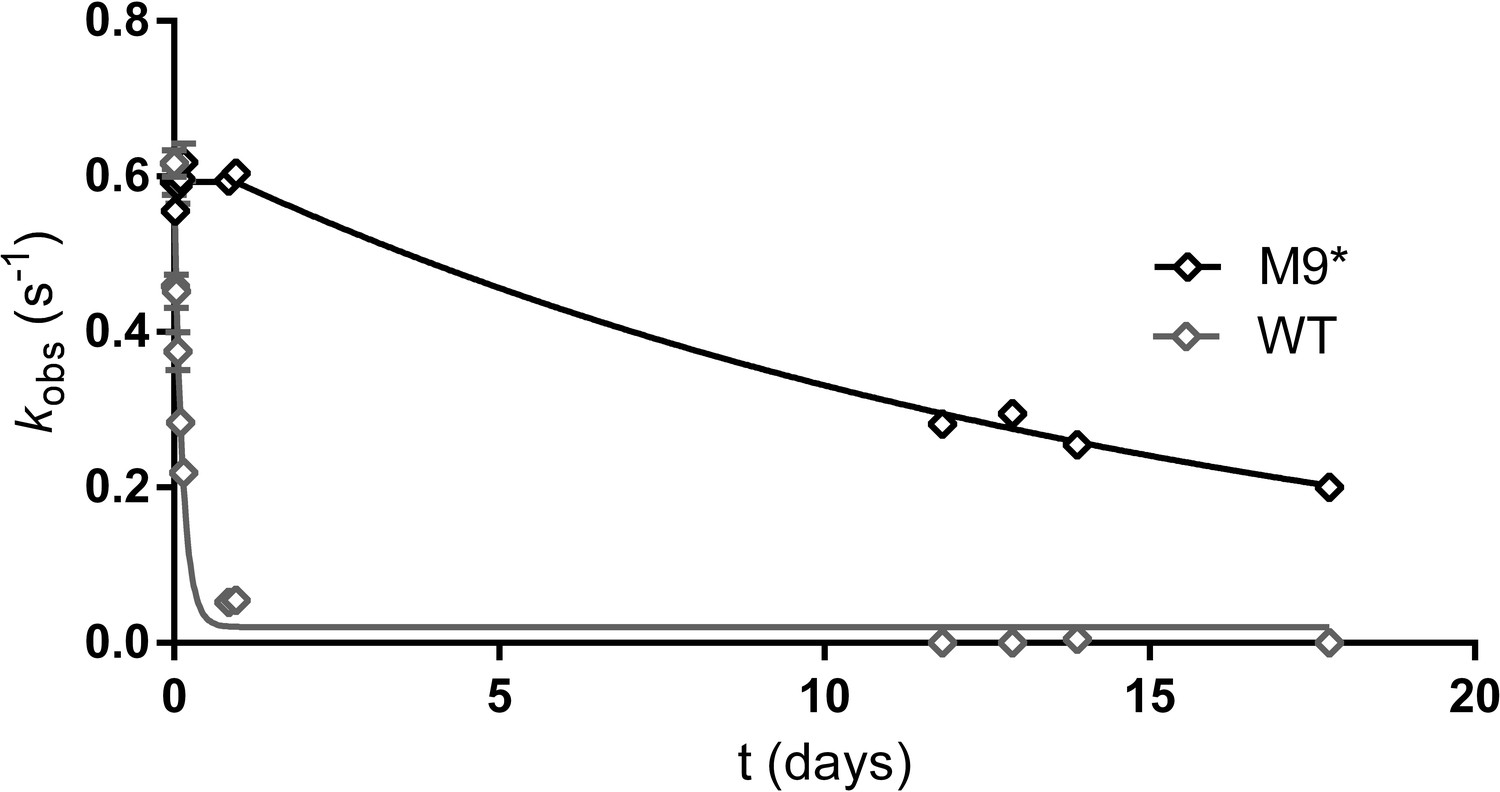
Long-term stability.
Long-term stability at 37 °C of the wild-type protein (in grey, triangles) compared to M9* (in black, diamonds). Plot fitted with one-phase decay in GraphPad prism 6.07.
Tables
Table 1
Initial measurements of ADHA WT activity and selectivity with several ketones.
| Substrate (concentration) | kobs* (U/mg) | Enantiomeric excess product (ee) |
|---|---|---|
| Ethyl acetoacetate (100 mM) | 4.1 | n.d. |
| Cyclohexanone (50 mM) | 3.2 | n.a. |
| Ethyl 4-chloro-3-oxobutanoate (COBA) (50 mM) | 0.3 | > 99% (R) |
| 4-Chloroacetophenone (4-CAP) (50 mM) | 2.4 | 97.2% (S) |
-
*kobs values are averages based on 2–3 replicates and for each average the error was smaller than 5%.
Table 2
ADHA mutants with highest ΔTm and retained activity.
In parentheses the temperature of the first unfolding event (minor peak) is given. Michaelis-Menten kinetics for wild type and M9 are shown in Figure 3.
| Single mutants | kobs* (U/mg) | Tm app (°C) | ΔTm (°C) |
|---|---|---|---|
| Wild type | 0.6 | 43.0 | - |
| L150F | 0.5 | 57.25 ± 0.25 | 14.0 ± 0.25 |
| G149A | 0.4 | 52.5 ± 0 | 9.5 ± 0 |
| M157K | 0.4 | 51.0 ± 0 | 8.0 ± 0 |
| S197E | 0.5 | 49 ± 1 | 7.5 ± 1 |
| V238L | 0.4 | 50.0 ± 0 | 7.0 ± 0 |
| G159A | 1.2 | 48.5 ± 0 | 5.5 ± 0 |
| N212R | 1.1 | 48.0 ± 0 | 5.0 ± 0 |
| T194V | n.d. | 47.0 ± 0 | 4.0 ± 0 |
| V193L | n.d. | 46.5 ± 0 | 3.5 ± 0 |
| V217P | n.d. | 46.0 ± 0 | 3.0 ± 0 |
| Combination mutants | kobs* (U/mg) | Tm app (°C) | ΔTm (°C) |
| M2 (L150F + M157K) | 0.4 | 64.0 ± 0 | 21.0 ± 0 |
| M3 (M2 + S197E) | 0.1 | 69.0 ± 0 | 26.0 ± 0 |
| M4 (M3 + V238L) | 0.2 | 72 (62) ± 0.25 | 29.0 ± 0.25 |
| M5 (M4 + N212R) | 0.2 | 75.5 (64) ± 0 | 32.5 ± 0 |
| M6 (M5 + G149A) | 0.1 | 81.0 (69) ± 0 | 38.0 ± 0 |
| M7 (M6 + G159A) | 0.1 | 85.0 (74) ± 0 | 42.0 ± 0 |
| M8 (M7 + V193L + T194V) | 0.05 | 90.0 (81) ± 0.25 | 47.0 ± 0.25 |
| M9 (M8 + V217P) | 0.03 | 94.5 (84) ± 0 | 51.5 ± 0 |
| M9* (M9 - S197E) | 0.8 | 88.0 (78.5) ± 0 | 45.0 ± 0 |
-
*kobs values are averages based on 2–3 replicates and for each average the error was smaller than 5% (between ± 0.0015–0.04 U/mg). Cyclohexanol was used as substrate.
Table 3
Characteristics of wild-type, M9, and M9* ADHA.
Activity measurements were performed at 25 °C in duplicate or triplicate and the respective Michaelis-Menten plots are depicted in Figure 6. Melting curves are depicted in Figure 2—figure supplement 1. Conversions were performed with 5 µM of ADHA and 10 mM of prochiral ketone substrate: ethyl 4-chloro-3-oxobutanoate (COBA) and 4-chloroacetophenone (4-CAP). Details and chromatograms are provided in Supplementary file 4.
| Enzyme | Tm (°C) | kcat (s−1) | KM,NADP+ (µM) | kcat/KM,NADP+ (s−1 mM−1) | Conversion and ee (COBA) | Conversion and ee (4-CAP) |
|---|---|---|---|---|---|---|
| ADHA WT | 43.0 ± 0 | 1.1 ± 0.04 | 9.5 ± 1.2 | 116 ± 35 | > 99% > 99% ee (R) | > 99% 97.2% ee (S) |
| M9 | 94.5 ± 0 | 0.27 ± 0.02 | 1040 ± 108 | 0.26 ± 0.2 | n.d. | n.d. |
| M9* | 88.0 ± 0 | 0.7 ± 0.01 | 9.6 ± 0.7 | 73 ± 14.5 | > 99% > 99% ee (R) | > 99% 98% ee (S) |
Table 4
Final melting temperatures (Tm) of M9* in various cosolvents (20% v/v).
| Cosolvent | Tm (°C) | ΔTm (°C) |
|---|---|---|
| - | 88.0 ± 0 | - |
| Methanol | 76.0 ± 0.5 | −12 |
| Ethanol | 71.5 ± 0.5 | −16.5 |
| Isopropanol | 67.0 ± 0.5 | −21 |
Table 5
Studies that have applied FRESCO for stabilization of enzymes, to date.
| Enzyme | Abbreviation | Size (aa) | Quaternary structure | ΔTm | Reference |
|---|---|---|---|---|---|
| Limonene epoxide hydrolase | LEH | 149 | Dimer | +35 °C | (Wijma et al., 2014) |
| Haloalkane dehalogenase | LinB | 250 | Monomer | +22 °C | (Floor et al., 2014) |
| Hydroxymethyl furfural oxidase | HMFO | 525 | Monomer | +12 °C | (Martin et al., 2018) |
| Peptide amidase | PAM | 508 | Monomer | +23 °C | (Wu et al., 2016) |
| Halohydrin dehalogenase | HheC | 254 | Tetramer | +28 °C | (Arabnejad et al., 2017) |
| Cyclohexanone monooxygenase | CHMO | 529 | Monomer | +13 °C | (Fürst et al., 2019) |
| Glucose oxidase | GOX | 605 | Dimer | +8.5 °C | (Mu et al., 2019) |
| ω-Transaminase | ω-TA | 455 | Dimer | +23 °C | (Meng et al., 2020) |
| Short-chain dehydrogenase | ADHA | 246 | Tetramer | +45 °C | This work |
Key resources table
| Reagent type (species) or resource | Designation | Source or reference | Identifiers | Additional information |
|---|---|---|---|---|
| Strain, strain background (Escherichia coli) | NEB 10-beta chemically competent E. coli | New England Biolabshttps://www.neb.com/ | C3019I | |
| Sequence based reagent | pBAD Golden gate vector (N-terminal 6xHis, araC, bla) | This study | Molecular Enzymology Group, University of Groningen | |
| Polymerase | PfuUltra II Hotstart PCR Master Mix | Agilent Technologies https://www.agilent.com/ | 600852 | |
| Commercial assay or kit | Ni chromatography resin | GE Healthcare Life Sciences https://www.gelifesciences.com/ | ||
| Software, algorithm | Rosetta | Rosetta Commons https://www.rosettacommons.org/ | RRID:SCR_015701 | |
| Software, algorithm | FoldX | FoldXhttp://foldxsuite.crg.eu/ | RRID:SCR_008522 | |
| Software, algorithm | YASARA | YASARA Biosciences GmbHhttp://www.yasara.org/ | RRID:SCR_017591 | |
| Software, algorithm | FRESCO scripts | https://groups.google.com/forum/#!forum/fresco-stabilization-of-proteins | ||
| Software, algorithm | GraphPad Prism | GraphPad Prism https://graphpad.com | RRID:SCR_015807 | Version 6 |
Additional files
-
Supplementary file 1
Crystallographic data and activity-impairing mutations.
(A) Crystallographic data. (B) Table of stabilizing mutations that disrupt activity.
- https://cdn.elifesciences.org/articles/54639/elife-54639-supp1-v2.docx
-
Supplementary file 2
SDS-PAGE analysis.
(A) Expression of ADHA at different temperatures. (B) Purification of SUMO-M9*.
- https://cdn.elifesciences.org/articles/54639/elife-54639-supp2-v2.docx
-
Supplementary file 3
Correlation of predictions with the measured data.
(A) Correlation of predicted values and experimental melting point data. (B) Graph of correlation.
- https://cdn.elifesciences.org/articles/54639/elife-54639-supp3-v2.docx
-
Supplementary file 4
Chromatograms of conversions.
(A) Settings for GC and HPLC. (B) Chromatograms GC. (C) Chromatograms HPLC.
- https://cdn.elifesciences.org/articles/54639/elife-54639-supp4-v2.docx
-
Transparent reporting form
- https://cdn.elifesciences.org/articles/54639/elife-54639-transrepform-v2.docx
Download links
A two-part list of links to download the article, or parts of the article, in various formats.
Downloads (link to download the article as PDF)
Open citations (links to open the citations from this article in various online reference manager services)
Cite this article (links to download the citations from this article in formats compatible with various reference manager tools)
Approaching boiling point stability of an alcohol dehydrogenase through computationally-guided enzyme engineering
eLife 9:e54639.
https://doi.org/10.7554/eLife.54639


