Hfq CLASH uncovers sRNA-target interaction networks linked to nutrient availability adaptation
- Centre for Synthetic and Systems Biology, University of Edinburgh, United Kingdom
- Institute of Cell Biology, University of Edinburgh, United Kingdom
- Institute of Biophysics, CNR Unit, Italy
- School of Biotechnology and Biomolecular Sciences, University of New South Wales, Australia
Figures
Figure 1 with 3 supplements
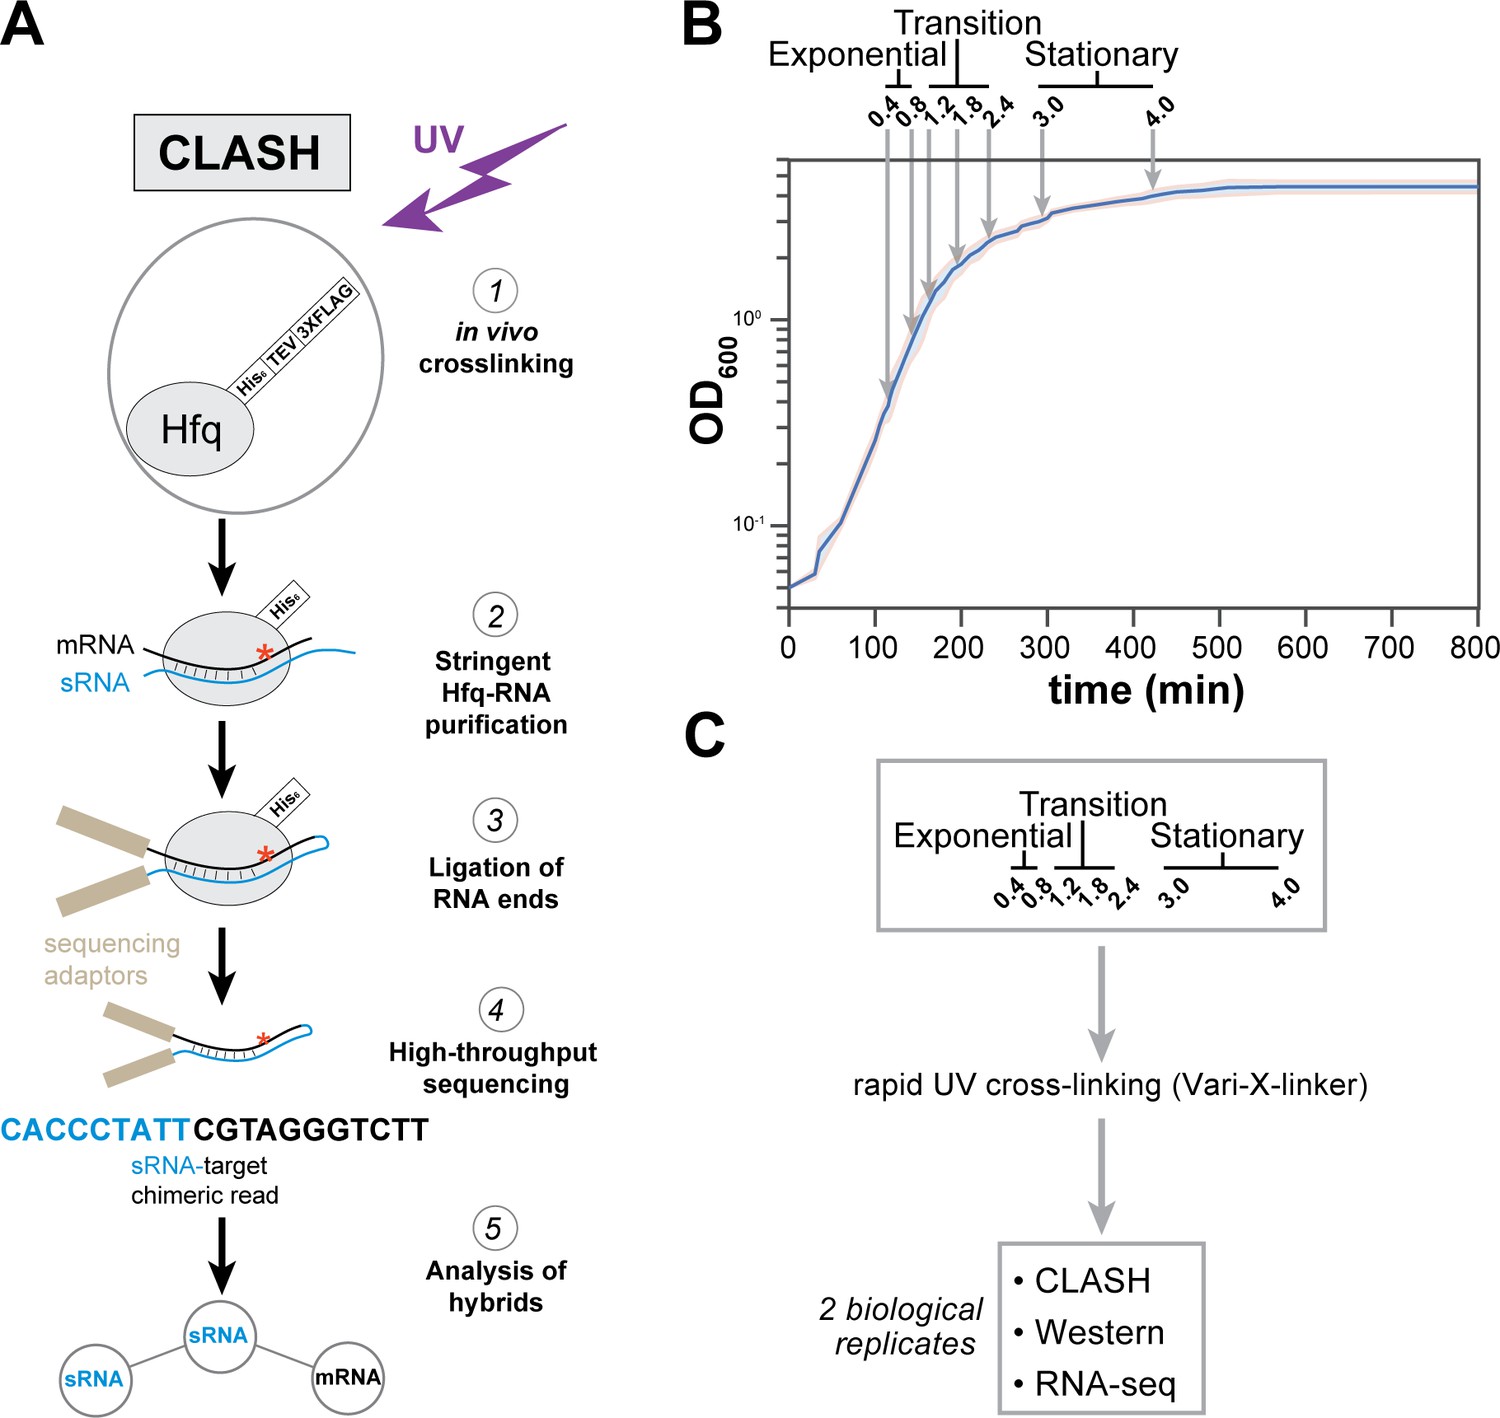
Hfq CLASH experiments at different growth phases in E. coli.
(A) Overview of the critical experimental steps for obtaining the Hfq CLASH data. E. coli cells expressing an HTF (His6-TEV-3xFLAG)-tagged Hfq (Tree et al., 2014) were grown in LB and an equal number of cells were harvested at different optical densities (OD600) and UV cross-linked. Hfq, cross-linked to sRNA-RNA duplexes is purified under stringent and denaturing conditions and RNA ends that are in close proximity are ligated together. After removal of the protein with Proteinase K, cDNA libraries are prepared and sequenced. The single reads can be used to map Hfq-RNA interactions, whereas the chimeric reads can be traced to sRNA-target interactions. (B) A growth curve of the cultures used for the Hfq CLASH experiments, with OD600 at which cells were cross-linked. Each growth stage is indicated above the plot. The results show the mean and standard deviations of two biological replicates. Source data are provided as a Source Data file. (C) Cultures at the indicated OD600 were cross-linked,harvested by filtration and analysed by Hfq CLASH, RNA-seq and western blotting to detect Hfq. All the experiments were done in duplicate.
-
Figure 1—source data 1
Source data for Figure 1B.
- https://cdn.elifesciences.org/articles/54655/elife-54655-fig1-data1-v2.xlsx
Figure 1—figure supplement 1
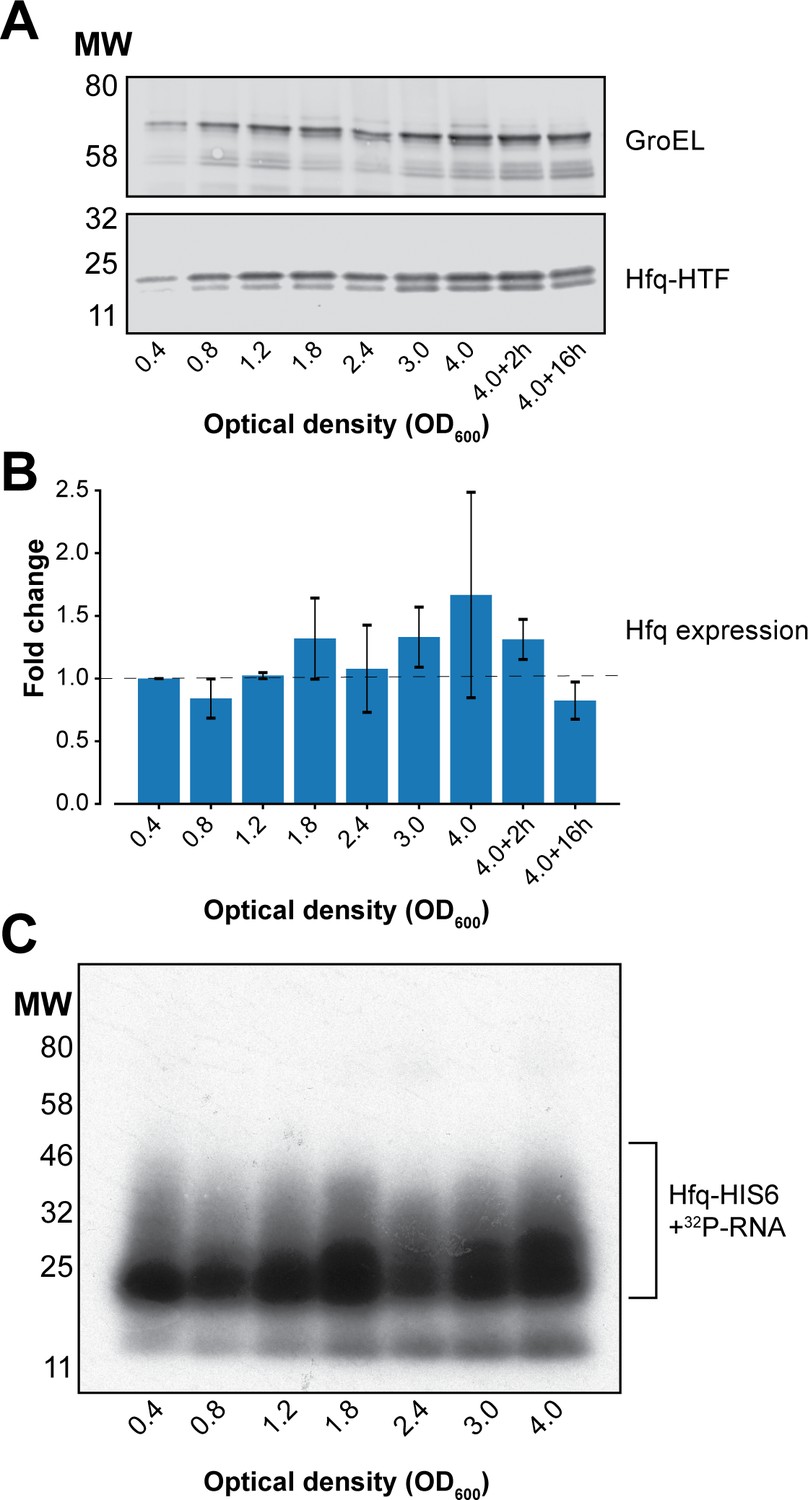
Hfq expression and Hfq binding to RNAs at different cell densities in UV-irradiated E. coli.
(A) Western blot analyses of Hfq levels during various growth stages. Hfq-HTF was detected using an anti-TAP primary antibody, and a fluorescent secondary antibody. GroEL was used as a loading control. (B) Quantification of Hfq levels from the western blot result. The fluorescent signal for Hfq-HTF and GroEL was measured with the LI-COR from biological replicate experiments. The levels of Hfq were normalized to GroEL and expressed as fold-change relative to OD600 0.4. (C) Hfq crosslinking to RNA is similar at each optical density. Autoradiogram showing the purified radioactively labelled Hfq-RNA complexes for each OD600 after elution from the nickel beads. Source data for (A–B) are provided as a Source Data file.
-
Figure 1—figure supplement 1—source data 1
Source data for Figure 1—figure supplement 1A and B.
- https://cdn.elifesciences.org/articles/54655/elife-54655-fig1-figsupp1-data1-v2.xlsx
Figure 1—figure supplement 2
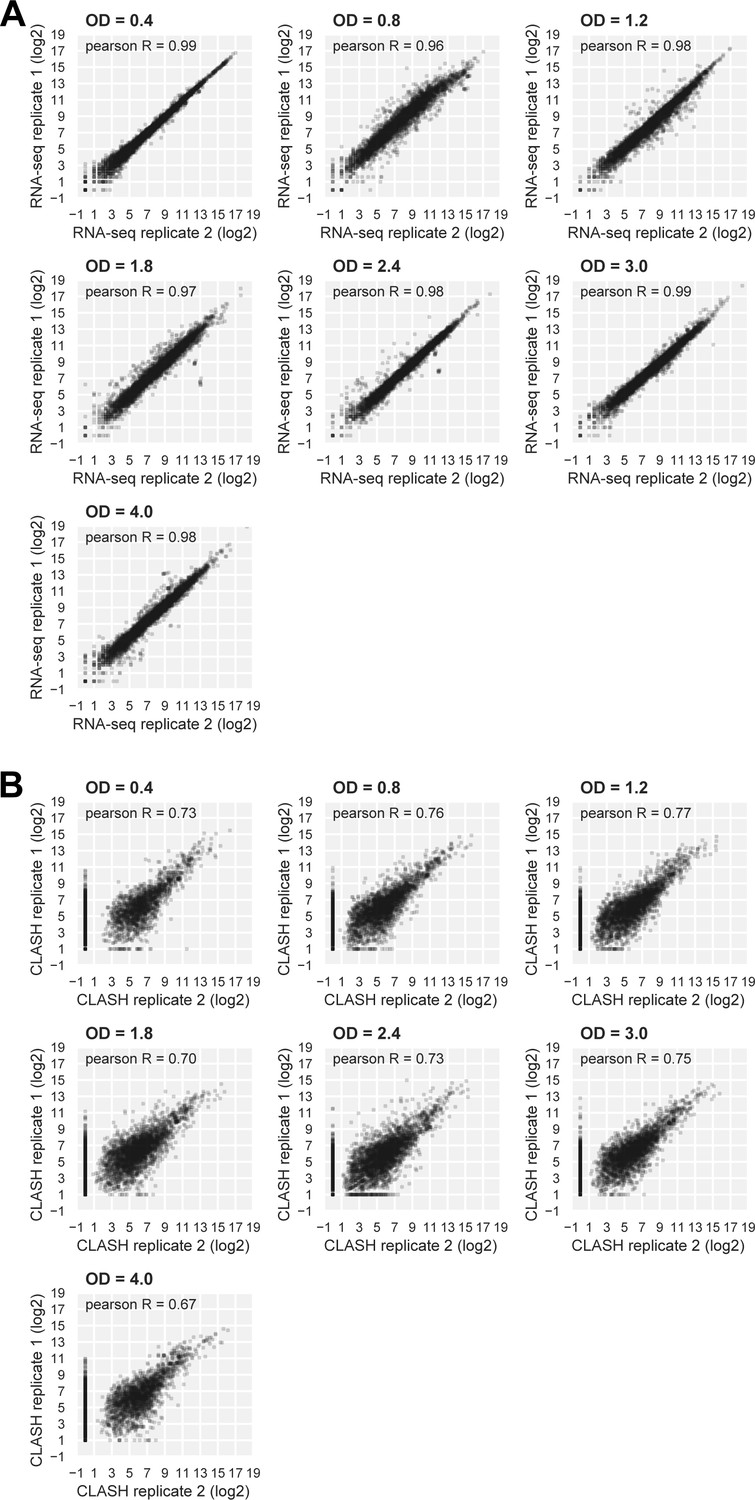
RNA-seq and Hfq CLASH replicate datasets are highly correlated.
(A, B) Scatter plots showing the distribution of log2Transcripts Per Million (TPM) normalized read counts for Hfq CLASH (A) and RNA-seq (B) biological replicates. Pearson R coefficients describing the correlation between the two independent experiments at each OD600 are included.
Figure 1—figure supplement 3
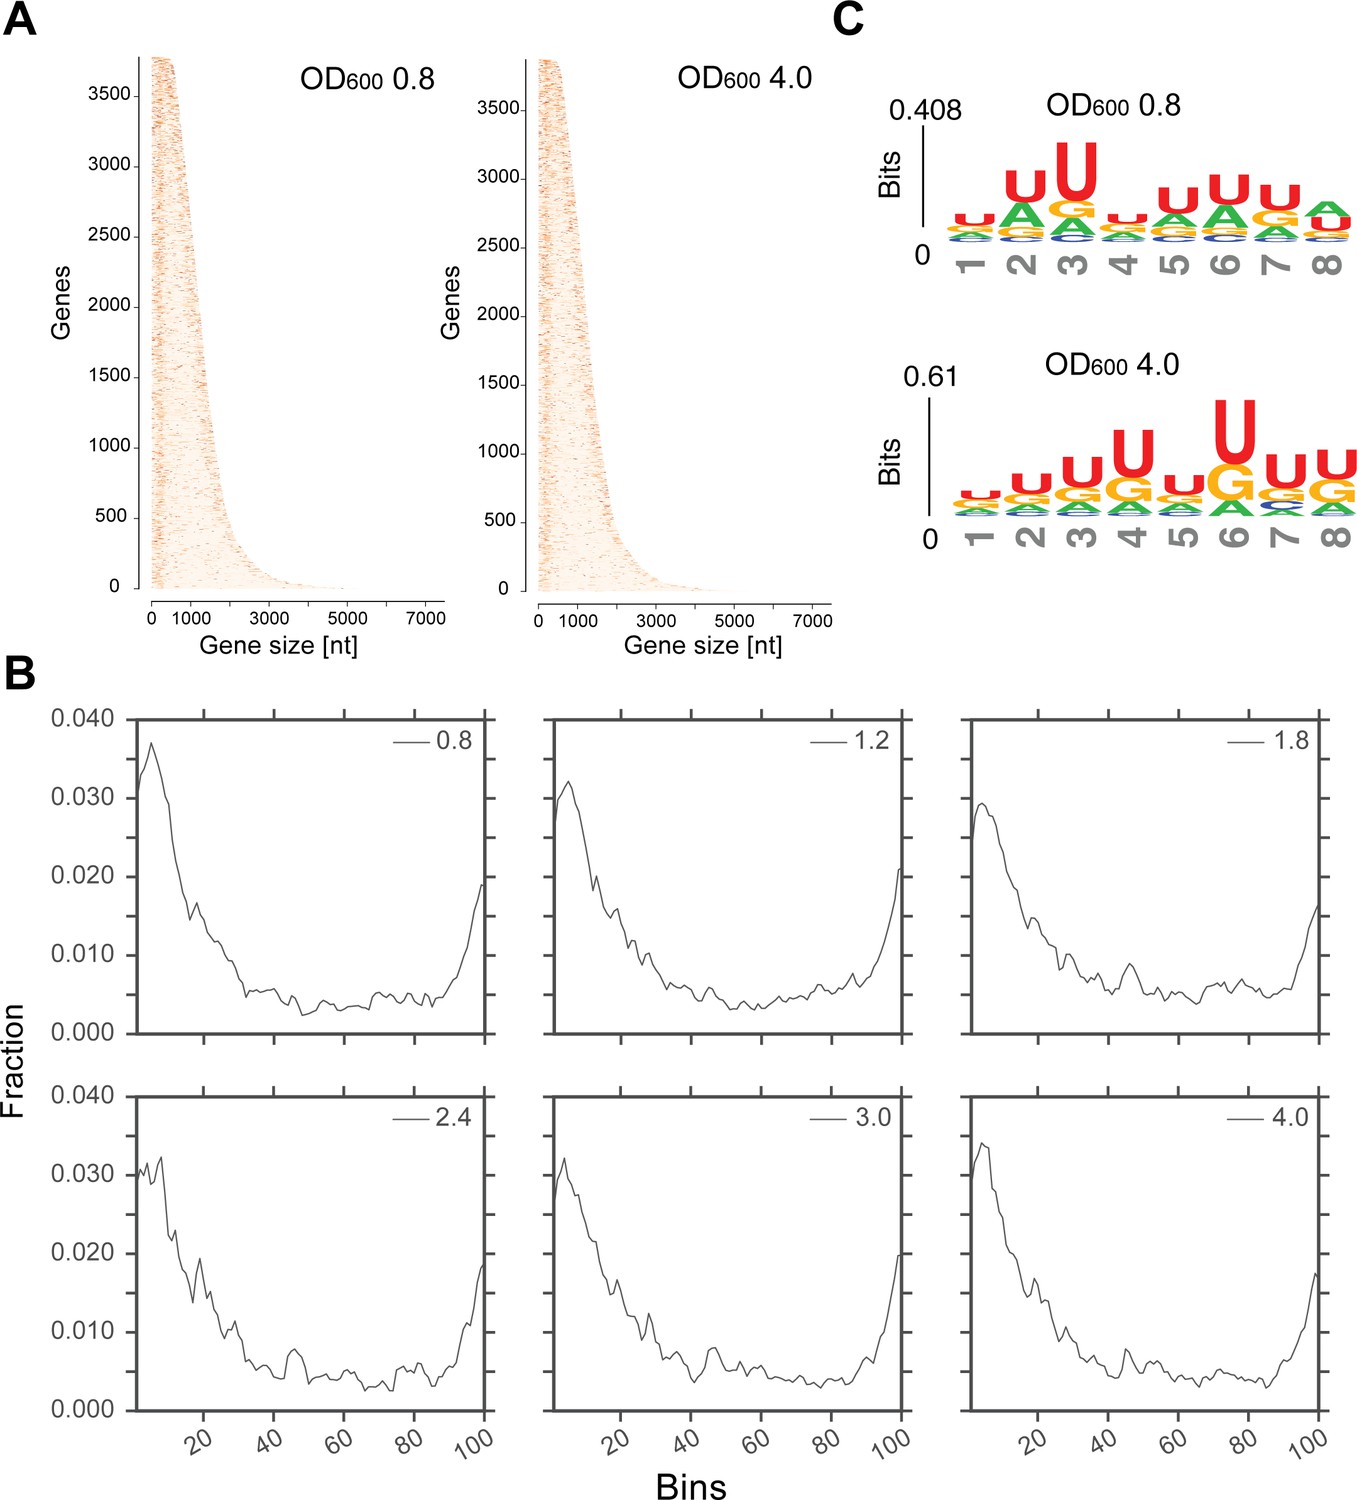
Transcriptome-wide maps of Hfq binding to mRNA genes.
(A) Heatmaps showing the distribution of Hfq binding sites across all mRNA genes at OD600 0.8 and 4.0. The genes are sorted by their sequence length (x-axis); the darker a nucleotide is, the more Hfq was crosslinked to it. To generate the heatmap, Hfq binding clusters were generated. A 5’ and 3’UTR length of 200 nt was used. (B) A more stringent selection of the genes was used to generate the distribution of Hfq binding to the transcriptome: all genes with overlapping 5’ or 3’UTRs were removed from the analysis to avoid duplicate counting. For all remaining cDNAs, significantly enriched Hfq binding sites (FDR <= 0.05) of minimum 20 nt were considered for plotting. The gene length (including UTR coordiantes provided in the GTF annotation file) was normalized over 100 bins (x-axis), and the fraction of reads in each bin was calculated (y-axis). (C) Hfq binds to poly-U tracks. Significant k-mers (4–8 nt in length) were identified using the pyMotif tool of the pyCRAC package (Webb et al., 2014) and the motif logo was generated using all k-mers with a Z-score >3, with kpLogo (Wu and Bartel, 2017).
Figure 2 with 5 supplements
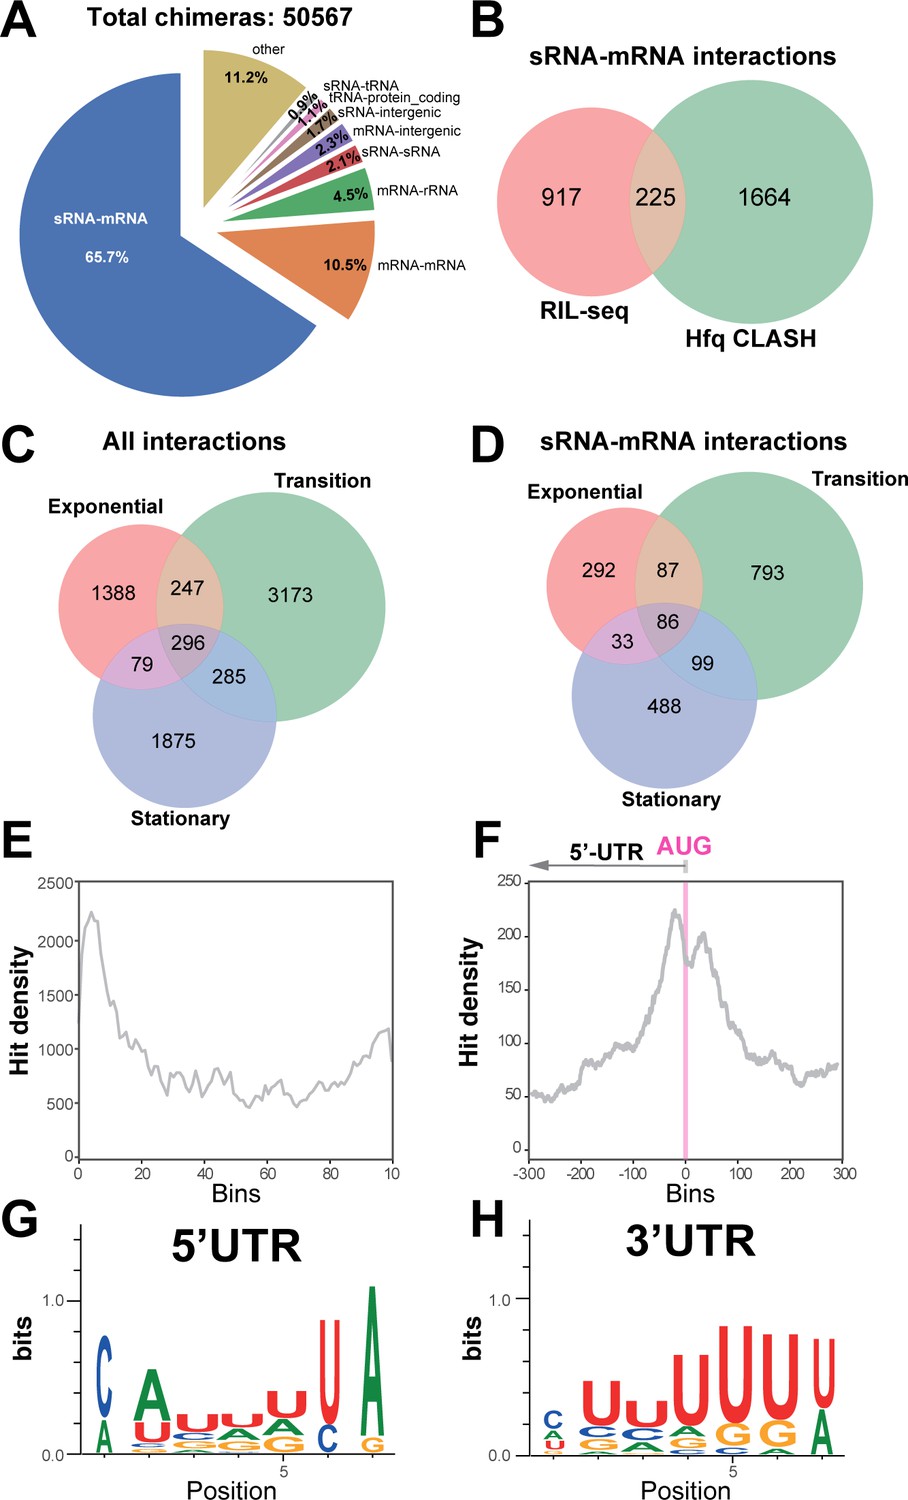
Hfq CLASH detects RNA-RNA interactions in E. coli.
(A) Intermolecular RNA interactions found in chimeras captured by Hfq CLASH. Chimera counts for all the uniquely annotated hybrids that mapped to genomic features. *tRNA-tRNA and rRNA-rRNA chimeras originating from different genomic regions were removed because tRNA and rRNA gene copies are very similar and therefore we could not unambiguously determine if these represented intermolecular or intramolecular interactions. (B) Venn diagram comparing the sRNA-mRNA interactions found in RIL-seq S-chimera data (log and stationary) and Hfq CLASH data. (C) Venn diagram showing the intersection between interactions from statistically filtered CLASH data from two biological replicates, recovered at three main growth stages: exponential (OD600 0.4 and 0.8), transition (OD600 1.2, 1.8, 2.4) and early stationary (OD600 3.0 and 4.0). (D) Same as in (C) but for sRNA-mRNA interactions. (E) Distribution of mRNA fragments in sRNA-mRNA chimeras over all E. coli protein-coding genes. Each gene was divided in 100 bins and the number of mRNA fragments that mapped to each bin (hit density; y-axis) was calculated. (F) Distribution of the mRNA fragments of sRNA-mRNA chimeras around the translational start codon (AUG). The pink line indicates the position of the start codon (G–H) Enriched motifs in mRNA fragments of chimeras that uniquely overlap 5’UTRs and 3’UTRs; the logos were drawn using the top 20 K-mers.
Figure 2—figure supplement 1
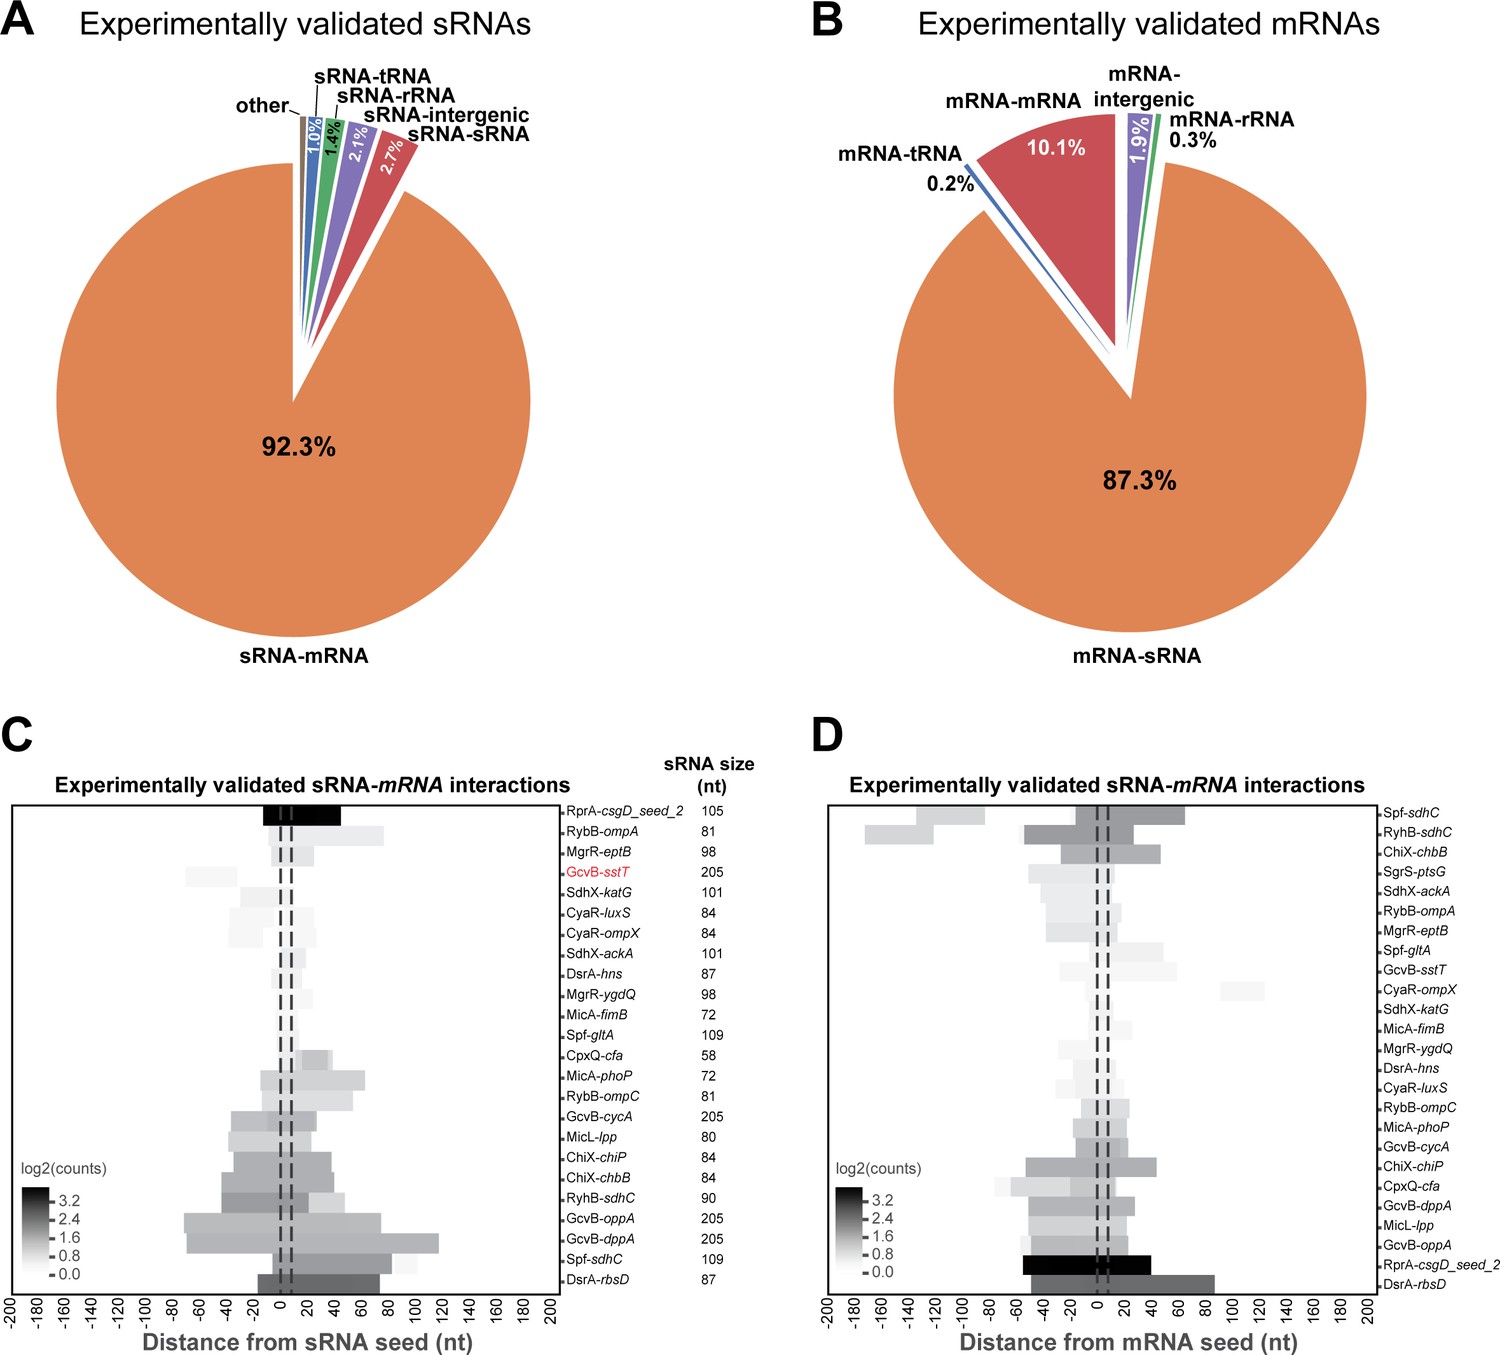
Analysis of experimentally verified sRNA-mRNA chimeras in the Hfq CLASH data.
(A) The sRNAs with experimentally verified interactions are frequently paired with mRNA fragments in Hfq CLASH chimeras. The pie chart shows how frequently sRNAs with experimentally verified interactions were found fused to transcripts originating from other genomic features in the data. For this analysis, all the statistically filtered chimeras containing the sRNAs RprA, RybB, MgrR, GcvB, DsrA, MicA, Spot42, MicL, RyhB, ChiX, SdhX and CpxQ were considered. (B) As in (A) but now for the mRNAs with experimentally verified seed sequences. (C) Known sRNA seed sequences of experimentally validated sRNA-mRNA interactions are frequently recovered in chimera fragments. The heatmap shows the distribution of sRNA chimera fragments around known seed sequences, which were normalized to an 8-nucleotide length (indicated by the vertical dashed line). The results show that for all the experimentally verified sRNA-mRNA interactions found in our data, the known sRNA seed sequence is almost always recovered. For the interaction indicated in red no overlap was found with the known seed. (D) As in (C) but now for mRNAs with experimentally verified seed sequences (normalized to an 8-nucleotide length). The results show that for all of the experimentally verified interactions found in our data, the known mRNA seed sequence is always recovered.
Figure 2—figure supplement 2

sRNAs are most frequently found paired with mRNAs, and vice versa, in CLASH chimeras and are enriched for seed sequences.
(A) The pie chart shows the counts for the chimeras that contained sRNA fragments fused to transcripts originating from other genomic features. (B) As in (A), but now for all the mRNA chimeras. (C) Known sRNA seed sequences derived from all experimentally validated sRNA-mRNA interactions are recovered in sRNA-mRNA chimera fragments. The heatmap shows the distribution of sRNA chimera fragments around known sRNA seed sequences (normalized to an 8-nucleotide length' indicated by the vertical dashed line).
Figure 2—figure supplement 3
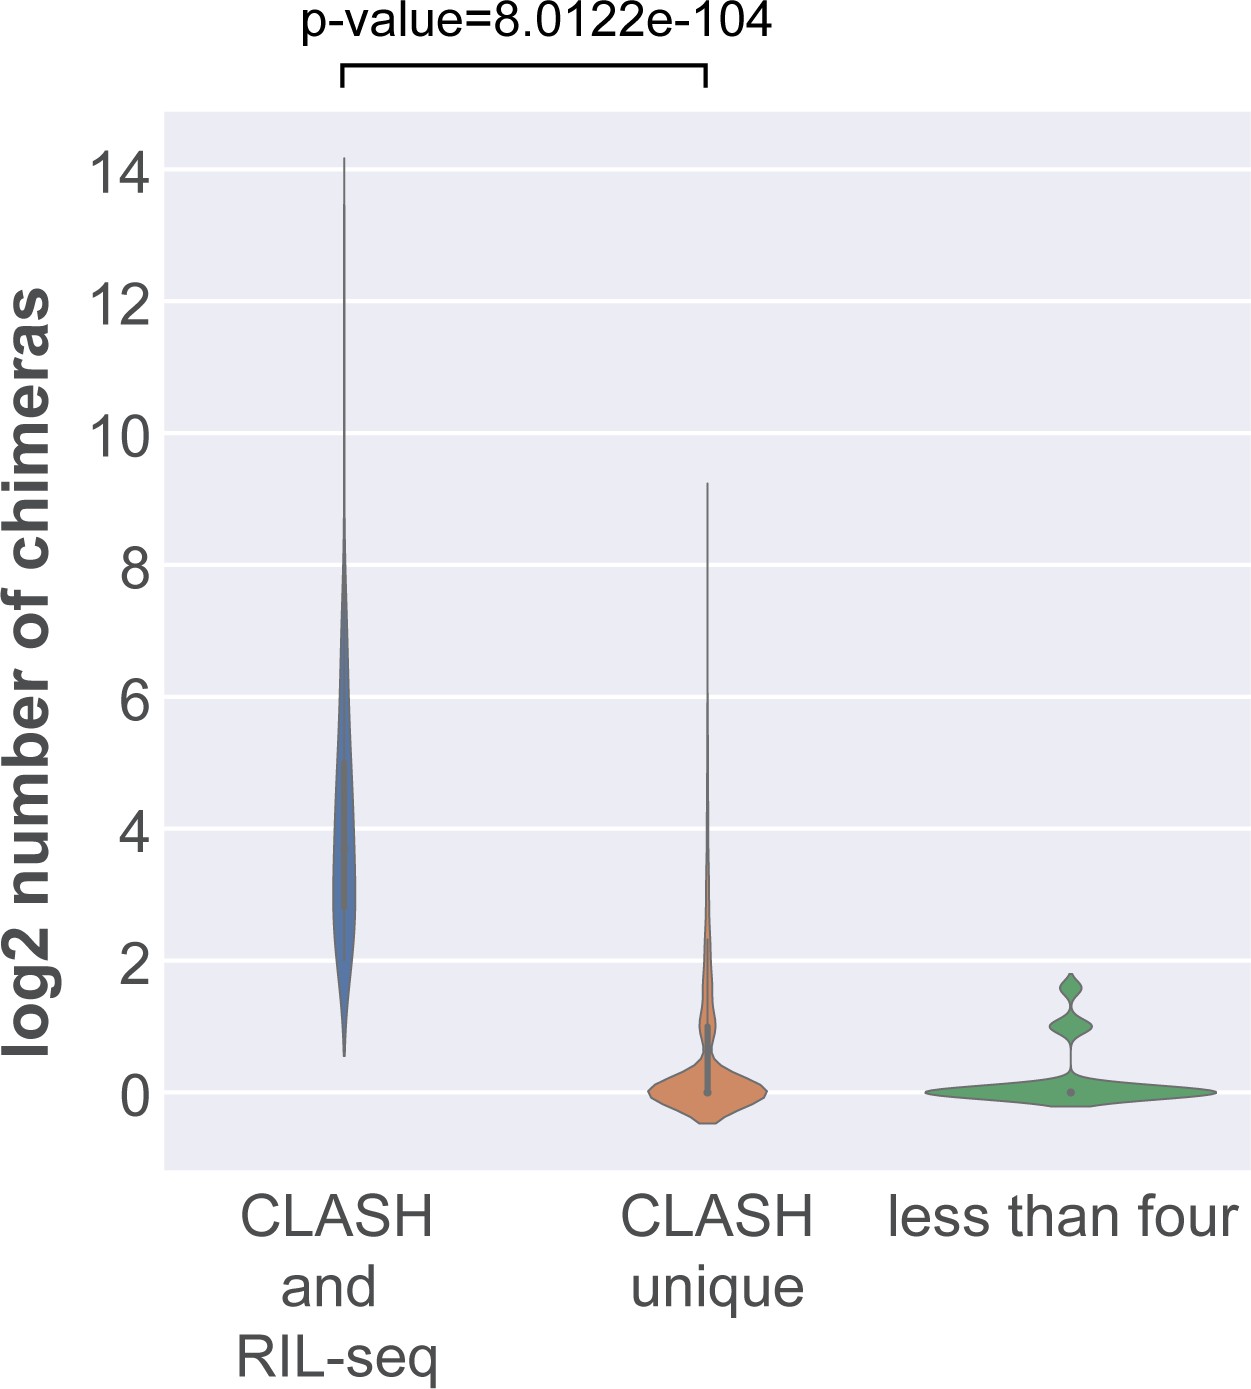
Interactions shared between RIL-seq and CLASH are supported by a large number of chimeras.
The violin plot shows the distribution of chimera counts for interactions shared between CLASH and RIL-seq, those uniquely found in the CLASH data (CLASH unique) and those supported by less than four reads. Statistical significance between the two distributions was calculated using a Mann-Whitney U test.
Figure 2—figure supplement 4

sRNAs are most frequently found paired with mRNAs, and vice versa, in CLASH chimeras and are enriched in seed sequences.
(A–C) Same as in Figure 2—figure supplement 2, but now for the chimeras that represent interactions uniquely found in the CLASH data.
Figure 2—figure supplement 5
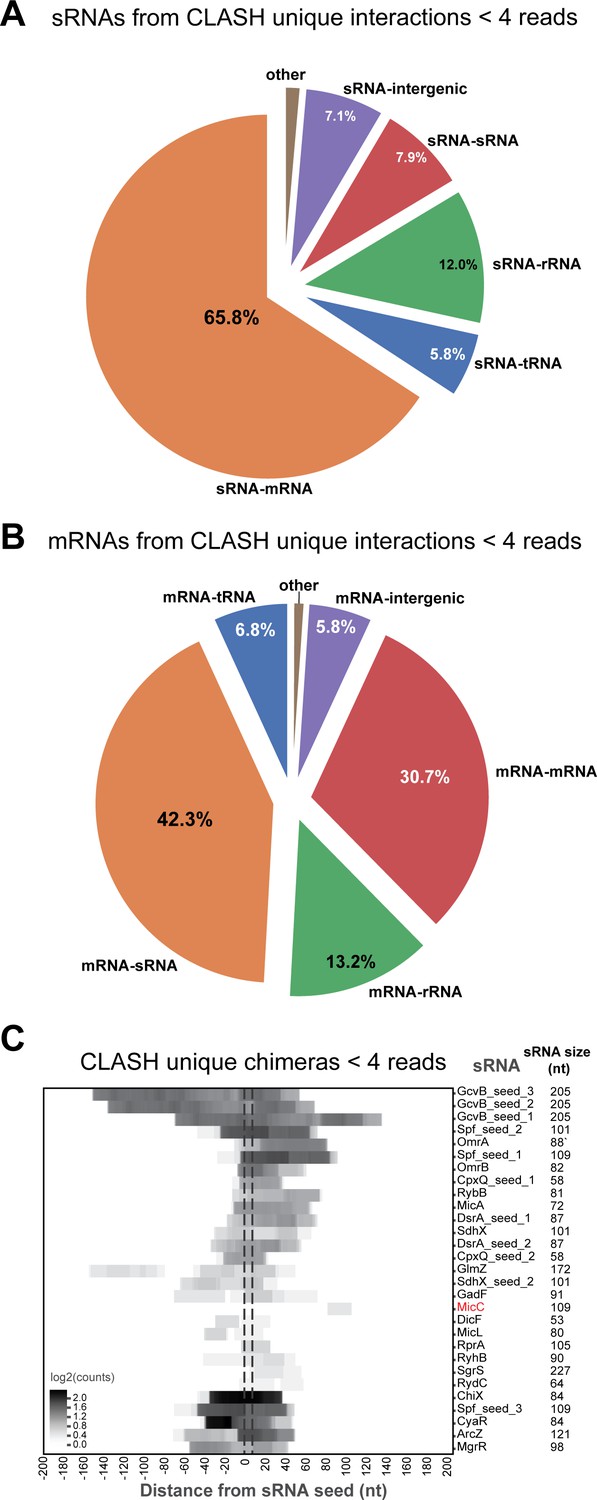
sRNAs are most frequently found paired with mRNAs, and vice versa, in CLASH chimeras and are enriched in seed sequences.
(A–C) Same as in Figure 2—figure supplement 3, but now for the chimeras that represent interactions uniquely found in the CLASH data and with read counts of less than 4.
Figure 3
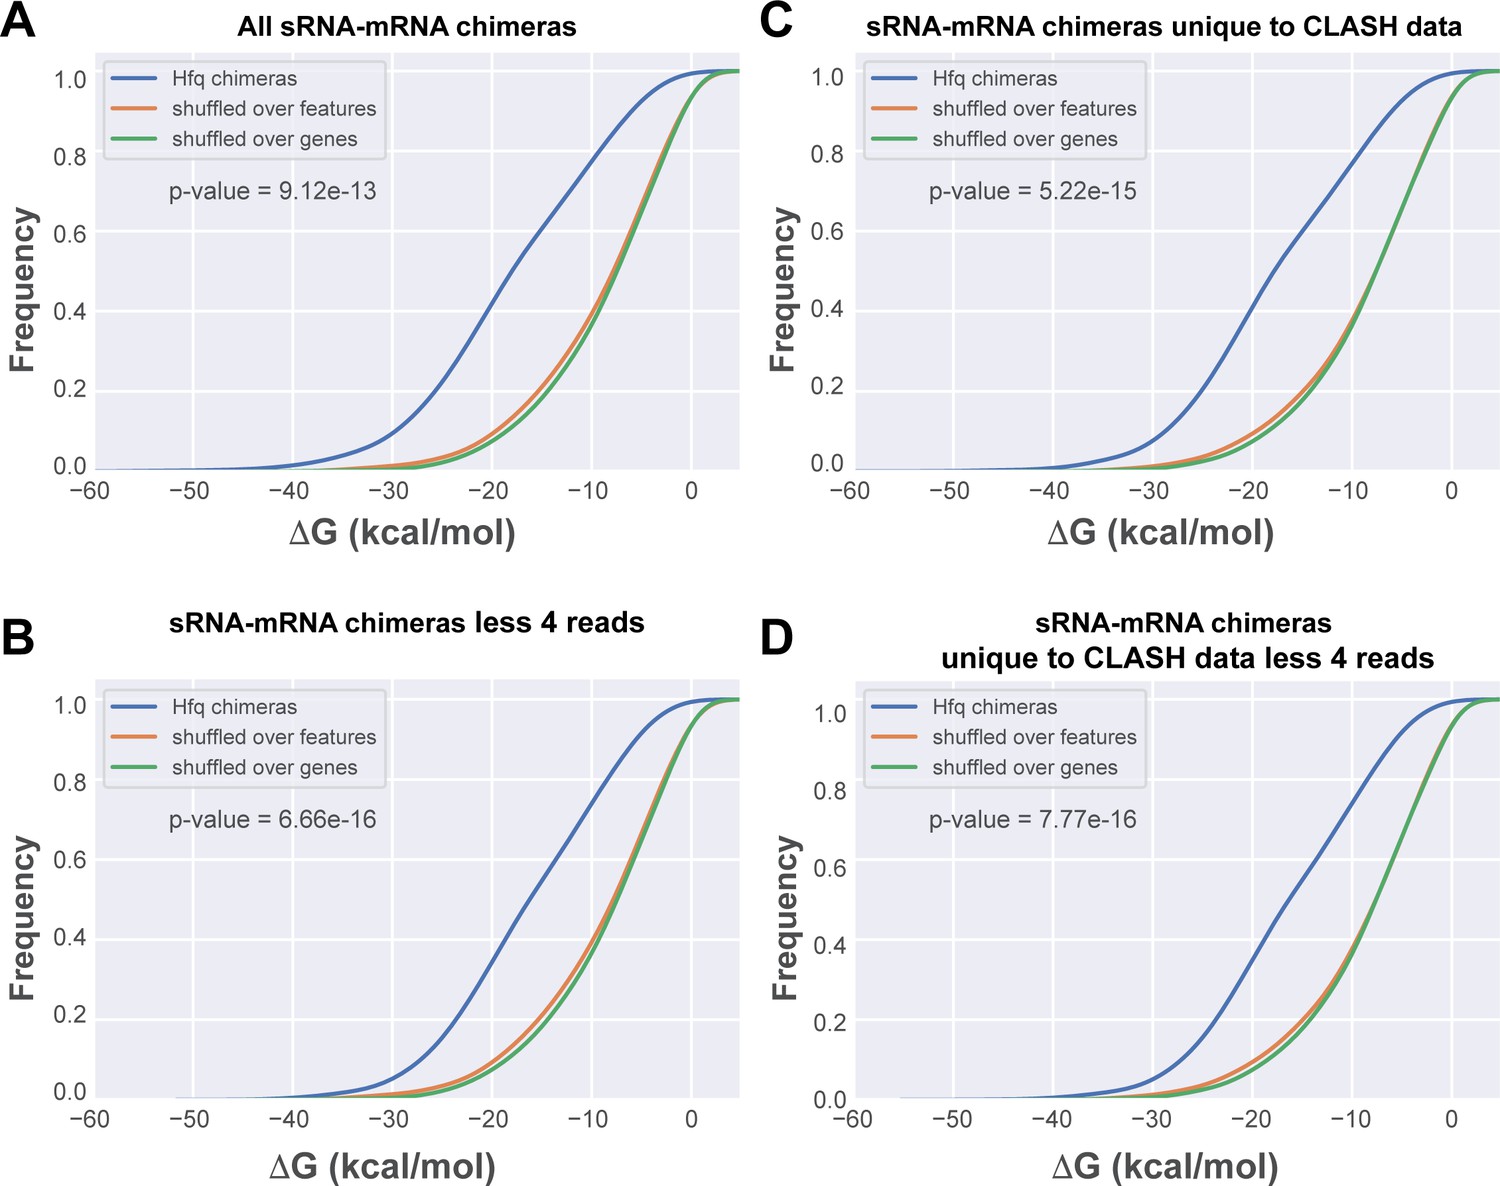
In silico folding of sRNA-mRNA chimeras shows Hfq CLASH sRNA-mRNA interactions are significantly more structured than randomly matched pairs.
(A) Cumulative distribution of the predicted folding energy (ΔG) values between sRNA and matching mRNA found in all statistically filtered sRNA-mRNA interactions. Chimera folding energies were calculated using RNADuplex (Lorenz et al., 2011), and their distribution was compared to the control distributions of chimeric reads in which the fragments were randomly shuffled over the same gene, or over genes belonging to the same class of genes (e.g sRNAs or mRNAs), respectively. Significance was tested with Kolmgorov-Smirnov test. (B) As in (A) but now for the chimeras unique to the CLASH data. (C) As in (A) but now for chimeras that are supported by less than four reads. (D) As in (A) but now for chimeras unique to the CLASH data and supported by less than four reads.
Figure 4 with 13 supplements
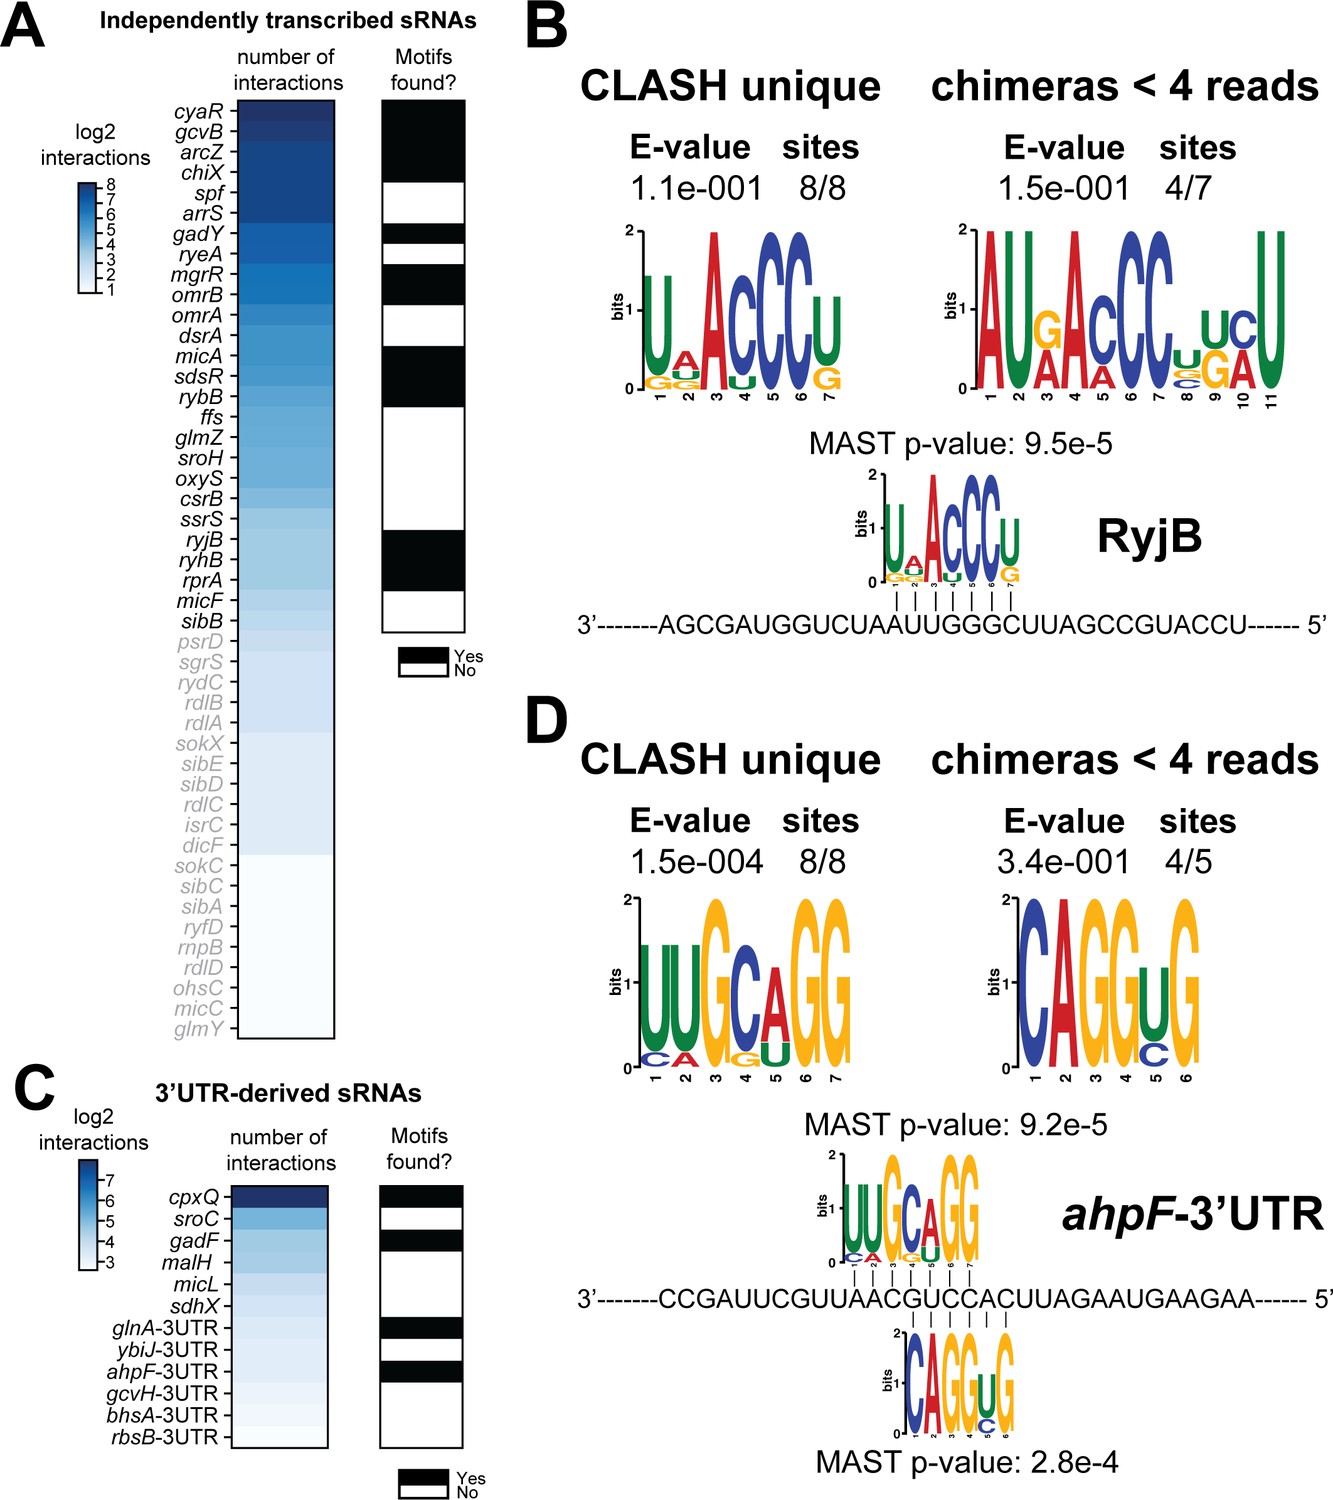
Total number of interactions for sRNAs and in how many cases enriched sequence motifs were found.
(A and C) The heatmaps show the number of different mRNA interactions identified with independently transcribed sRNAs (A) or (putative) 3’UTR-derived sRNAs (C). Only the sRNA for which we recovered at least five different interactions with mRNAs (highlighted in black) were further analysed for enriched motifs in the putative mRNA targets. The black-and-white heatmaps indicate if enriched motifs were identified in predicted mRNA targets (black means Yes and white means No). Motif analysis was performed using the MEME suite (Bailey et al., 2009). The number of target sequences that contained the common motif and the E-value of MEME are shown. The identified motifs in the mRNA targets also show sequence complementarity to the sRNA sequence. The Motif Alignment Search Tool (MAST) was used to determine the degree of complementarity between the identified motifs in putative mRNA targets and the putative sRNA. An sRNA was considered to have an enriched motif if a motif identified by MEME had an E-value <= 0.1 and/or the MAST p-value of the motif, which indicates the overall match between the identified motifs and the sRNA sequence (Bailey et al., 2009), was <= 0.001. (B–D) Motif analyses of mRNA sequences found in RyjB sRNA-mRNA and ahpF-3’UTR-mRNA interactions. All of the RyjB and ahpF-3’UTR interactions with mRNAs we found were uniquely detected in our CLASH data.
Figure 4—figure supplement 1
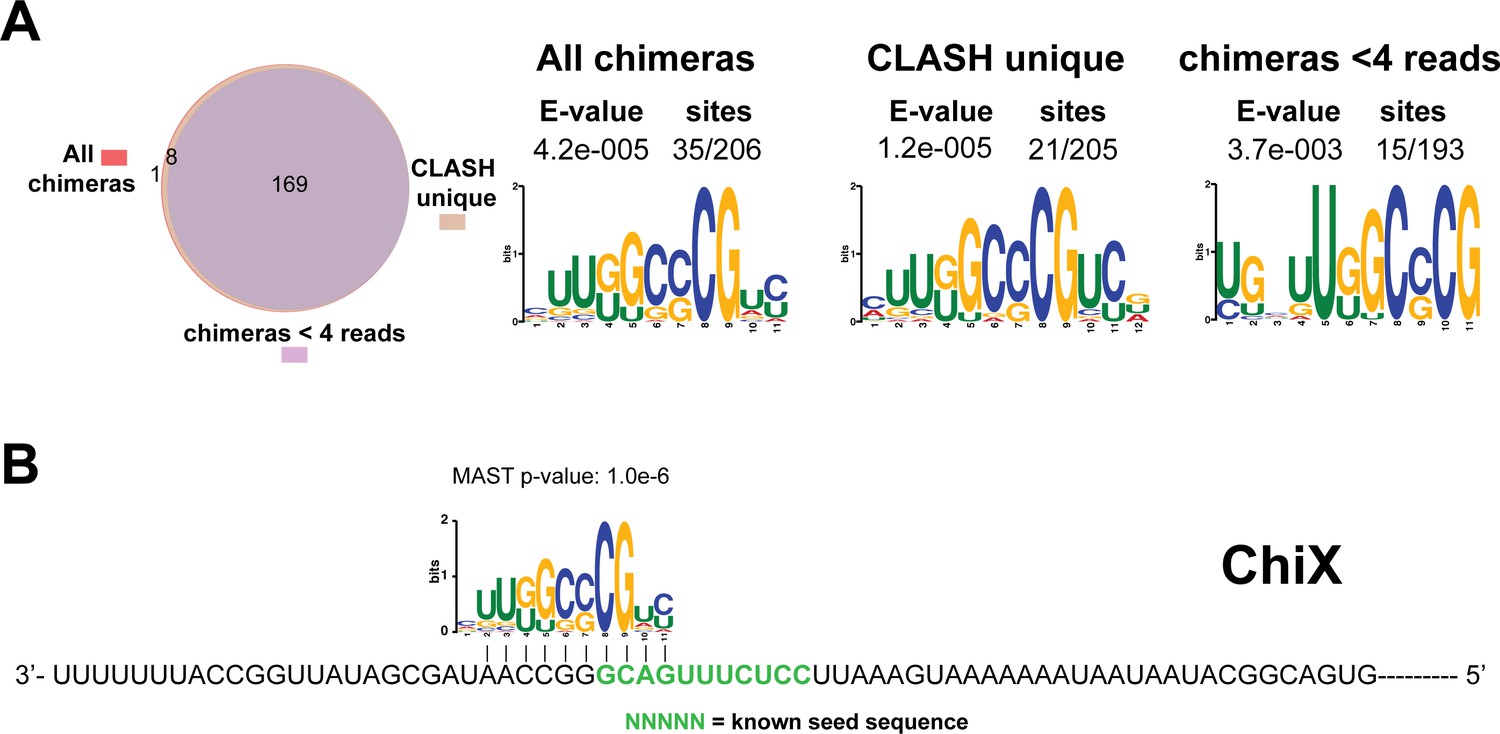
Identification of complementary sequence motifs in predicted ChiX mRNA targets.
(A) Motif analyses of mRNA sequences found in ChiX sRNA-mRNA interactions. Motif analyses were performed using the MEME suite (Bailey et al., 2009). The Venn diagram shows the overlap between the interactions found in all ChiX sRNA-mRNA interactions, those interactions uniquely found in the CLASH data (CLASH unique) and those supported by less than four reads (chimeras < 4 reads). The number of target sequences that contained the common motif and the E-value of MEME are shown. (B) Identified motifs show sequence complementarity to known seed sequences. The green coloured nucleotides indicate the experimentally verified seed sequence. The Motif Alignment Search Tool (MAST) was used to determine the degree of complementarity between the identified motifs in putative mRNA targets and the sRNA. The MAST p-values indicate the overall match between the identified motifs and the sRNA sequence (Bailey et al., 2009).
Figure 4—figure supplement 2
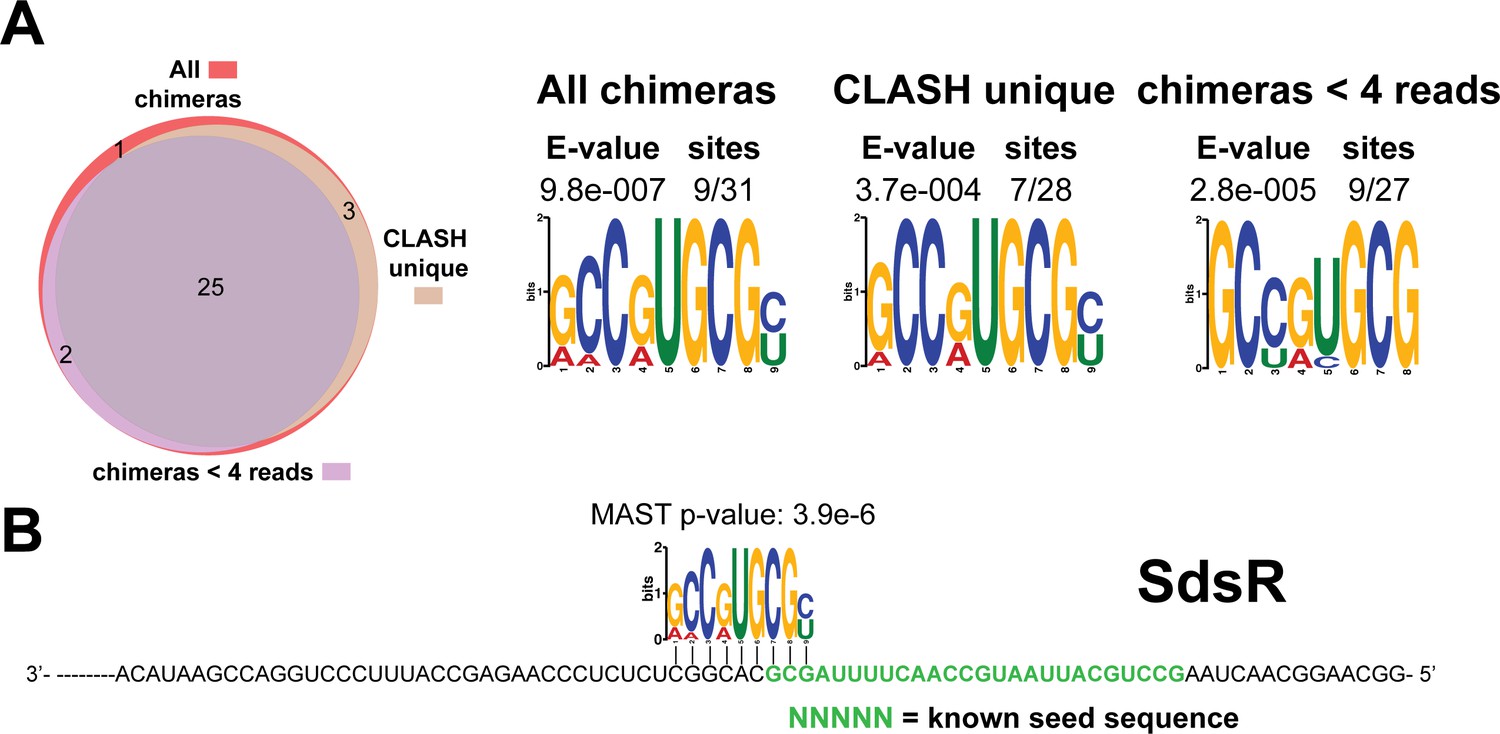
Identification of complementary sequence motifs in predicted SdsR mRNA targets.
(A–B) Motif analyses of mRNA sequences found in SdsR sRNA-mRNA interactions. Most of the SdsR interactions with mRNAs we found were uniquely detected in our CLASH data, as illustrated by the Venn diagram. Motif analyses were performed using the MEME suite (Bailey et al., 2009). The number of target sequences that contained the common motif and the E-value of MEME are shown. The identified motifs in the mRNA targets also show sequence complementarity to the sRNA sequence. The green coloured nucleotides indicate the experimentally verified seed sequence. The Motif Alignment Search Tool (MAST) was used to determine the degree of complementarity between the identified motifs in putative mRNA targets and the putative sRNA. The MAST p-values indicate the overall match between the identified motifs and the sRNA sequence (Bailey et al., 2009).
Figure 4—figure supplement 3
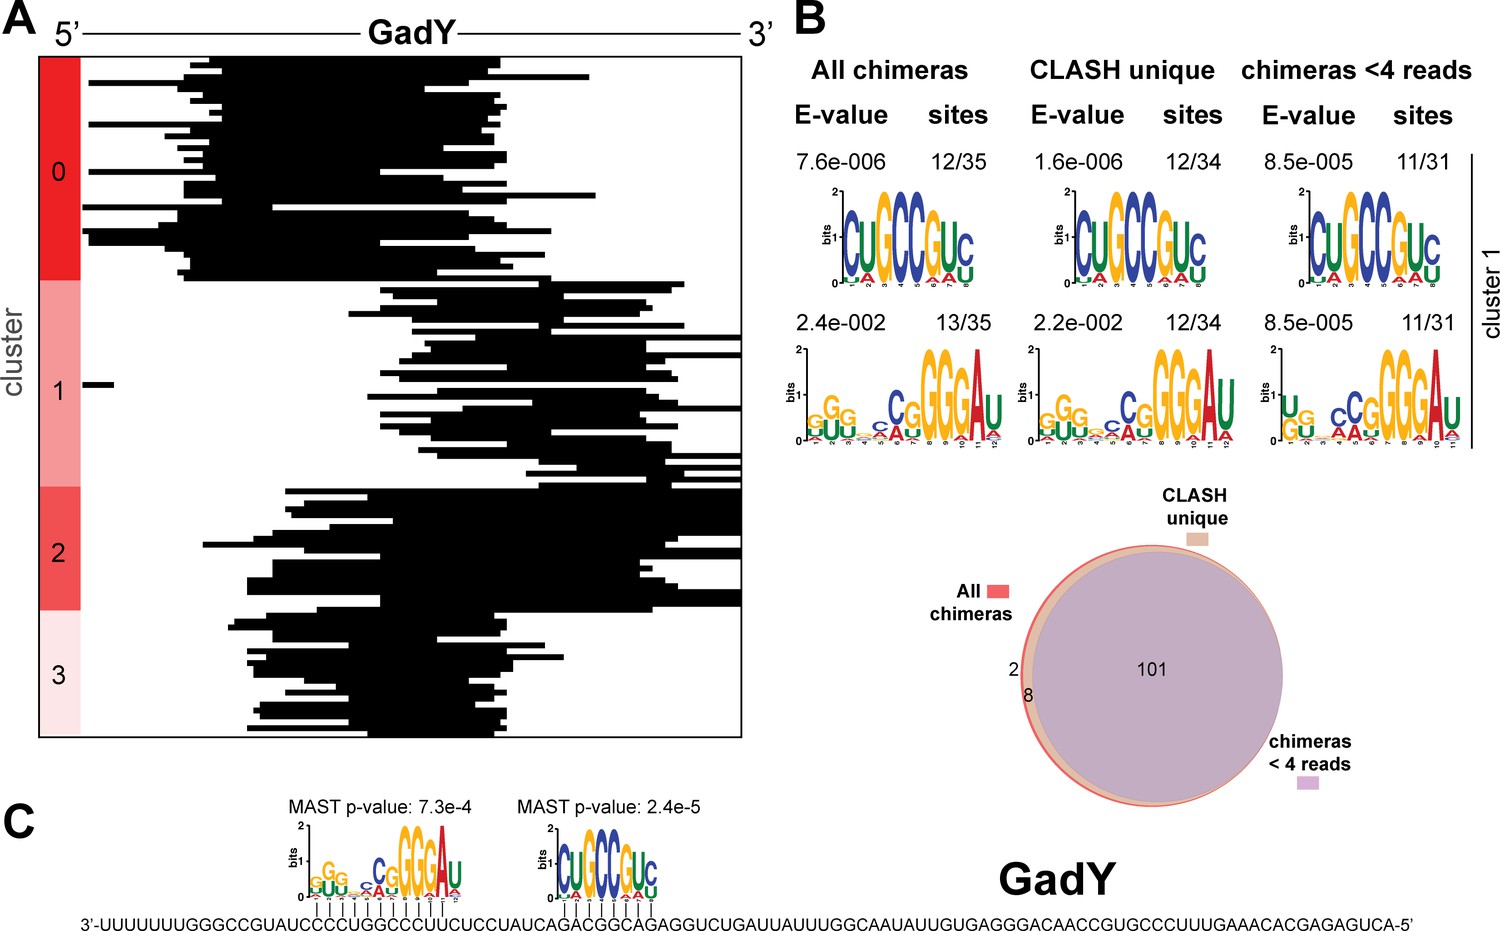
Identification of complementary sequence motifs in predicted GadY mRNA targets.
(A) K-means cluster analyses of sRNA sequences found in GadY sRNA-mRNA chimeras. (B) Motif analyses of mRNA sequences found in sRNA-mRNA interactions from each cluster. Motif analyses were performed using the MEME suite (Bailey et al., 2009). The number of target sequences that contained the common motif and the E-value of MEME are shown. The Venn diagram shows the overlap between the interactions found in all the GadY sRNA-mRNA interactions, those interactions uniquely found in the CLASH data (CLASH unique) and those supported by less than four reads (chimeras < 4 reads). (C) Identified motifs show sequence complementarity to known seed sequences. The Motif Alignment Search Tool (MAST) was used to determine the degree of complementarity between the identified motifs in putative mRNA targets and the sRNA. The MAST p-values indicate the overall match between the identified motifs and the sRNA sequence (Bailey et al., 2009).
Figure 4—figure supplement 4
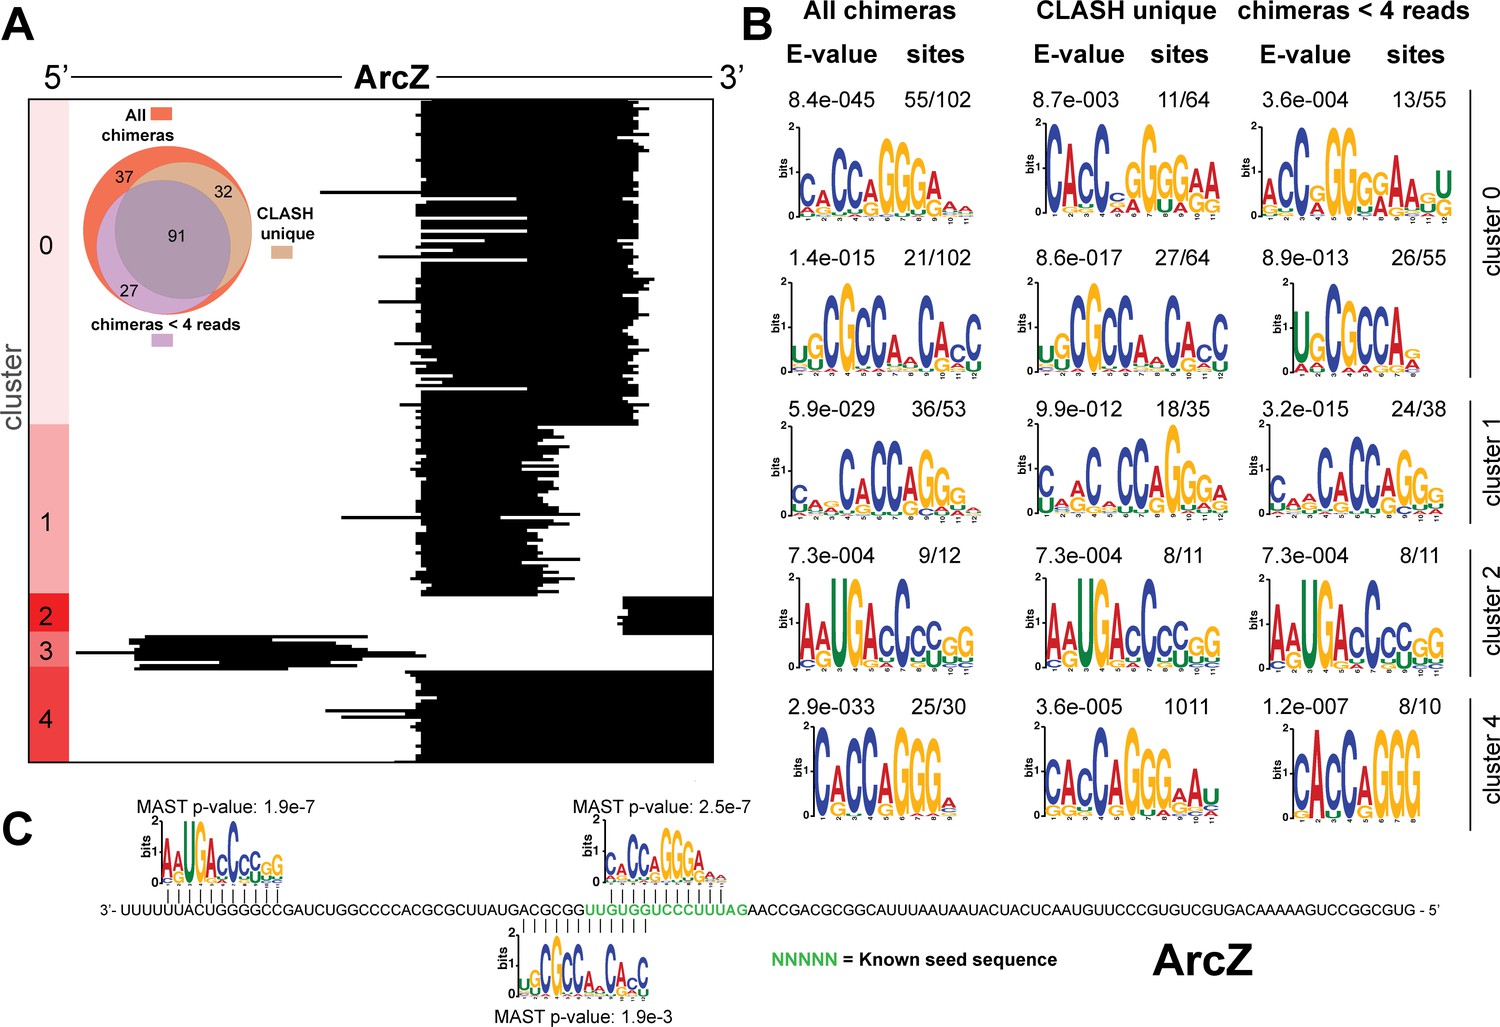
Identification of complementary sequence motifs in predicted ArcZ mRNA targets.
(A) K-means cluster analyses of sRNA sequences found in ArcZ sRNA-mRNA chimeras. The Venn diagram shows the overlap between the interactions found in all the ArcZ sRNA-mRNA interactions, those interactions uniquely found in the CLASH data (CLASH unique) and those supported by less than four reads (chimeras < 4 reads). (B) Motif analyses of mRNA sequences found in sRNA-mRNA interactions from each cluster. Motif analyses were performed using the MEME suite (Bailey et al., 2009). The number of target sequences that contained the common motif and the E-value of MEME are shown. (C) Identified motifs show sequence complementarity to known seed sequences. The green coloured nucleotidesindicate the experimentally verified seed sequence. The Motif Alignment Search Tool (MAST) was used to determine the degree of complementarity between the identified motifs in putative mRNA targets and the sRNA. The MAST p-values indicate the overall match between the identified motifs and the sRNA sequence (Bailey et al., 2009).
Figure 4—figure supplement 5
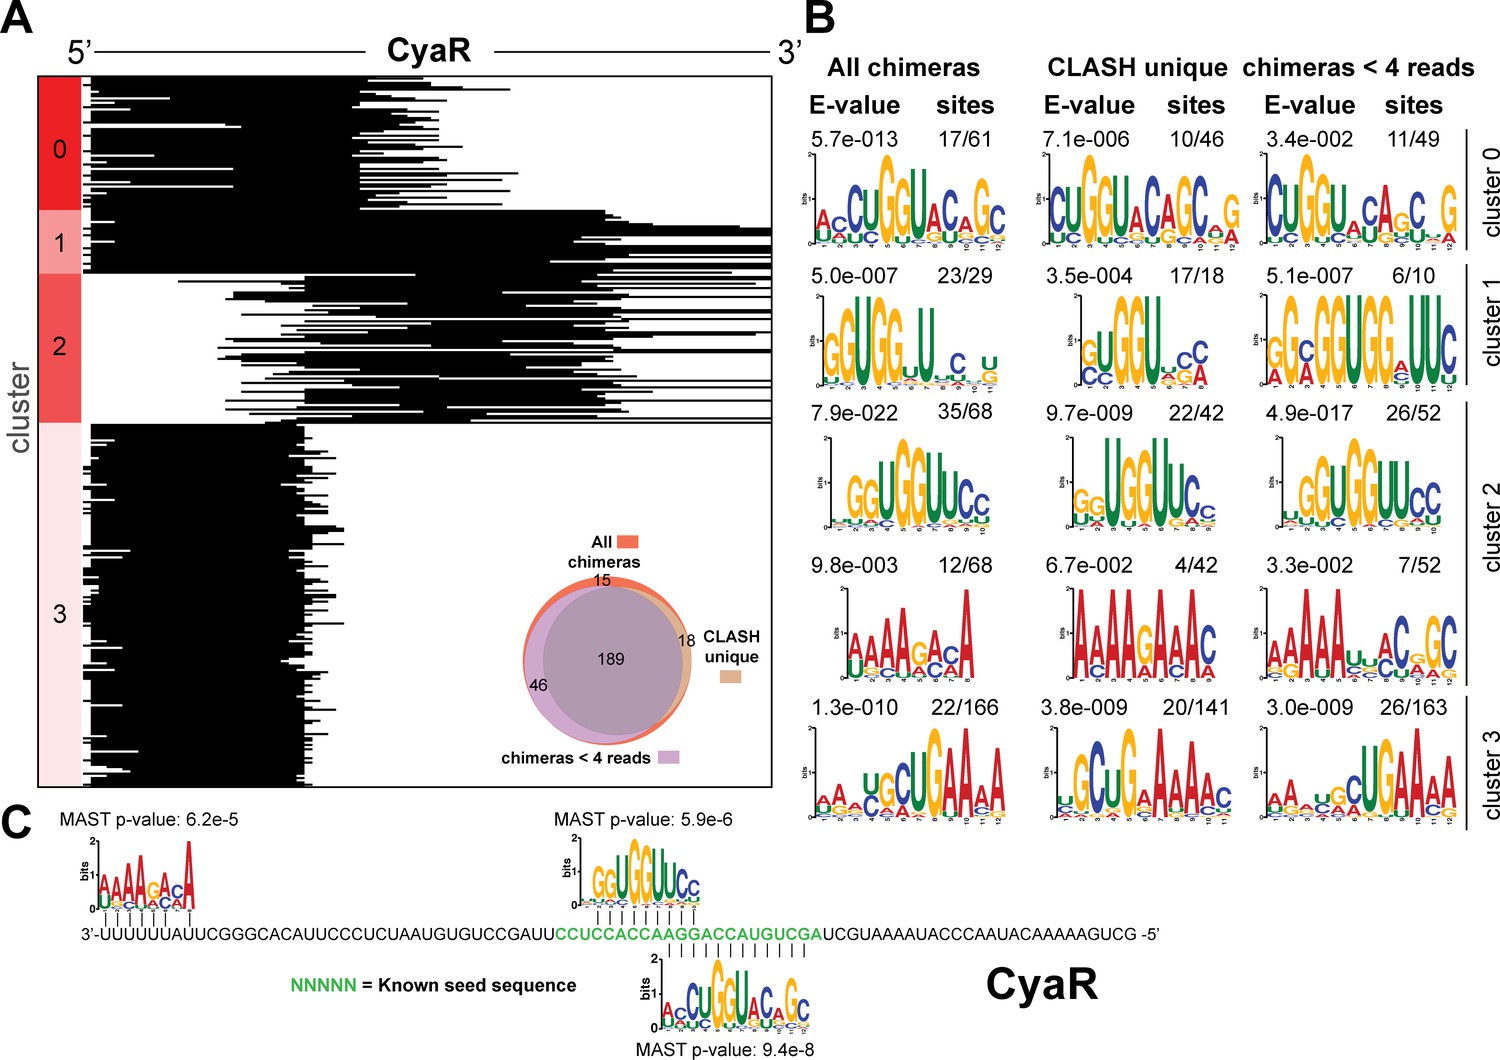
Identification of complementary sequence motifs in predicted GadY mRNA targets.
Same as in Figure 4—figure supplement 4, but now for CyaR.
Figure 4—figure supplement 6
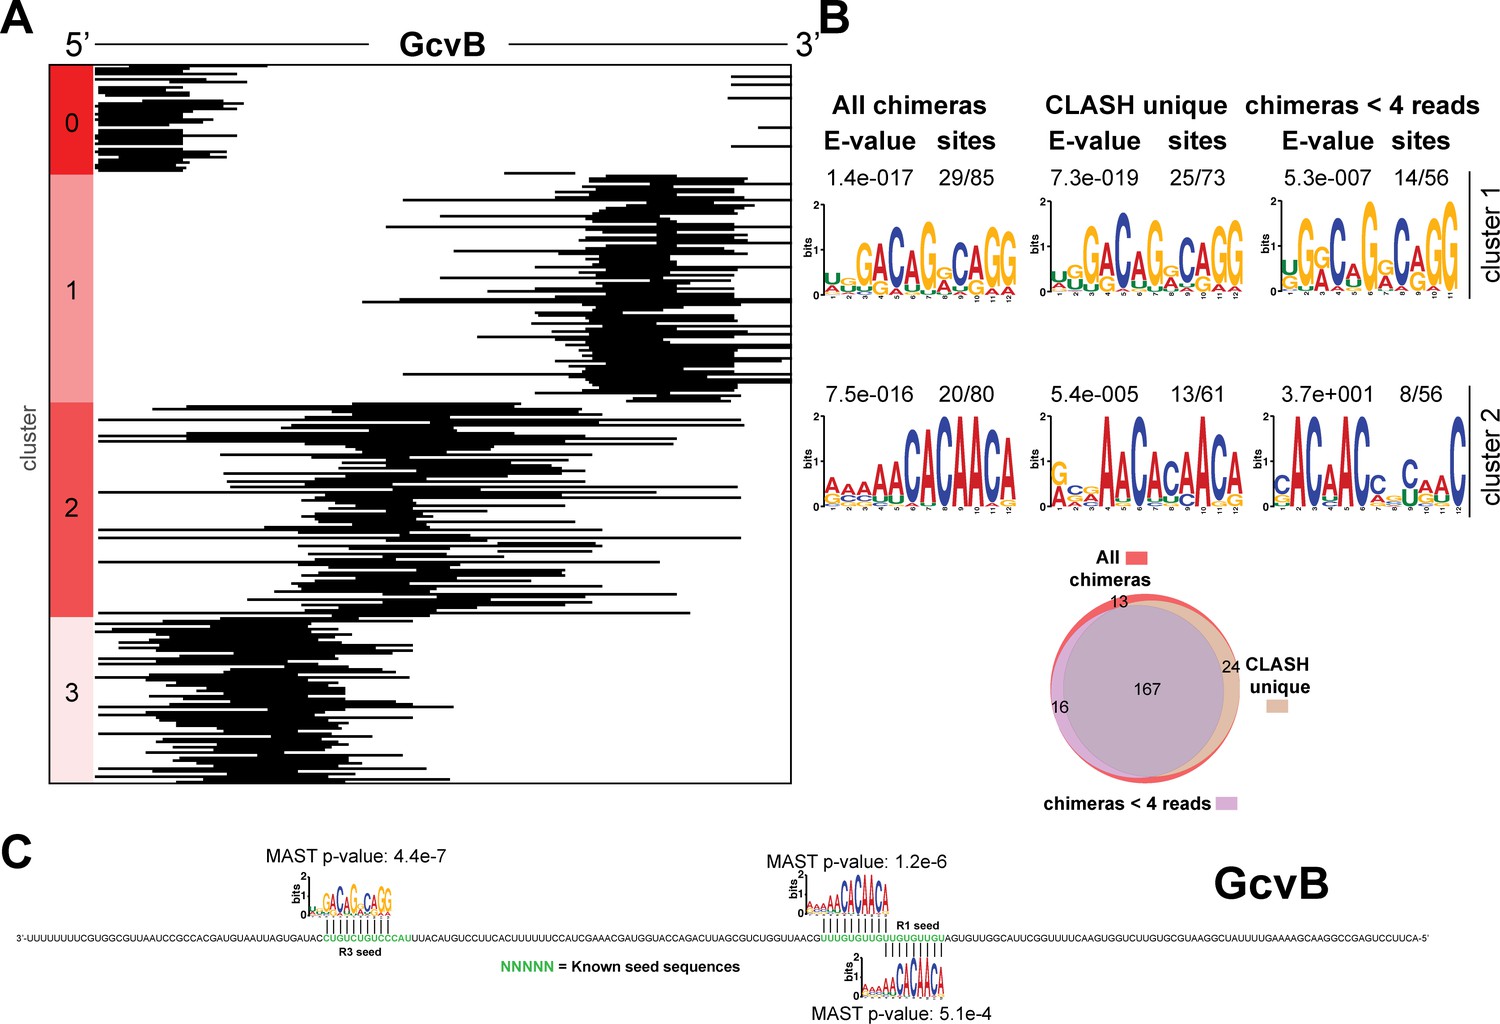
Identification of complementary sequence motifs in predicted GcvB mRNA targets.
Same as in Figure 4—figure supplement 3, but now for GcvB.
Figure 4—figure supplement 7
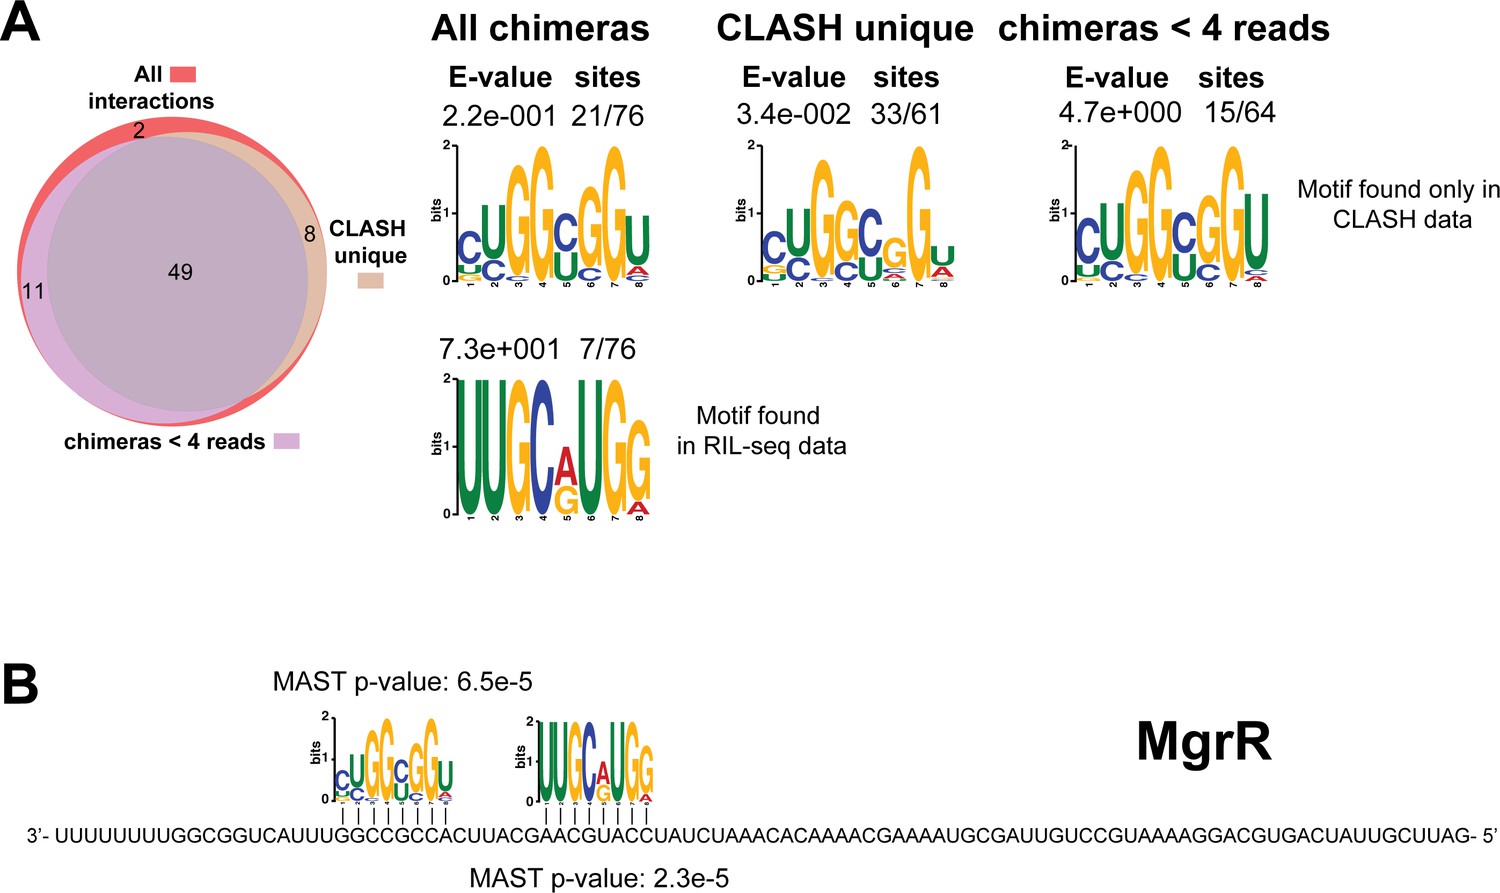
Identification of complementary sequence motifs in predicted MgrR mRNA targets.
Same as in Figure 4—figure supplement 1, but now for MgrR. The Venn diagram shows the overlap between the interactions found in all the MgrR sRNA-mRNA interactions, those interactions uniquely found in the CLASH data (CLASH unique) and those supported by less than four reads (chimeras < 4 reads). Although the motif identified in the RIL-seq data was not significantly enriched, we identified a second complementary sequence motif that is significantly enriched in the CLASH unique data.
Figure 4—figure supplement 8

Identification of complementary sequence motifs in predicted MicA mRNA targets.
Same as in Figure 4—figure supplement 7, but now for MicA. The green coloured nucleotides indicate the experimentally verified seed sequence.
Figure 4—figure supplement 9
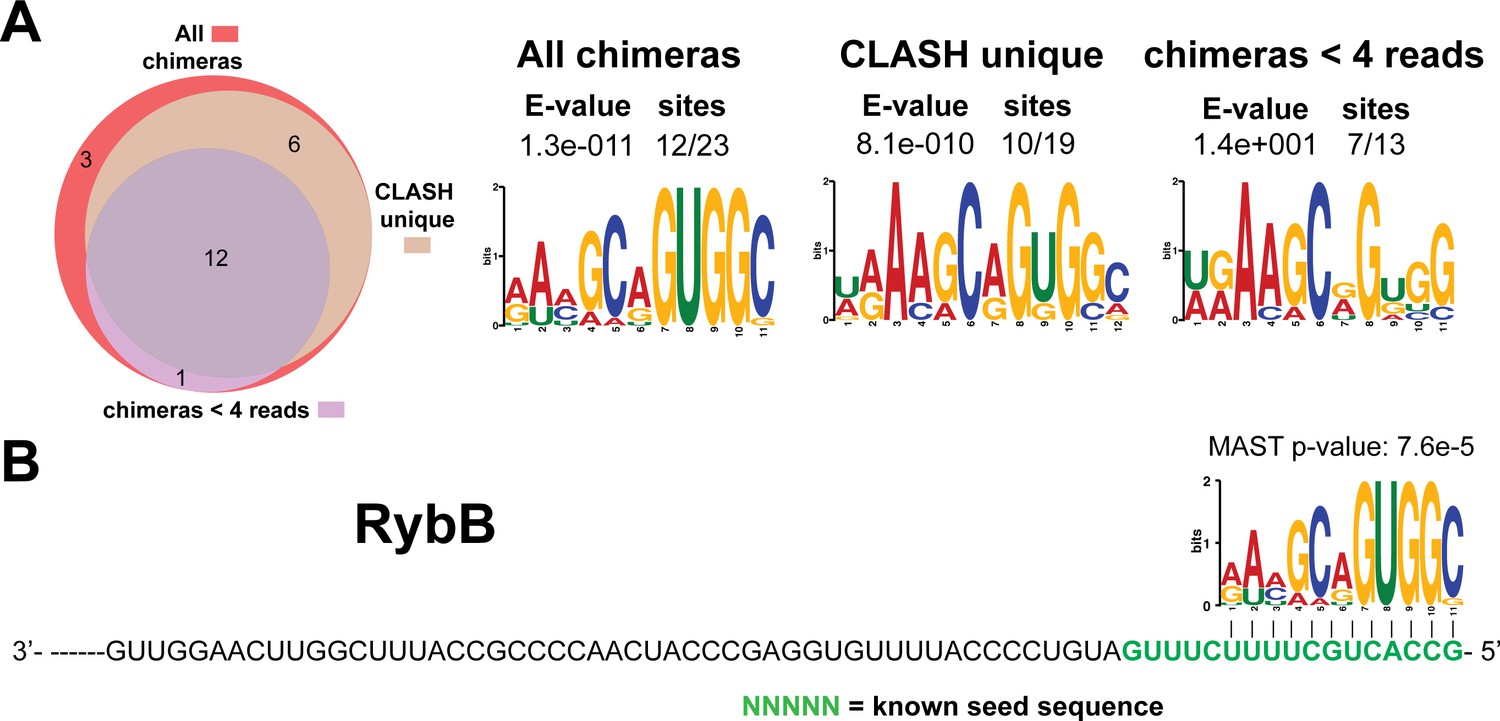
Identification of complementary sequence motifs in predicted RybB mRNA targets.
Same as in Figure 4—figure supplement 7, but now for RybB. The green coloured nucleotides indicate the experimentally verified seed sequence.
Figure 4—figure supplement 10
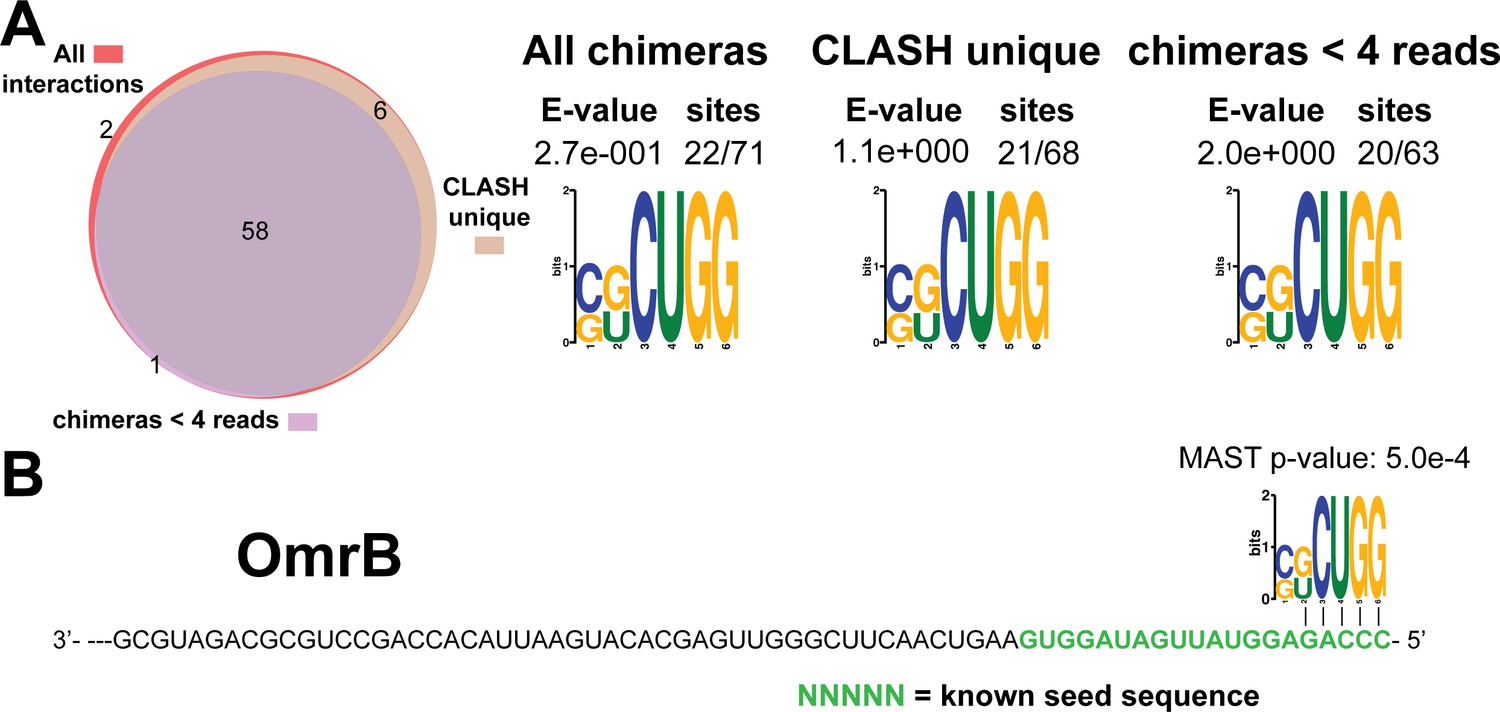
Identification of complementary sequence motifs in predicted OmrB mRNA targets.
Same as in Figure 4—figure supplement 7, but now for OmrB. The green coloured nucleotides indicate the experimentally verified seed sequence.
Figure 4—figure supplement 11
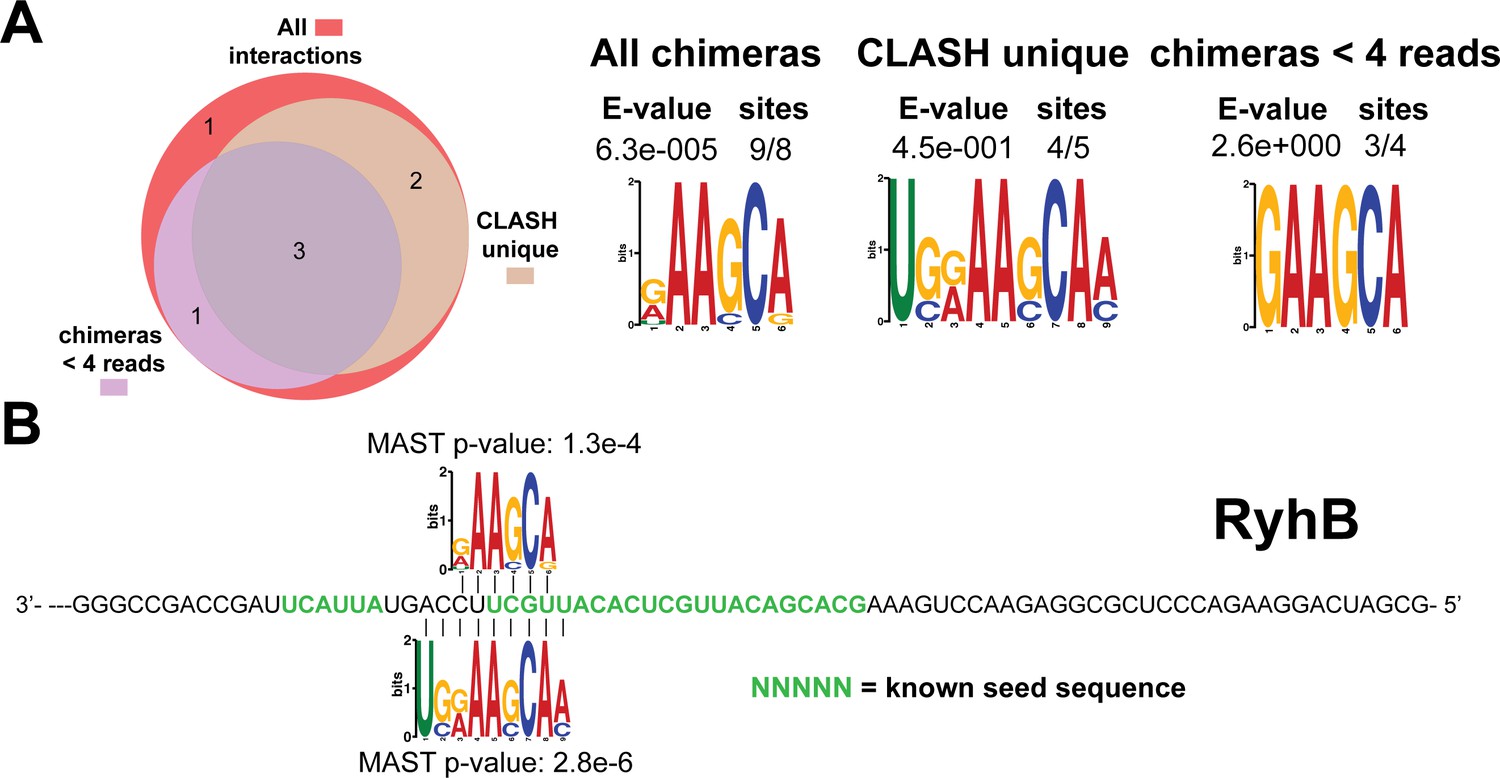
Identification of complementary sequence motifs in predicted RyhB mRNA targets.
Same as in Figure 4—figure supplement 7, but now for RyhB. The green coloured nucleotides indicate the experimentally verified seed sequence.
Figure 4—figure supplement 12
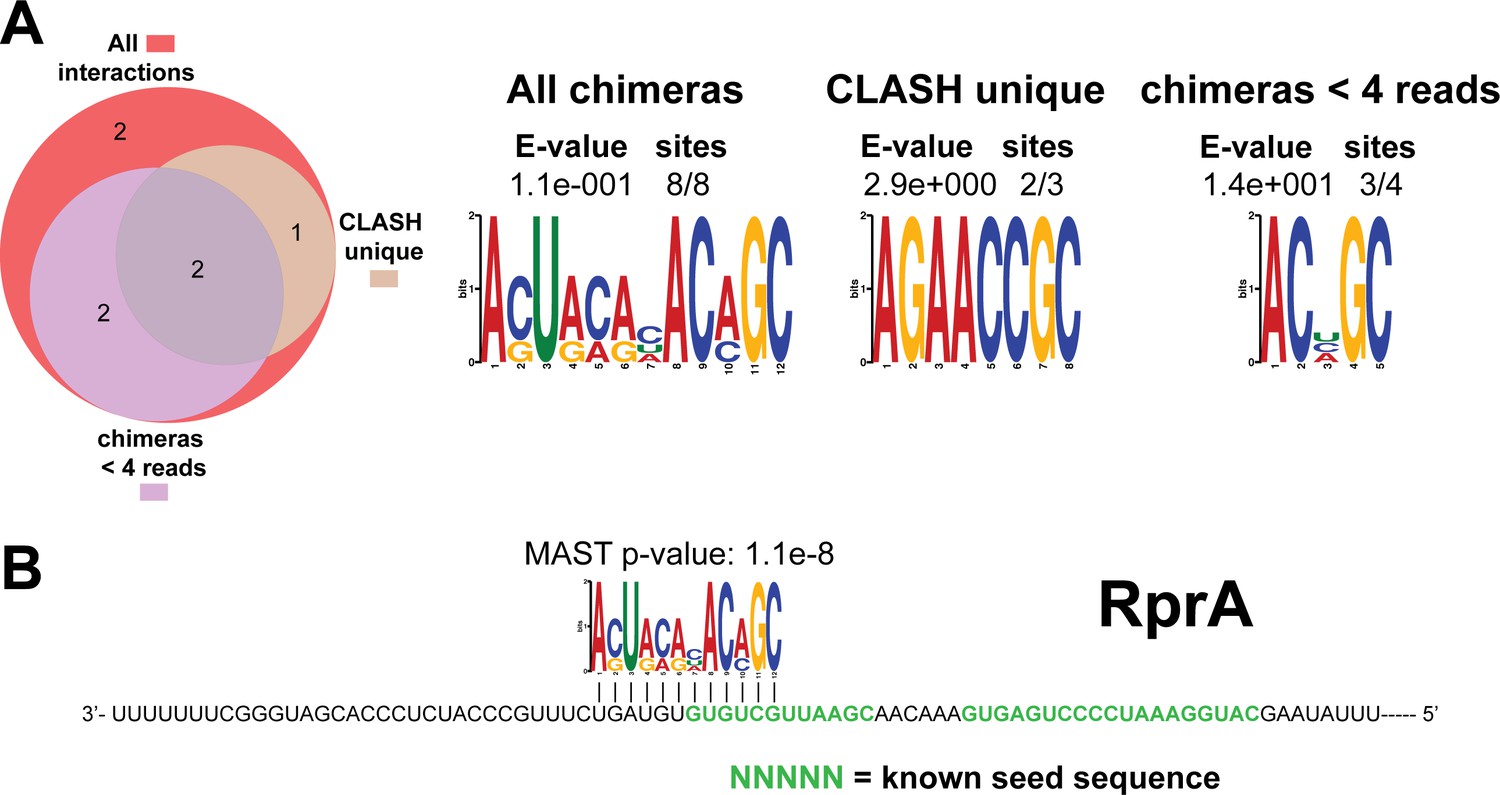
Identification of complementary sequence motifs in predicted RprA mRNA targets.
Same as in Figure 4—figure supplement 7, but now for RprA. The green coloured nucleotides indicate the experimentally verified seed sequences.
Figure 4—figure supplement 13

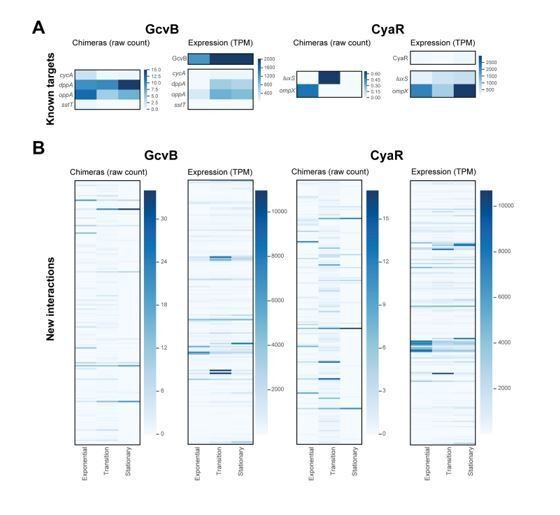
CLASH targets are highly enriched in MAPS data.
(A) Predicted CyaR mRNA targets are highly enriched in MAPS data (Lalaouna et al., 2018). The cumulative distribution plots show the cumulative frequencies of the log2-fold enrichment of transcripts in the MAPS data relative to the control sample. Values of the interacting mRNA partners found in the CLASH chimeras are shown in red, blue or yellow and all the other genes are in black. (B) Predicted GcvB mRNA targets are highly enriched in MAPS data (Lalaouna et al., 2019). The cumulative distribution plots show the cumulative frequencies of the log2-fold enrichment of transcripts in the MAPS data relative to the control sample. Values of the interacting mRNA partners found in the CLASH data are shown in red, blue or yellow and all the other genes are in black. The statistical significance of the difference between the two distributions is represented as a p-value using a Kolmogorov-Smirnov test.
Figure 5 with 4 supplements
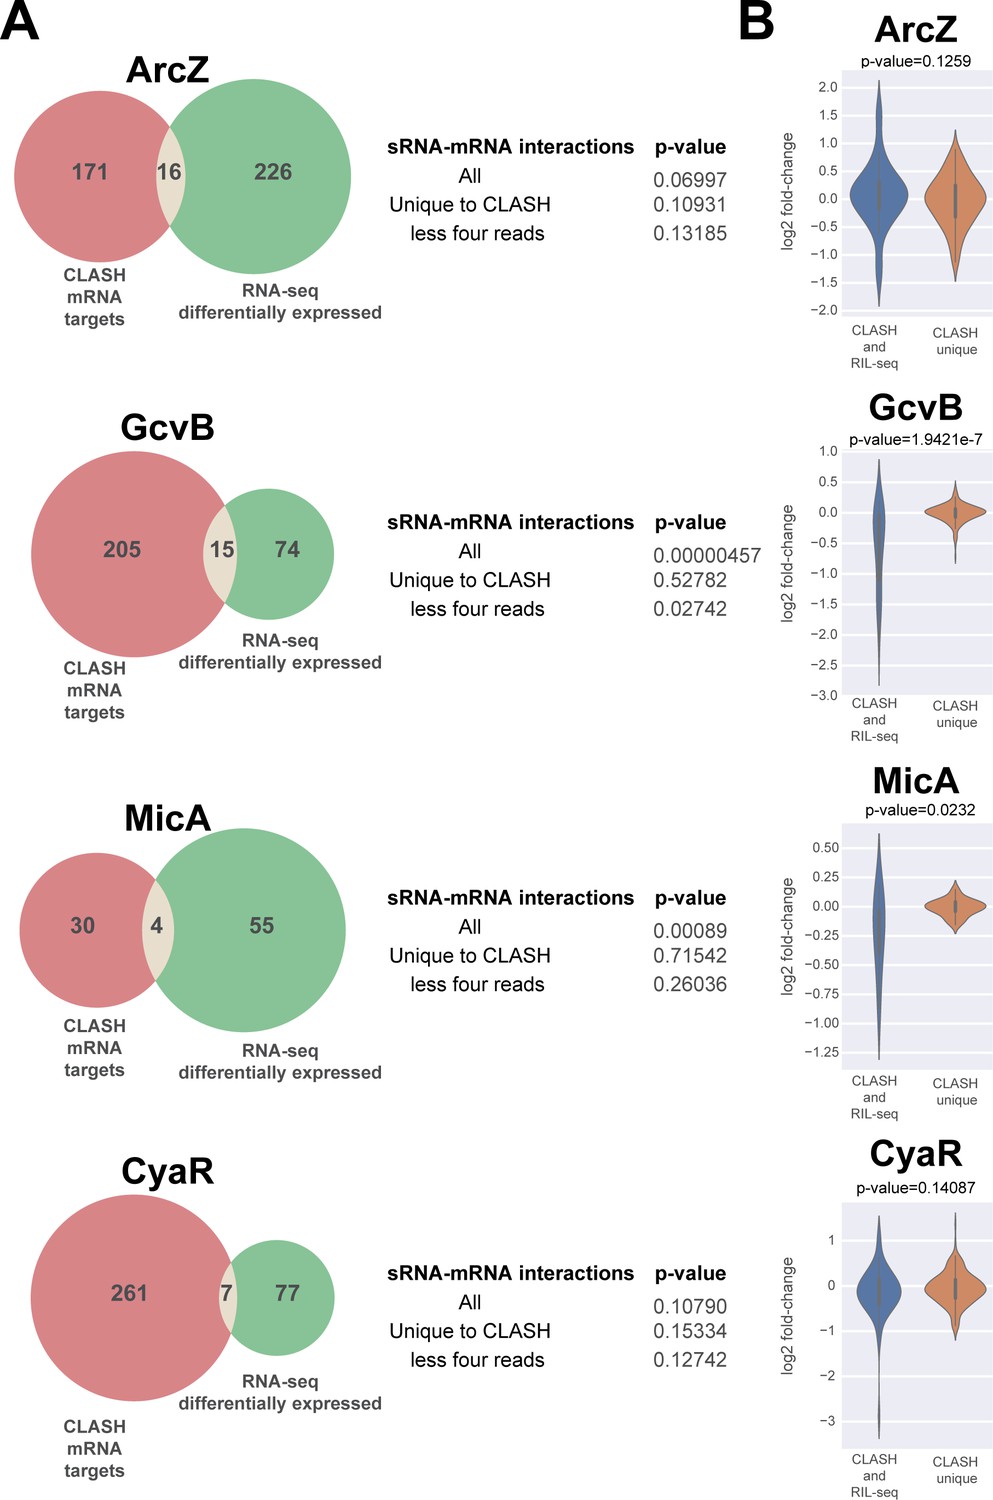
A subset of putative mRNA targets identified by CLASH show gene expression changes upon over-expression of the sRNA.
The Venn diagrams show how many of the predicted mRNA targets were also found to be differentially expressed in sRNA over-expression RNA-seq data (Faigenbaum-Romm et al., 2020). The GcvB and MicA CLASH mRNA targets are highly enriched for genes that are differentially expressed in the over-expression RNA-seq data (p-value<0.001). The statistical significance was calculated using a hypergeometric test. Interactions that are generally presented by a relatively low number of reads (‘CLASH unique’ and ‘less four reads’ categories) are not significantly enriched for differentially expressed genes. (B) The mRNA targets found in GcvB and MicA interactions found in both RIL-seq and CLASH show significantly higher fold-changes in the over-expression data compared to the interactions uniquely found in the CLASH data. The violin plots show the distribution of fold-changes in mRNA target expression (y-axis) in the over-expression RNA-seq data for chimeras supported by CLASH and RIL-seq and those found in CLASH only (x-axis). Statistical significance between the two groups was calculated using a Mann-Whitney U test.
Figure 5—figure supplement 1

Impact of the identified interactions on gene expression levels of GcvB mRNA targets predicted by CLASH.
Plotted on the y-axis is the average expression profile of the data from the wild-type strain. The x-axis shows the log2-fold change in expression of the targets upon GcvB over-expression in Salmonella typhimurium (Sharma et al., 2011). We assumed that over-expression of sRNAs in S. typhimurium would have a similar effect as in E. coli. We analysed all the mRNA fragments found in chimeras with GcvB (red), interactions only found in the CLASH data (CLASH unique; yellow) and those supported by less than four reads (less four chimeras; blue). The cumulative distribution plots show the cumulative frequencies of the t-statistics values of the interacting partners in red, blue or yellow and all other genes in black. The statistical significance of the difference between these two distributions is represented as a p-value using Kolmogorov-Smirnov test. T-statistic values were calculated using the eBayes function of the limma package (Ritchie et al., 2015).
Figure 5—figure supplement 2
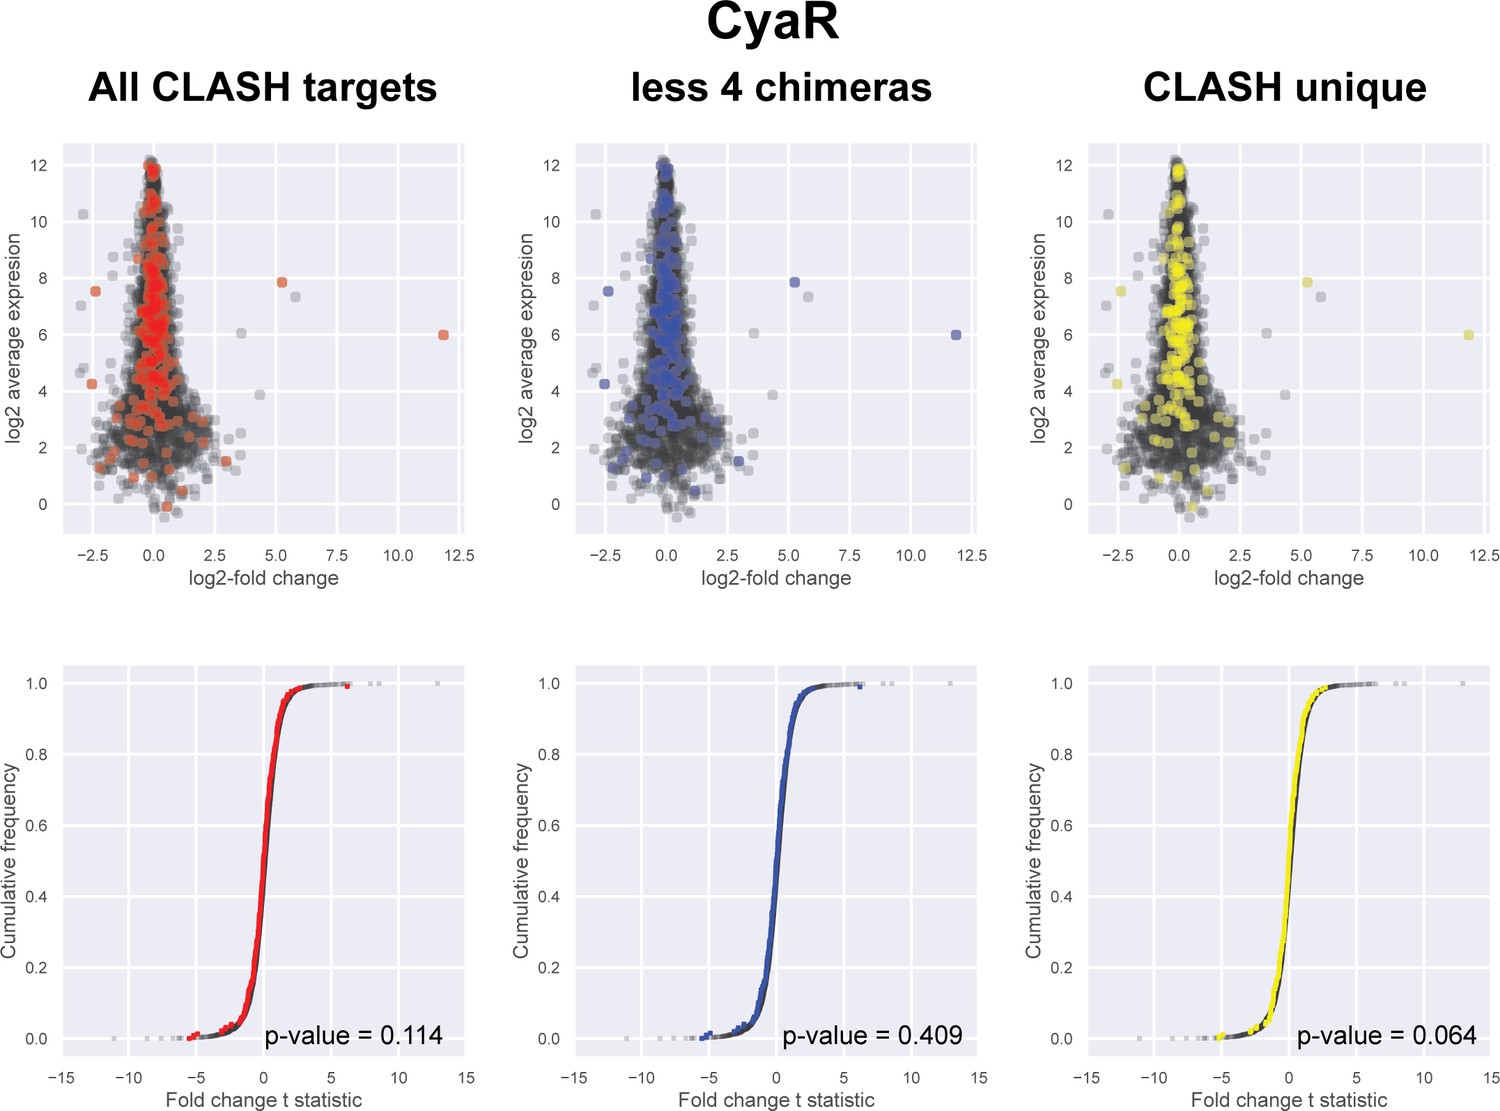
Impact of the identified interactions on gene expression levels of CyaR mRNA targets predicted by CLASH.
(A) Plotted on the y-axis is the average expression profile of the data from the wild-type strain. The x-axis shows the log2-fold change in expression of the targets upon CyaR over-expression in Escherichia coli (De Lay and Gottesman, 2009). We analysed all the mRNA fragments found in chimeras with CyaR (red), interactions only found in the CLASH data (CLASH unique; yellow) and those supported by less than four reads (less four chimeras; blue). The cumulative distribution plots show the cumulative frequencies of the t-statistics values of the interacting partners in red, blue or yellow and all other genes in black. The statistical significance of the difference between these two distributions is represented as a p-value using Kolmogorov-Smirnov test.
Figure 5—figure supplement 3

Impact of the identified interactions on gene expression levels of Spot42 mRNA targets predicted by CLASH.
Plotted on the y-axis is the average expression profile of the data from the wild-type strain. The x-axis shows the log2-fold change in expression of the targets upon Spot42 over-expression in Escherichia coli (Beisel and Storz, 2011). We analysed all the mRNA fragments found in chimeras with Spot42, the predicted interactions only found in the CLASH data (CLASH unique) and those supported by less than four reads (less four chimeras). The cumulative distribution plots show the cumulative frequencies of the t-statistics values of the interacting partners in red, blue or yellow and all other genes in black. The statistical significance of the difference between these two distributions is represented as a p-value using Kolmogorov-Smirnov test. T-statistic values were calculated using the eBayes function of the limma package (Ritchie et al., 2015).
Figure 5—figure supplement 4
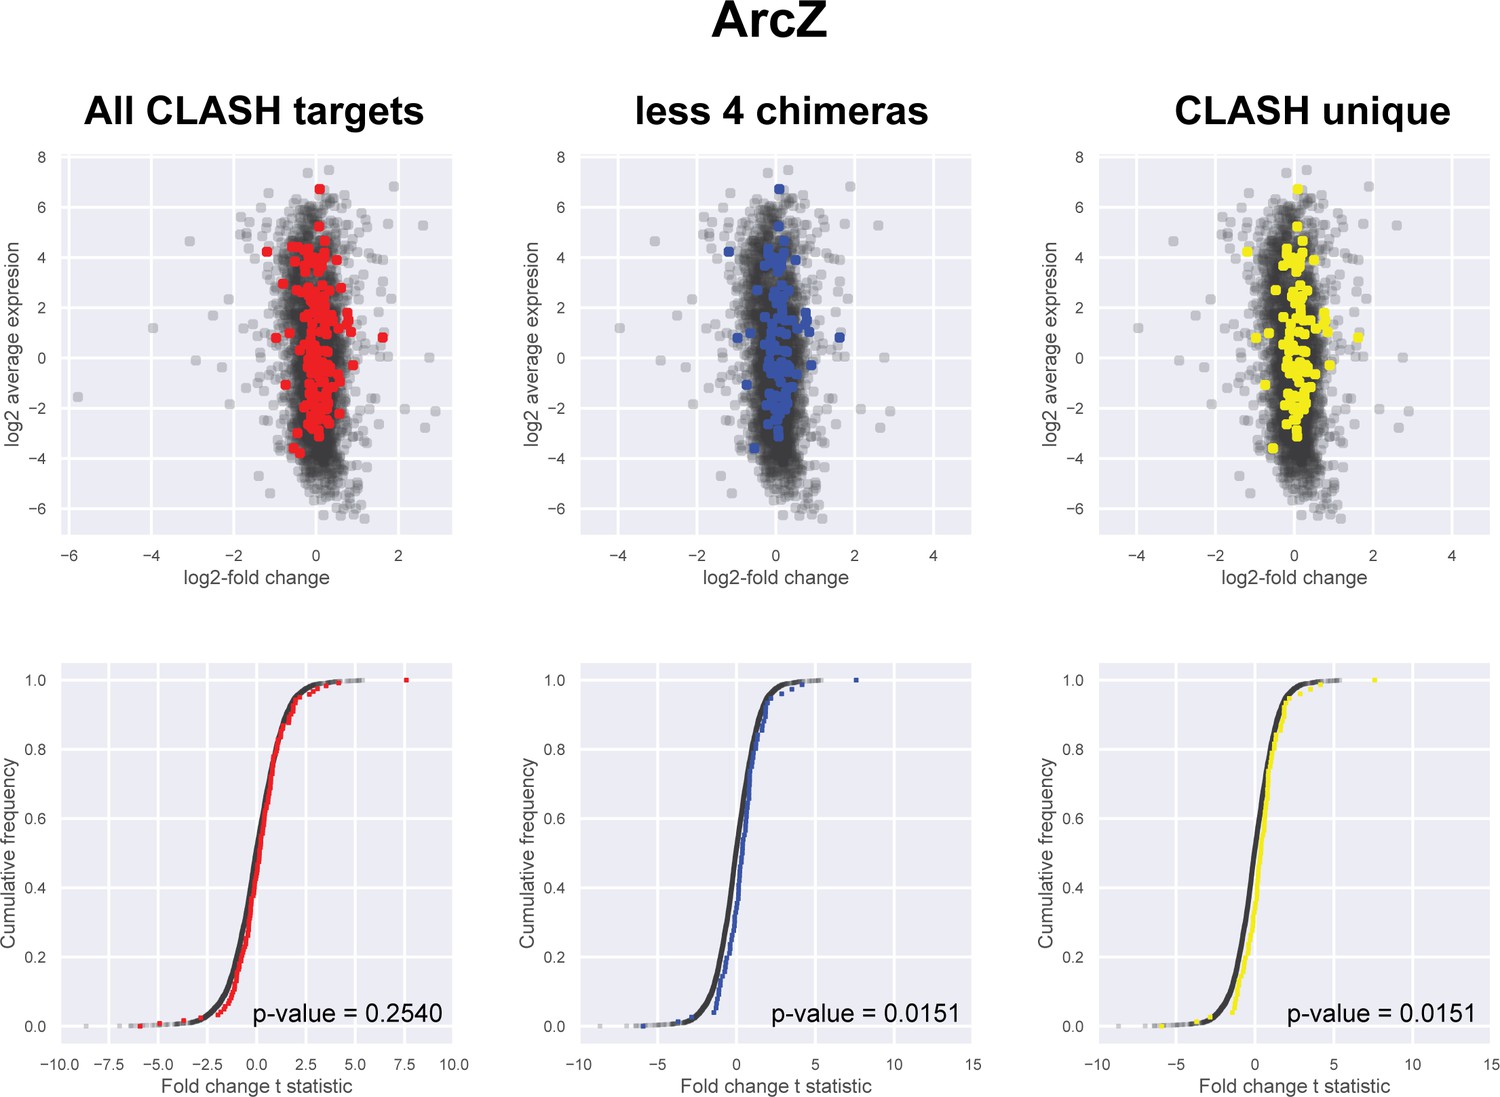
Impact of the identified interactions on gene expression levels of ArcZ mRNA targets predicted by CLASH.
Plotted on the y-axis is the average expression profile of the data from the wild-type strain. The x-axis shows the log2-fold change in expression of the targets upon ArcZ over-expression in Salmonella typhimurium (Papenfort et al., 2009). We assumed that over-expression of sRNAs in S. typhimurium would have a similar effect as in E. coli. We analysed all the mRNA fragments found in chimeras with ArcZ, the predicted interactions only found in the CLASH data (CLASH unique) and those supported by less than four reads (less four chimeras). The cumulative distribution plots show the cumulative frequencies of the t-statistics values of the interacting partners in red, blue or yellow and all other genes in black. The statistical significance of the difference between these two distributions is represented as a p-value using Kolmogorov-Smirnov test. T-statistic values were calculated using the eBayes function of the limma package (Ritchie et al., 2015).
Figure 6 with 2 supplements
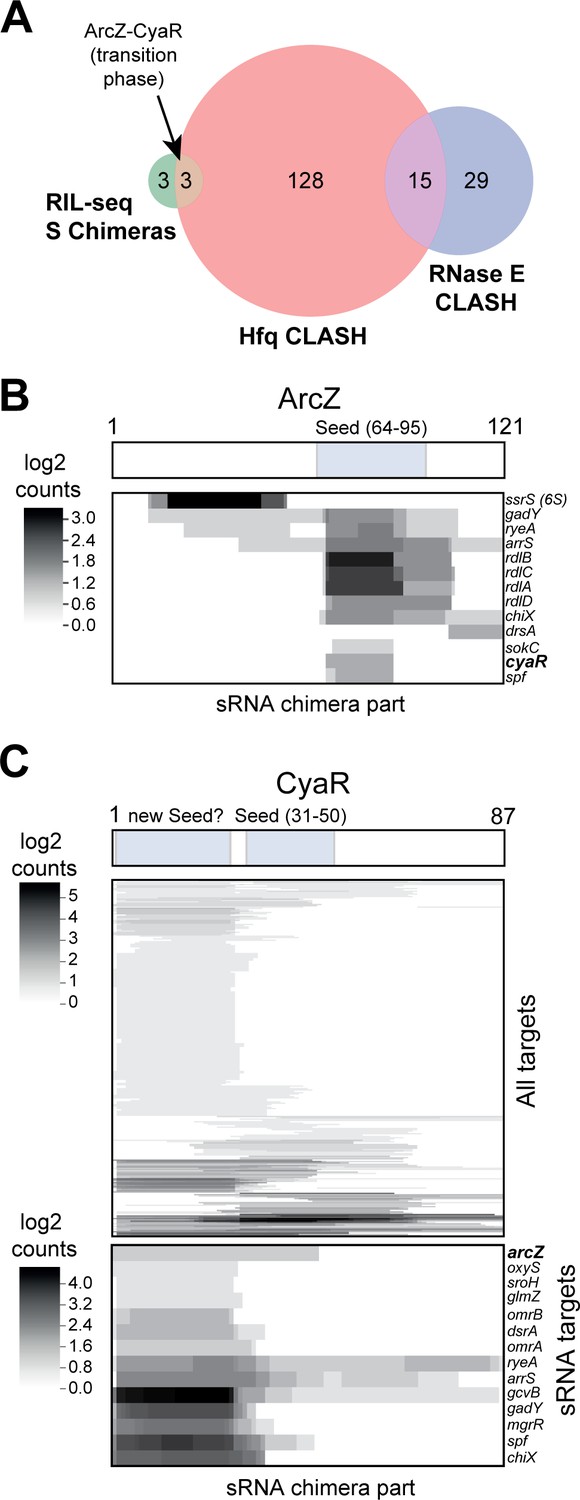
sRNA-RNA interactions identified by CLASH.
(A) Hfq CLASH uncovers sRNA-sRNA interaction networks: comparison between statistically filtered sRNA-sRNA interactions in the Hfq CLASH data, RIL-seq S-chimeras (Melamed et al., 2016) (log and stationary) and RNase E CLASH (Waters et al., 2017). Only independently transcribed sRNAs were considered. (B–C) Heatmaps showing the read density (log2(chimera count+1)) of chimeric fragments mapping to ArcZ (B) and CyaR (C). The location of the known sRNA seed sequences as well as the predicted new CyaR seed is indicated above the heatmap. Note that the ArcZ processing site is located just upstream of the seed sequence.
Figure 6—figure supplement 1

sRNA-RNA interactions identified by CLASH are growth-stage specific.
sRNA-sRNA network generated from the statistically significant CLASH interactions recovered at three main growth stages: exponential (OD600 0.4 and 0.8), transition (OD600 1.2, 1.8, 2.4) and early stationary (OD600 3.0 and 4.0). The thickness of the edges is proportional to the log2(unique chimera count +1) for each interaction. Only sRNAs transcribed from independent promoters were included in the analysis.
Figure 6—figure supplement 2

Interactions between ArcZ, CyaR and GcvB are conserved.
Alignments of ArcZ, CyaR and GcvB were compiled as previously described (van Nues et al., 2016). Names of the enteric bacteria from which the sequence was retrieved are given on the left. Indicated are possible stem-loops (brackets), seed regions (boxed in dashed lines) and their interactions with various sections of ArcZ, CyaR or GcvB (blue and purple bars) or with other sRNAs and mRNAs (black bars). The CyaR sequence indicated with a blue bar is predicted to interact with two regions in GcvB (see blue bars in GcvB alignment), including the second seed sequence. A second interaction (pink bars) involves the seed sequence regions of CyaR and GcvB.
Figure 7
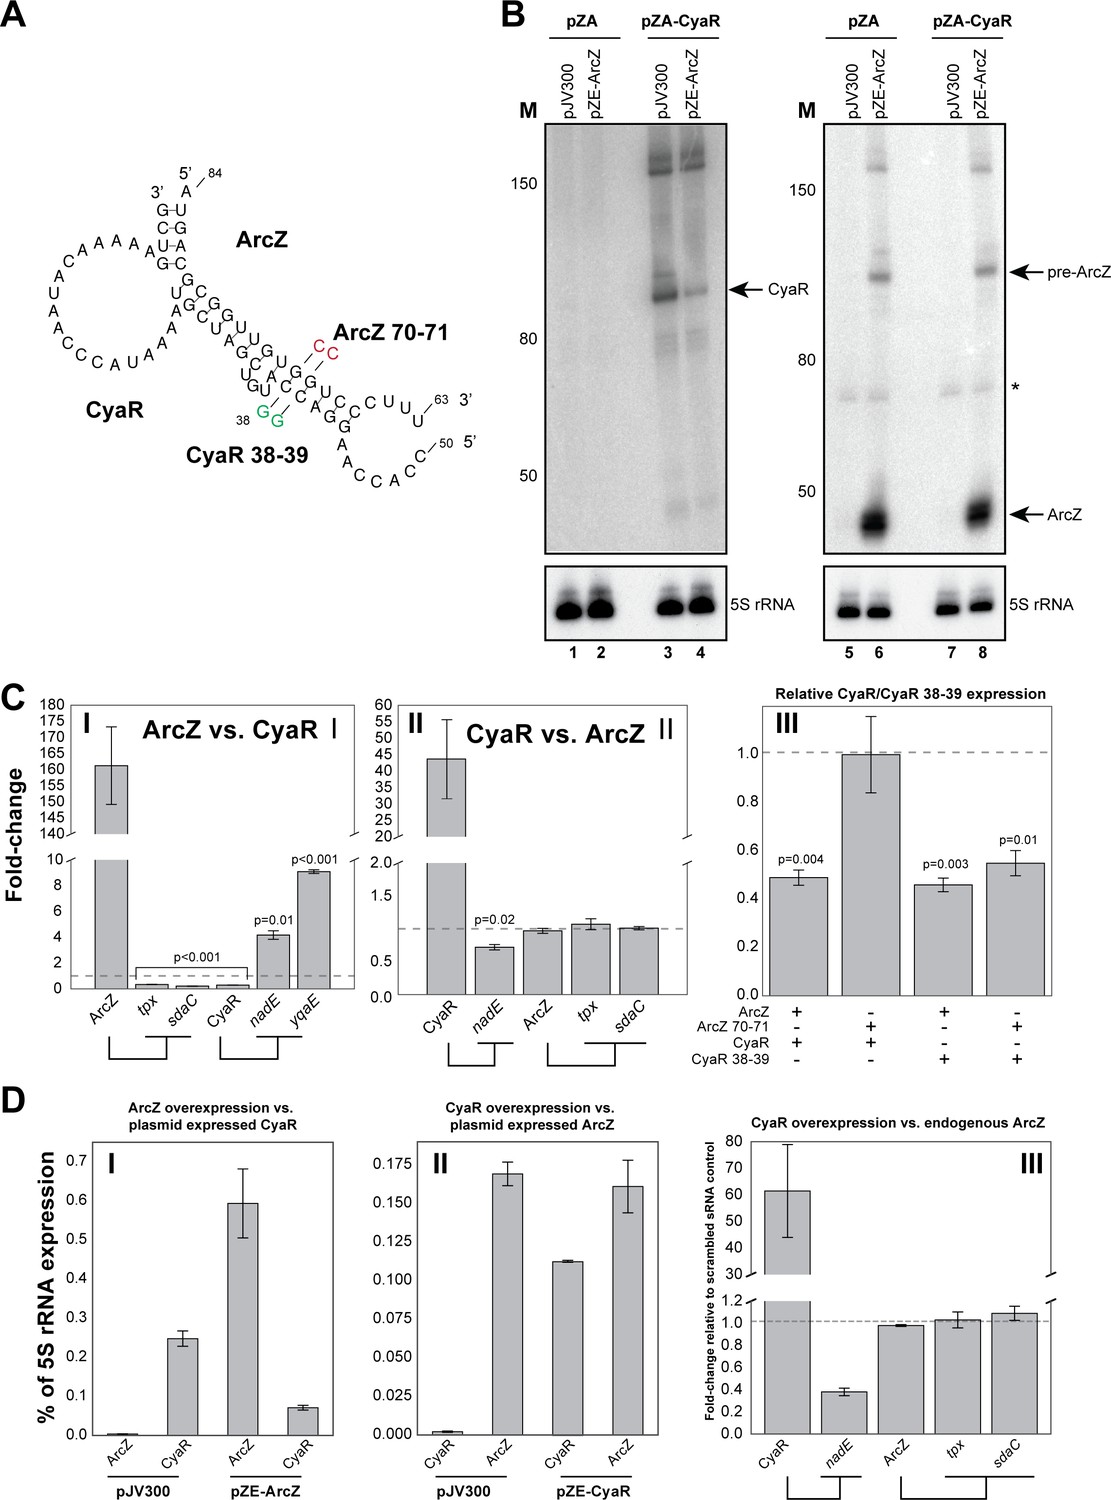
ArcZ can influence CyaR levels.
(A) Base-pairing interactions predicted from the ArcZ-CyaR chimeras using RNACofold. The nucleotide substitutions for experimental validation of direct base-pairing are shown as red or green residues. (B) Northern blot analysis of ArcZ and CyaR. The cells containing both the empty pZA and pJV300 plasmids (lanes 1, 5, 7) do not express ArcZ and CyaR at detectable levels. (C) Validation of ArcZ-CyaR interaction by over-expression analyses. ArcZ (panel I) orCyaR (panel II) was over-expressed and the levels of their targets were monitored by RT-qPCR. The tpx and sdaC mRNAs are ArcZ targets (panel I). The nadE and yqaE mRNAs are CyaR targets (panel II). The dashed horizontal line indicates the level in the control plasmid (pJV300) that expresses a ~50 nt randomly generated RNA sequence. Panel III: The sRNAs and mutants (as in (A)) were ectopically co-expressed in E. coli and CyaR and CyaR 38–39 levels were quantified by RT-qPCR. Experiments were performed in biological and technical triplicates; Error bars indicate the standard error of the mean (SEM) of the three biological replicates. (D) ArcZ and CyaR were overexpressed from a plasmid-borne IPTG inducible promoter (pZE-ArcZ and pZE-CyaR) and the data were compared to data from cells carrying plasmid pJV300. The co-expressed candidate target sRNAs (expressed from pZA-derived backbone) were induced with anhydrotetracycline hydrochloride (panels I and II). The bars indicate the mean fold-change in expression relative to the level of 5S rRNA (rrfD) in cells with the indicated vector. In panel III endogenous ArcZ levels were measured upon over-expression of CyaR. Error bars indicate the standard error of the mean from three biological replicates and three technical replicates per experiment. Source data are provided as a Source Data file.
-
Figure 7—source data 1
Source data for Figure 7B.
- https://cdn.elifesciences.org/articles/54655/elife-54655-fig7-data1-v2.xlsx
-
Figure 7—source data 2
Source data for Figure 7C.
- https://cdn.elifesciences.org/articles/54655/elife-54655-fig7-data2-v2.xlsx
-
Figure 7—source data 3
Source data for Figure 7D.
- https://cdn.elifesciences.org/articles/54655/elife-54655-fig7-data3-v2.xlsx
Figure 8 with 6 supplements
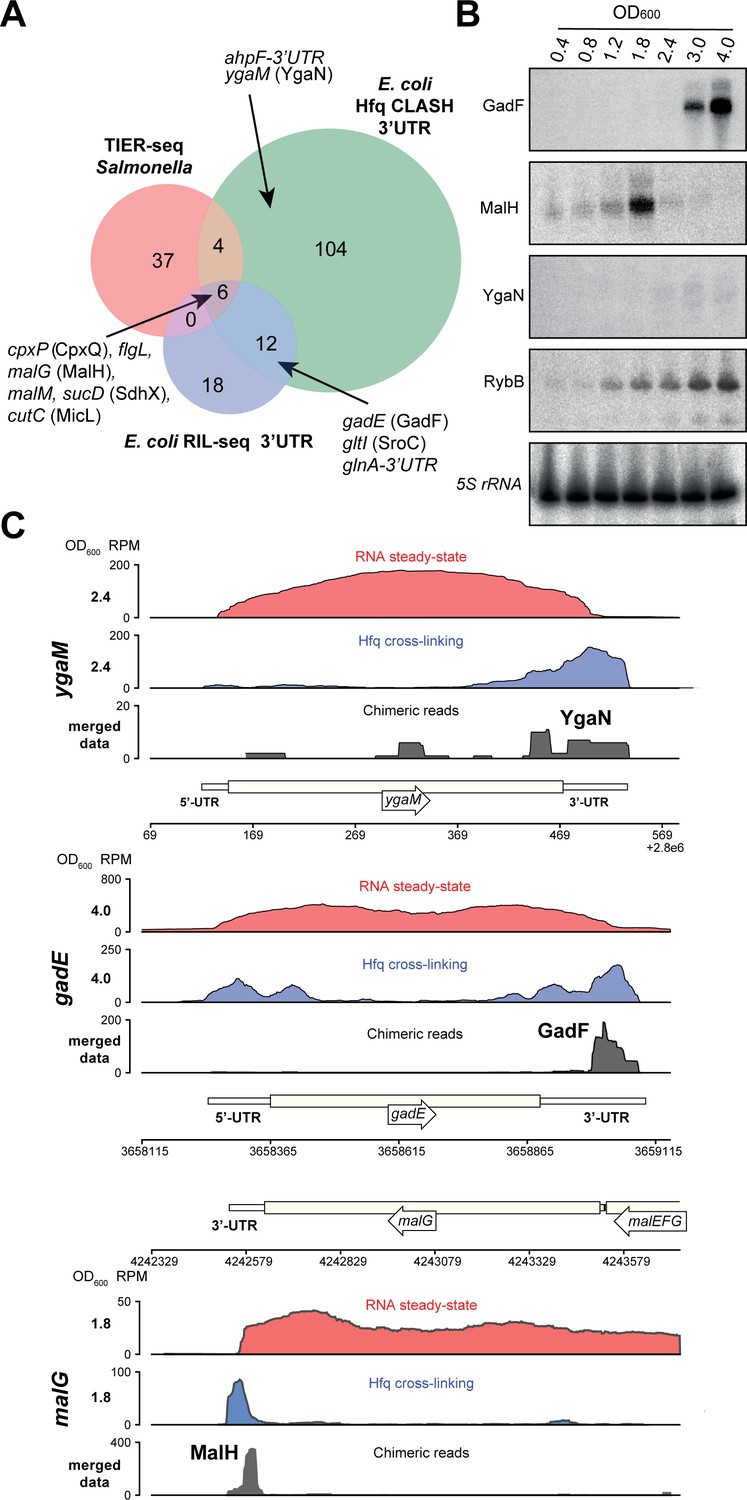
Hfq CLASH uncovers novel 3’UTR-derived sRNAs.
(A) Genes with their 3’UTRs found fused to mRNAs were selected from the statistically filtered CLASH data and RIL-seq S-chimera data. The RIL-seq S-chimeras (Melamed et al., 2016) (log and stationary phases)were filtered for3’UTR/EST3UTR annotations on either orientation of the mRNA-mRNA pairs. Both were intersected with the set of mRNAs that were predicted by TIER-seq studies (Chao et al., 2017) to harbour sRNAs that get released from 3’UTRs by RNase E processing. Known (CpxQ, SdhX, MicL, GadF, glnA-3’UTR and SroC) and novel 3’UTR derived sRNAs (MalH, flgL 3’UTR, ahpF-3’UTR and YgaN) are indicated. See Supplementary file 5 for the detailed comparison. (B) MalH is transiently expressed during the transition from exponential to stationary phase. RybB was probed as a sRNA positive control and 5S rRNA as the loading control. See Figure 8—figure supplement 4 for full-size blots. (C) Genome-browser snapshots of several regions containing candidate sRNAs for optical densities at which the RNA steady-state was maximal; the mRNA names and OD600 are indicated at the left side of the y-axes; the y-axis shows the normalized reads (RPM: reads per million); red: RPM of RNA steady-states from an RNA-seq experiment, blue: Hfq cross-linking from a CLASH experiment; black: unique chimeric reads found in this region.
Figure 8—figure supplement 1
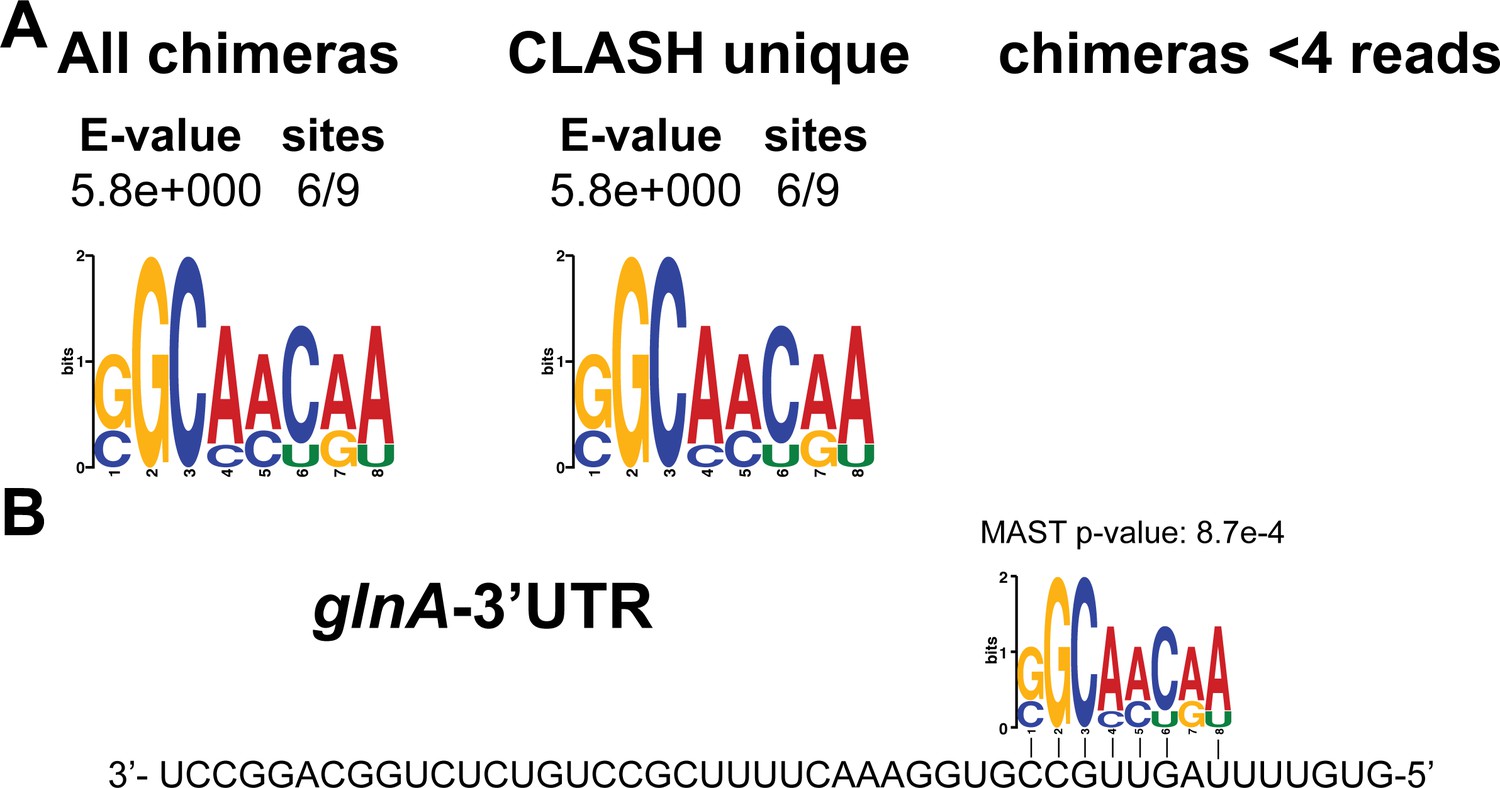
Identification of complementary sequence motifs in predicted glnA-3’UTR mRNA targets.
(A) Motif analyses of mRNA sequences found in glnA-3’UTR-mRNA interactions. All of the glnA-3’UTR interactions with mRNAs we found were only detected in our CLASH data. Motif analyses was performed using the MEME suite (Bailey et al., 2009). The number of target sequences that contained the common motif and the E-value of MEME are shown. (B) Identified motifs show sequence complementarity to the 3’UTR of glnA. Note that a very similar motif was identified in the RIL-seq data for glnA-3’UTR mRNA targets (Melamed et al., 2016). The Motif Alignment Search Tool (MAST) was used to determine the degree of complementarity between the identified motifs in putative mRNA targets and the putative sRNA. The MAST p-values indicate the overall match between the identified motifs and the sRNA sequence (Bailey et al., 2009).
Figure 8—figure supplement 2
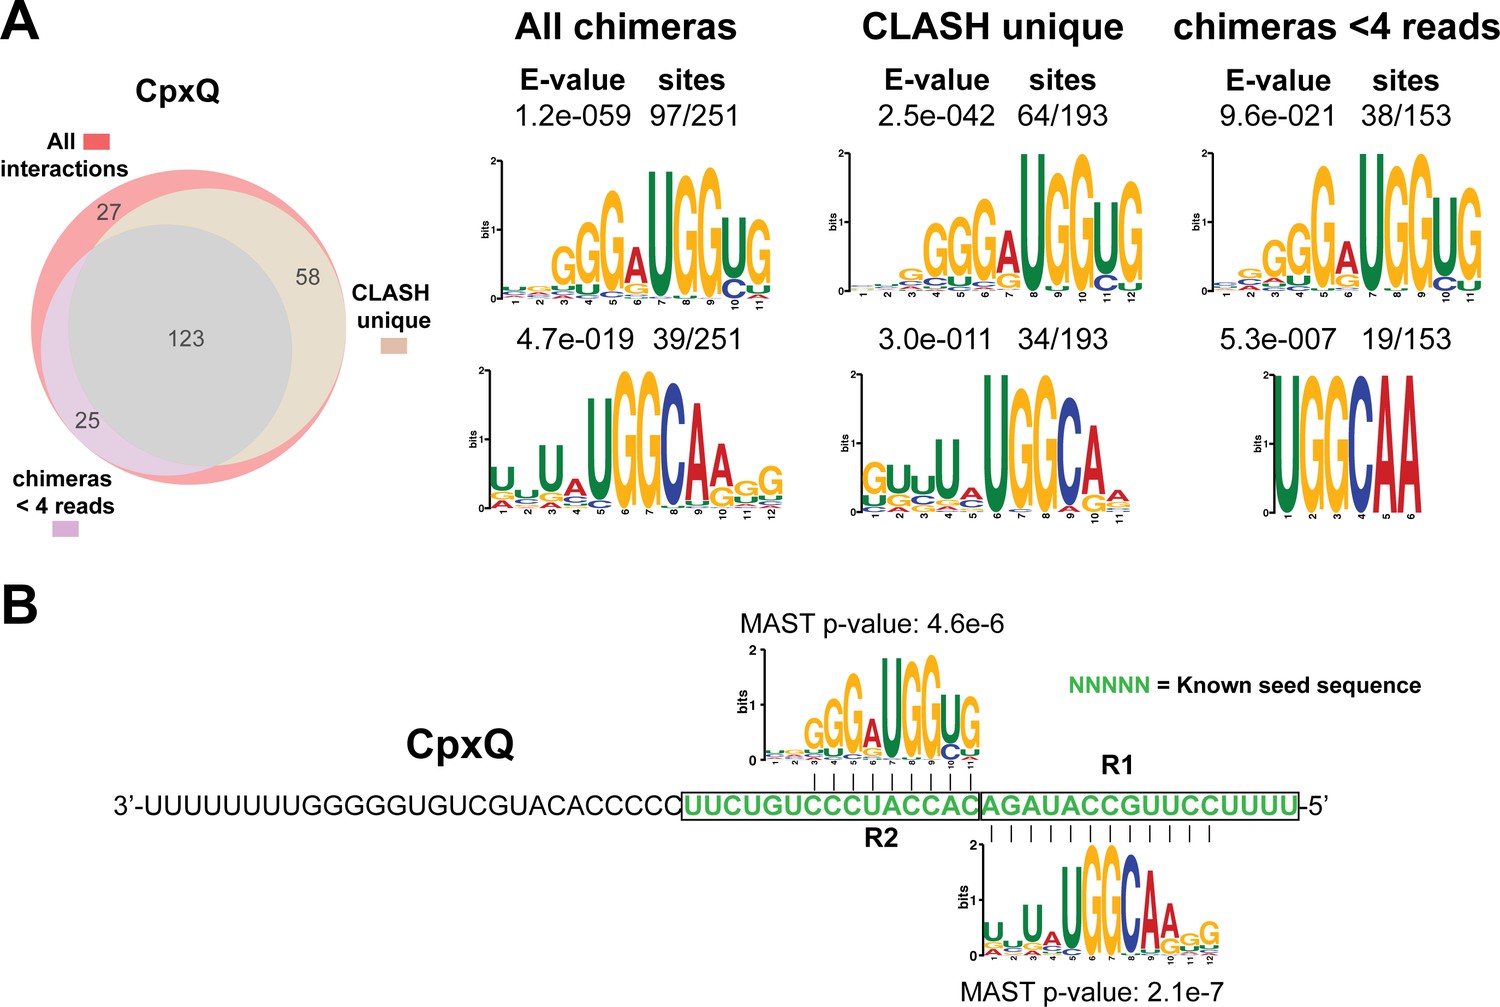
Identification of complementary sequence motifs in predicted CpxQ mRNA targets.
(A) Motif analyses of mRNA sequences found in cpxP-3’UTR/CpxQ interactions. The Venn diagram shows the overlap between the interactions found in all the CpxQ sRNA-mRNA interactions, those interactions uniquely found in the CLASH data (CLASH unique) and those supported by less than four reads (chimeras < 4 reads). Motif analyses was performed using the MEME suite (Bailey et al., 2009). The number of target sequences that contained the common motif and the E-value of MEME are shown. (B) Identified motifs show sequence complementarity to the 3’UTR of cpxP. These data are in good agreement with CpxQ mRNA target motifs identified in the RIL-seq data (Melamed et al., 2016). The Motif Alignment Search Tool (MAST) was used to determine the degree of complementarity between the identified motifs in putative mRNA targets and the putative sRNA. The MAST p-values indicate the overall match between the identified motifs and the sRNA sequence (Bailey et al., 2009). The green coloured nucleotides indicate the experimentally verified seed sequence (Chao and Vogel, 2016).
Figure 8—figure supplement 3
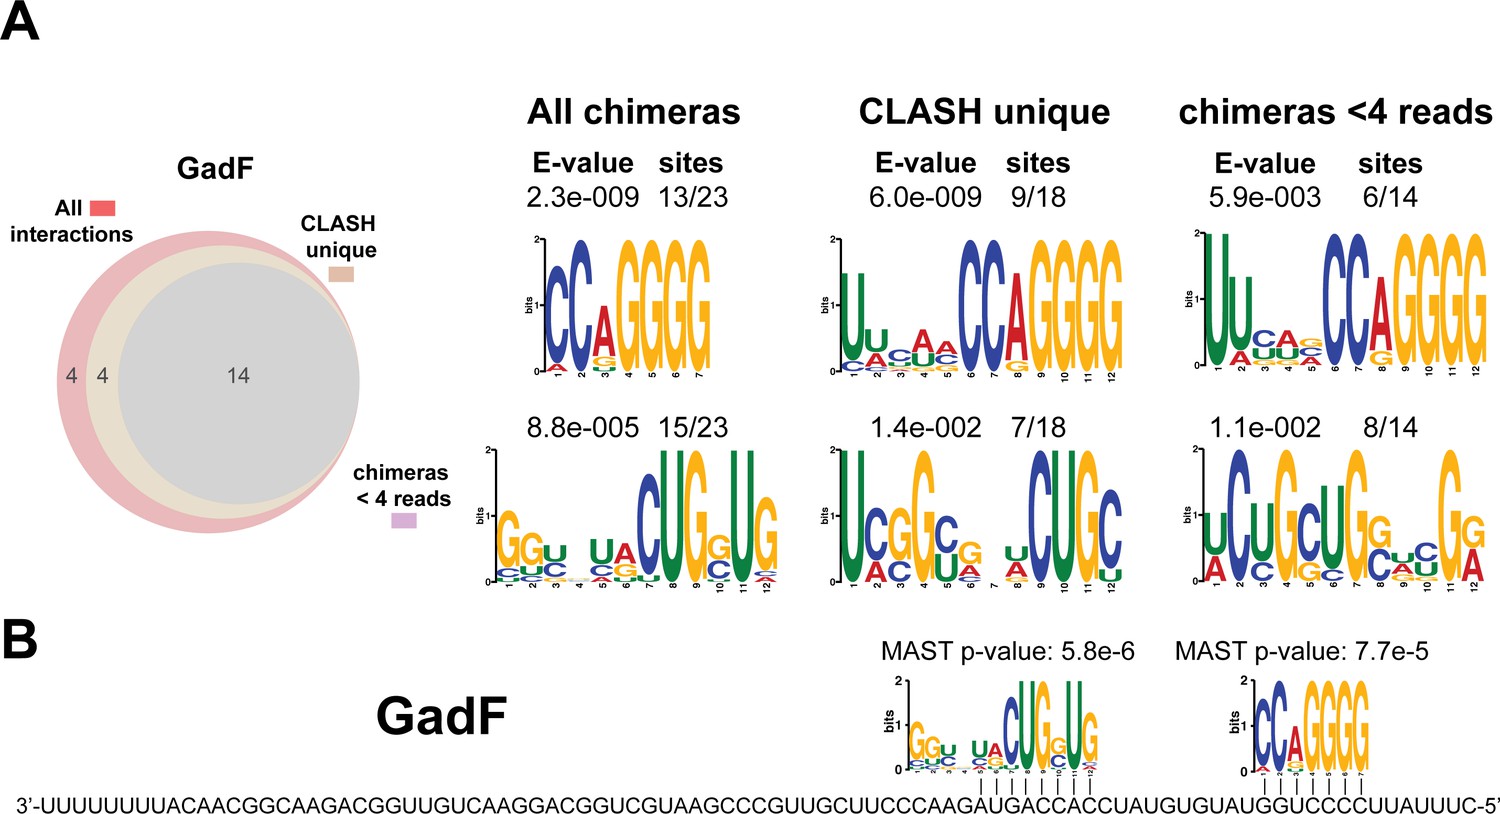
Identification of complementary sequence motifs in predicted GadF mRNA targets.
As in Figure 8—figure supplement 2 but now for the GadF sRNA that originates from the 3’ end of the gadE mRNA (this work and Melamed et al., 2016).
Figure 8—figure supplement 4
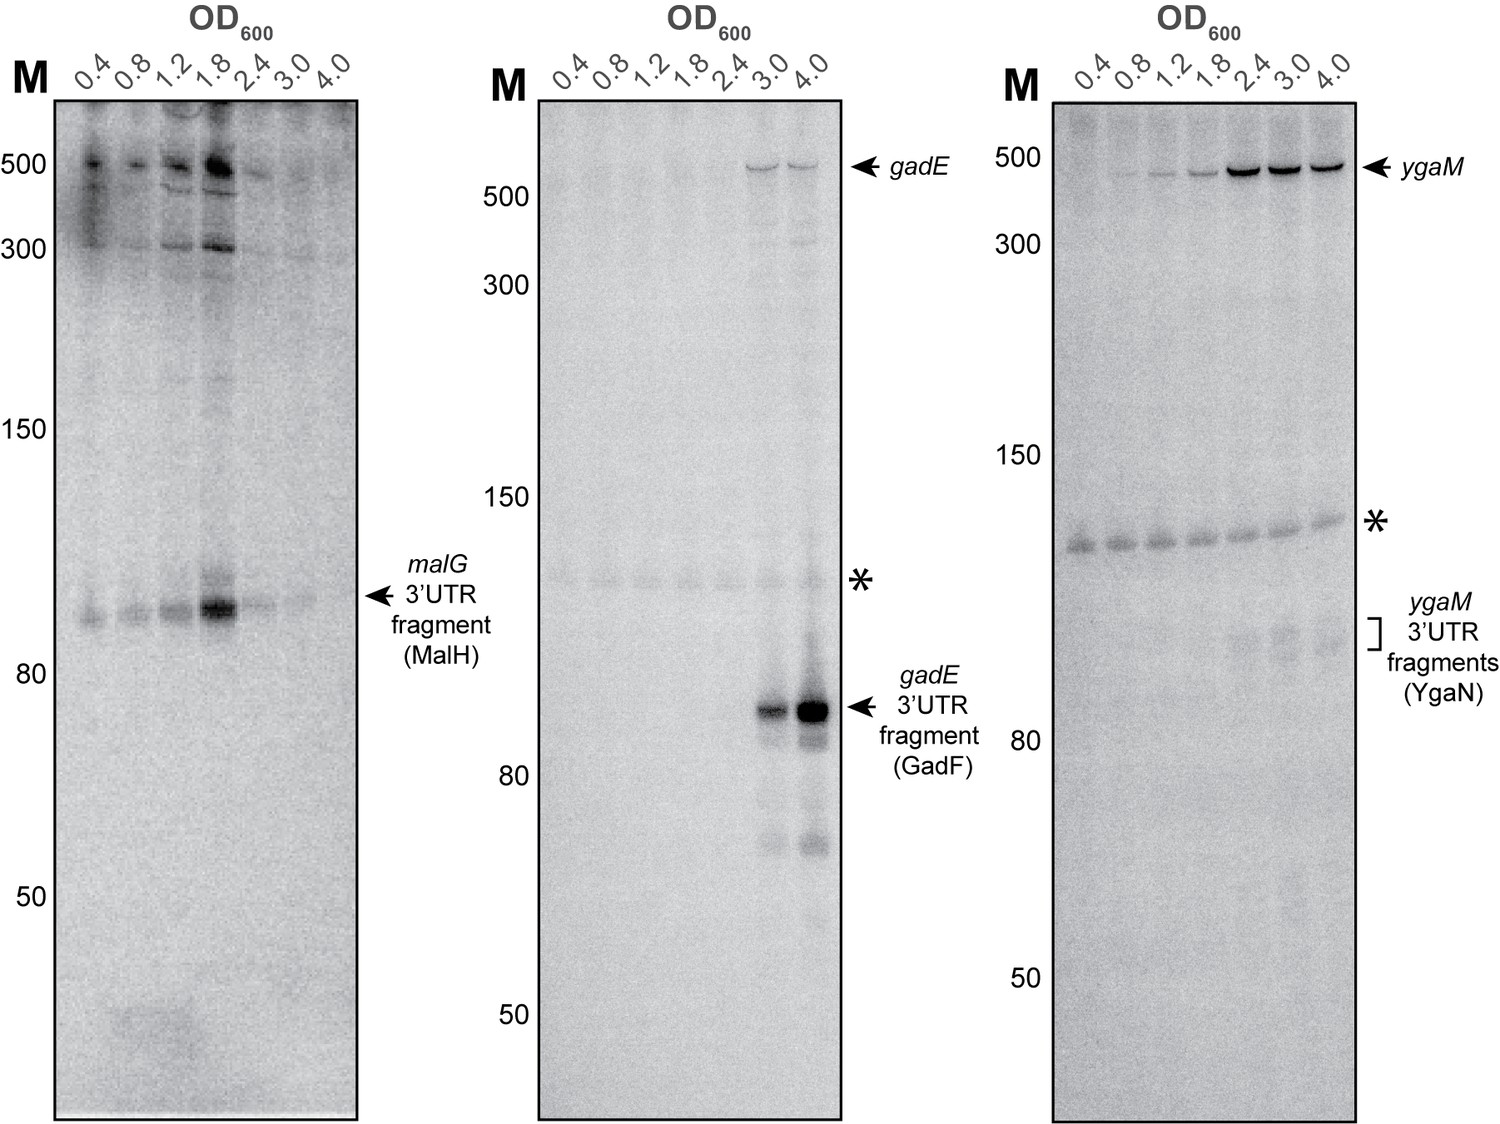
YgaM, gadE and malG contain sRNAs in their 3’UTRs.
Validation of malG 3’UTR (MalH), ygaM 3’UTR (YgaN) and gadE 3’UTR (GadF) sRNAs by Northern blot. Total RNA extracted from cells at the indicated optical densities (OD600) was resolved on 8% PAA-UREA gels and subjected to Northern blotting using oligos that hybridize with the 3’UTR of the respective transcripts. The asterisk indicates cross-reactivity of the probe with the 5S rRNA. The locations of the 3’UTR-derived fragments are indicated. MalH and YgaN are ~110 nt, whereas the GadF fragment is ~90 nt.
Figure 8—figure supplement 5
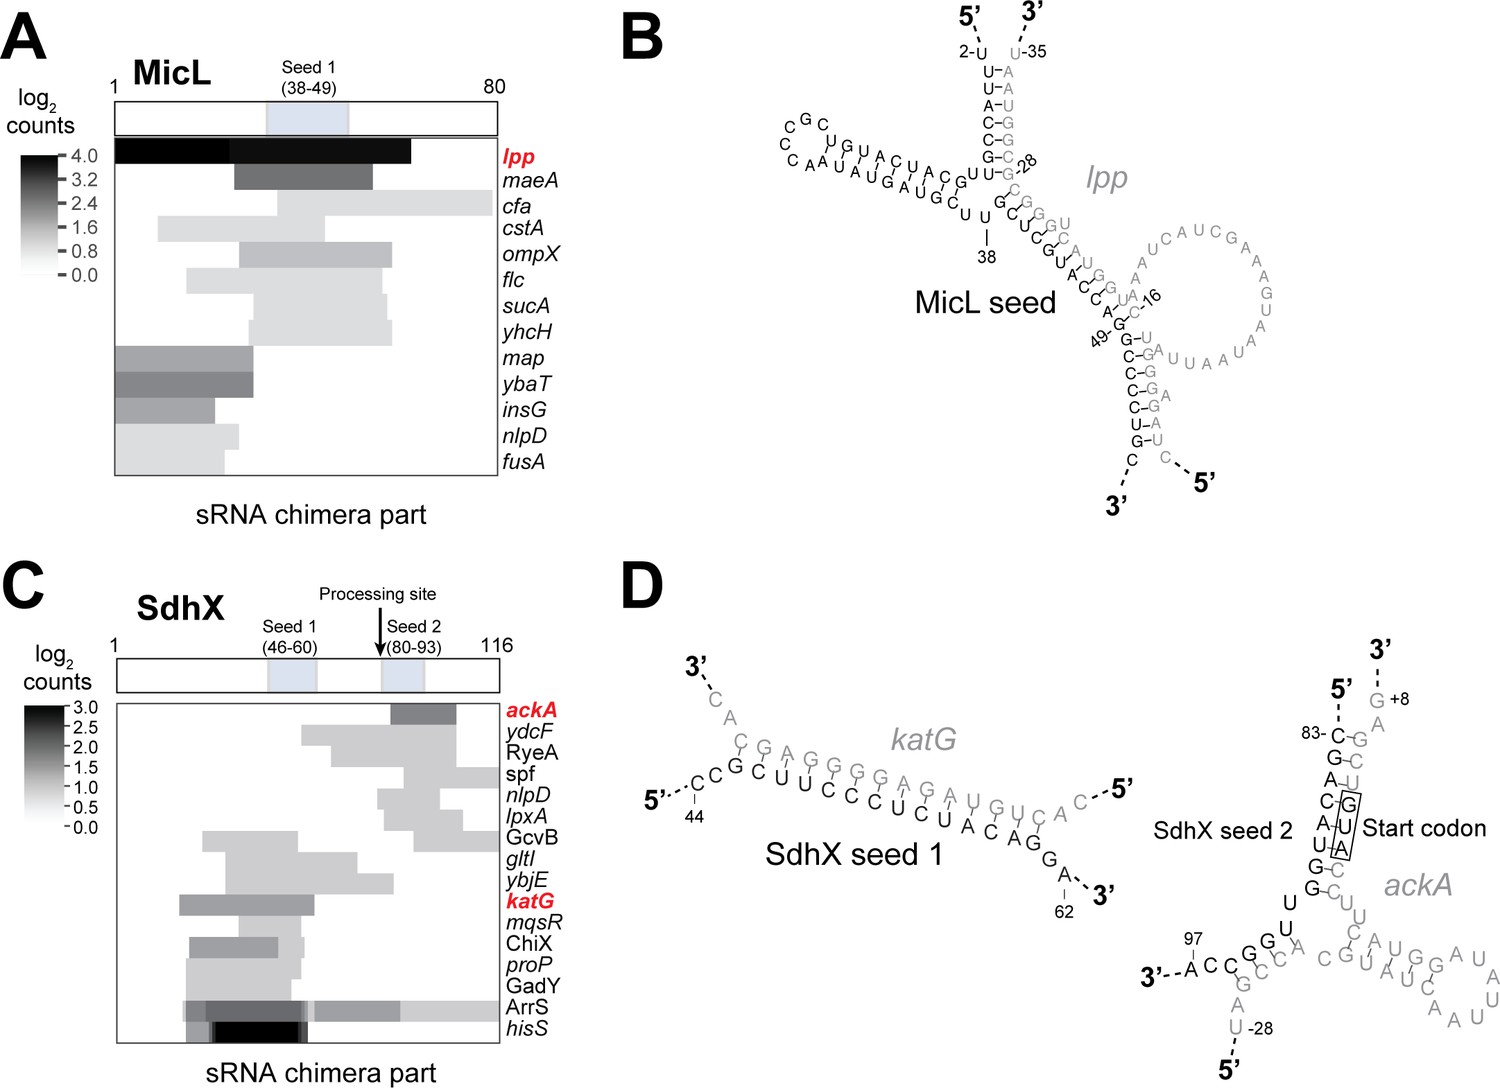
Hfq CLASH identifies known interactions between 3’-UTR derived sRNAs and mRNA targets.
(A–C) Heatmaps illustrating the number of chimeric fragments containing MicL (A) and SdhX (C) and where in the sRNA they map with respect to the known seed sequences(s). The boxes above indicate the known, experimentally validated seed sequences for the respective sRNAs. (B) The predicted base-pairing between MicL and a known mRNA target (lpp). (D) The base-paring between SdhX and known targets (katG and ackA;) represented by low chimera counts (2 and 3 chimeras, respectively)are shown. The grey colored nucleotides represent the binding site in the mRNA target. The predicted interactions between the sRNAs and their mRNA targets are fully consistent with the literature (De Mets et al., 2019; Guo et al., 2014; Miyakoshi et al., 2018).
Figure 8—figure supplement 6
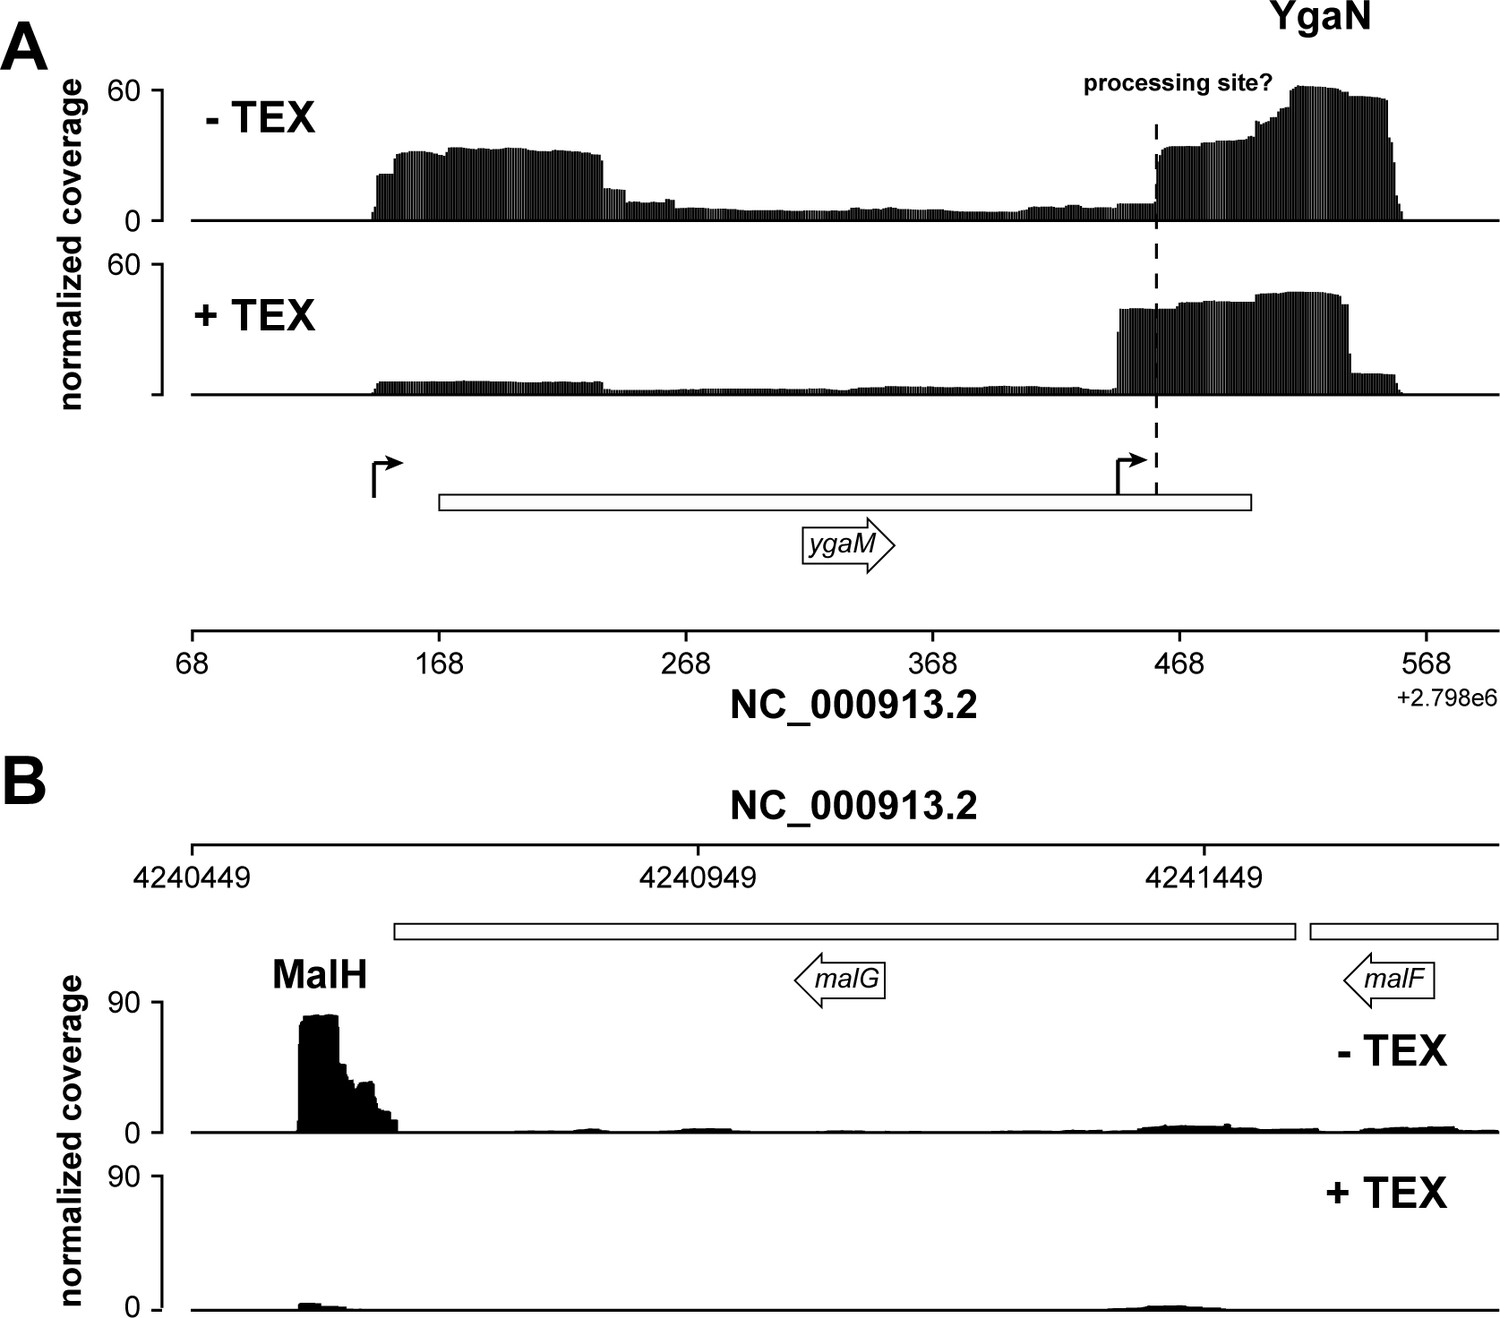
Analysis of exonuclease (TEX) RNA-seq datasets.
(A, B) Analysis of Terminator 5’-Phosphate Dependent Exonuclease (TEX) RNA-seq datasets (Thomason et al., 2015) indicates that YgaN has an independent promoter, while MalH is a degradation product of the malEFG operon. Genome browser tracks showing the location and normalized reads of ygaM and malG fragments in the absence of TEX (–TEX) and in the presence of TEX (+TEX). The ygaM and putative YgaN promoters are indicated. Independently transcribed YgaN could be further processed by RNases, at the site marked with a dashed vertical line.
Author response image 1
Additional files
-
Supplementary file 1
Hyb pipeline output from the merged Hfq CLASH data.
Chromosome indicates the E. coli chromosome, sequence start and sequence end are the positions in the chimeric read that correspond to the first and second fragment. Chromosome start and chromosome end are the positions in the E. coli K12 reference genome.
- https://cdn.elifesciences.org/articles/54655/elife-54655-supp1-v2.xlsx
-
Supplementary file 2
Statistically filtered data.
Chimeric reads were subsequently analyzed using a statistical pipeline described by Waters et al., 2017. Only chimeric reads that had a Benjami-Hochberg adjusted p-value (bh_adj_p_value) of 0.05 or less were considered The last three columns indicate in which growth phases the interactions were identified. Min. MFE indicates the minimal folding energies of the chimera, which was calculated using RNADuplex from the ViennaRNA package (Lorenz et al., 2011). The two pairs in the intermolecular base-pairs and structure columns are separated by ‘ and ".
- https://cdn.elifesciences.org/articles/54655/elife-54655-supp2-v2.xlsx
-
Supplementary file 3
Overview of sRNA-mRNA interactions found in the Hfq CLASH data and compared to the RIL-seq data.
Shown are the statisitcally filtered sRNA-mRNA interactions identified in the Hfq CLASH data. Genomic sequences of the sRNA and mRNA fragments found in the chimeras are also provided. Total_hybrids indicates the total number of interactions involving these sequences that were found. Min. MFE indicates the minimal folding enrgies of the chimera, which was calculated using RNADuplex from the ViennaRNA package (Lorenz et al., 2011). The last column indicates which of the sRNA-mRNA interactions were also found in the RIL-seq S-chimera data (Melamed et al., 2016).
- https://cdn.elifesciences.org/articles/54655/elife-54655-supp3-v2.xlsx
-
Supplementary file 4
Overview of sRNA-sRNA interactions found in the Hfq CLASH data and compared to the RIL-seq data.
Shown are the statistically filtered sRNA-sRNA interactions identified in the Hfq CLASH data. Genomic sequences of the sRNA fragments found in the chimeras are also provided. Total_hybrids indicates the total number of interactions involving these sequences that were found. Min. MFE indicates the minimal folding enrgies of the chimera, which was calculated using RNADuplex from the ViennaRNA package (Lorenz et al., 2011). The last column indicates which of the sRNA-mRNA interactions were also found in the RIL-seq S-chimera data (Melamed et al., 2016).
- https://cdn.elifesciences.org/articles/54655/elife-54655-supp4-v2.xlsx
-
Supplementary file 5
Overview of putative 3'UTR derived sRNAs.
3'UTR-mRNA and mRNA-3'UTR interactions were isolated from the statistically filtered data and compared against the RILseq data (Melamed et al., 2016), Salmonella TIERseq data (Chao et al., 2012) and RNA-seq data that was used transcription start sites in E. coli (Thomason et al., 2015). TEX insensitive are RNA fragments in 3'UTRs that are not sensitive to Terminator 5’-Phosphate Dependent Exonuclease treatment and therefore may be generated by an independent promoter. TEX sensitive are RNA fragments that likely have 5' monophosphates as, according to the TEX data, they were degraded by TEX.
- https://cdn.elifesciences.org/articles/54655/elife-54655-supp5-v2.xlsx
-
Supplementary file 6
Overview of 3'UTR-mRNA interactions found in the Hfq CLASH data and compared to the RIL-seq data.
Shown are the statistically filtered 3'UTR-mRNA interactions identified in the Hfq CLASH data. Genomic sequences of the 3'UTR and mRNA fragments found in the chimeras are also provided. Total_hybrids indicates the total number of interactions involving these sequences that were found. Min. MFE indicates the minimal folding enrgies of the chimera, which was calculated using RNADuplex from the ViennaRNA package (Lorenz et al., 2011). The last column indicates which of the sRNA-mRNA interactions were also found in the RIL-seq S-chimera data (Melamed et al., 2016). The mRNA fragment location column indicates where in the mRNA target the putative 3'UTR-derived sRNA was base-paired.
- https://cdn.elifesciences.org/articles/54655/elife-54655-supp6-v2.xlsx
-
Supplementary file 7
Experimentally validated interactions in the statistically filtered Hfq CLASH data.
Chimeric reads were analyzed using a statistical pipeline described by Waters et al., 2017. Only chimeric reads that had a Benjami-Hochberg adjusted p-value (bh_adj_p_value) of 0.05 or less were considered. Shown are the sRNA-mRNA interactions that were experimentally validated, retrieved from sRNATarbase 3.0 (Wang et al., 2016) and recent literature (Bianco et al., 2019; Chao and Vogel, 2016; De Mets et al., 2019; Guo et al., 2014; Lalaouna et al., 2015b; Miyakoshi et al., 2018). Min. MFE indicates the minimal folding energies of the chimera, which was calculated using RNADuplex from the ViennaRNA package (Lorenz et al., 2011). The last three columns indicate in which growth phases the interactions were identified.
- https://cdn.elifesciences.org/articles/54655/elife-54655-supp7-v2.xlsx
-
Supplementary file 8
Motif analyses of chimeric fragments that mapped to 5' UTRs.
PyMotif from the pyCRAC package was used for these analyses. For the motif search analyses we first clustered overlapping chimeric fragments into a single contig. For the 5'UTR motif analyses we used 356 clusters.
- https://cdn.elifesciences.org/articles/54655/elife-54655-supp8-v2.xlsx
-
Supplementary file 9
Motif analyses of chimeric fragments that mapped to 3' UTRs.
PyMotif from the pyCRAC package was used for these analyses. For the motif search analyses we first clustered overlapping chimeric fragments into a single contig. For the 3'UTR motif analyses we used 188 clusters.
- https://cdn.elifesciences.org/articles/54655/elife-54655-supp9-v2.xlsx
-
Supplementary file 10
Oligonucleotides used in this study.
- https://cdn.elifesciences.org/articles/54655/elife-54655-supp10-v2.xlsx
-
Supplementary file 11
Key Resources Table.
- https://cdn.elifesciences.org/articles/54655/elife-54655-supp11-v2.docx
-
Transparent reporting form
- https://cdn.elifesciences.org/articles/54655/elife-54655-transrepform-v2.docx
Download links
A two-part list of links to download the article, or parts of the article, in various formats.
Downloads (link to download the article as PDF)
Open citations (links to open the citations from this article in various online reference manager services)
Cite this article (links to download the citations from this article in formats compatible with various reference manager tools)
Hfq CLASH uncovers sRNA-target interaction networks linked to nutrient availability adaptation
eLife 9:e54655.
https://doi.org/10.7554/eLife.54655


