The Cryo-EM structure of pannexin 1 reveals unique motifs for ion selection and inhibition
- Department of Molecular Medicine, Cornell University, United States
- WM Keck Structural Biology Laboratory, Cold Spring Harbor Laboratory, United States
Figures
Figure 1 with 4 supplements
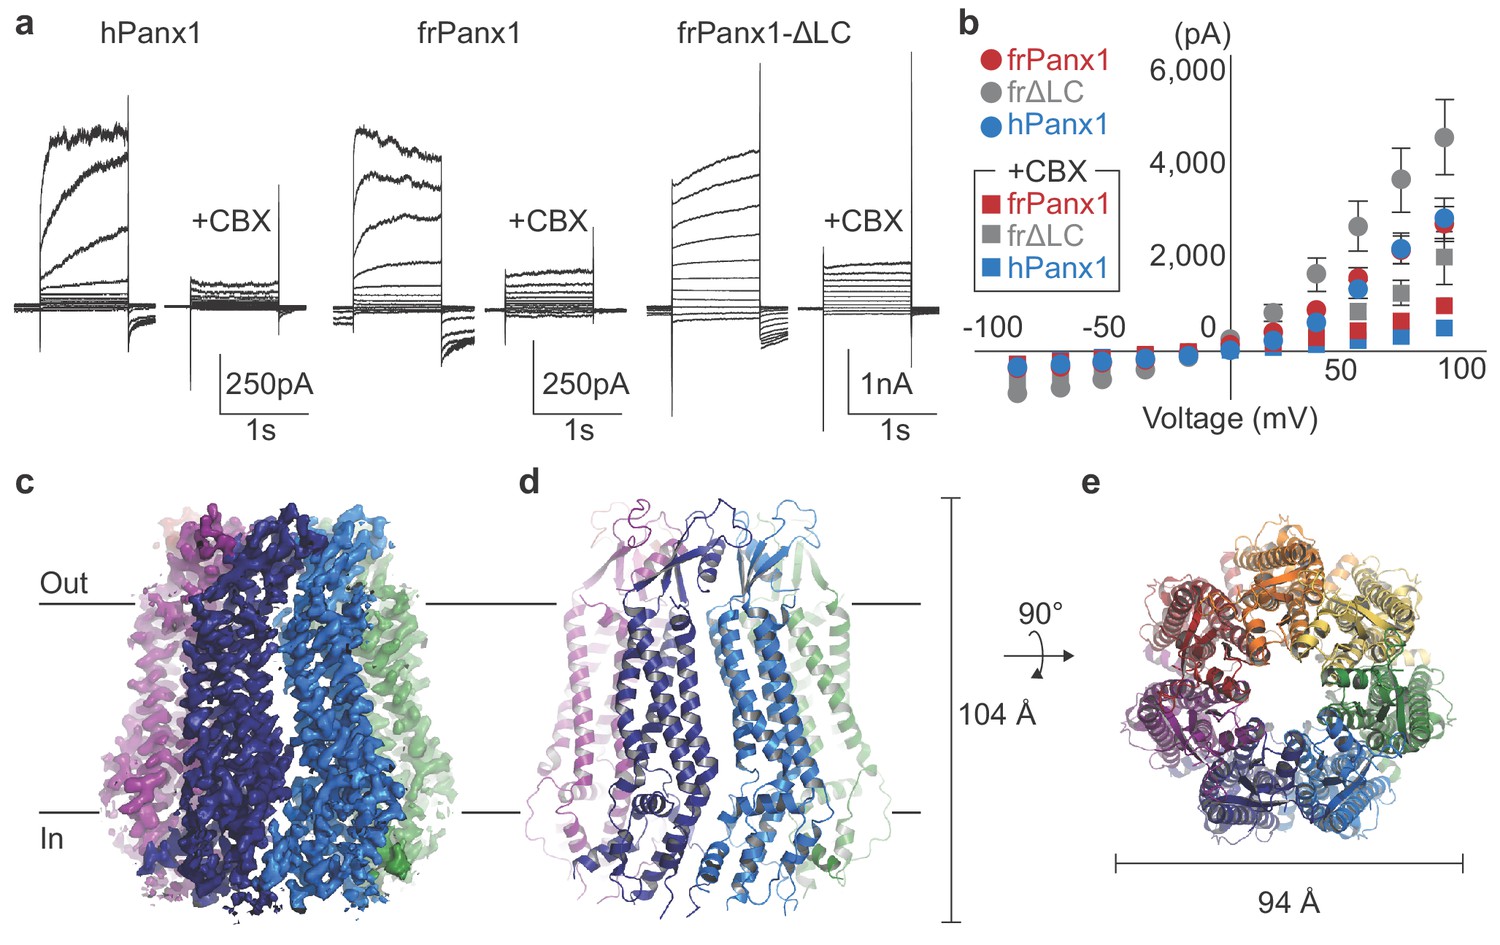
frPanx1 forms a heptameric ion channel.
(a) Whole-cell patch clamp recordings from HEK 293 cells expressing hPanx1, frPanx1, and frPanx1-ΔLC. Cells were clamped at −60 mV and stepped from −100 mV to +100 mV for 1 s in 20 mV increments. To facilitate electrophysiological studies, we inserted a Gly-Ser motif immediately after the start Met to enhance Panx1 channel opening as we previously described (Michalski et al., 2018). CBX (100 μM) was applied through a rapid solution exchanger. (b) Current-voltage plot of the same channels shown in (a). Recordings performed in normal external buffer are shown as circles, and those performed during CBX (100 μM) application are shown as squares. Each point represents the mean of at least three different recordings, and error bars represent the SEM. (c) EM map of frPanx1-ΔLC shown from within the plane of the membrane. Each protomer is colored differently, with the extracellular side designated as ‘out’ and the intracellular side as ‘in.’ (d) Overall structure of frPanx1-ΔLC viewed from within the lipid bilayer. (e) Structure of frPanx1 viewed from the extracellular face.
Figure 1—figure supplement 1
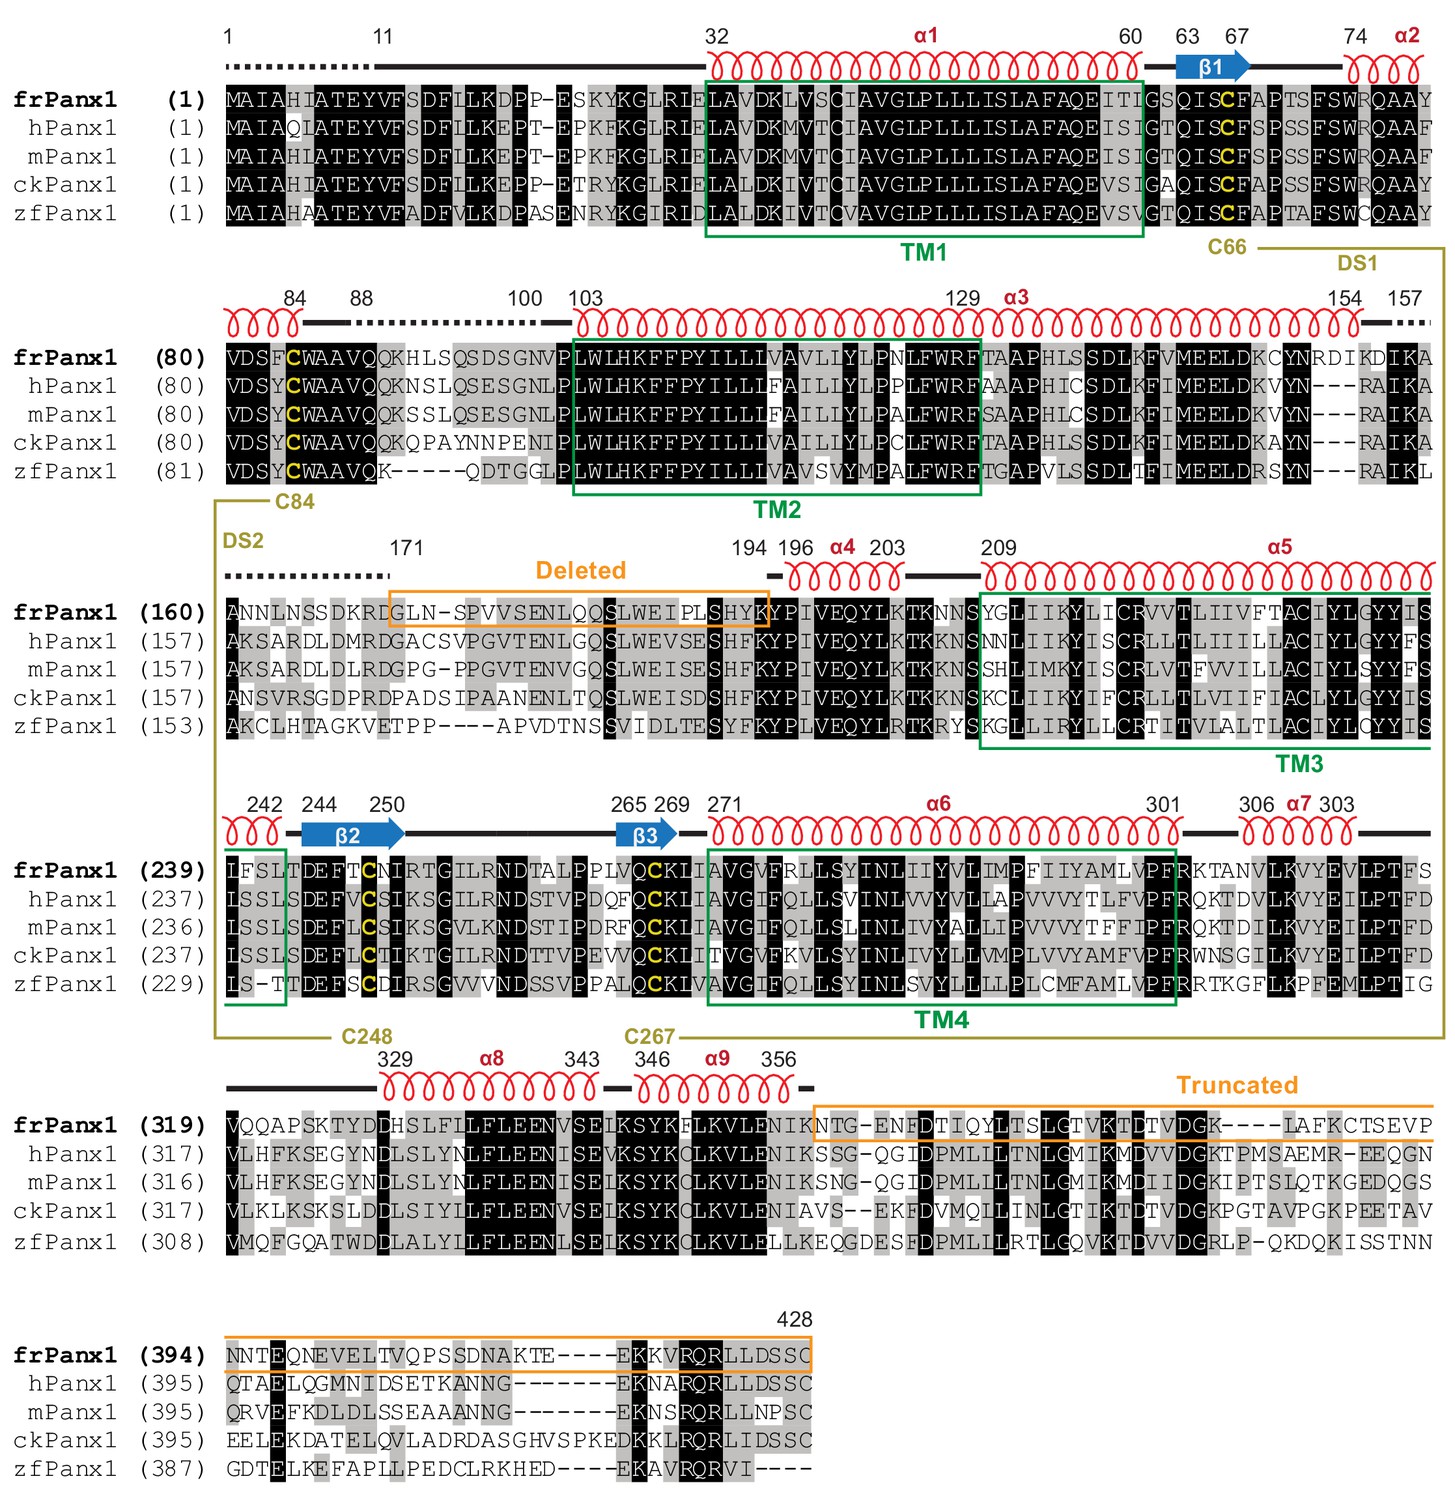
Sequence alignment and structural features.
Amino acid sequence of frPanx1 compared to various Panx1 orthologues. Amino acids highlighted in black are completely conserved, in gray are similar, and in white are not conserved. Disulfide-forming cysteines are highlighted in yellow. Secondary structure features are shown above the sequence alignment. Green boxes depict the transmembrane helix boundaries, and orange boxes show deleted or truncated regions to create frPanx1-ΔLC.
Figure 1—figure supplement 2
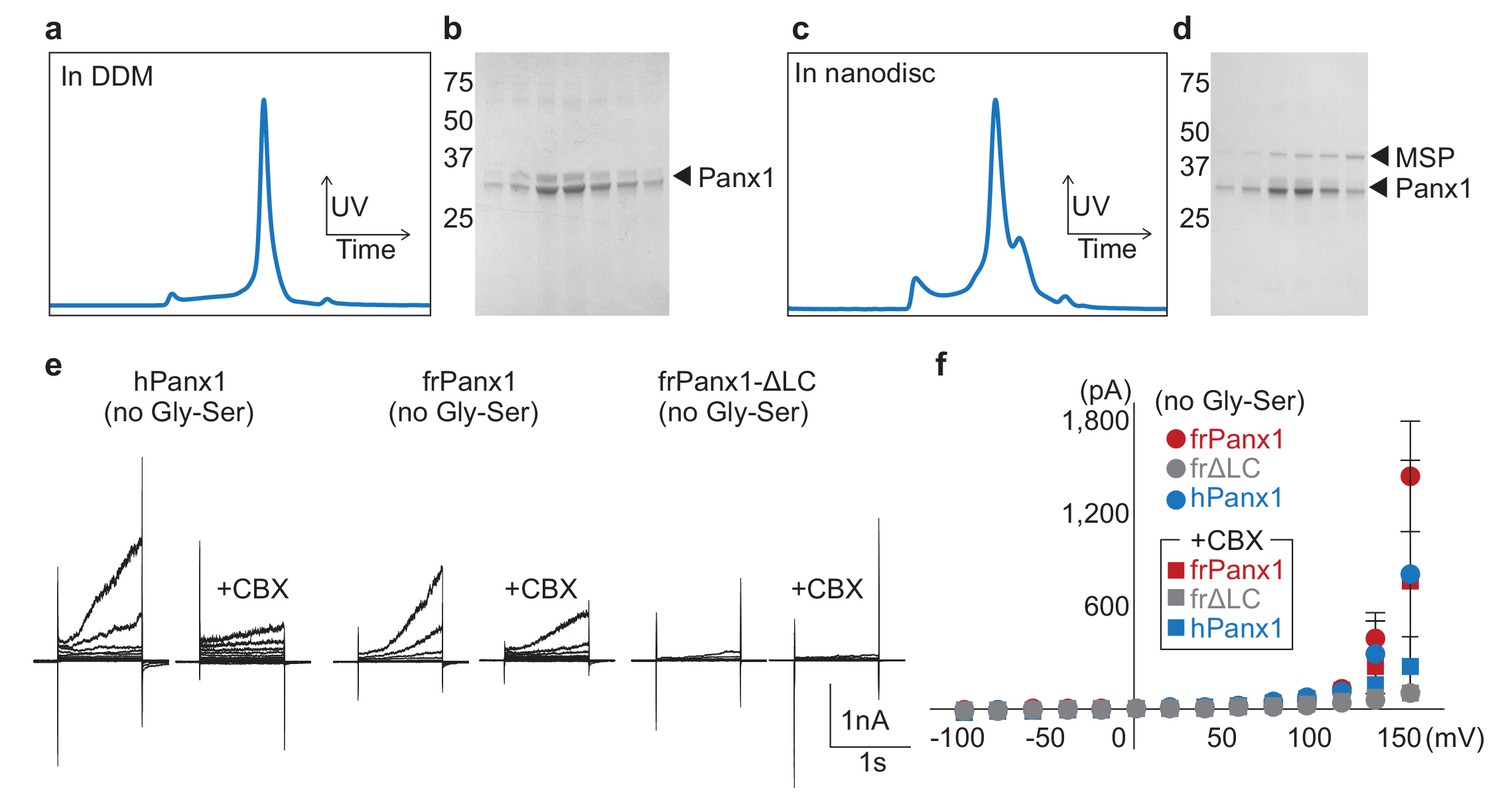
Characterization of frPanx1-ΔLC.
(a) Size exclusion chromatogram of frPanx1-ΔLC. Concentrated protein was injected onto a Superose 6 10/300 column equilibrated with 150 mM NaCl, 10 mM Tris pH 8.0, 1 mM EDTA, 0.5 mM DDM. (b) SDS-PAGE analysis of peak fractions collected from (a). (c) Size exclusion chromatogram of frPanx1-ΔLC after reconstitution into nanodiscs. The running buffer contained 150 mM NaCl, 10 mM Tris pH 8.0, 1 mM EDTA. (d) SDS-PAGE analysis of peak fractions collected from (c). (e) Whole-cell recordings of wild-type (no Gly-Ser) hPanx1, frPanx1, and frPanx1-ΔLC. Whole-cell patches from transfected HEK 293 T cells were obtained, held at −60 mV, and stepped between −100 mV and +160 mV for 1 s. CBX (100 μM) was applied through a rapid solution exchanger. (f) Current-voltage plot of wild-type pannexin recordings shown in (e). Each circle represents the mean current at a particular voltage, with squares depicting the same current when treated with 100 μM CBX. N = 3–11.
Figure 1—figure supplement 3
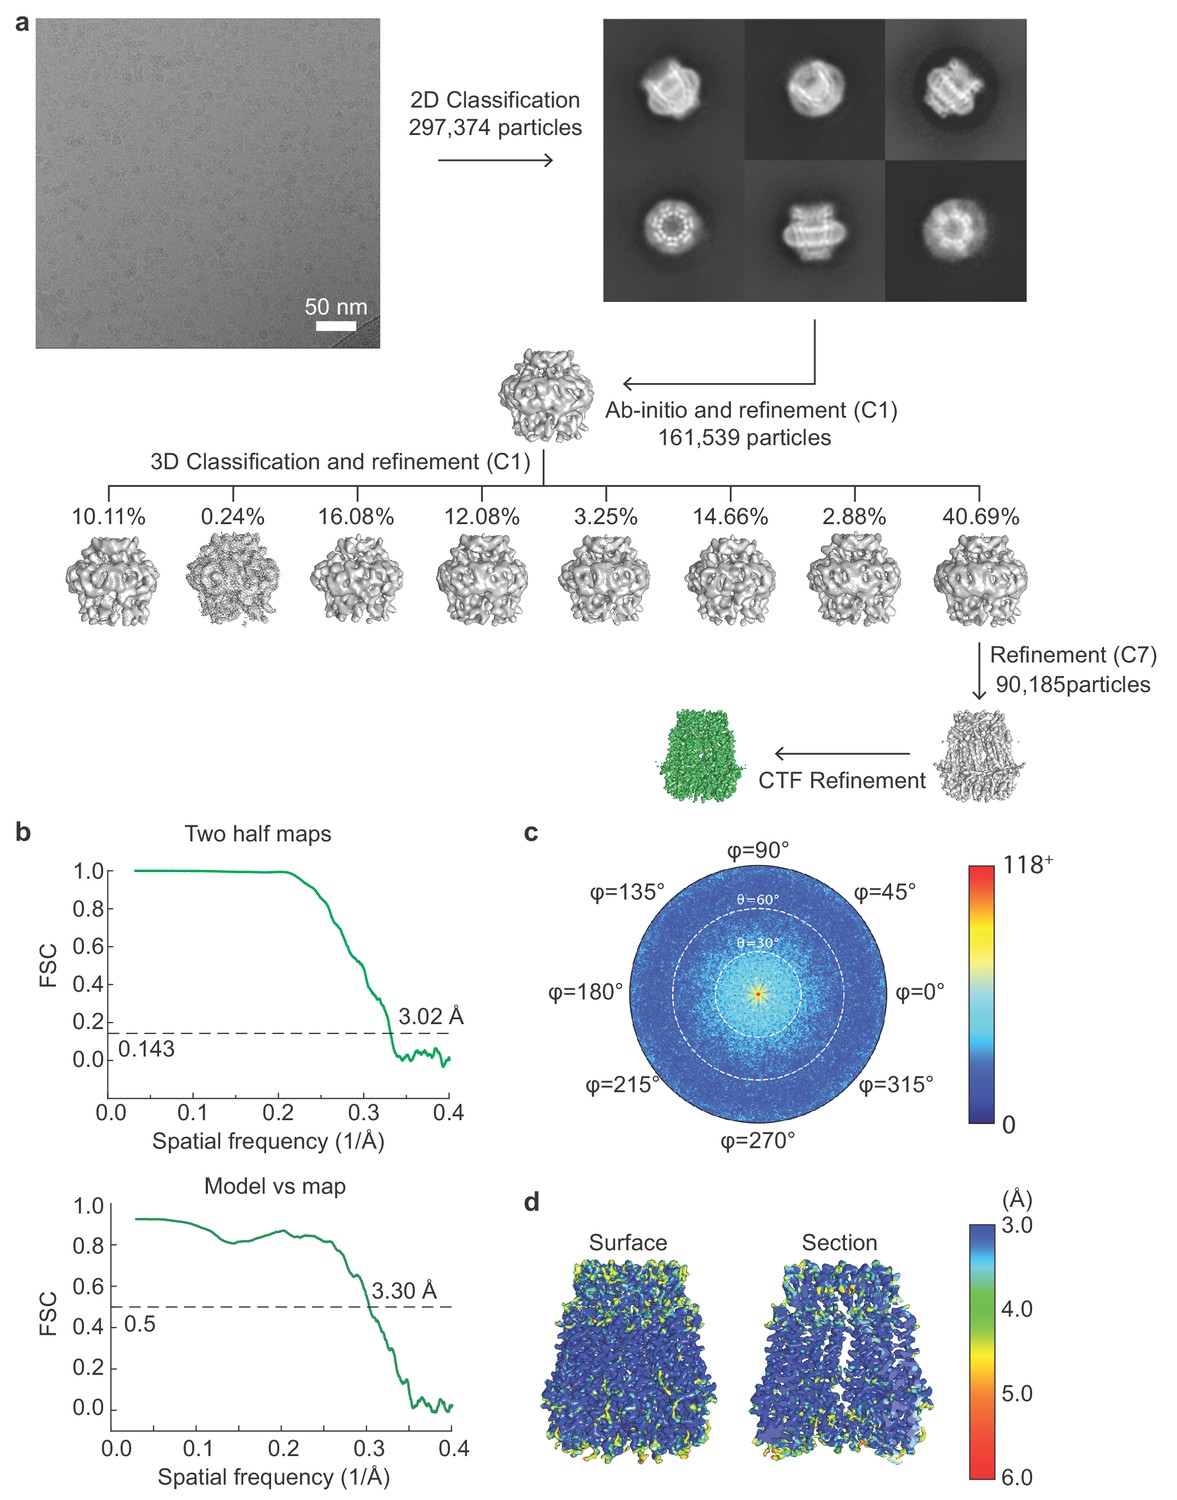
Cryo-EM image processing workflow for single particle analysis of frPanx1-ΔLC.
(a) A representative micrograph (scale bar = 50 nm), representative 2D class averages, and the 3D classification workflow are shown. (b) The FSC plots of the two half maps (top) and the map vs model (bottom) are shown. (c) The angular distribution plot for class 3. (d) Local resolutions of class three were calculated using ResMap (Kucukelbir et al., 2014).
Figure 1—figure supplement 4
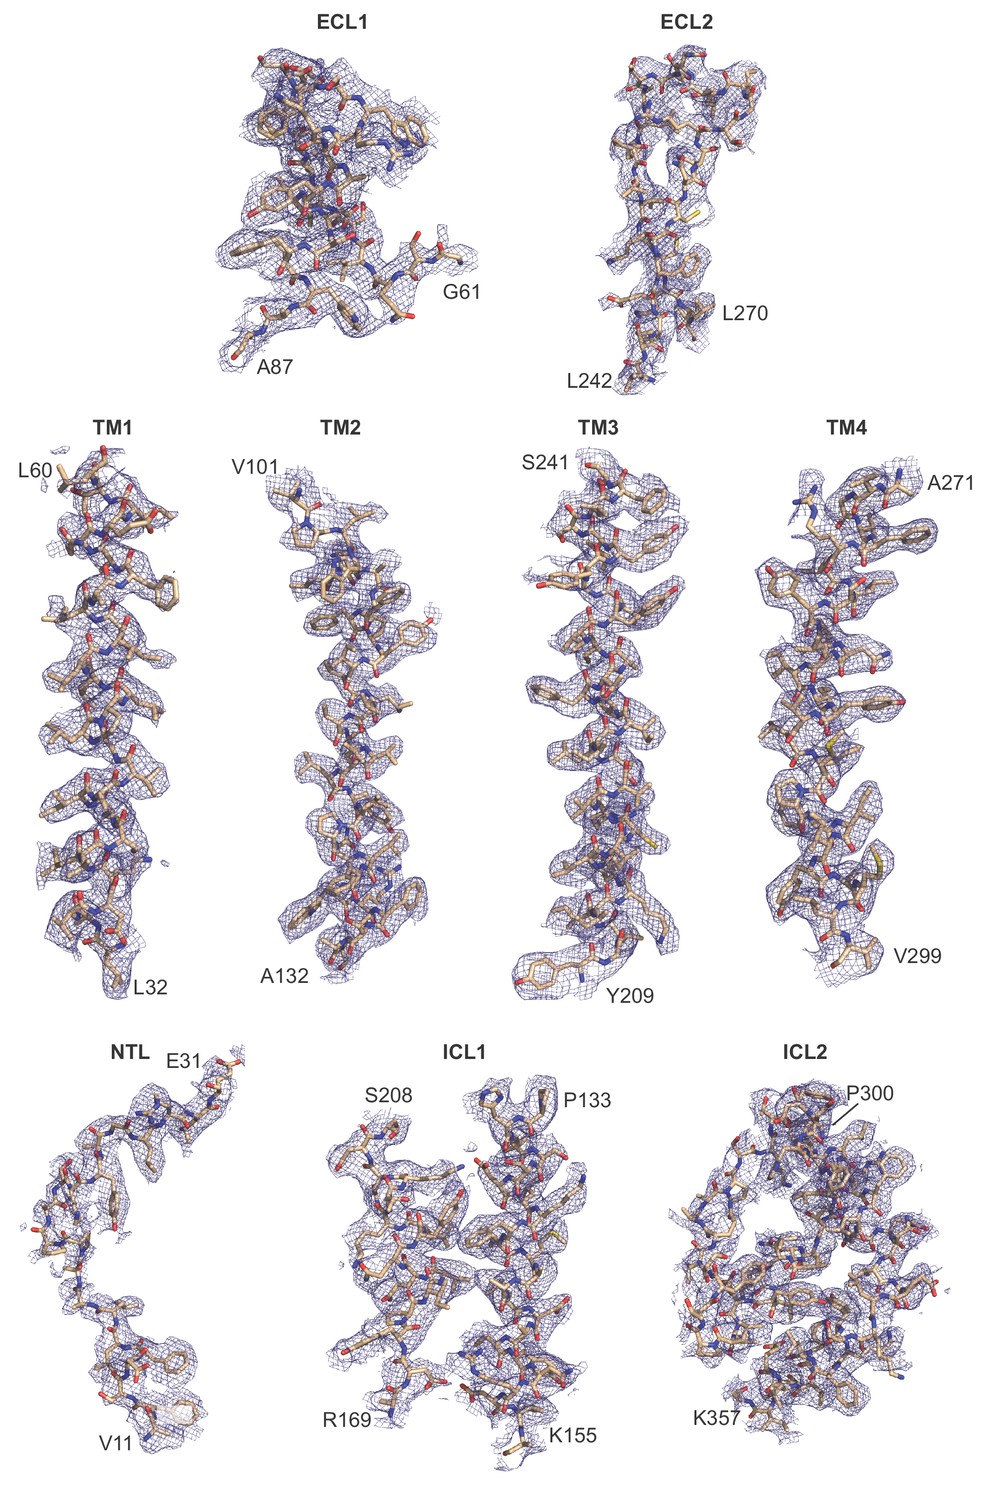
Representative cryo-EM density of frPanx1-ΔLC.
Each domain is shown as stick representation and fit into the corresponding density contoured at σ = 3.0.
Figure 2 with 3 supplements
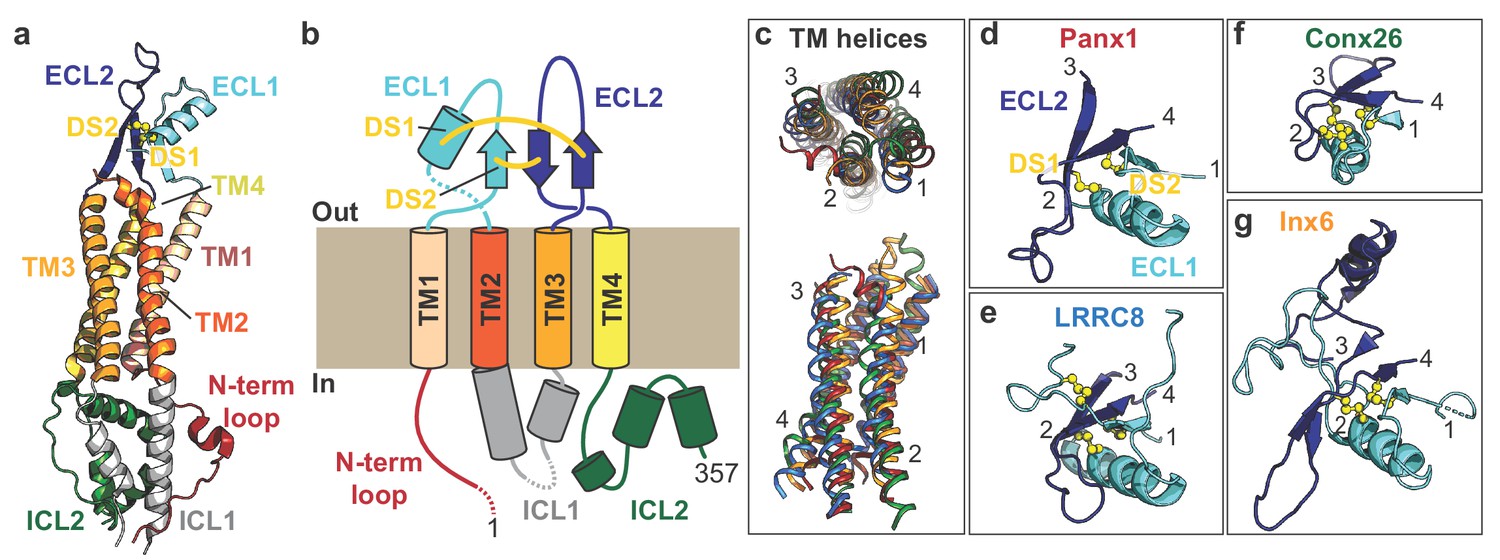
Subunit architecture of frPanx1.
(a) Structure of the frPanx1 protomer. Each domain is colored according to the cartoon scheme presented in (b). (c) Superimposition of the transmembrane helices from frPanx1 (red), connexin-26 (green), innexin-6 (orange), and LRRC8 (blue) shown top-down from the extracellular side (top) or from within the plane of the membrane (bottom). (d-g) Cartoon representation of the extracellular loops of large pore forming channels. ECL1 is colored in light blue, and ECL2 is colored in dark blue, and disulfide bridges are shown as yellow spheres. These domains are viewed from the same angle (from top) as shown in the top panel in (c).
Figure 2—figure supplement 1
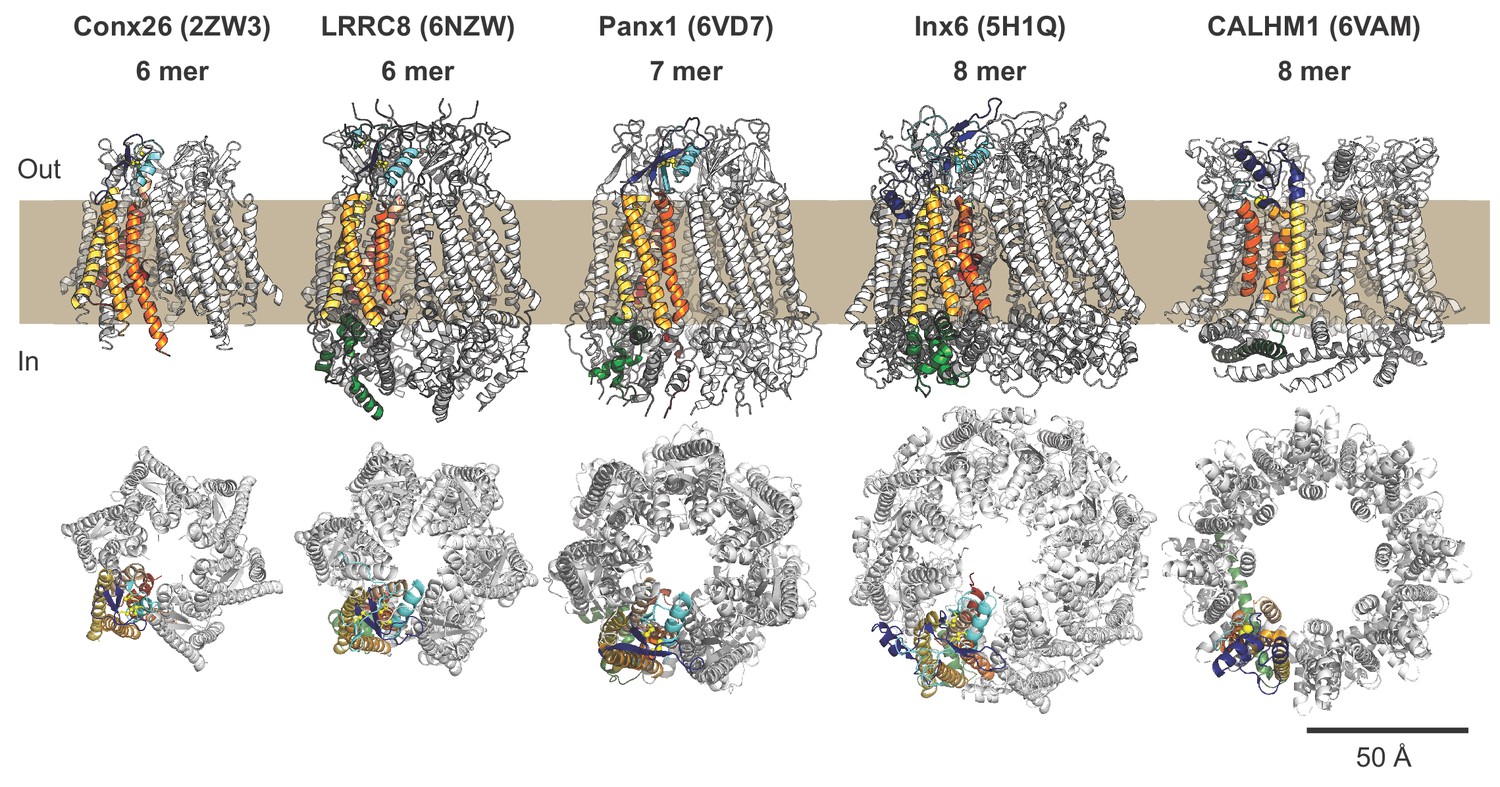
Comparison of frPanx1 with other large pore channels.
The structures of connexin-26 (PDB: 2ZW3), LRRC8 (PDB: 6NZW), Panx1, innexin-6 (PDB: 5H1Q), and CALHM1 (PDB: 6VAM) are shown from within the plane of the membrane (top) and viewed from the extracellular side (bottom). One subunit of each channel is shown colored with transmembrane domains in orange/yellow, ECL1 is colored in light blue, ECL2 in dark blue, ICL1 in gray, ICL2 in green, and NTL in red, as shown in Figure 2a.
Figure 2—figure supplement 2
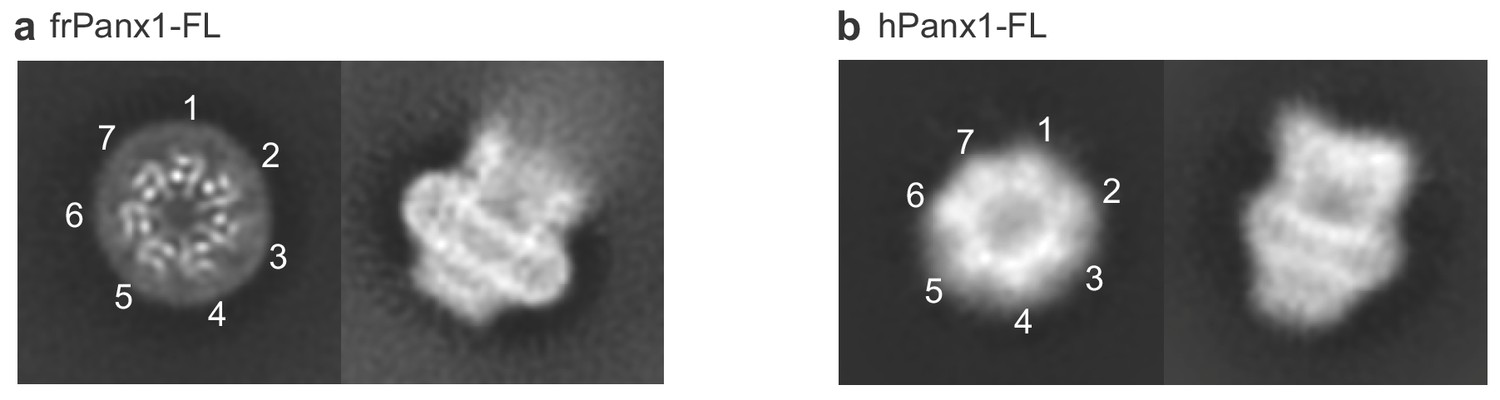
2D classes of full-length frog and human pannexin 1.
(a) 2D classes of the full-length frog pannexin1 in nanodiscs showing top (left) and side (right) views. All seven protomers are labeled with numbers in the 2D class of the top view. (b) 2D classes of the full-length human pannexin one in DDM in the similar orientation to panel a. The top view shows a heptameric assembly (numbered). No symmetry was imposed in 2D classification.
Figure 2—figure supplement 3
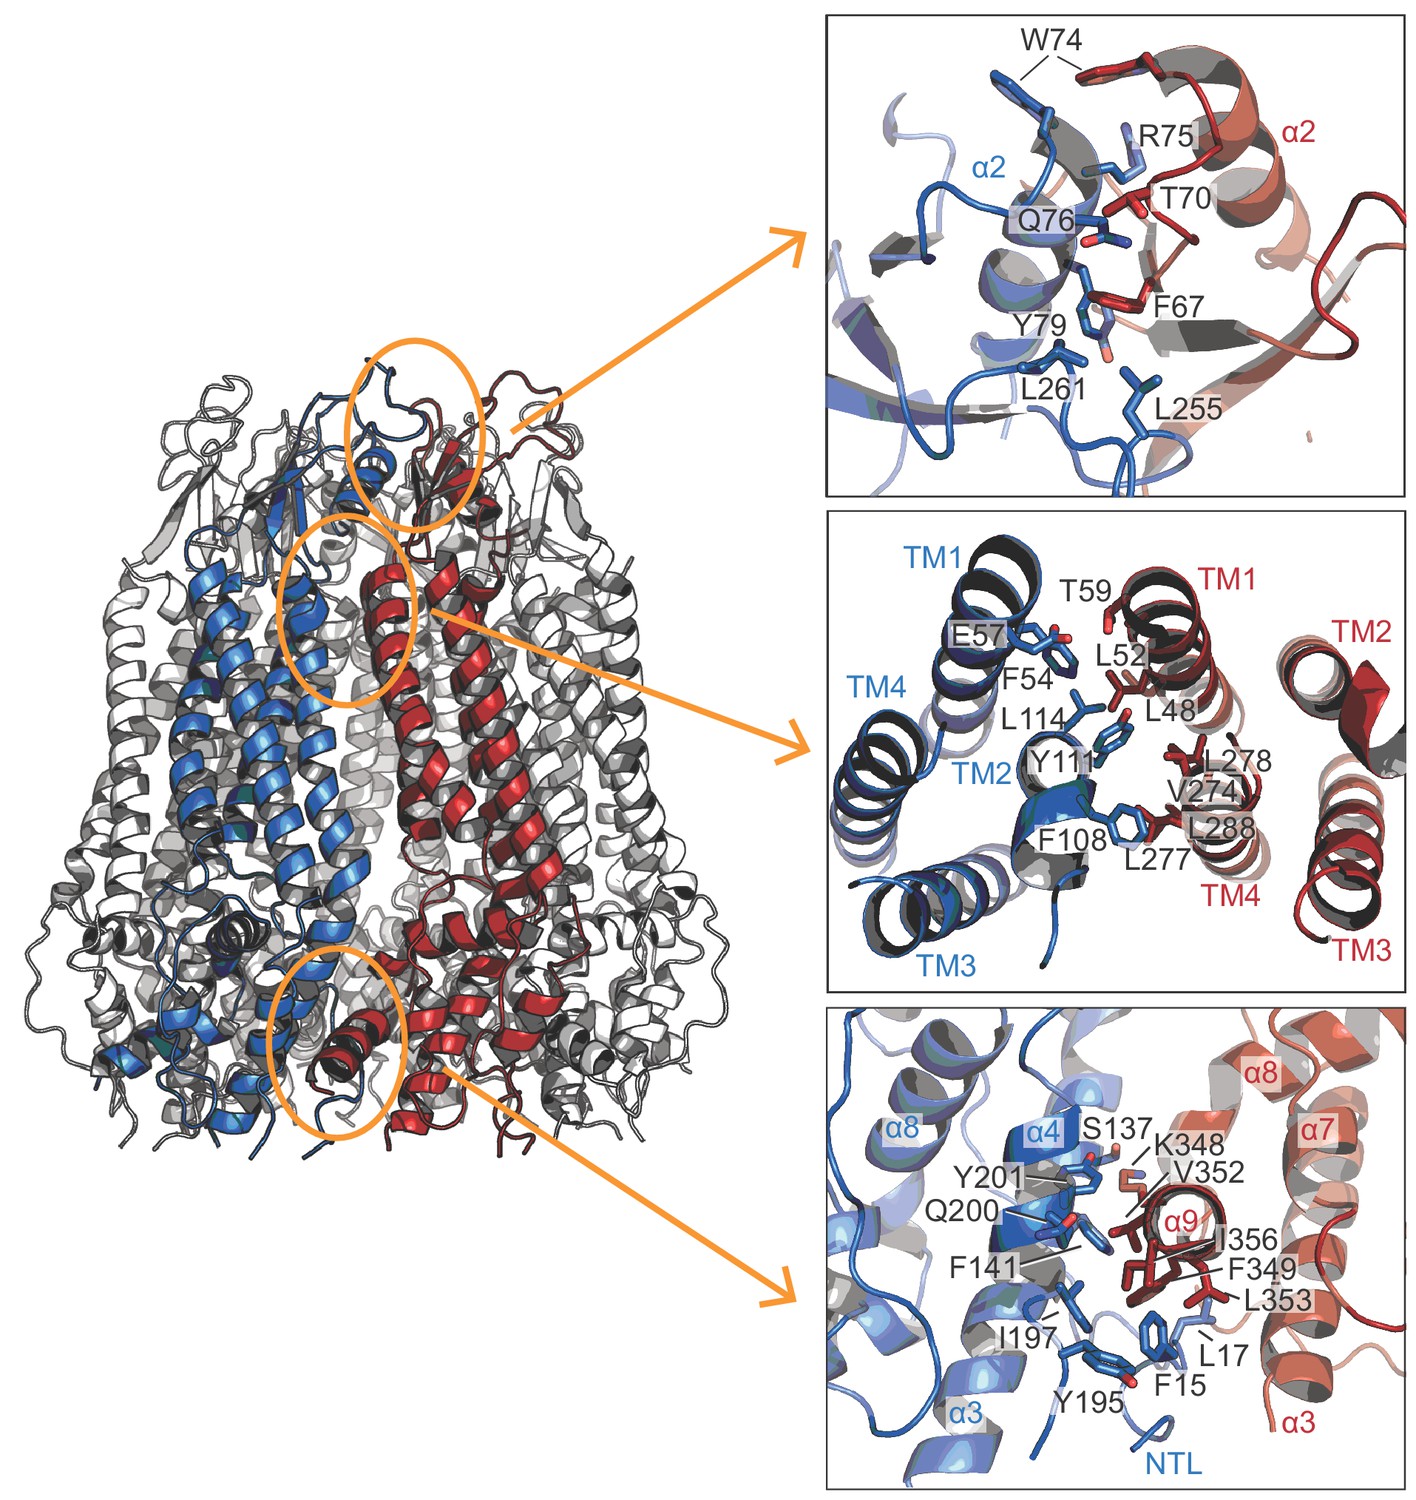
Inter-subunit interactions.
Three major inter-subunit interfaces between two neighboring subunits (blue and red) are highlighted in orange ovals (left). Close-up views (right) show the highly-conserved residues mediating the inter-subunit interactions.
Figure 3 with 2 supplements
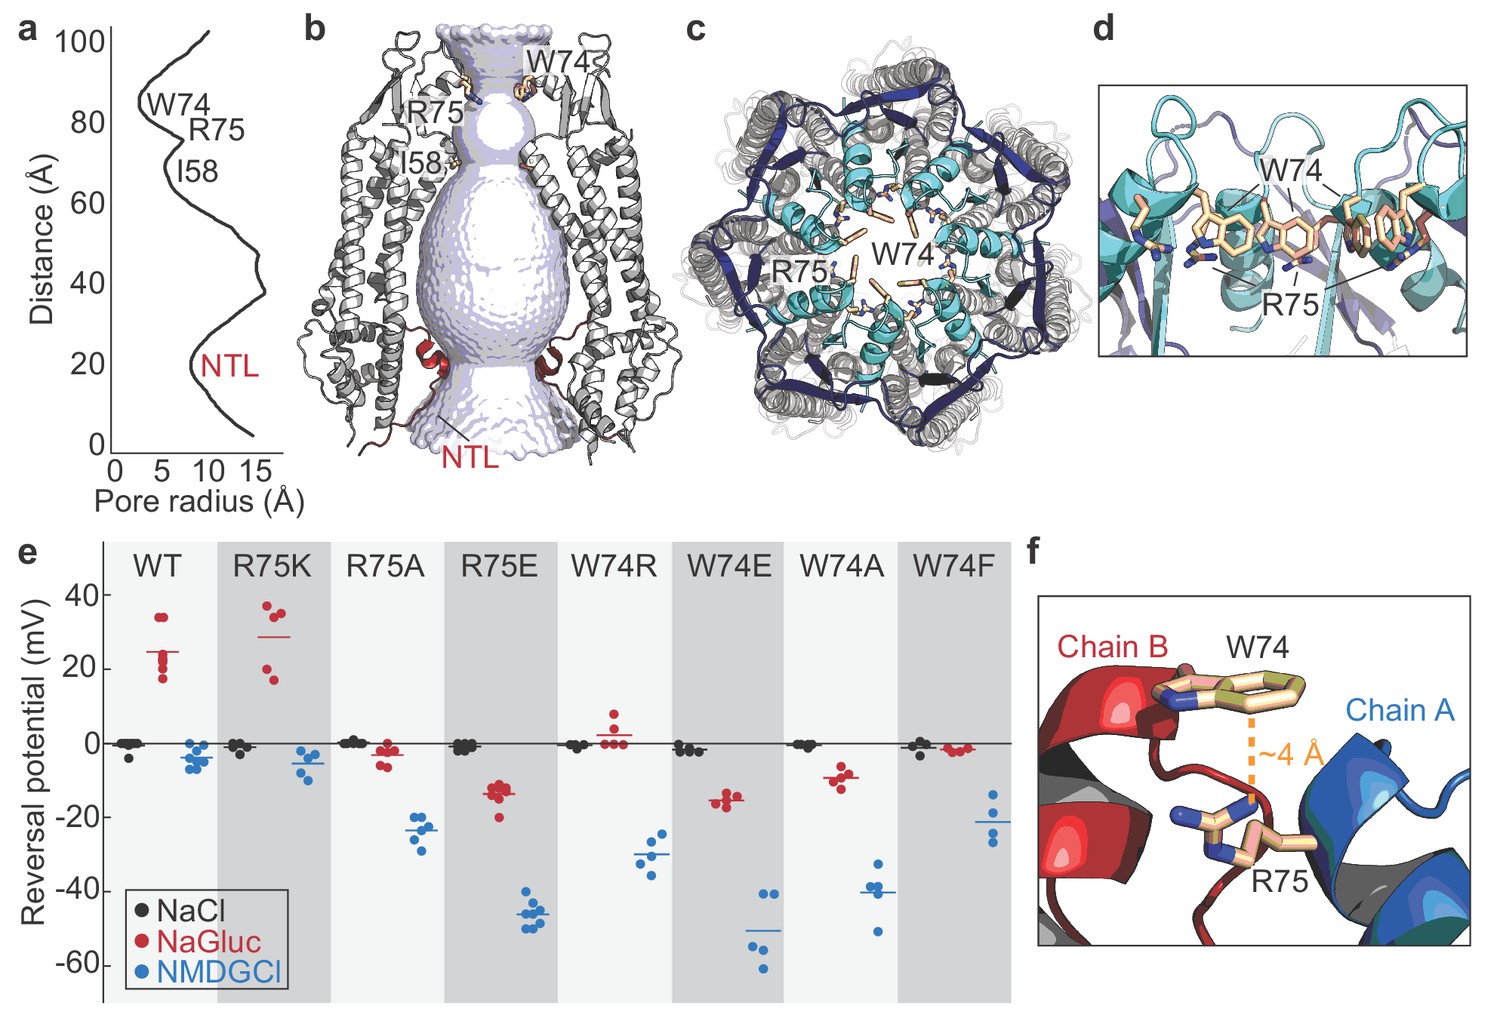
Permeation and ion selectivity of Panx1 channels.
(a) HOLE (Smart et al., 1996) diagram demonstrating constrictions along the permeation pathway. NTL; N-terminal loop. (b) Surface representation of the internal space along the molecular 7-fold axis running through the center of frPanx1. The surface was generate using HOLE. (c and d) Top view facing the extracellular side (c) or side view (d) of frPanx1, with ECL1 shown in light blue and ECL2 in dark blue. Trp74 and Arg75 are shown as sticks. (e) Reversal potentials of various hPanx1 ion selectivity mutants. Each point represents the Erev measured in NaCl (black), NaGluc (red), or NMDGCl (blue), and bars represent the mean values. I-V curves were obtained by a ramp protocol from −80 mV to +80 mV. (f) Close-up view of the Trp74-Arg75 interaction at the interface of protomer A (blue) and B (red).
Figure 3—figure supplement 1
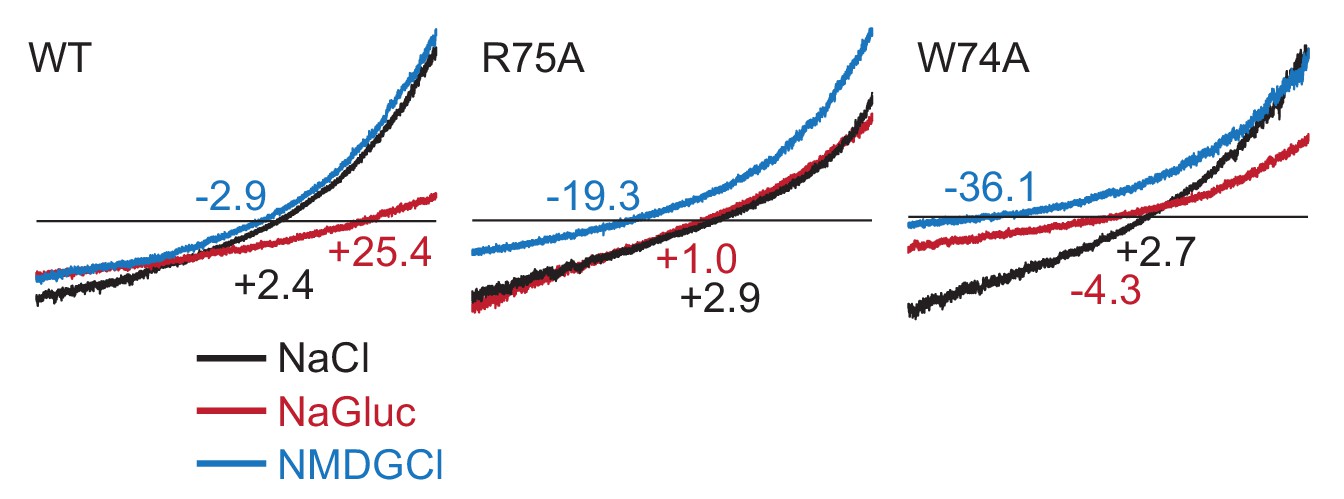
Representative traces of the ramp recordings.
HEK293 cells were held at −60 mV and ramped between −100 mV and + 100 mV over 3 s duration. The numbers indicate the reversal potentials in mV.
Figure 3—figure supplement 2

Electrostatic surface potential of the ion permeation pathway.
A coronal section of frPanx1-ΔLC shows the surface of the ion permeation pathway. Electrostatic surface potential was calculated using APBS plugin (Baker et al., 2001) in Pymol (Schrodinger, LLC, 2015) and presented in the range between −15 kT/e (red: acidic) and +15 kT/e (blue: basic).
Figure 4

CBX action requires residues from both ECL1 and ECL2.
(a and b) Surface (a) and cartoon (b) representations of the frPanx1 ECL1 (light blue) and ECL2 (dark blue), with potential CBX-interacting residues shown in orange. (c) Quantification of whole-cell currents from hPanx1 mutants when treated with CBX (100 μM). Mutants are numbered according to the hPanx1 sequence while the mutants in parenthesis are the corresponding residues in frPanx1. Recordings were performed by stepping to +100 mV in the absence or presence of CBX, and each point represents the normalized current amplitude during the CBX application. Bars represent the mean value from each mutant. Asterisks indicate significance of p<0.05 determined by one-way ANOVA followed by Dunnett’s test comparing WT to each mutant (F262C: p=0.0007; I247C: p=0.0471; V258C: p=0.0363).
Videos
Video 1
Cryo-EM density of frPanx1-ΔLC.
The model is shown as wire representation and fit into the corresponding density contoured at σ = 3.0. Each domain is colored differently and Tryp74 and Arg75 are labeled in the close-up view.
Tables
Table 1
Cryo-EM data collection, refinement and validation statistics.
| frPanx- ΔLC (EMD-21150) (PDB: 6VD7) | |
|---|---|
| Data collection and processing | |
| Magnification | 130,000 |
| Voltage (kV) | 300 |
| Electron exposure (e–/Å2) | 57.2 |
| Defocus range (μm) | 1.2–2.8 |
| Pixel size (Å) | 1.07 |
| Symmetry imposed | C7 |
| Initial particle images (no.) | 297374 |
| Final particle images (no.) | 90185 |
| Map resolution (Å) FSC threshold | 3.02 0.143 |
| Refinement | |
| Initial model used (PDB code) | de novo |
| Model resolution (Å) FSC threshold | 3.29 0.5 |
| Model resolution range (Å) | 3–6 |
| Map sharpening B factor (Å2) | −90 |
| Model composition Non-hydrogen atoms Protein residues Ligands | 16506 2079 0 |
| CC map vs. model (%) | 0.85 |
| R.m.s. deviations Bond lengths (Å) Bond angles (°) | 0.008 0.759 |
| Validation MolProbity score Clashscore Poor rotamers (%) | 1.92 5.96 0.78 |
| Ramachandran plot Favored (%) Allowed (%) Disallowed (%) | 88.32 11.68 0 |
Key resources table
| Reagent type (species) or resource | Designation | Source or reference | Identifiers | Additional information |
|---|---|---|---|---|
| Gene (Xenopus tropicalis) | frPanx1 | Synthesized by Genscript | NCBI Reference Sequence: NP_001123728.1 | Frog pannexin-1 gene sequence |
| Gene (Homo sapiens) | hPanx1 | Synthesized by Genscript | NCBI Reference Sequence: NP_056183.2 | Human pannexin-1 gene sequence |
| Cell line (Homo sapiens) | HEK293T cells | ATCC | Cat#: CRL-3216, RRID: CVCL_0045 | |
| Cell line (Spodoptera frugiperda) | Sf9 cells | ATCC | Cat#: CRL-1711, RRID: CVCL_0549 | |
| Recombinant DNA reagent | pIE2 hPanx1 | doi: 10.1085/jgp.201711804 | Mammalian expression vector for electrophysiology presented in Figure 1—figure supplement 1 and 2 | |
| Recombinant DNA reagent | pIE2 hPanx1 +GS | doi: 10.1085/jgp.201711804 | Mammalian expression vector for electrophysiology presented in Figures 1, 3 and 4 | |
| Recombinant DNA reagent | pIE2 frPanx1 | This paper | Mammalian expression vector for electrophysiology presented in Figure 1—figure supplement 1 and 2 | |
| Recombinant DNA reagent | pIE2 frPanx1 +GS | This paper | Mammalian expression vector for electrophysiology presented in Figure 1 | |
| Recombinant DNA reagent | pIE2 frPanx1-ΔLC | This paper | Mammalian expression vector for electrophysiology presented in Figure 1—figure supplement 1 and 2 | |
| Recombinant DNA reagent | pIE2 frPanx1-ΔLC +GS | This paper | Mammalian expression vector for electrophysiology presented in Figure 1 | |
| Recombinant DNA reagent | pC-NG-FB7 frPanx1-ΔLC | This paper | Insect cell/baculovirus expression construct | |
| Recombinant DNA reagent | pC-NG-FB7 frPanx1 | This paper | Insect cell/baculovirus expression construct | |
| Recombinant DNA reagent | pC-NG-FB7 hPanx1 | This paper | Insect cell/baculovirus expression construct | |
| Peptide, recombinant protein | MSP2N2 | doi: 10.1016/S0076-6879(09)64011–8 | nanodisc expression construct | |
| Commercial assay or kit | Fugene 6 | Promega | Cat#: E2691 | |
| Chemical compound, drug | Carbenoxolone | Sigma | Cat#: C4790 | |
| Chemical compound, drug | C12E8 | Anatrace | Cat#: APO128 | |
| Chemical compound, drug | DDM | Anatrace | Cat#: D310 | |
| Chemical compound, drug | Soybean polar lipid extract | Avanti | Cat#: 541602 | |
| Software, algorithm | cisTEM | doi: 10.7554/eLife.35383 | RRID: SCR_016502 | |
| Software, algorithm | Warp | doi: 10.1038/s41592-019-0580-y | ||
| Software, algorithm | Coot | doi: 10.1107/S0907444904019158 | RRID: SCR_014222 | |
| Software, algorithm | PHENIX | doi: 10.1107/S09074449052925 | RRID: SCR_014224 | |
| Software, algorithm | Axon pClamp 10.5 | Axon (Molecular Devices) | RRID: SCR_011323 |
Additional files
Download links
A two-part list of links to download the article, or parts of the article, in various formats.
Downloads (link to download the article as PDF)
Open citations (links to open the citations from this article in various online reference manager services)
Cite this article (links to download the citations from this article in formats compatible with various reference manager tools)
The Cryo-EM structure of pannexin 1 reveals unique motifs for ion selection and inhibition
eLife 9:e54670.
https://doi.org/10.7554/eLife.54670


