Single cell transcriptomics identifies a unique adipose lineage cell population that regulates bone marrow environment
- Department of Orthopaedic Surgery, Perelman School of Medicine, University of Pennsylvania, United States
- Department of Orthopaedics, The First Hospital of China Medical University, China
- Department of Orthopaedics, Union Hospital, Tongji Medical College, Huazhong University of Science and Technology, China
- Department of Biostatistics, Epidemiology and Informatics, University of Pennsylvania Perelman School of Medicine, United States
- Renal Electrolyte and Hypertension Division, Department of Medicine and Genetics, University of Pennsylvania, United States
- Department of Orthopaedics, Shandong University Qilu Hospital, Shandong University, China
- Division of Hematology, Children's Hospital of Philadelphia, United States
- Department of Pediatrics, Perelman School of Medicine at the University of Pennsylvania, United States
- Department of Physical Medicine and Rehabilitation, Perelman School of Medicine, University of Pennsylvania, United States
- Translational Musculoskeletal Research Center (TMRC), Corporal Michael J. Crescenz Veterans Affairs Medical Center, United States
- Division of Transnational Medicine and Human Genetics, Perelman School of Medicine, University of Pennsylvania, United States
- Translational Research Program in Pediatric Orthopaedics, The Children's Hospital of Philadelphia, United States
- Department of Oral and Maxillofacial Surgery/Pharmacology, University of Pennsylvania, School of Dental Medicine, United States
- Department of Cell and Developmental Biology, Perelman School of Medicine, University of Pennsylvania, United States
Figures
Figure 1 with 5 supplements
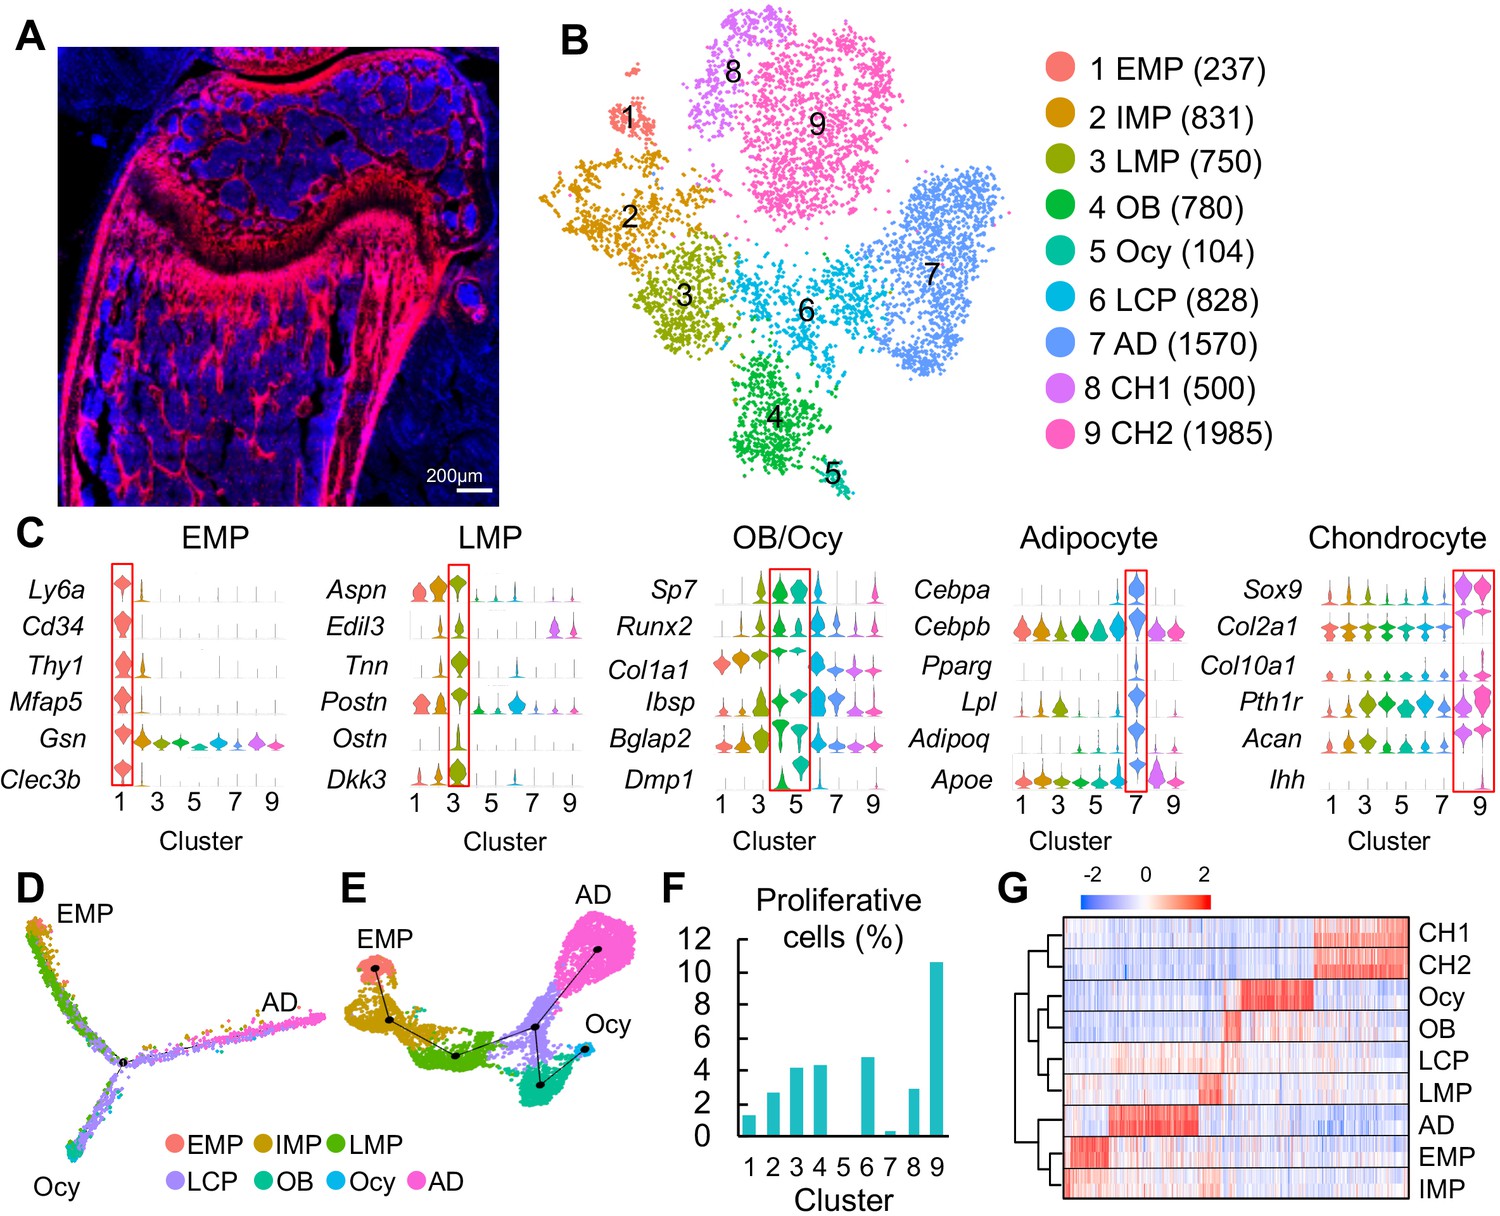
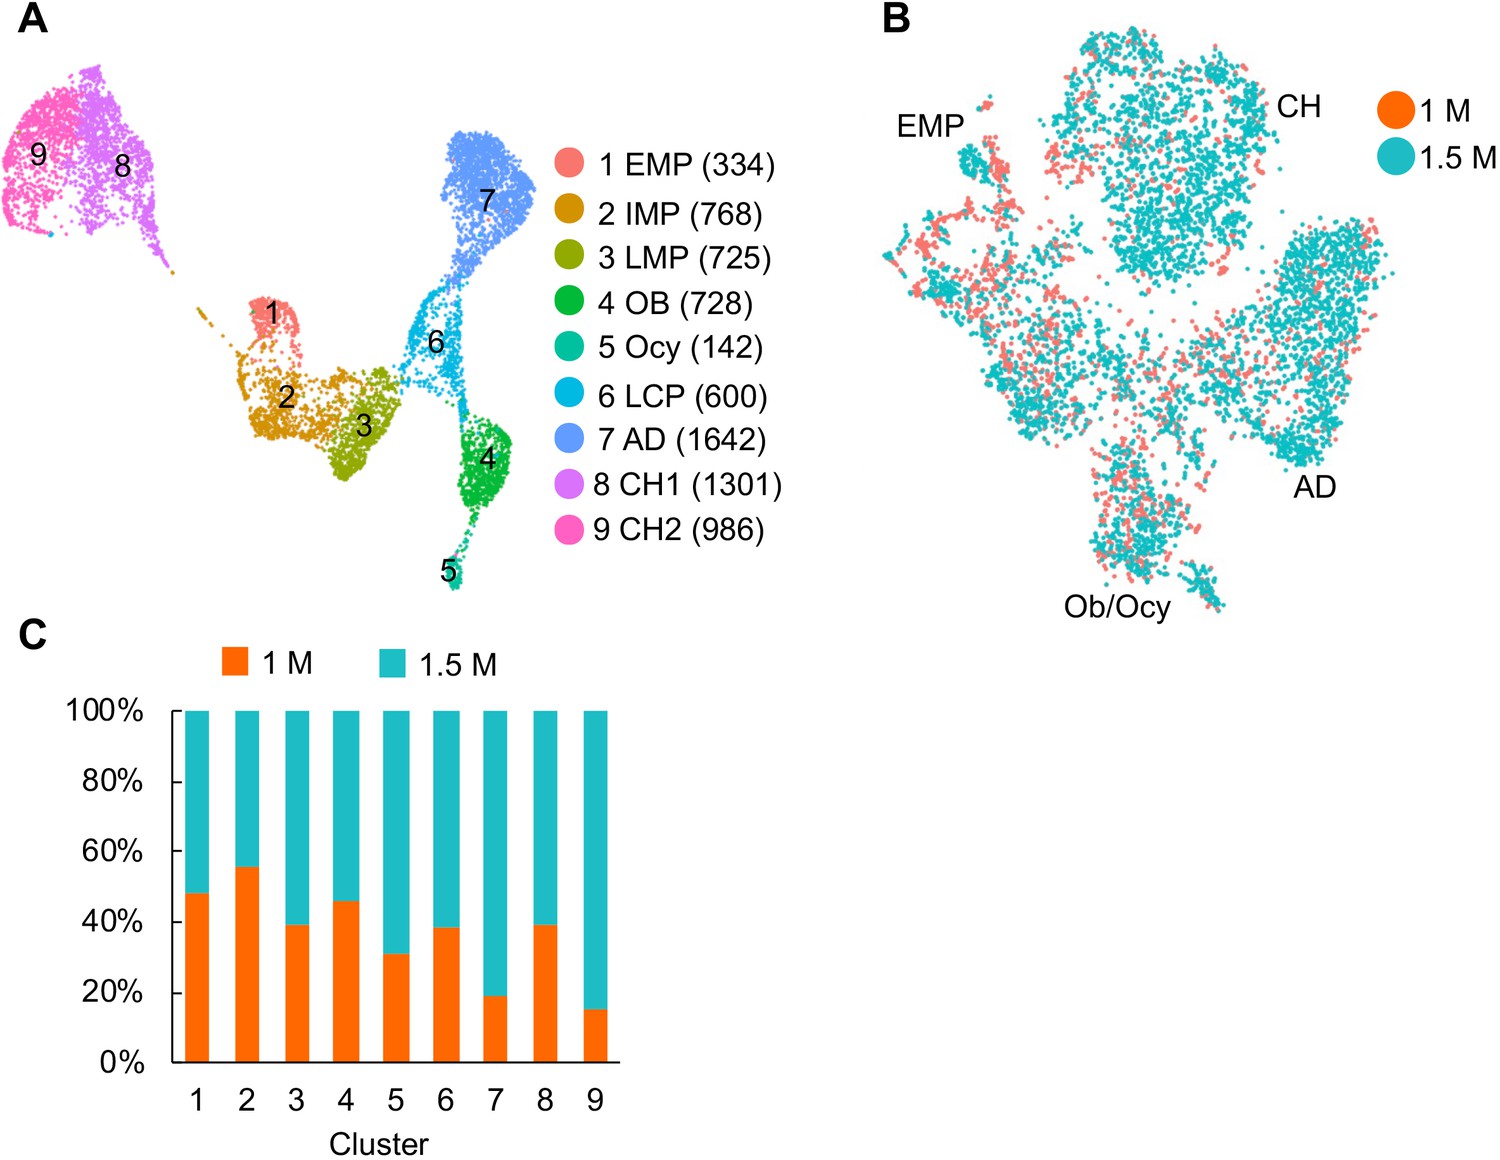
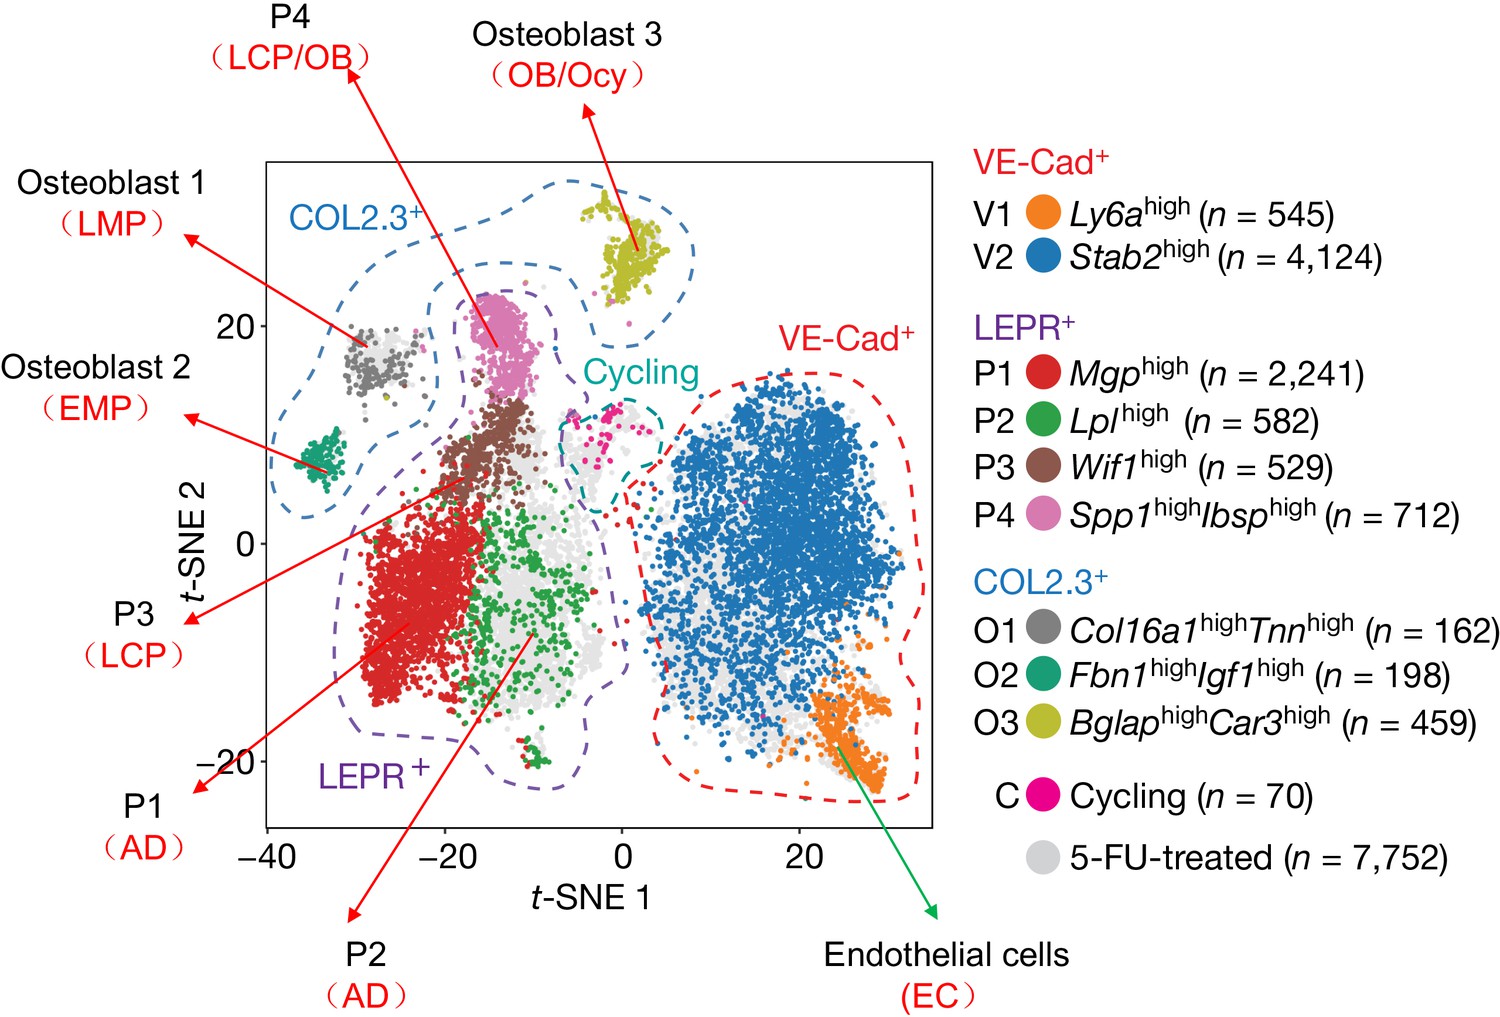
Clustering of bone marrow mesenchymal lineage cells by single cell transcriptomics reveals the in vivo identity of novel mesenchymal subpopulations.
(A) Fluorescent image of distal femur of 1-month-old Col2:Td mice. (B) The tSNE plot of 7585 Td+ mesenchymal lineage cells isolated from endosteal bone marrow of 1–1.5 month-old Col2:Td mice (n = 5 mice). Cell numbers are listed in parenthesis next to cluster names. OB: osteoblast; Ocy: osteocyte; LCP: lineage committed progenitor; AD: adipocyte; CH: chondrocyte. (C) Violin plots of marker gene expression for EMPs, LMPs, osteoblast/osteocyte, adipocyte, and chondrocyte clusters. (D) Monocle trajectory plot of bone marrow mesenchymal lineage cells. (E) Slingshot trajectory plot of bone marrow mesenchymal lineage cells. In D and E, cells are labeled according to their Seurat clusters. (F) The percentage of proliferative cells (S/G2/M phase) among each cluster was quantified. (G) Hierarchy clustering and heatmap of mesenchymal lineage clusters. Color bar on the top indicates the gene expression level. Each cluster contains two batches (top and bottom) of samples.
Figure 1—figure supplement 1
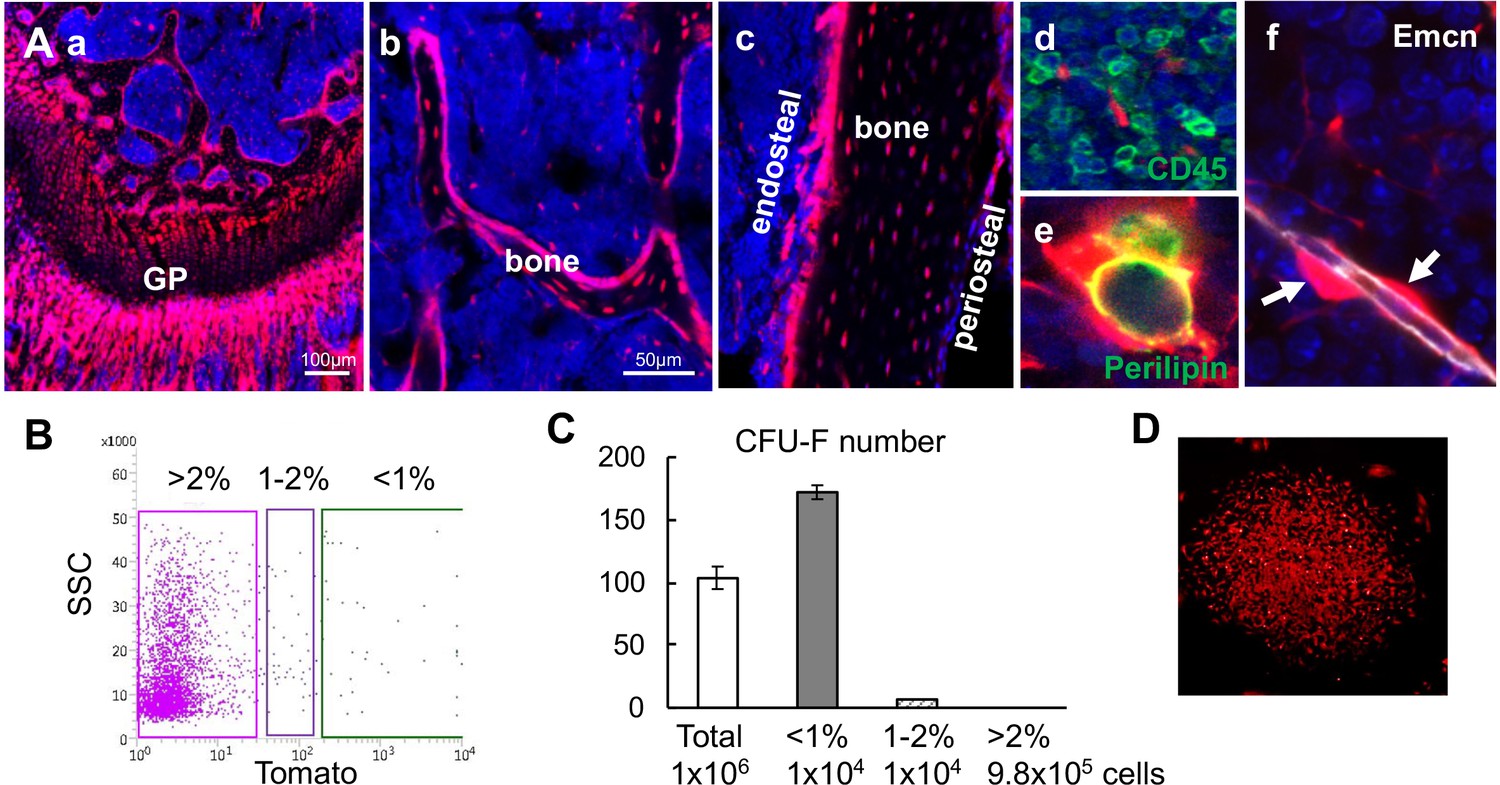
Bone marrow Td+ cells from Col2:Td mice contain the entire set of mesenchymal lineage cells.
(A) Fluorescent images of distal femur show that chondrocytes (a), osteoblasts and osteocytes in trabecular bone (b) and cortical bone (c), CD45- stromal cells (d), adipocytes (e), and pericytes (arrows, f) are Td+. GP: growth plate; Emcn: Endomucin. (B) Endosteal bone marrow cells were FACS sorted into top 1% (<1%), 1–2%, and >2% Td expressing cells. (C) Unsorted and sorted cells were cultured for CFU-F assay. Cell number per flask is listed below. n = 3–4 flasks/group. (D) All CFU-F colonies from top 1% group were Td+.
Figure 1—figure supplement 2
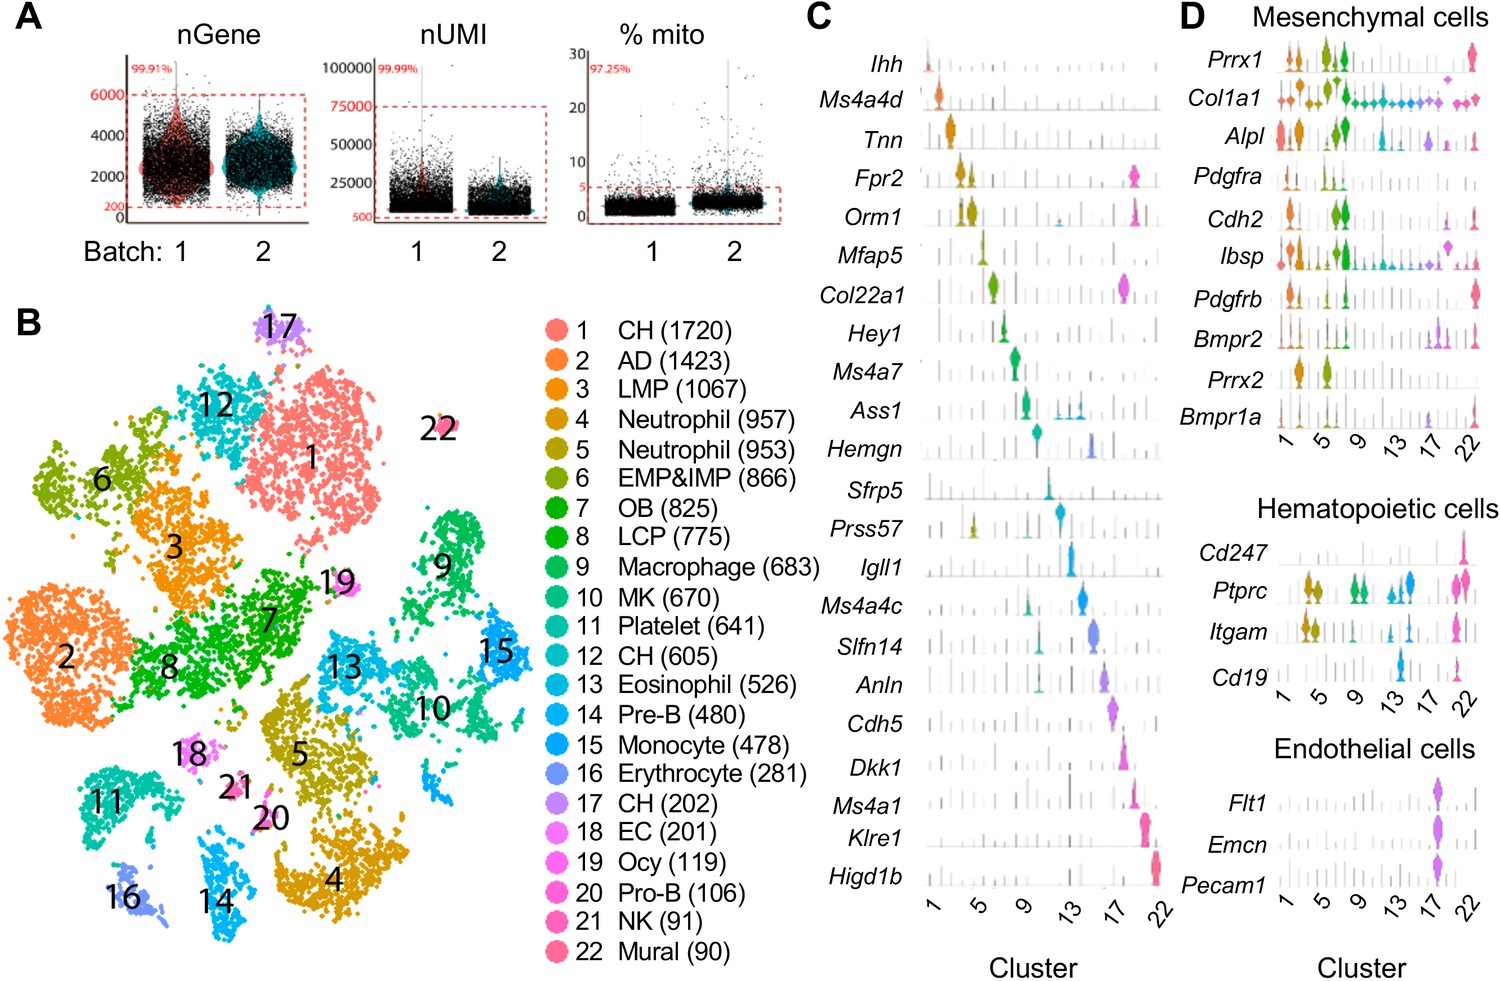
Large scale scRNA-seq analysis of top 1% Td+ cells from endosteal bone marrow of 1–1.5 month-old Col2:Td mice.
(A) Violin plots show numbers of genes, UMIs, and percentages of mitochondrial genes among two batches of samples (1 and 1.5 month). Red box indicates cells within the selection criteria of quality controls. (B) The tSNE plot of 13759 Td+ endosteal bone marrow cells isolated from 1 to 1.5 month-old Col2:Td mice (n = 5). Cell numbers are listed in parenthesis next to cluster names. OB: osteoblast; Ocy: osteocyte; LCP: lineage committed progenitor; AD: adipocyte; CH: chondrocyte; MK: megakaryocytes; EC: endothelial cells. (C) Violin plots of cluster-specific makers. (D) Violin plots of mesenchymal, hematopoietic, and endothelial lineage specific markers.
Figure 1—figure supplement 3
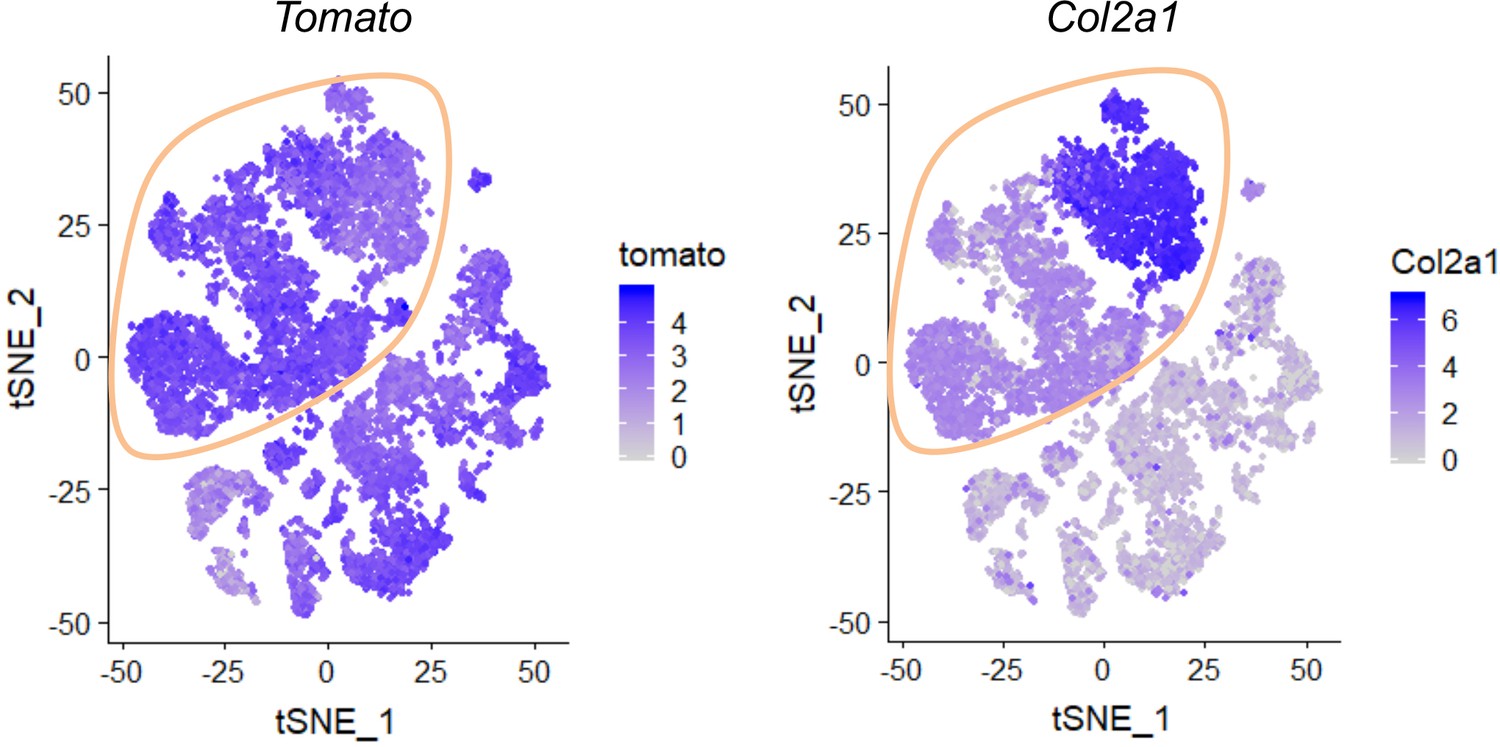
The expression patterns of Tomato and Col2a1 in tSNE plots.
Mesenchymal lineage cells were circled. Color bar on the right of each panel indicates the expression level.
Figure 1—figure supplement 4
No batch effect was detected in our analysis.
(A) The UMAP plot of 7585 Td+ mesenchymal lineage cells isolated from endosteal bone marrow of 1–1.5 month-old Col2:Td mice (n = 5 mice). (B) The distribution of cells from 1 month and 1.5 month datasets in the tSNE plot of mesenchymal lineage cells. (C) The distribution of cells from 1 month and 1.5 month datasets in each cluster.
Figure 1—figure supplement 5
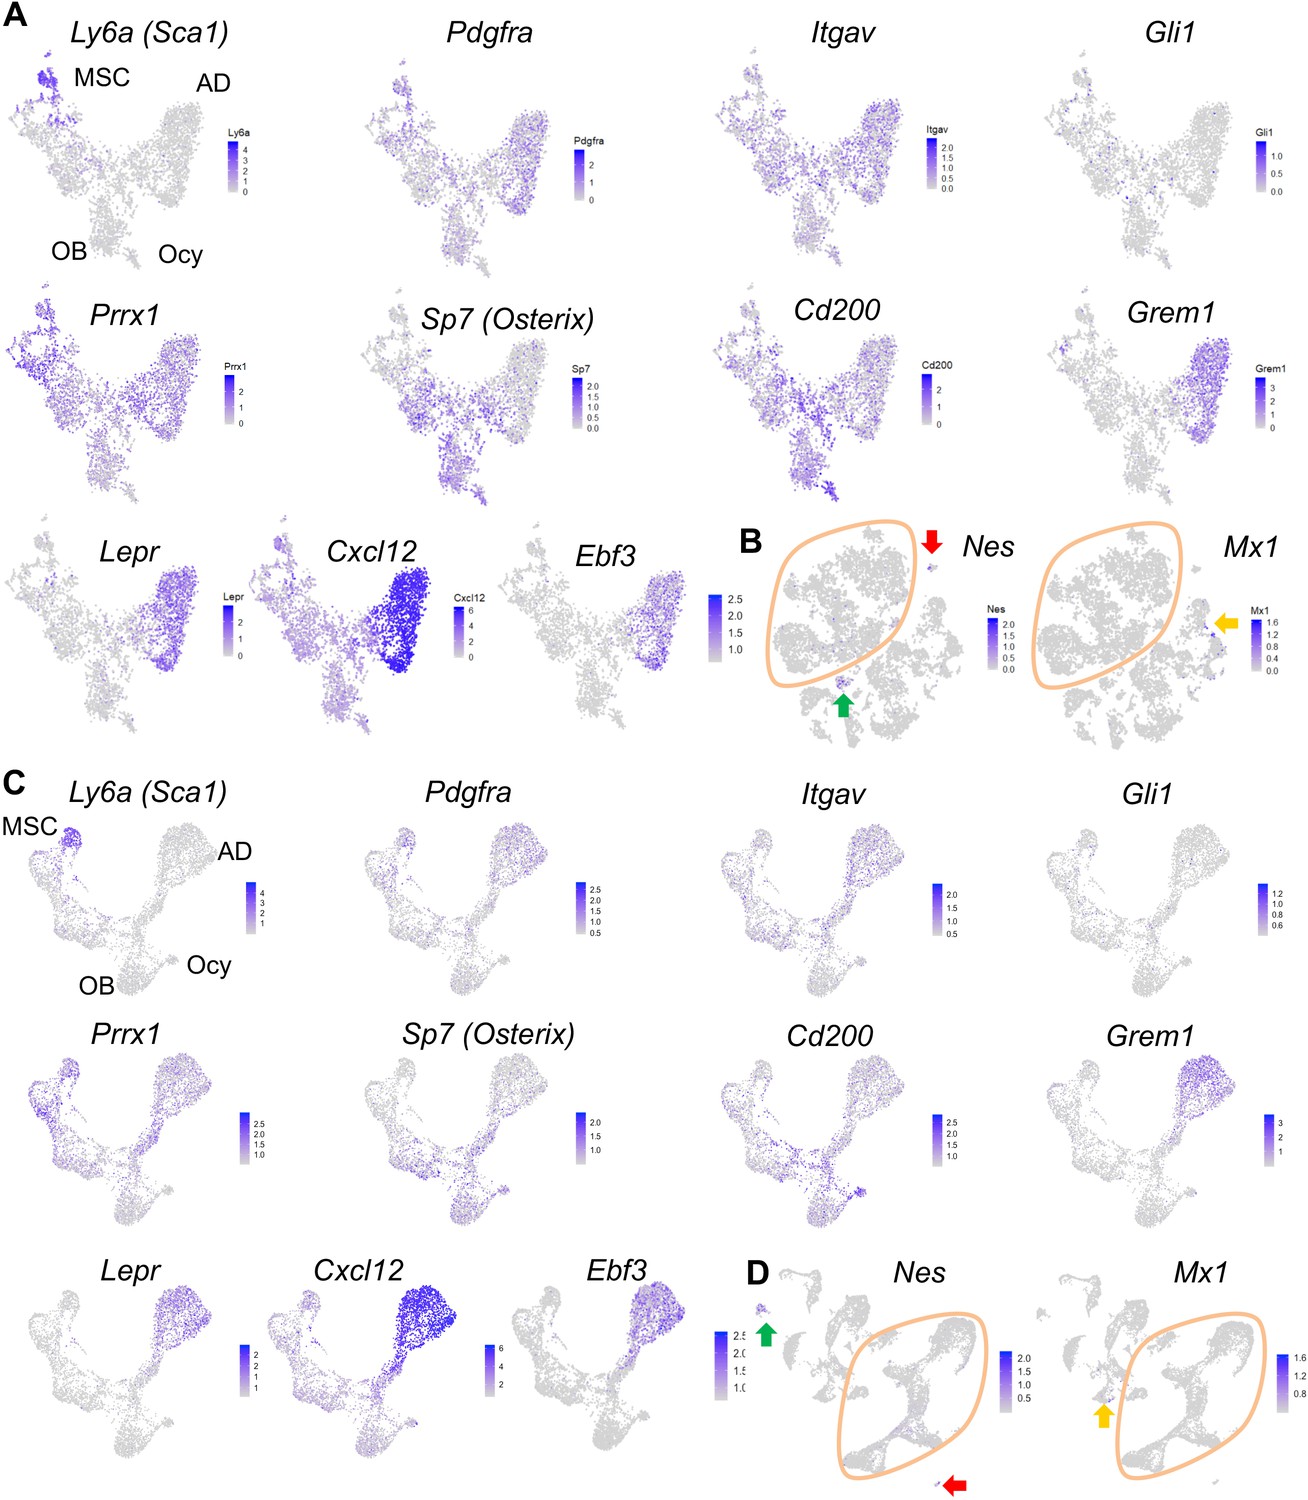
The expression patterns of previously reported mesenchymal progenitor markers.
(A) The expression patterns are shown in tSNE plots that only contain mesenchymal lineage cells. (B) The expression patterns are shown in tSNE plots that contain all sequenced cells. Green, red, and yellow arrows point to endothelial, mural, and hematopoietic cell clusters, respectively. (C, D) The expression patterns of markers are shown in UMAP plots.
Figure 2
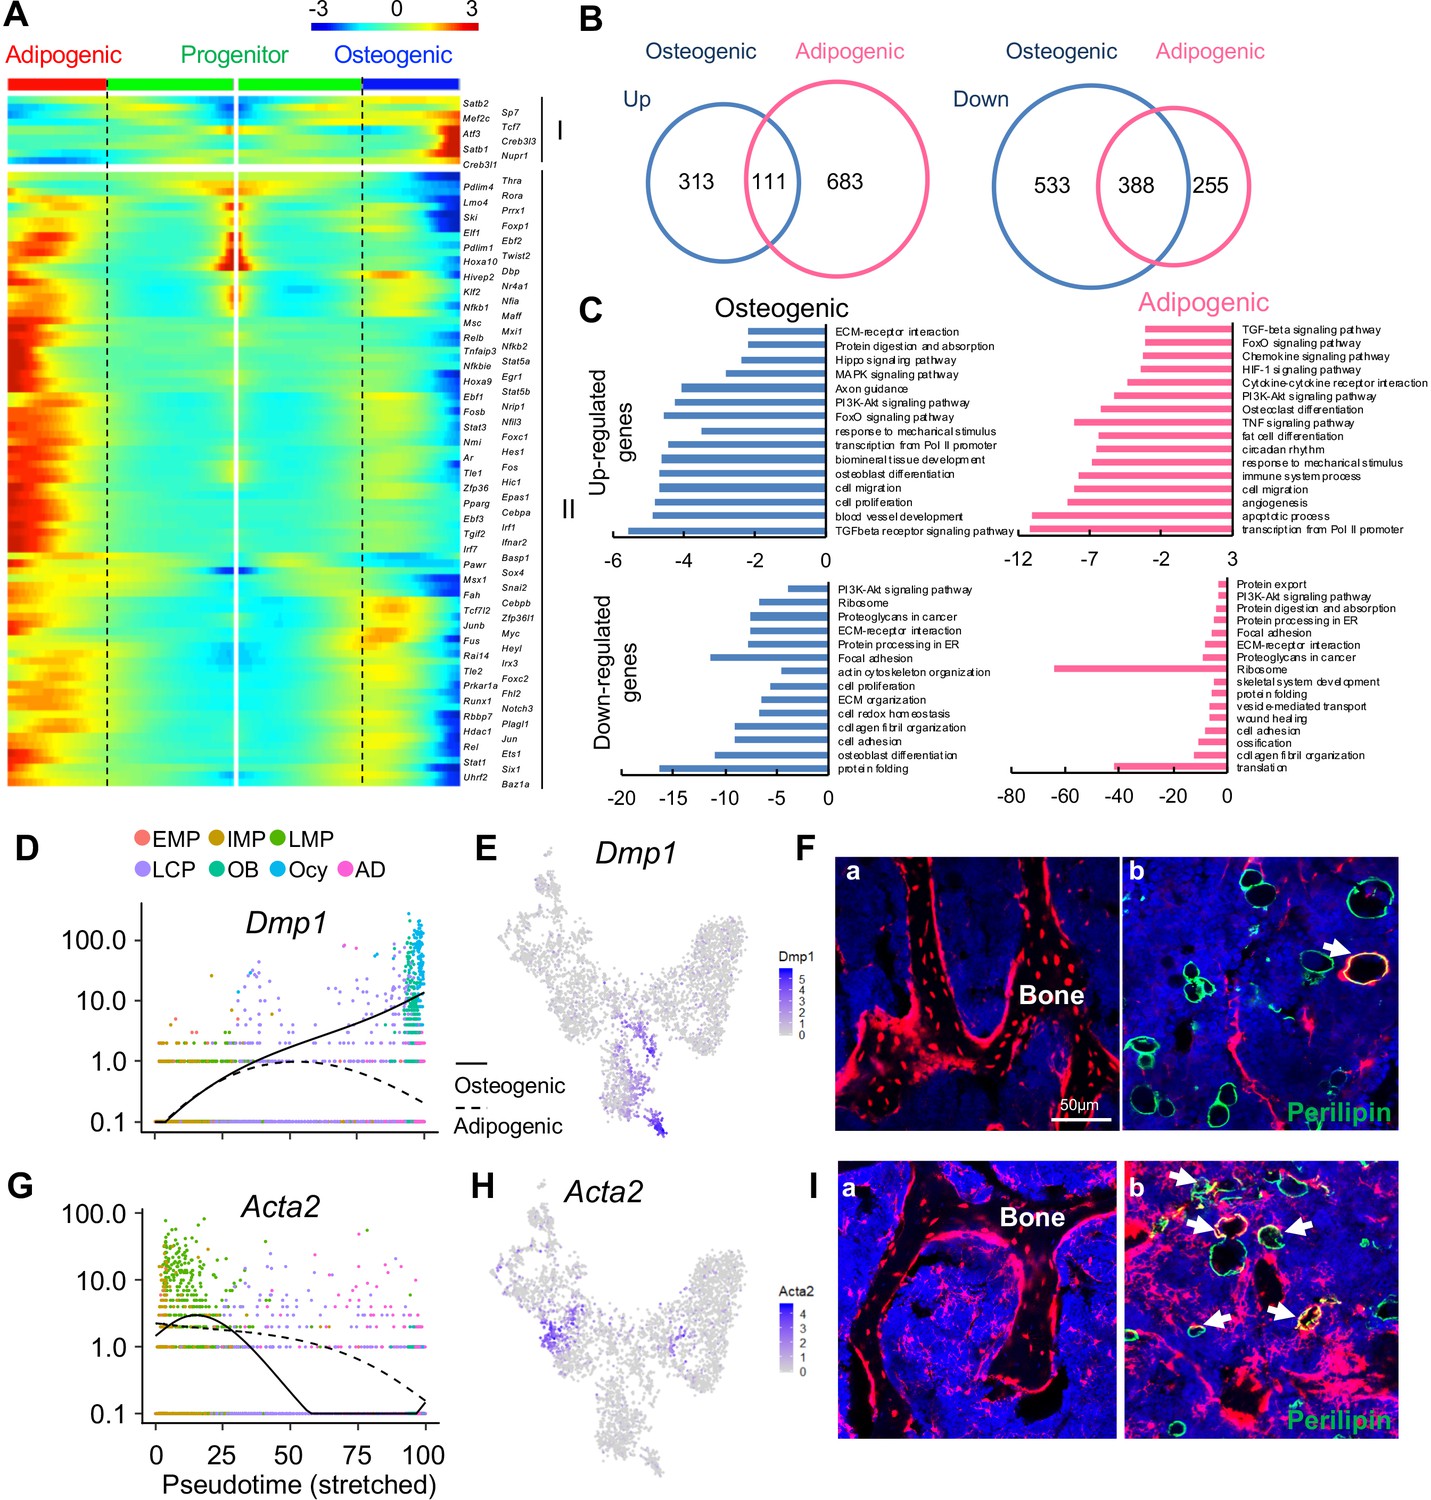
The bifurcated osteo- and adipo-lineage differentiation routes of in vivo bone marrow mesenchymal progenitors.
(A) Pseudotemporal depiction of differentially expressed transcription factors (TFs) starting from branching point (dashed lines) toward osteo- (right) and adipo- (left) lineage differentiation. Group I and II contain TFs that are highly up-regulated during osteogenic and adipogenic differentiation routes, respectively. Color bar indicates the gene expression level. (B) Differentially regulated (up-regulated and down-regulated) genes during osteogenic and adipogenic differentiation are counted. (C) GO term and KEGG pathway analyses of genes up-regulated and down-regulated during osteogenic and adipogenic differentiation. Note that some pathways, such as osteoblast differentiation, are identified by both up-regulated and down-regulated genes. This is due to the fact that a set of genes in a pathway are up-regulated while another set of genes in the same pathway are down-regulated. (D) Expression of Dmp1 goes from the progenitor state and bifurcating into osteogenic or adipogenic branches with respect to pseudotime coordinates. (E) The tSNE plot predicts Dmp1 expression in osteoblasts, osteocytes, and a portion of LCPs. (F) In 3-month-old Dmp1:Td mice, Td labels osteoblasts, osteocytes (a), and only a few adipocytes (b, arrows). (G) Expression of αSMA (Acta2) goes from the progenitor state and bifurcating into osteogenic or adipogenic branches with respect to pseudotime coordinates. (H) The tSNE plot predicts αSMA expression in LMPs. (I) In 4-month-old Acta2ER:Td mice with Tamoxifen injections at 1 month of age, Td labels osteoblasts, osteocytes (a) and many adipocytes (b, arrows).
Figure 3 with 2 supplements
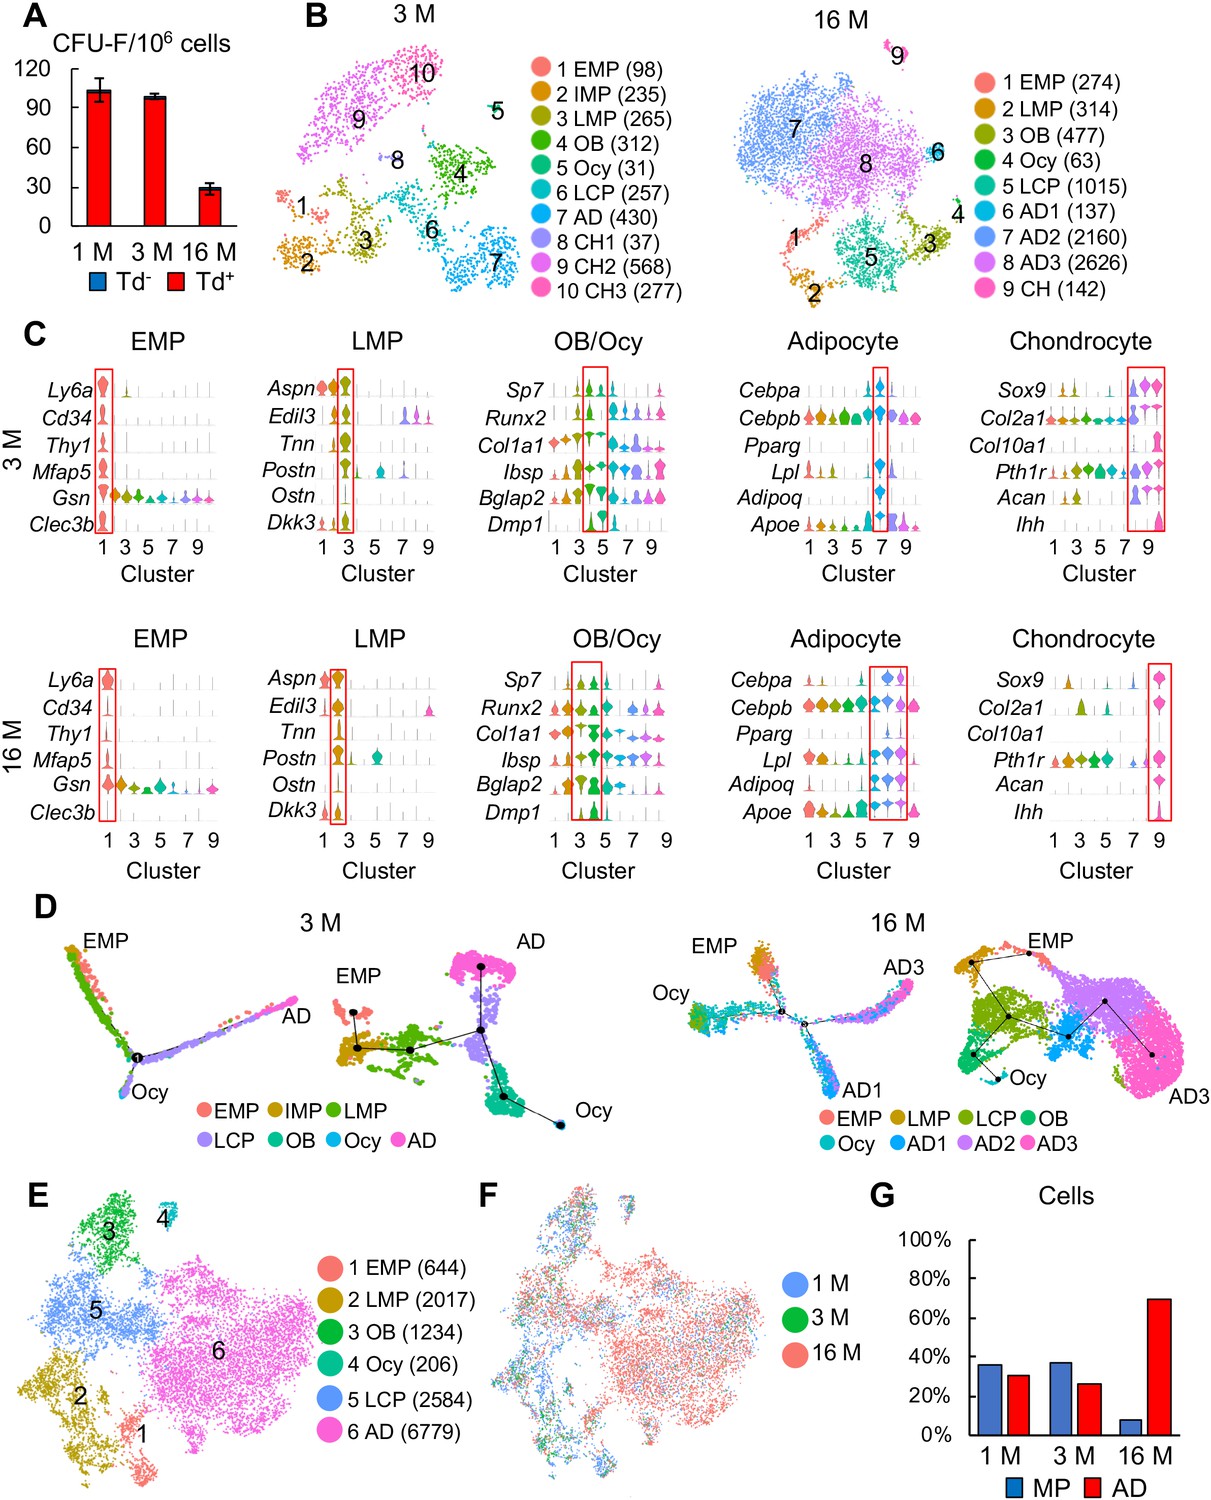
Large scale scRNA-seq analyses of bone marrow mesenchymal lineage cells from 3- and 16-month-old Col2:Td mice confirm the same in vivo mesenchymal subpopulations as 1-month-old mice.
(A) CFU-F assays of endosteal bone marrow cells from 1-, 3-, and 16-month-old Col2:Td mice. n = 3 mice/group. Td+ and Td- CFU-F colonies are quantified. (B) The tSNE plots of Td+ mesenchymal lineage cells isolated from endosteal bone marrow of 3- and 16-month-old Col2:Td mice (n = 3 mice/group). Cell numbers are listed in parenthesis next to cluster names. OB: osteoblast; Ocy: osteocyte; LCP: lineage committed progenitor; AD: adipocyte; CH: chondrocyte. (C) Violin plots of marker gene expression for indicated clusters in 3 and 16 month datasets. (D) Monocle (left) and Slingshot (right) trajectory plots of bone marrow mesenchymal lineage cells (excluding chondrocytes) in 3 and 16 month datasets. Cells are labeled according to their Seurat clusters. (E) An integrated tSNE plot of 1, 3, and 16 month datasets shows the clustering pattern. (F) An integrated tSNE plot of 1, 3, and 16 month datasets shows the distribution of each age group. (G) The percentages of mesenchymal progenitors before lineage commitment and adipocytes (ADs) within bone marrow mesenchymal lineage cells are quantified in each age group based on tSNE distribution.
-
Figure 3—source data 1
Raw data for Figure 3G.
- https://cdn.elifesciences.org/articles/54695/elife-54695-fig3-data1-v3.xlsx
Figure 3—figure supplement 1
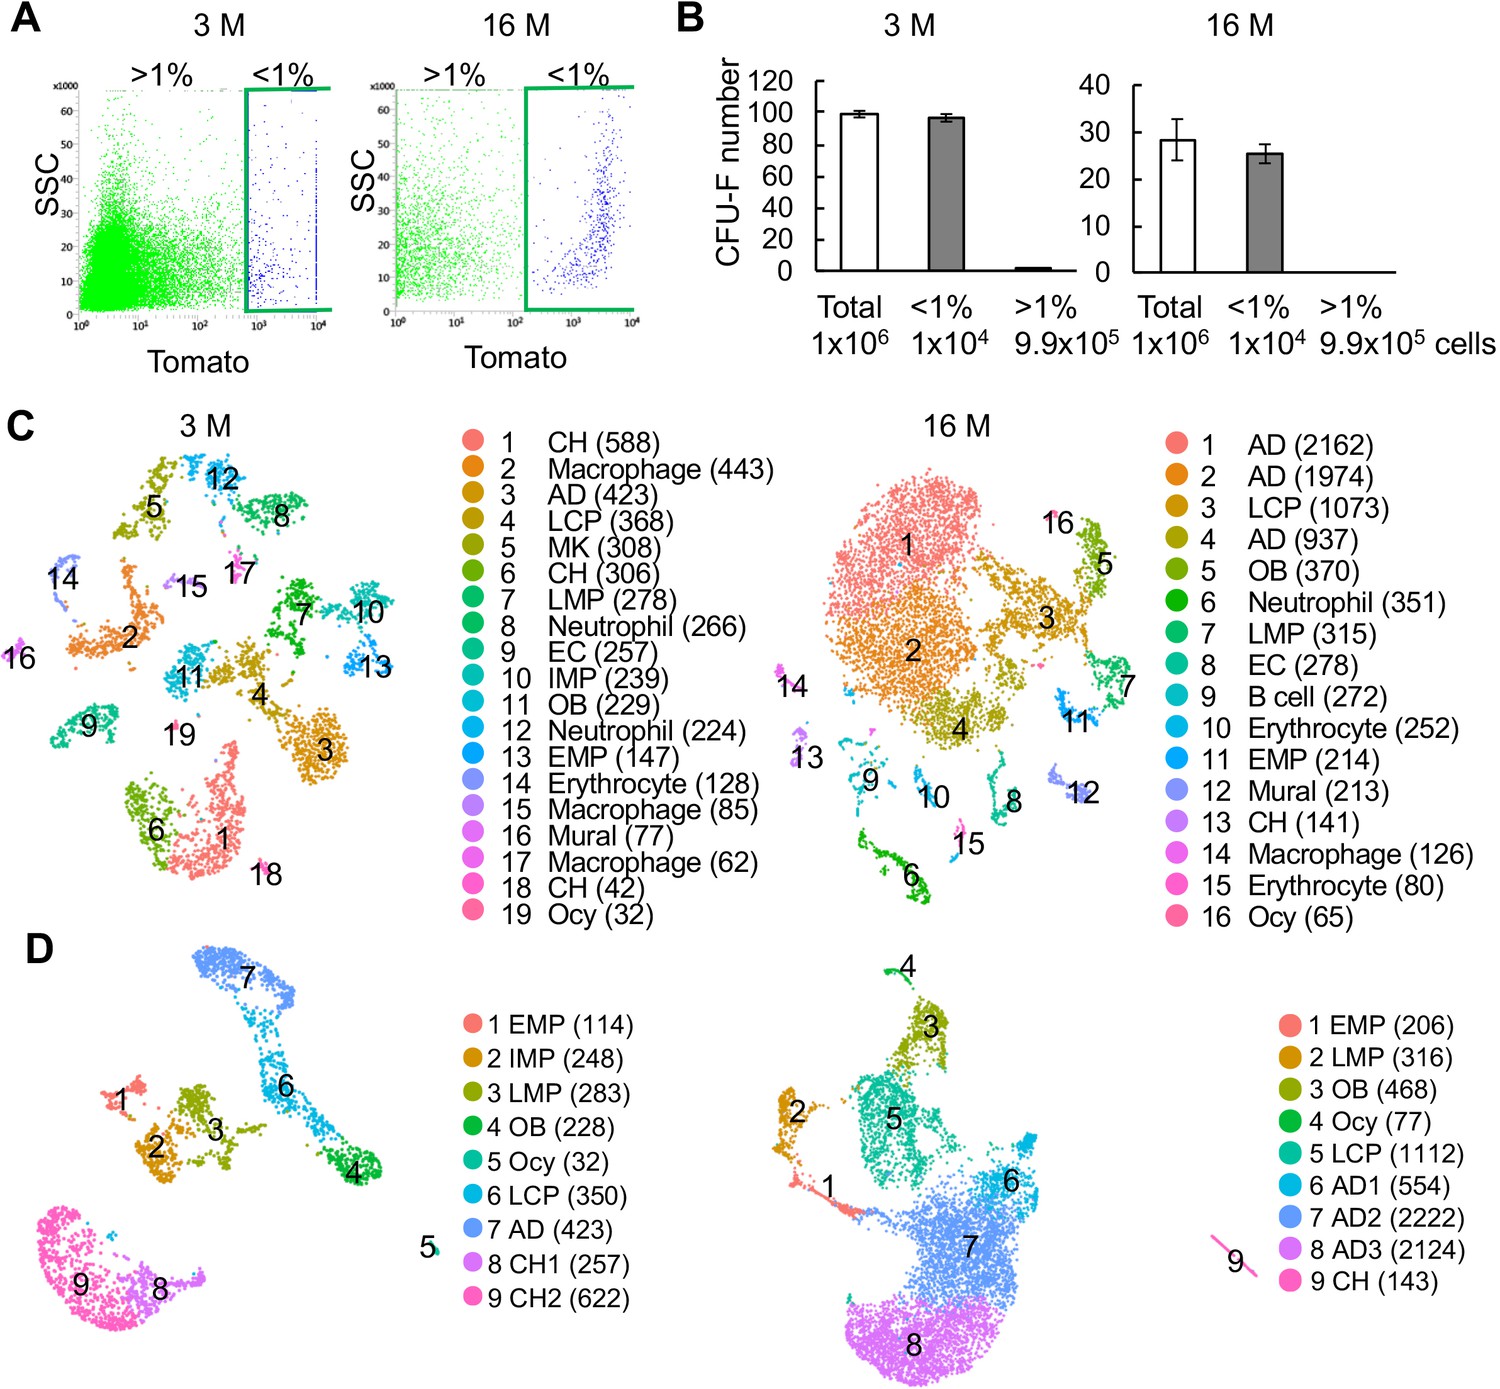
Large scale scRNA-seq analysis of top 1% Td+ cells from the endosteal bone marrow of 3- and 16-month-old Col2:Td mice.
(A) Endosteal bone marrow cells from 3- and 16 month old mice were FACS sorted into top 1% (<1%) and >1% Td expressing cells. (B) Unsorted and sorted cells were cultured for CFU-F assay. Cell number per flask is listed below. n = 3–4 flasks/group. (C) The tSNE plot of 4502 and 8823 Td+ endosteal bone marrow cells isolated from 3- and 16-month-old Col2:Td mice, respectively (n = 3/age). Cell numbers are listed in parenthesis next to cluster names. OB: osteoblast; Ocy: osteocyte; LCP: lineage committed progenitor; AD: adipocyte; CH: chondrocyte; MK: megakaryocyte; EC: endothelial cell. (D) The UMAP plot of 2510 and 7354 mesenchymal lineage cells from 3- and 16-month-old Col2:Td mice.
Figure 3—figure supplement 2
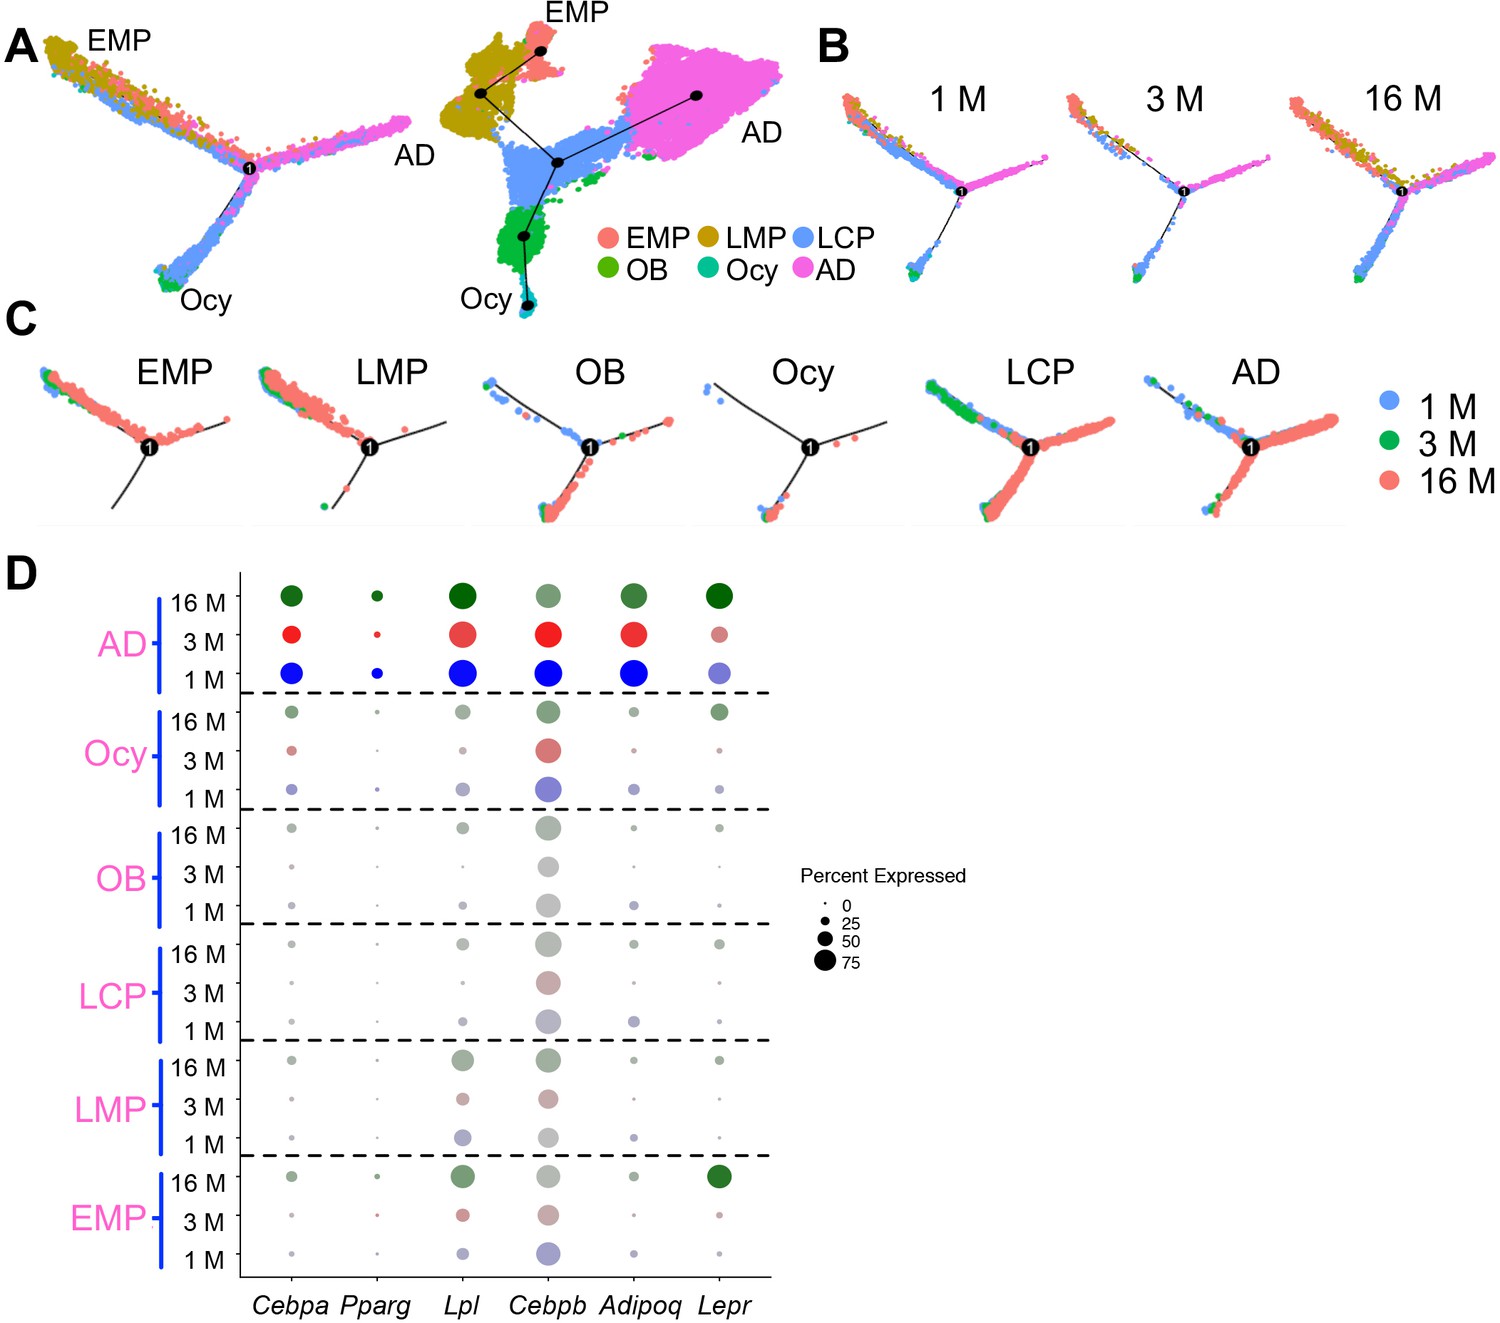
Pseudotime trajectory analysis of bone marrow mesenchymal lineage cells from all age groups.
(A) Monocle (left) and Slingshot (right) trajectory plots of bone marrow mesenchymal lineage cells of integrated database from mice at 1, 3 and 16 months of ages. Cells are labeled according to their Seurat clusters. (B) Monocle trajectory plots are separated based on age groups. (C) Monocle trajectory plots are separated based on age groups and Seurat clusters. (D) Dotplot of Cebpa, Pparg, Lpl, Adipoq and Lepr in Seurat clusters across different age groups. The circle size is proportional to the percentage of cells expressing the gene and transparency of circle is reversely correlated with the average gene expression level.
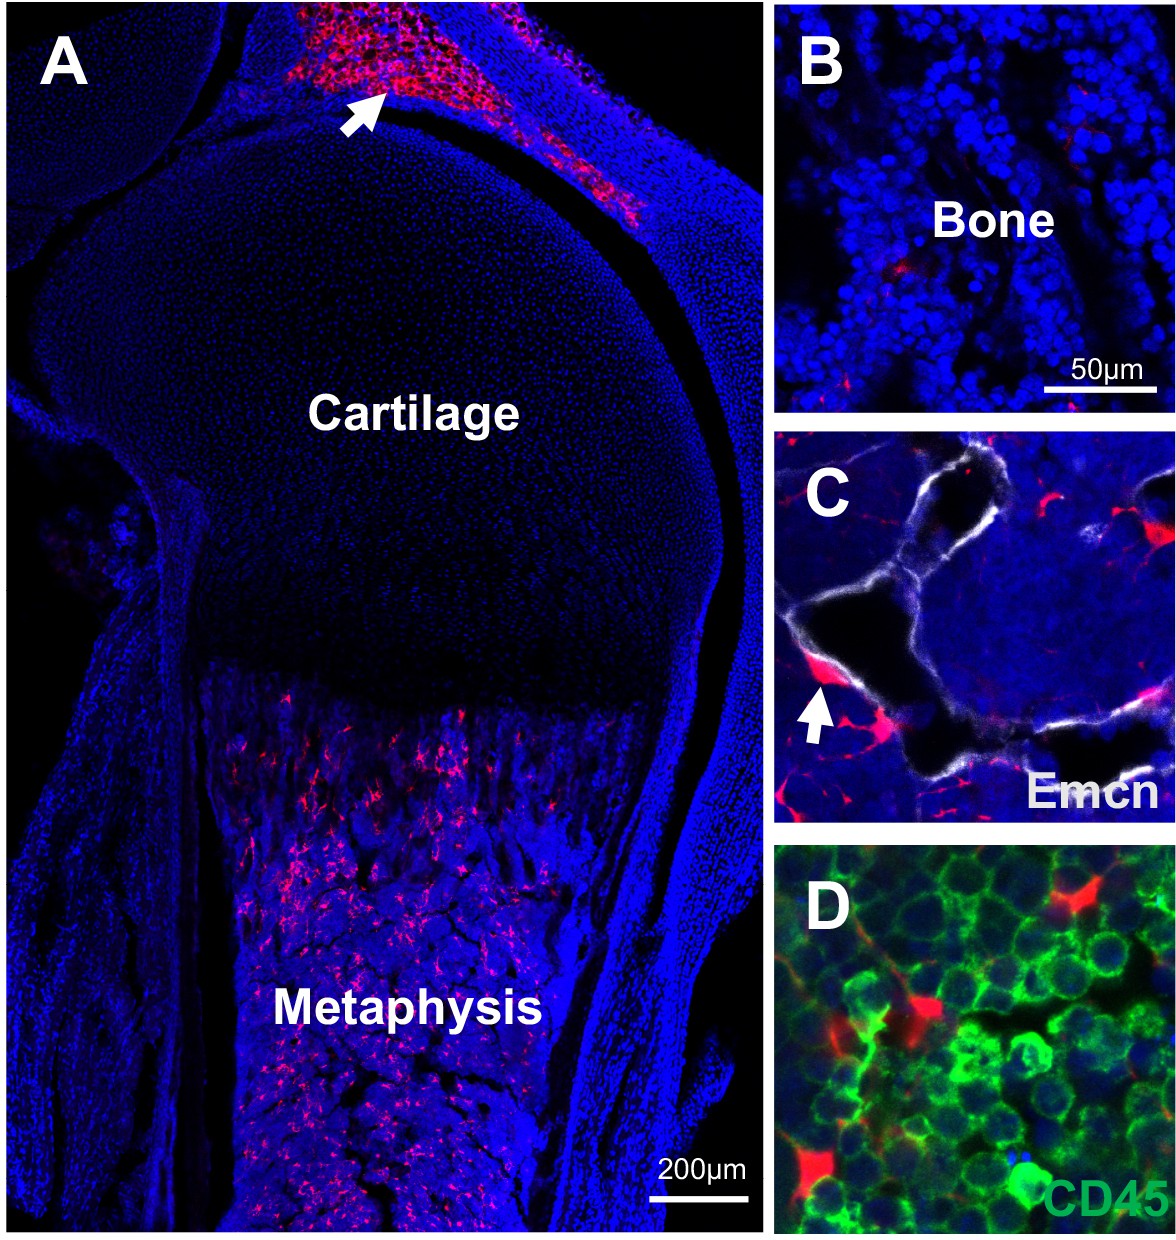
Figure 4 with 4 supplements
Mouse bone marrow contains abundant non-proliferative adipocyte precursors.
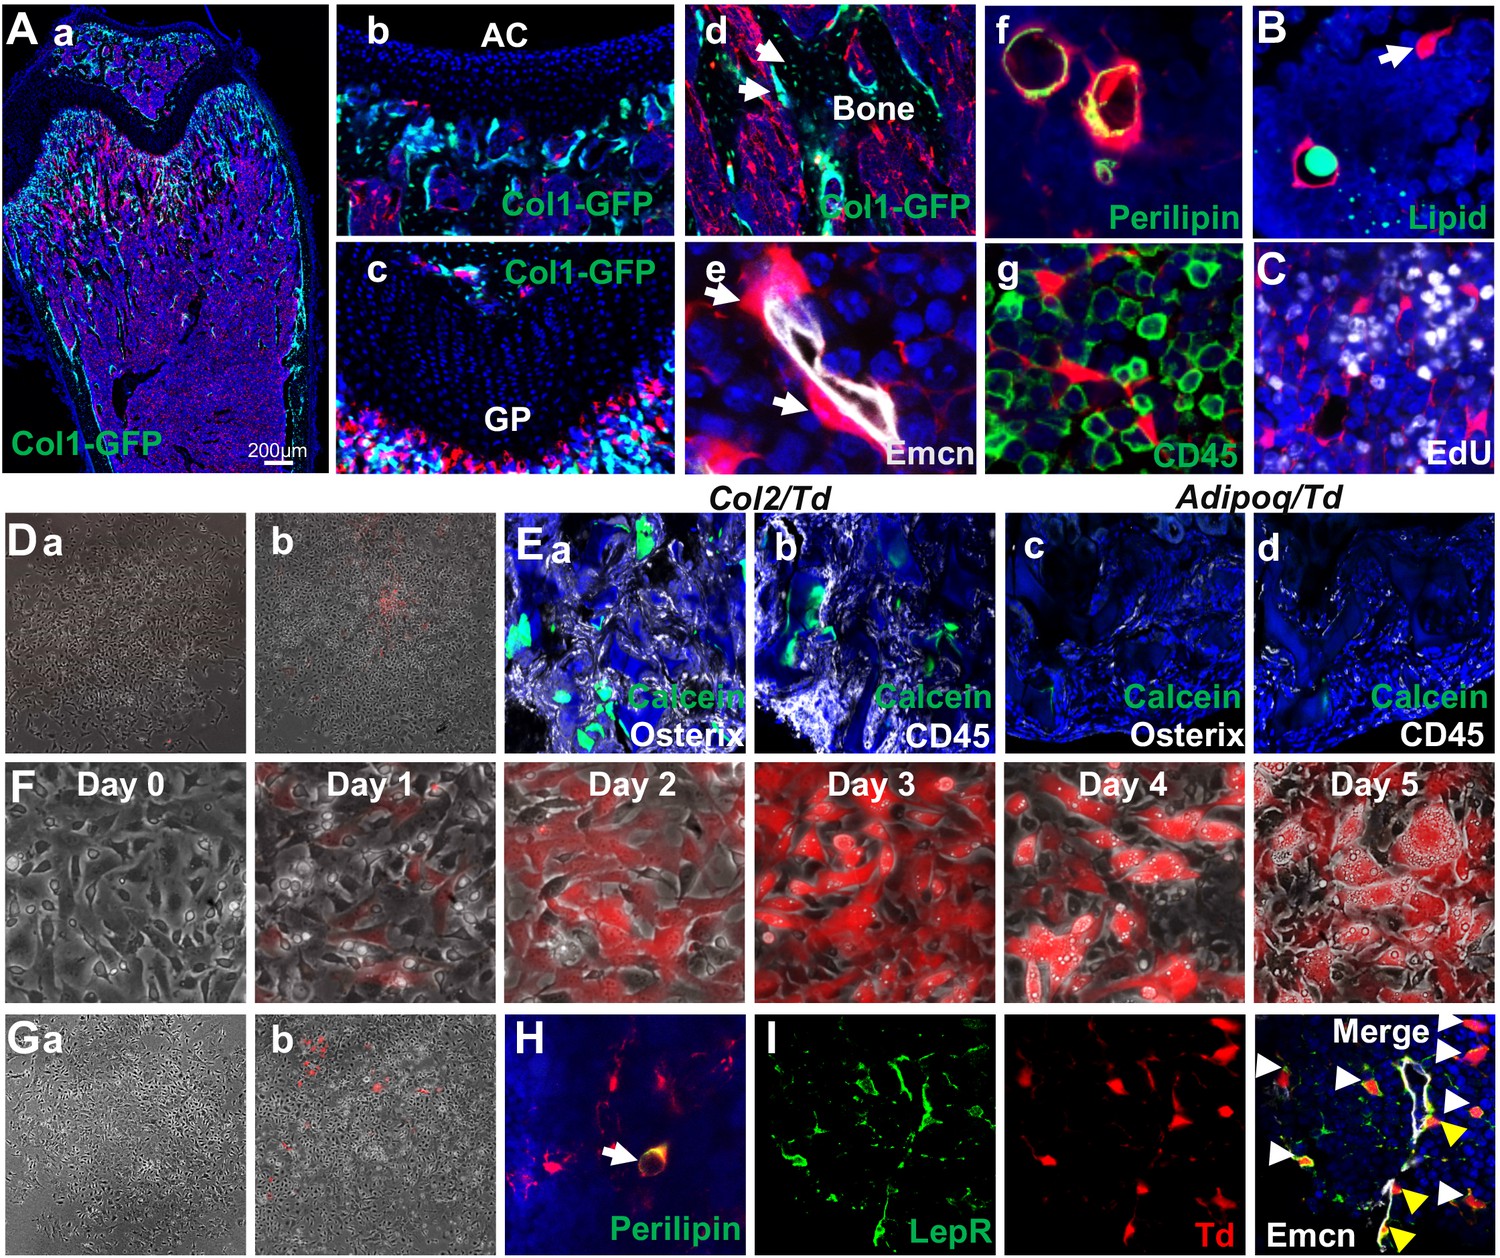
(A) Representative fluorescent images of 1-month-old Adipoq:Td:Col1a1-GFP (a–d) or Adipoq:Td (f–g) femur reveal many bone marrow Td+ cells. (a) A low magnification image of a distal femur. (b–g) At a high magnification, Td does not label chondrocytes in articular cartilage (b) and growth plate (c), osteoblasts and osteocytes (arrows, d) but labels pericytes (arrows, e), Perilipin+ adipocytes (f), and CD45- stromal cells (g). (B) According to BODIPY lipid staining, those Td+ stromal cells in a reticular shape (arrow) have no lipid accumulation. (C) In vivo EdU injection reveals that Td+ cells in Adipoq:Td mice do not proliferate. (D) CFU-F assay of bone marrow cells from Adipoq:Td mice shows that all CFU-F colonies are made of Td- cells (a). (b) Some Td+ cells do attach to the dish but have minimum proliferation ability. n = 5 mice. (E) Endosteal bone marrow Td+ cells from 1-month-old Col2:Td mice (5 out of 5 transplants), but not Adipoq:Td mice (0 out of 3 transplants) form bone-like structure after transplanted under the kidney capsule. Representative fluorescent images of transplants were shown here. Osterix: osteoblasts; CD45: hematopoietic cells; Calcein: new bone surface. (F) In vitro adipogenic differentiation assay demonstrates that non-lipid-laden adipocytes exist as an intermediate state between mesenchymal progenitors and lipid-laden adipocytes. Mesenchymal progenitors, which are Td-, were obtained from culturing endosteal bone marrow cells from 1-month-old Adipoq:Td mice. Upon confluency, cells were cultured in adipogenic differentiation medium. The same area was imaged daily by inverted fluorescence microcopy. (G) CFU-F assay of bone marrow cells from P23 AdipoqER:Td mice (Tamoxifen injections at P14-16) shows that all CFU-F colonies are made of Td- cells (a). (b) Some Td+ cells do attach to the dish but have minimum proliferation ability. n = 3 mice. (H) Immunofluorescence staining shows that Perilipin+bone marrow adipocytes are derived from non-lipid-laden adipocytes in 1-month-old AdipoqER:Td mice (Tamoxifen injections at P6, 7). (I) Representative images of co-localization of Td and Lepr in stromal (white arrows) and pericytes (yellow arrows) in bone marrow of 1-month-old Adipoq:Td mice.
Figure 4—figure supplement 1
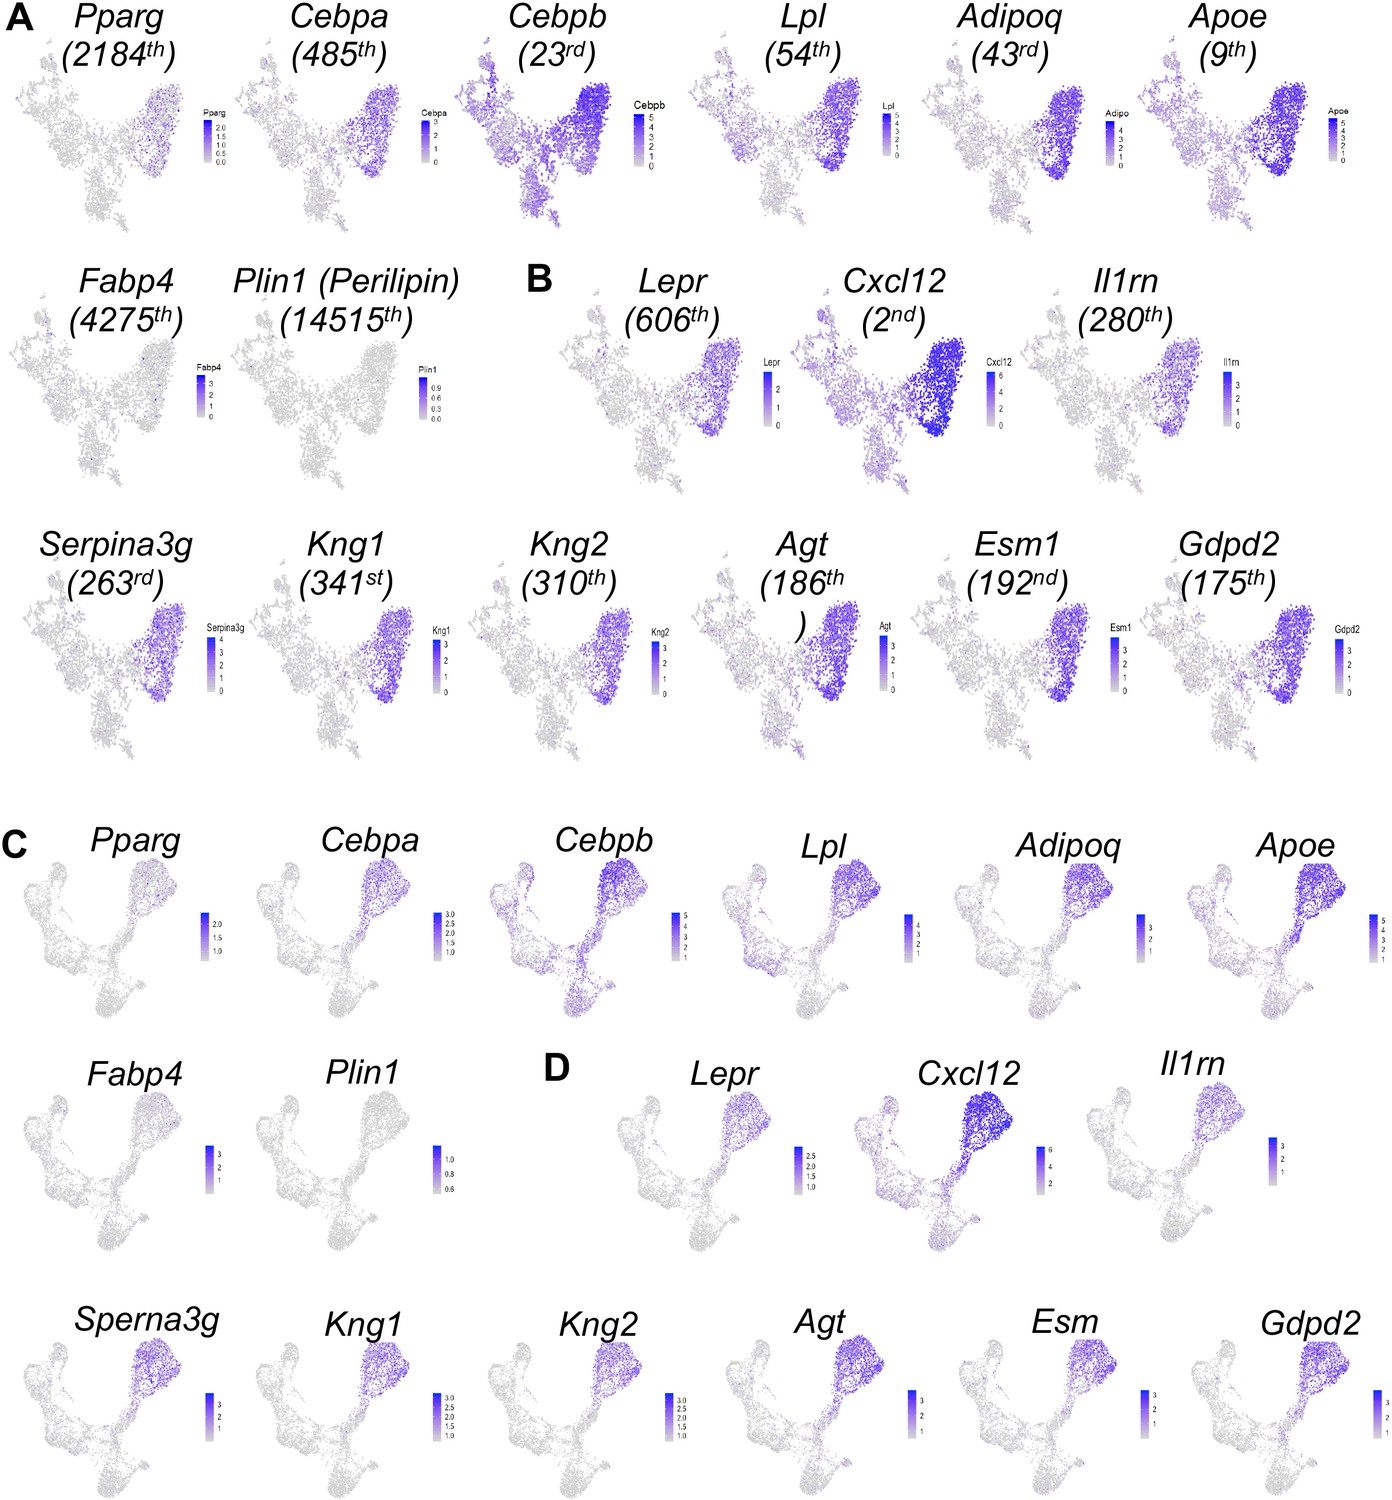
Large scale scRNA-seq data predict a large cluster of adipocytes in the bone marrow of adolescent mice.
(A) The expression patterns of known adipocyte markers in tSNE plots. The number in parenthesis below each gene indicates its rank among all genes based on its expression level in the adipocyte cluster. (B) The expression patterns of predicted markers for the adipocyte cluster in tSNE plots. (C, D) The expression patterns of above markers in UMAP plots.
Figure 4—figure supplement 2
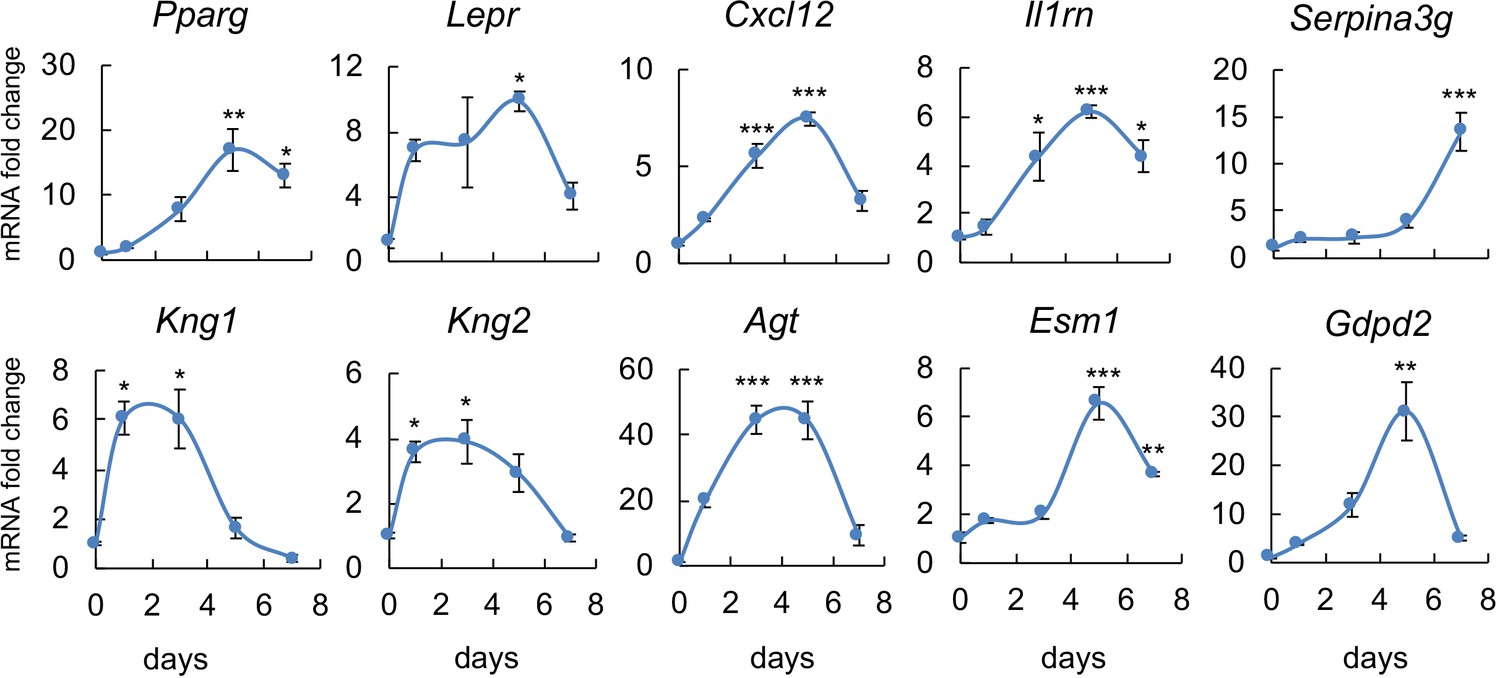
The adipocyte markers predicted by sequencing data are validated by in vitro adipogenic differentiation assay.
Bone marrow mesenchymal progenitors were cultured to confluence and switched to adipogenic differentiation medium. Cells were harvested at indicated time points for qRT-PCR analysis of newly identified marker genes. *: p<0.05; **: p<0.01; ***: p<0.001 compared with day 0.
Figure 4—figure supplement 3
New born Adipoq:Td mice (P5) have abundant Td+ cells in the bone marrow.
(A) Fluorescent image of the proximal tibia at a low magnification. Arrow points to patellar fat pad. (B–D) At a high magnification, it is obvious that Td does not label osteoblasts and osteocytes in trabecular bone (B) but does label pericytes (C, arrow) and CD45- stromal cells (D).
Figure 4—figure supplement 4
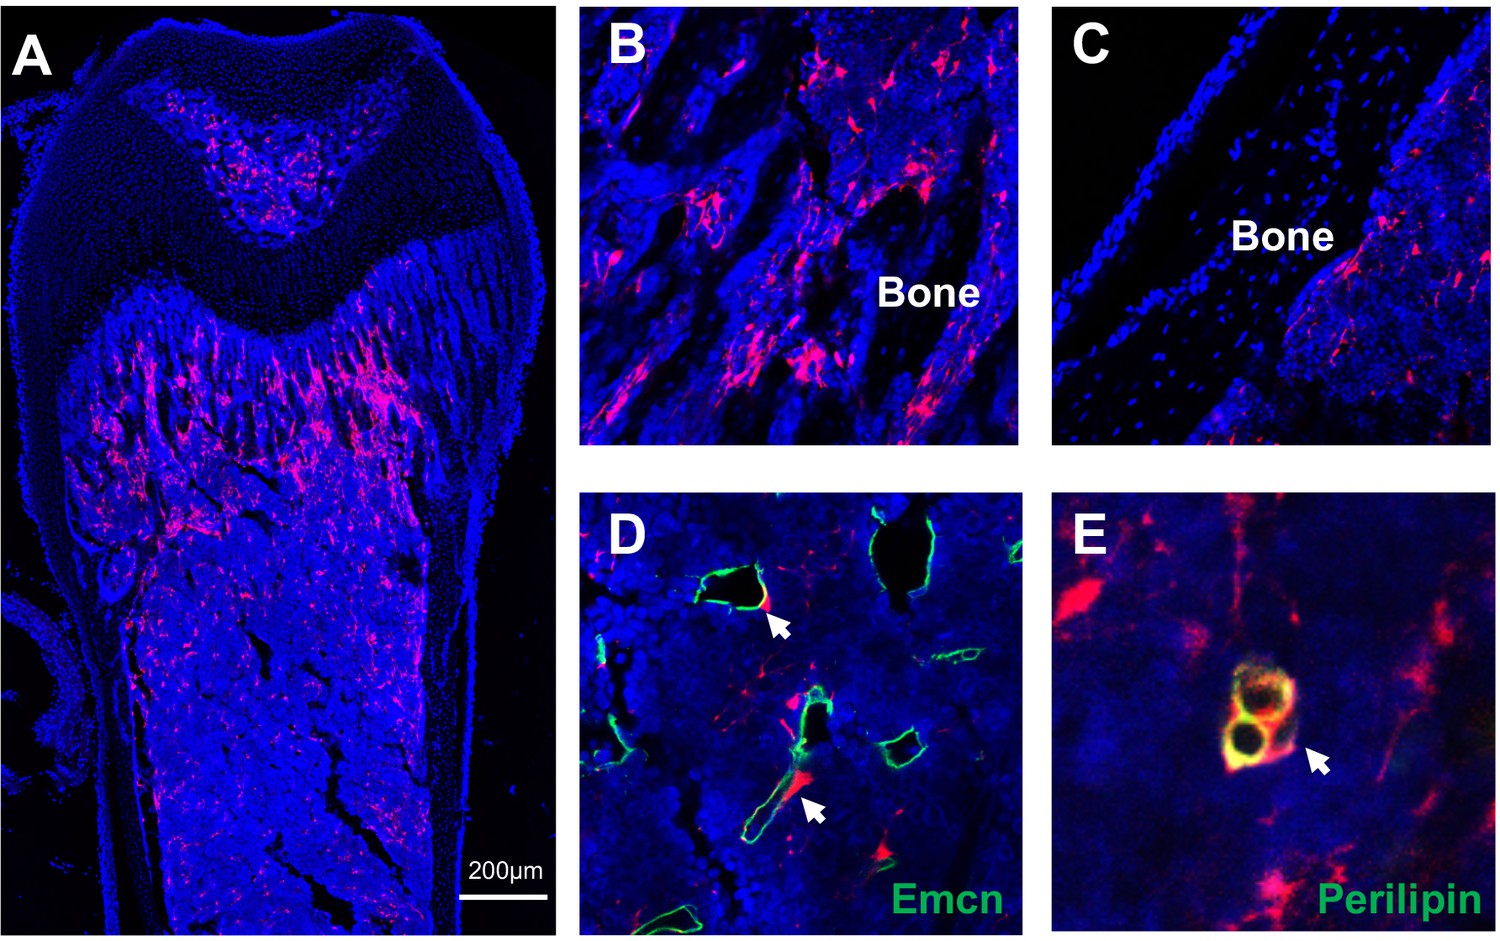
Young AdipoqER:Td mice have abundant Td+ cells in bone marrow.
(A) Low magnification image of a femur from a P23 AdipoqER:Td mouse (Tamoxifen at P14-16) reveals abundant Td+ cells in the bone marrow. Td does not label chondrocytes in articular cartilage and growth plate. (B–E) High magnification images show that Td+ cells are located inside bone marrow (B). Similar to Adipoq:Td mice, Td+ cells in AdipoqER:Td mice are not osteoblasts and osteocytes (C). They are indeed pericytes (arrows, D) and Perilipin+ adipocytes (arrow, E).
Figure 5 with 7 supplements
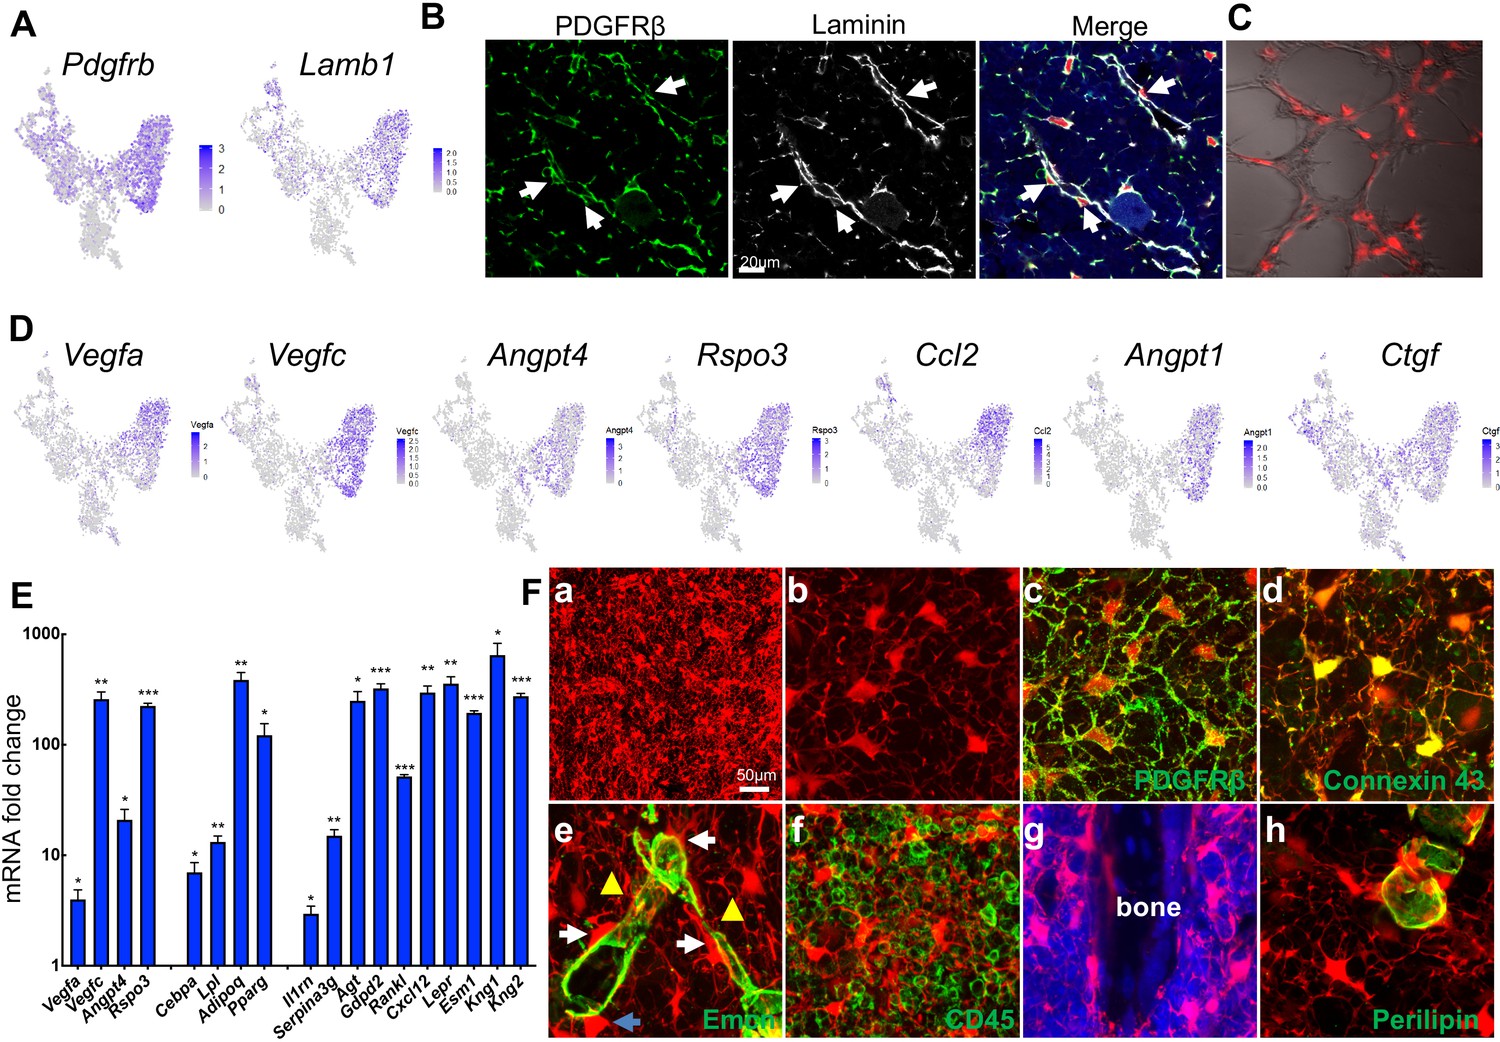
Non-lipid-laden Td+ cells in Adipoq:Td mice form a vast 3D network through their cell processes ubiquitously distributed inside the bone marrow.
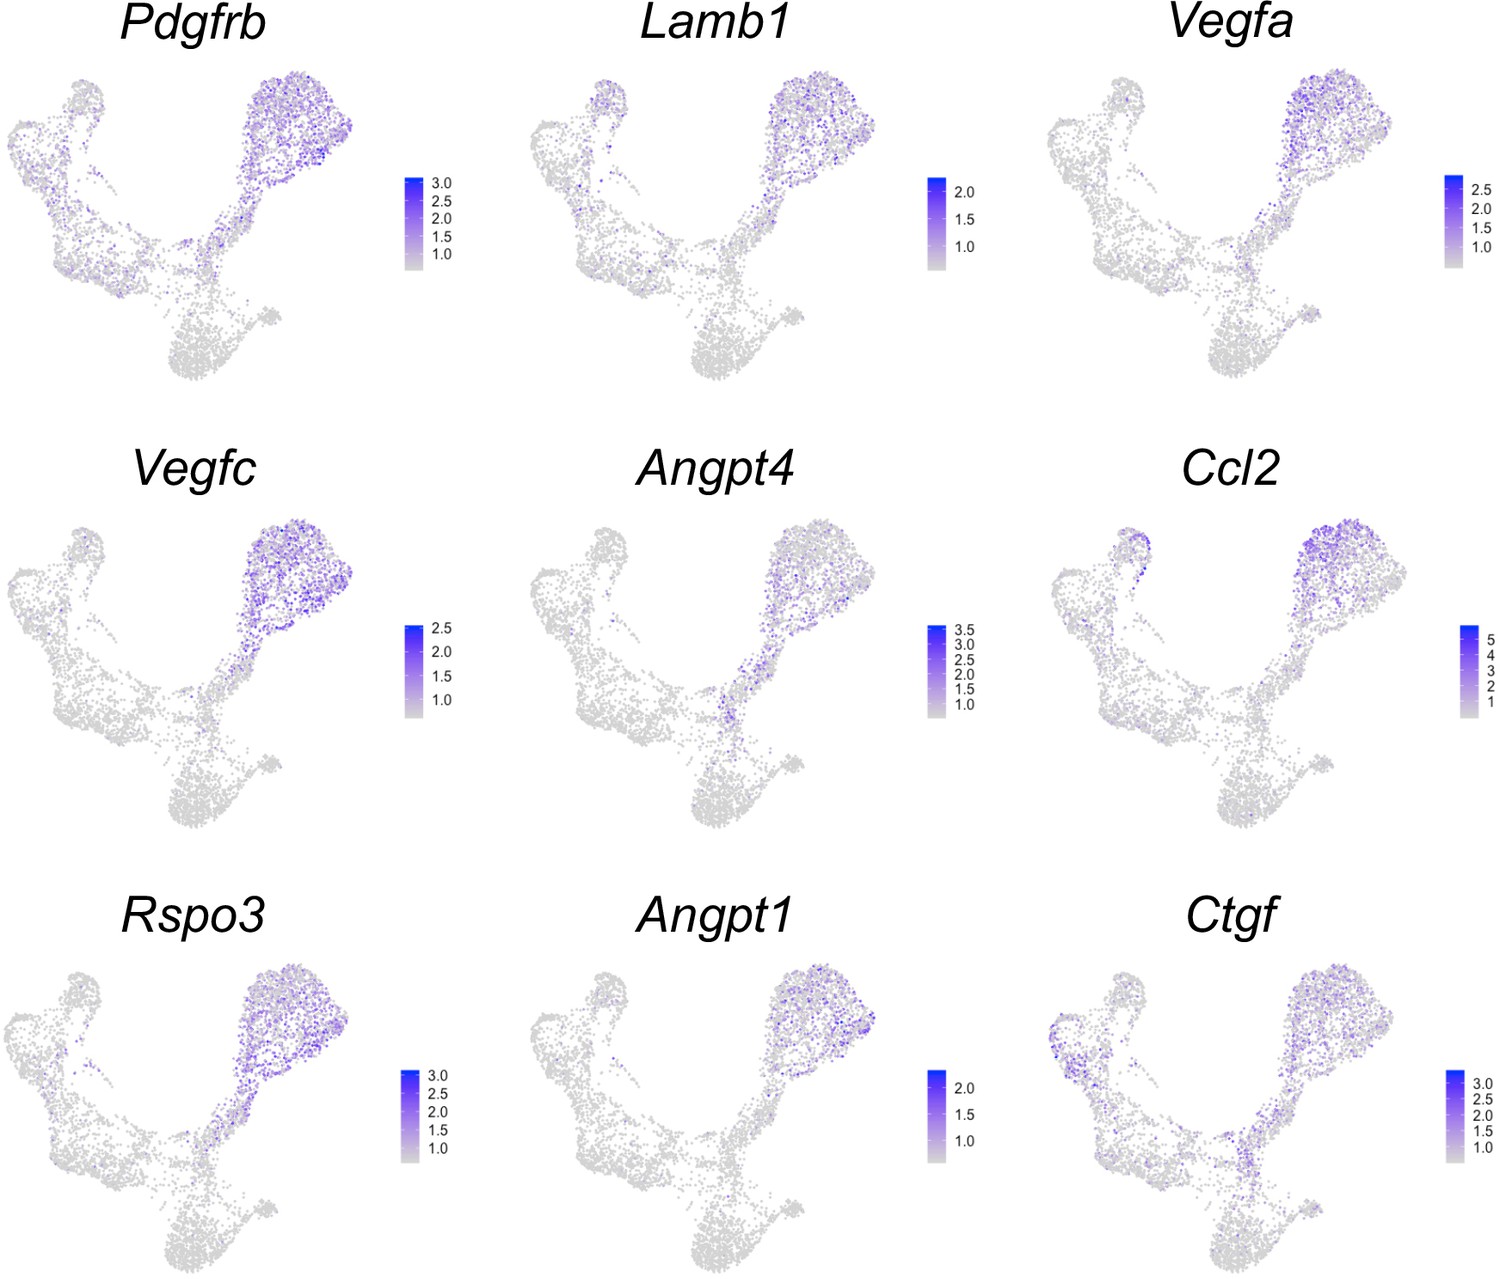
(A) The expression patterns of Pdgfrb and Lamb1 are shown in tSNE plots. (B) Immunofluorescence staining reveals that all PDGFRβ+ and Laminin+ cells with a pericyte morphology are Td+ (pointed by arrows). (C) Td+ cells sorted from Adipoq:Td bone marrow act as pericytes after cocultured with bone marrow endothelial cells undergoing tube formation assay. (D) The expression patterns of angiogenic factors are shown in tSNE plots. (E) qRT-PCR analyses comparing mRNA levels in Td+ versus Td- cells (set as 1) sorted from bone marrow of 1-month-old Adipoq:Td mice confirm that Adipoq-Cre labeled cells highly express angiogenic factors, known adipocyte markers, and novel markers suggested by sequencing data. *: p<0.05; **: p<0.01; ***: p<0.001 Td+ vs Td-, n = 3 mice. (F) A 3D network in bone marrow formed by Td+ stromal cells and pericytes in 1-month-old Adipoq:Td mice. (a) A low magnification image reveals the network of Td+ cells in the femoral bone marrow. (b) Td+ cell bodies and their processes are more obvious in a high magnification image. See Figure 5—video 1 for a 3D structure. (c) Those Td+ cells have PDGFRβ staining all over their cell processes. See Figure 5—video 2 for a 3D structure. (d) They also have punctuated Connexin 43 staining in their process, indicating cell-cell communication. See Figure 5—video 3 for a 3D structure. (e) Td+ pericytes have cell processes. Some processes protrude into bone marrow just like those of Td+ stromal cells and some of them wrap around the vessel wall. Similarly, Td+ stromal cells also extend their processes toward vessels either wrapping around the vessel wall (yellow triangles) or contacting the processes from pericytes. White arrows point to cells with a typical pericyte morphology. A blue arrow points to a Td+ cell sitting on a vessel with a stromal cell shape. Therefore, considering the presence of cell processes and connections, Td+ stromal cells and pericytes are indeed very similar. See Figure 5—video 4 for a 3D structure. (f) Cell processes from Td+ cells touch almost every CD45+ hematopoietic cells inside bone marrow. (g) They also reach trabecular bone surface. (h) On the contrary, most cell surface of Perilipin+Td+ adipocytes are smooth and round. See Figure 5—video 5 for a 3D structure.
-
Figure 5—source data 1
Raw data for Figure 5E.
- https://cdn.elifesciences.org/articles/54695/elife-54695-fig5-data1-v3.xlsx
Figure 5—figure supplement 1
The expression patterns of pericyte markers and angiogenesis factors in UMAP plots.
Figure 5—figure supplement 2
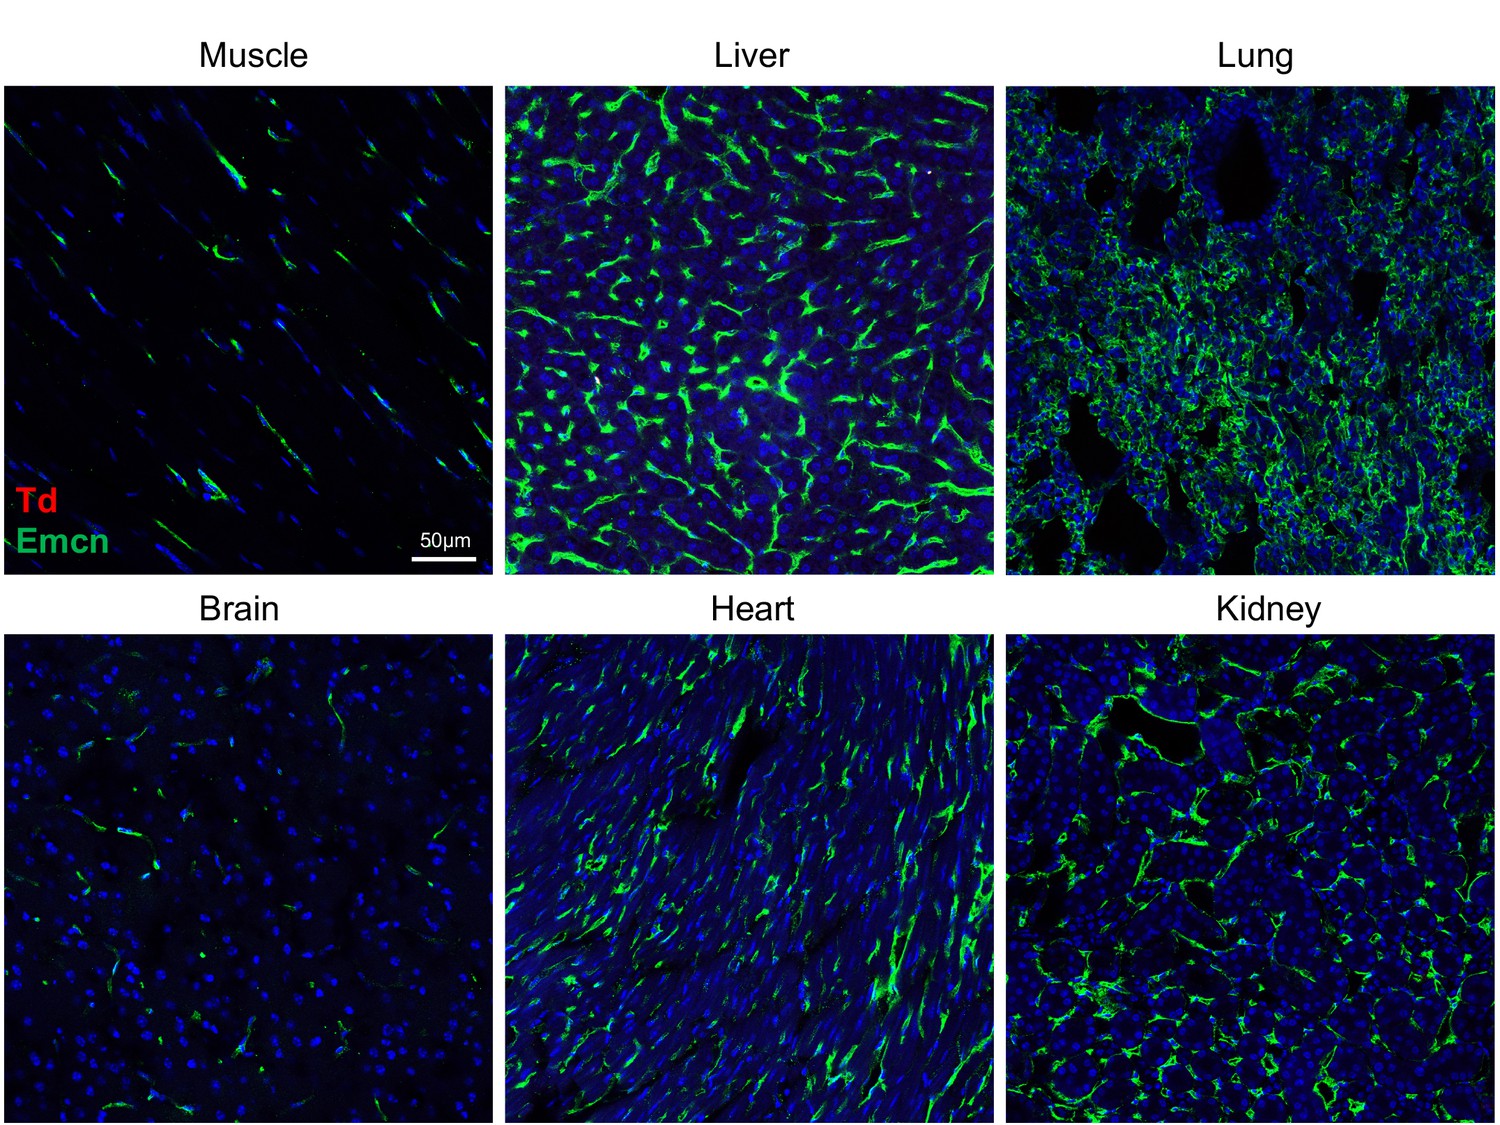
Td+ pericytes are unique to the bone marrow of Adipoq:Td mice.
Td+ pericytes are not detected in muscle, liver, lung, brain, heart, and kidney of 1-month-old Adipoq/Td mice. Emcn: Endomucin. n = 3 mice.
Figure 5—video 1
Confocal fluorescence image of Td+ cells in bone marrow of Adipoq:Td mice to show its 3D network structure made of cell processes protruding from cell bodies.
Scan depth: 50 μm.
Figure 5—video 2
Confocal fluorescence image of Td+ cells with PDGFRβ staining (green) in bone marrow of Adipoq:Td mice.
Scan depth: 50 μm.
Figure 5—video 3
Confocal fluorescence image of Td+ cells with Connexin 43 staining (green, shown as dots on cell processes) in bone marrow of Adipoq:Td mice.
Scan depth: 50 μm.
Figure 5—video 4
Confocal fluorescence image of Td+ cells with Emcn staining (green, vessel) in bone marrow of Adipoq:Td mice.
Scan depth: 50 μm.
Figure 5—video 5
Confocal fluorescence image of Td+ cells with Perilipin staining (green) in bone marrow of Adipoq:Td mice.
Large yellow circles are lipid-laden adipocytes. Scan depth: 50 μm.
Figure 6
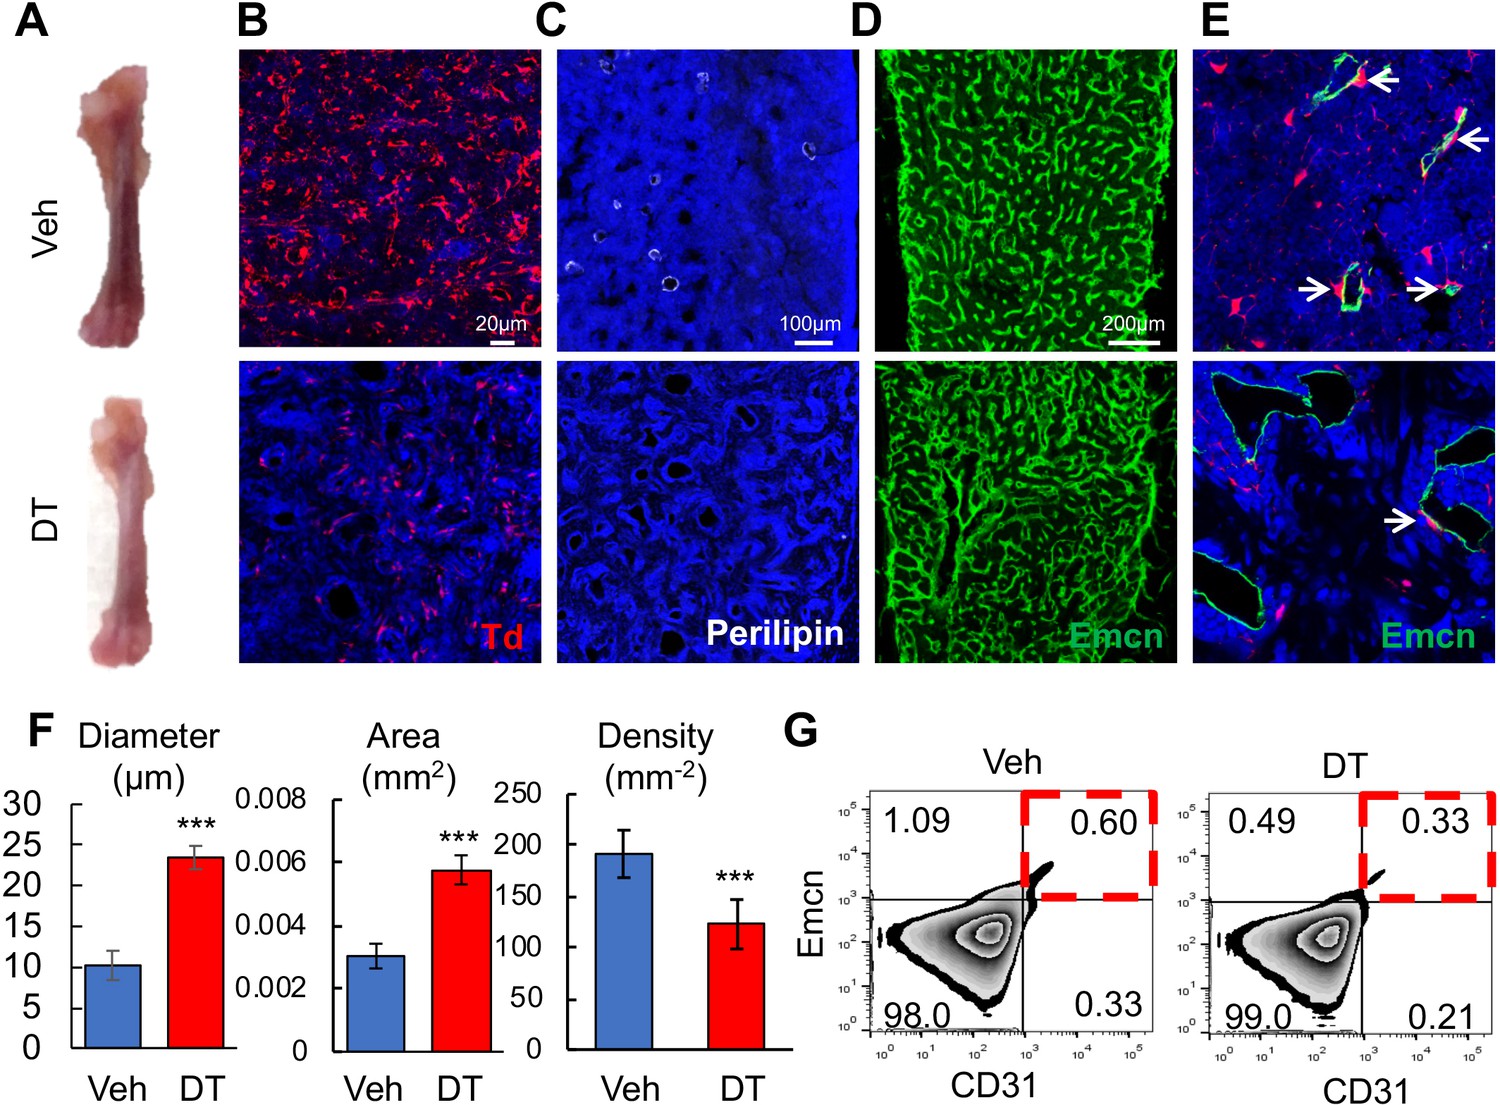
Bone marrow Adipoq+ cells are critical for supporting marrow vasculature.
(A) Ablation of Adipoq-Cre labeled cells changes the color of long bones from red to pink. One-month-old Adipoq:Td:DTR mice received either veh or DT injections (50 μg/kg) every other day for 2 weeks and long bones were harvested for analysis. (B) Inside the long bone, Td+ cells were significantly reduced by DT injections. (C) Perilipin+ adipocytes were also diminished by DT injections. (D) Fluorescent images of vessel staining in femur at a low magnification revealed abnormal bone marrow vessel structure after DT injections. (E) Fluorescent images of vessel staining in femur at a high magnification showed that vessels were dilated coinciding with the depletion of Td+ pericytes (arrows) after DT injections. (F) Vessel diameter, area, and density are quantified in the central bone marrow. n = 3 mice. ***: p<0.001 DT vs veh. (G) Flow cytometric analysis of endothelial cells (Emcn+CD31+) in bone marrow after DT injections.
-
Figure 6—source data 1
Raw data for Figure 6F.
- https://cdn.elifesciences.org/articles/54695/elife-54695-fig6-data1-v3.xlsx
Figure 7 with 3 supplements
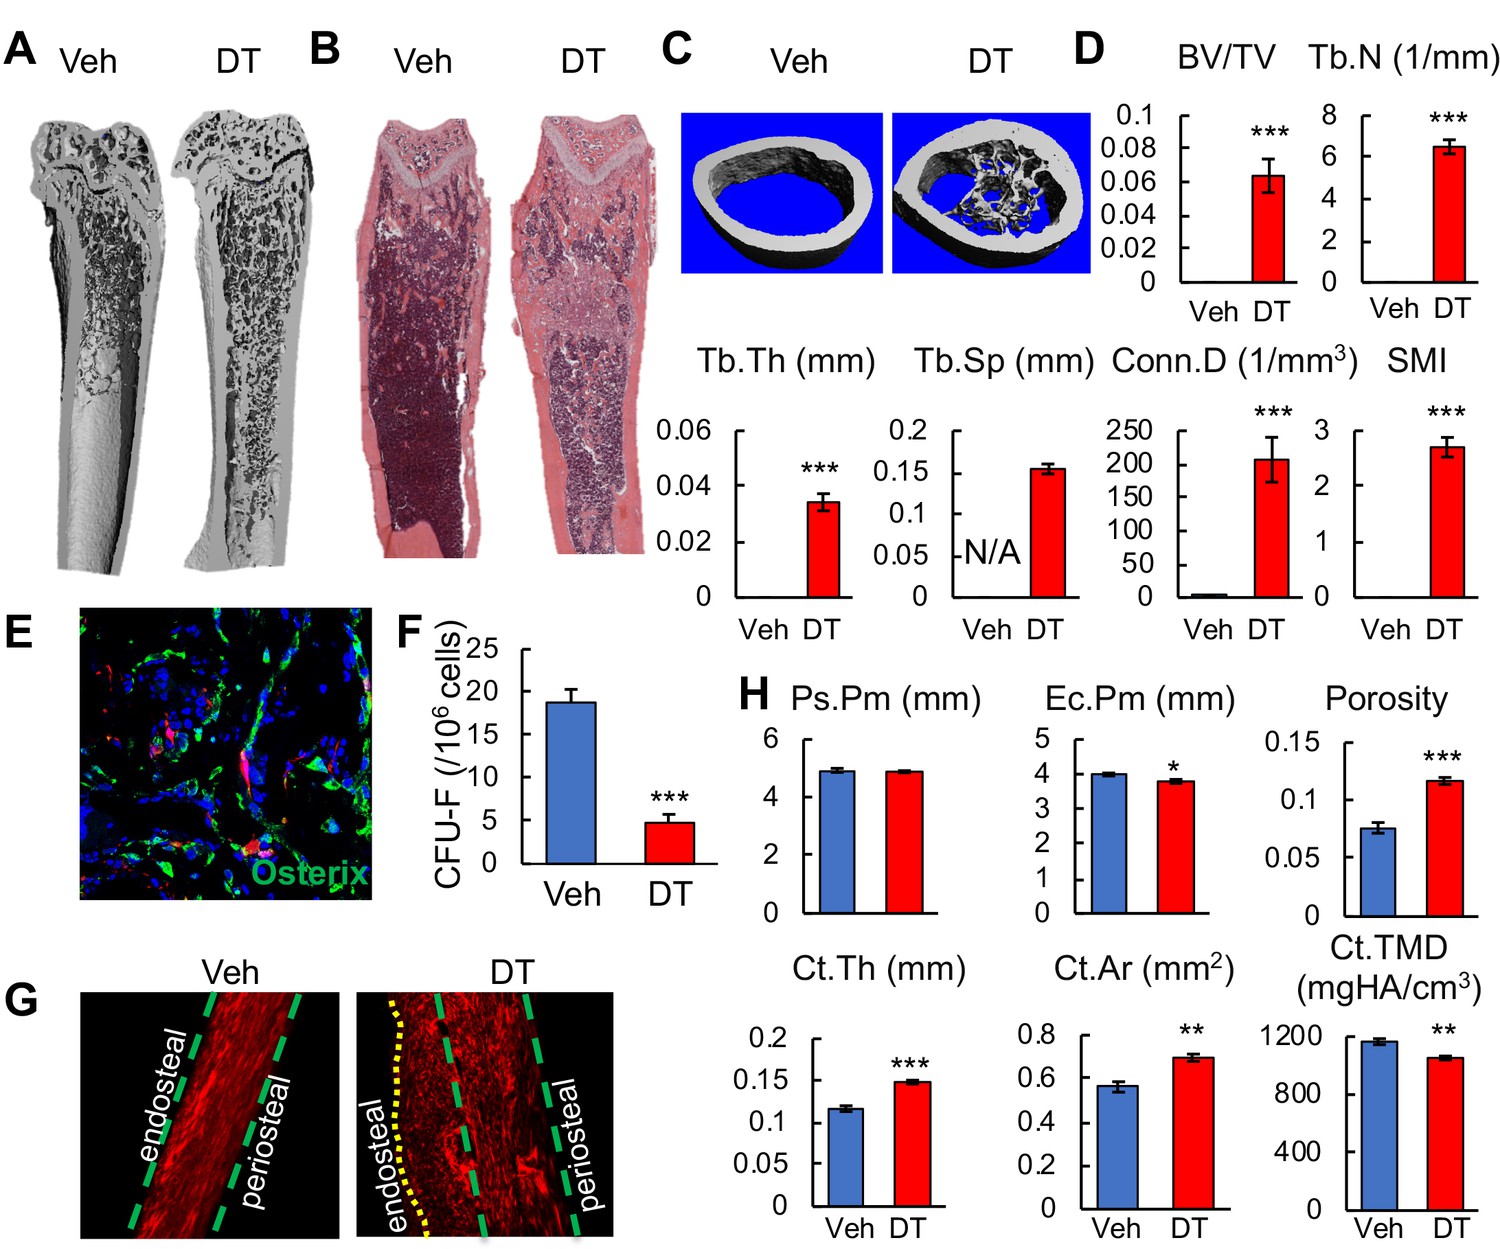
Bone marrow Adipoq+ cells inhibit bone formation.
(A) 3D μCT images of Adipoq:Td:DTR femurs reveal drastic de novo bone formation in the midshaft region after 2 weeks of DT injections. (B) H and E staining of femoral sections. (C) 3D reconstructed microCT images of femoral midshaft region. (D) MicroCT measurement of trabecular bone structural parameters from the midshaft region. BV/TV: bone volume fraction; Tb.N: trabecular number; Tb.Th: trabecular thickness; Tb.Sp: trabecular separation; Conn.D: connective density; SMI: structural model index. n = 6 mice/group. *: p<0.05; ***: p<0.001 DT vs veh. (E) Fluorescent image shows that newly formed osteoblasts (Osterix+ cells) in the diaphyseal bone marrow are Td- cells. (F) CFU assay demonstrates a decrease in mesenchymal progenitors in Adipoq:Td:DTR femurs after DT injections. n = 3 mice/group. ***: p<0.001 DT vs veh. (G) Second harmonic generation images of femoral sections reveal that collagen fibers in the newly formed bone on the endocortical surface are mostly misaligned in Adipoq:Td:DTR mice after DT injections. (H) MicroCT measurement of cortical bone structural parameters from the midshaft region. Ps.Pm: periosteal perimeter; Ec.Pm: endosteal perimeter; Ct.Th: cortical thickness; Ct.Ar: cortical area; Ct.TMD: cortical tissue mineral density. n = 6 mice/group. *: p<0.05; **: p<0.01; ***: p<0.001 DT vs veh.
-
Figure 7—source data 1
Raw data for Figure 7D.
- https://cdn.elifesciences.org/articles/54695/elife-54695-fig7-data1-v3.xlsx
-
Figure 7—source data 2
Raw data for Figure 7H.
- https://cdn.elifesciences.org/articles/54695/elife-54695-fig7-data2-v3.xlsx
Figure 7—figure supplement 1
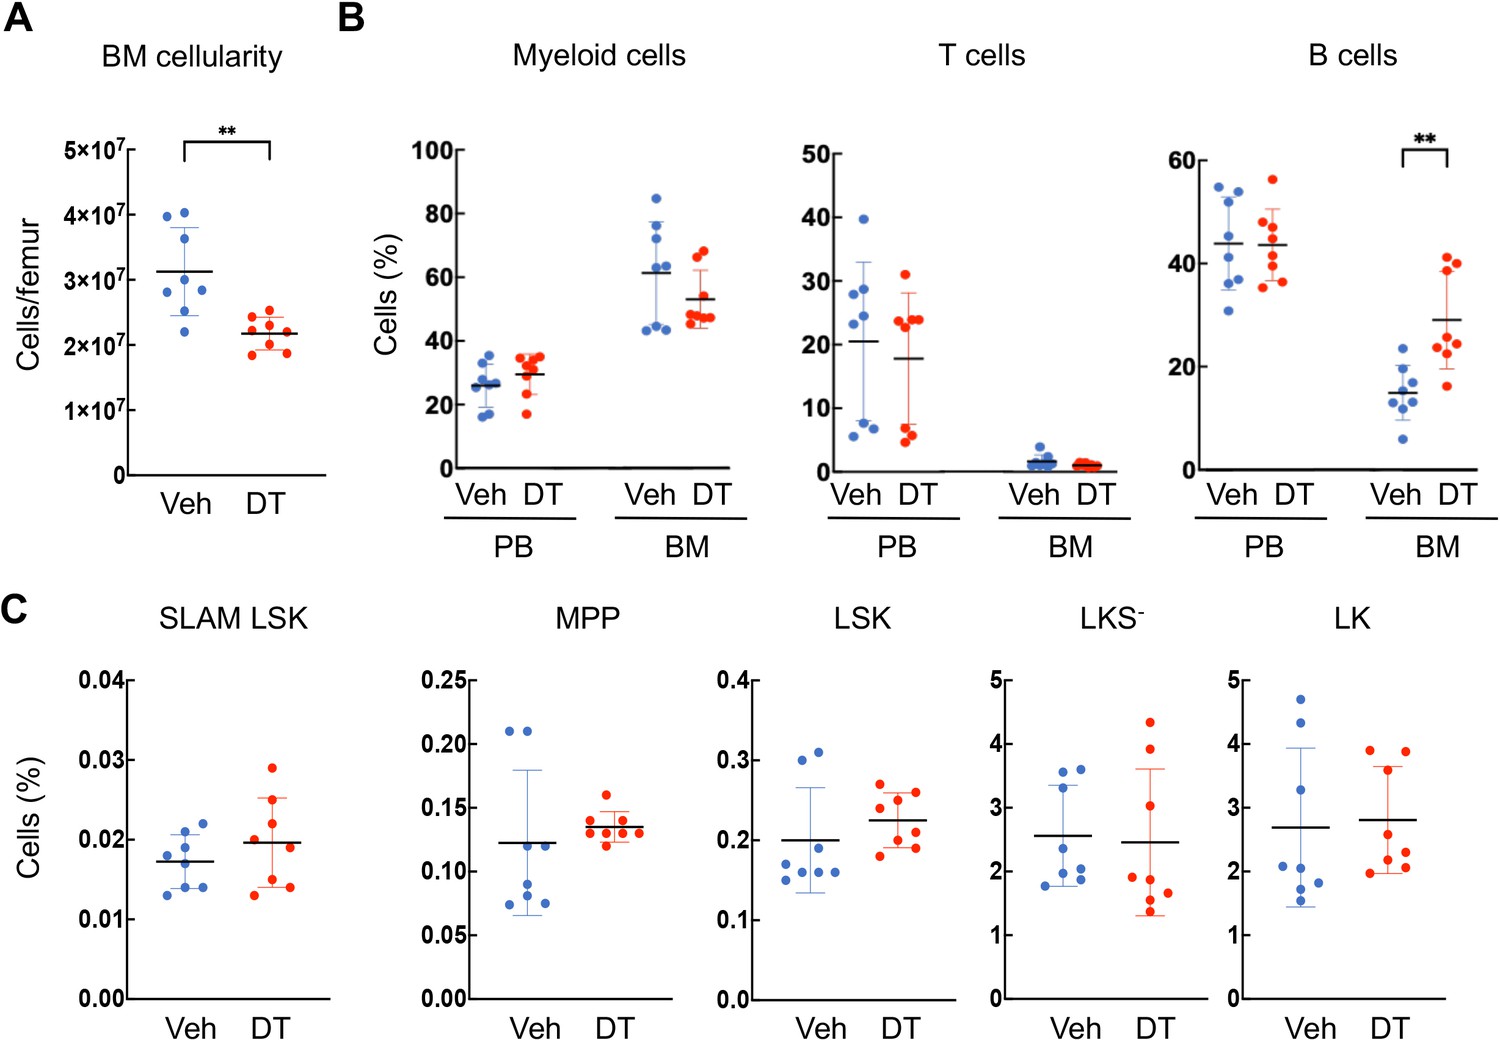
Ablation of Adipoq+ cells reduces overall bone marrow (BM) cellularity but has little effect on hematopoietic cells.
(A) 2 weeks of DT injections significantly reduce femoral BM cellularity in 1-month-old Adipoq:Td:DTR mice. (B) Peripheral blood (PB) and BM frequency of hematopoietic lineage cells were assessed by flow cytometry. (C) Bone marrow frequency of various hematopoietic stem and progenitor cell compartments were assessed by flow cytometry using SLAM marker scheme. Hematopoietic stem cell (SLAM LSK): Lin-Sca1+cKit+CD48-CD150+; Multipotent progenitor (MPP): Lin-Sca1+cKit+CD48+CD150-. LSK: Lin-Sca1+cKit+; LKS-: Lin-Sca1-cKit+; LK: Lin-cKit+. Each symbol represents an individual mouse. Horizontal lines represent the mean and vertical bars indicate the SD. **: p<0.01 DT vs veh.
Figure 7—figure supplement 2
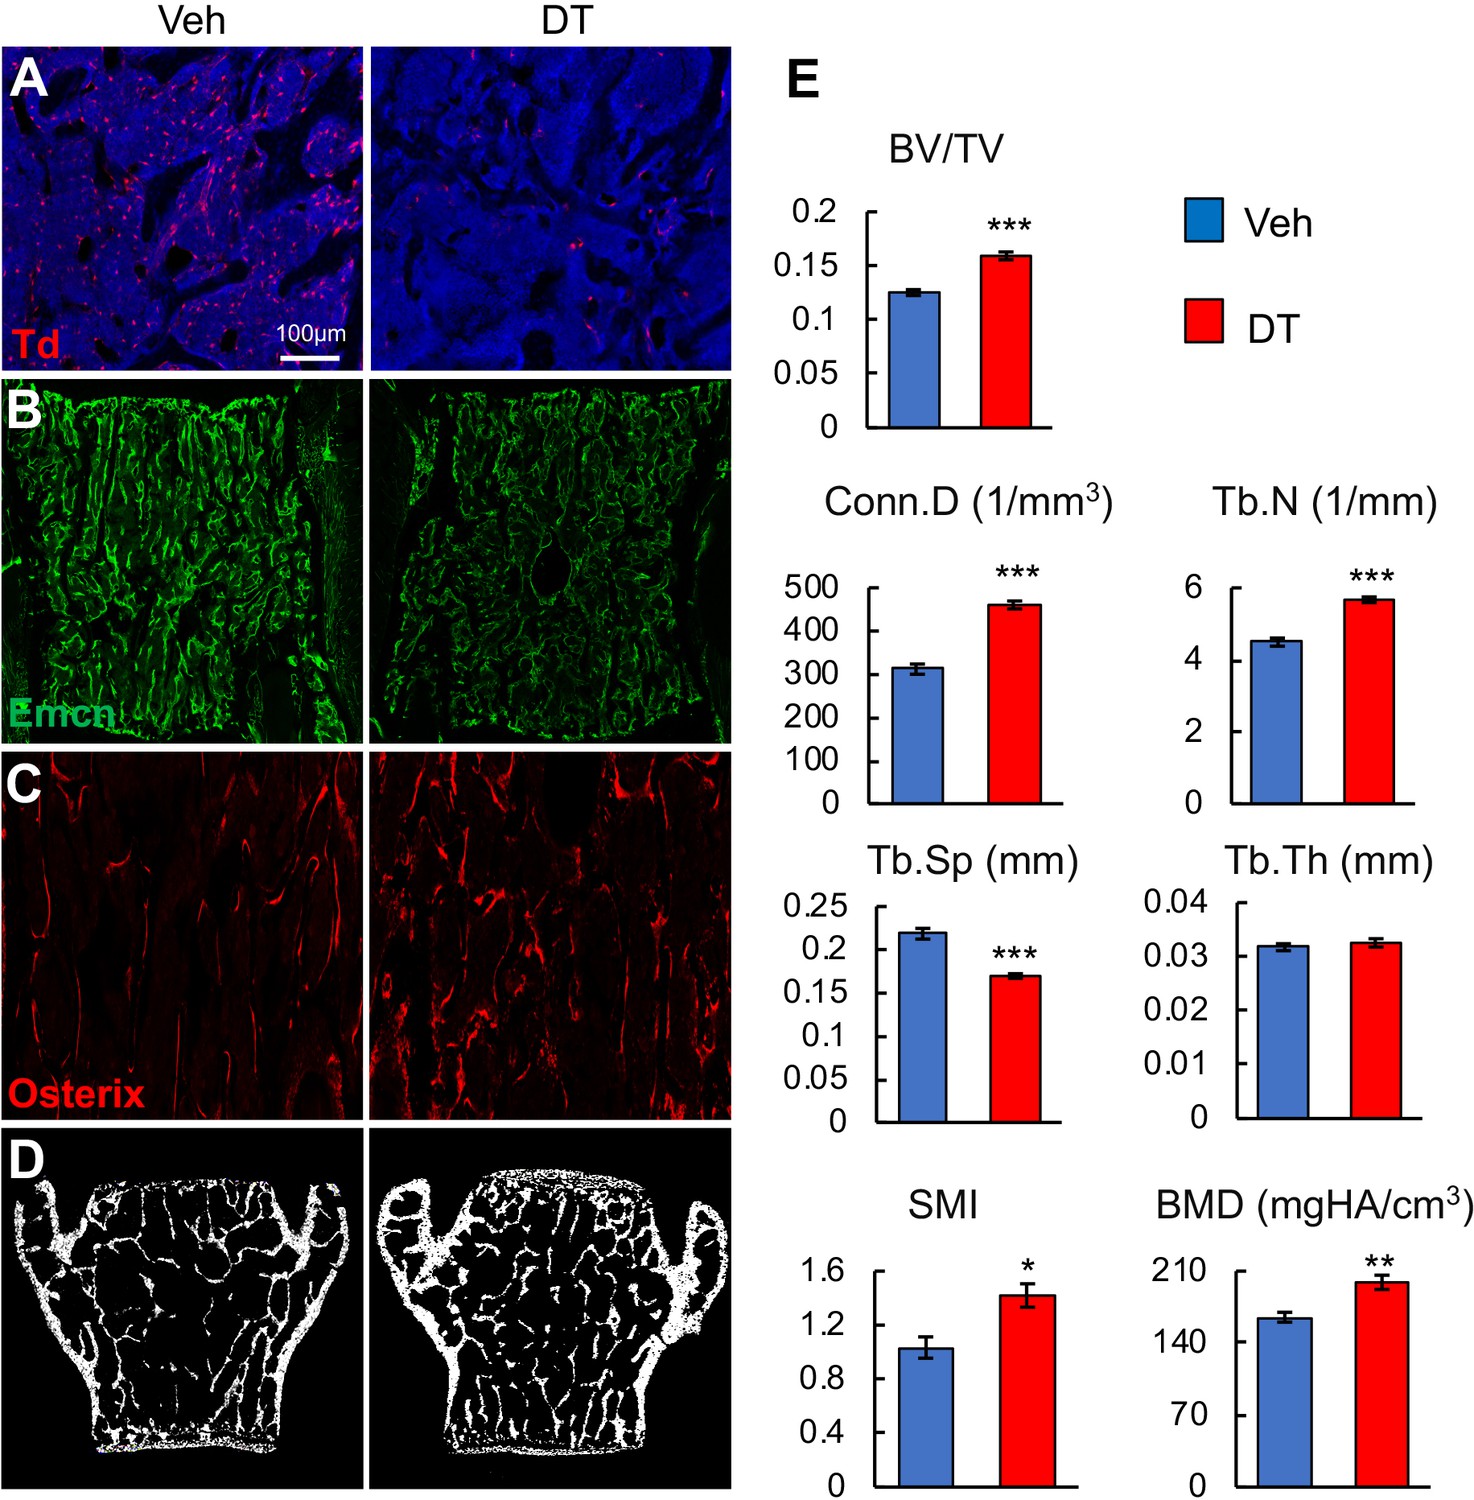
Ablation of Adipoq+ cells increases trabecular bone mass in vertebrae.
(A) 2 weeks of DT injections significantly reduce the number of bone marrow Td+ cells in vertebrae of 1-month-old Adipoq:Td:DTR mice. (B) Vessel staining reveals that DT injections alter vessel structure and integrity in the vertebral bone marrow of Adipoq:Td:DTR mice. (C) Osterix staining suggests more bone forming cells after cell ablation. (D) Representative microCT images of vertebral bone. (E) MicroCT measurement of trabecular bone structural parameters in vertebrae. n = 6 mice/group. BV/TV: bone volume fraction; Tb.N: trabecular number; Tb.Th: trabecular thickness; Tb.Sp: trabecular separation; Conn.D: connective density; SMI: structural model index. BMD: bone mineral density. *: p<0.05; **: p<0.01; ***: p<0.001 DT vs veh.
Figure 7—figure supplement 3
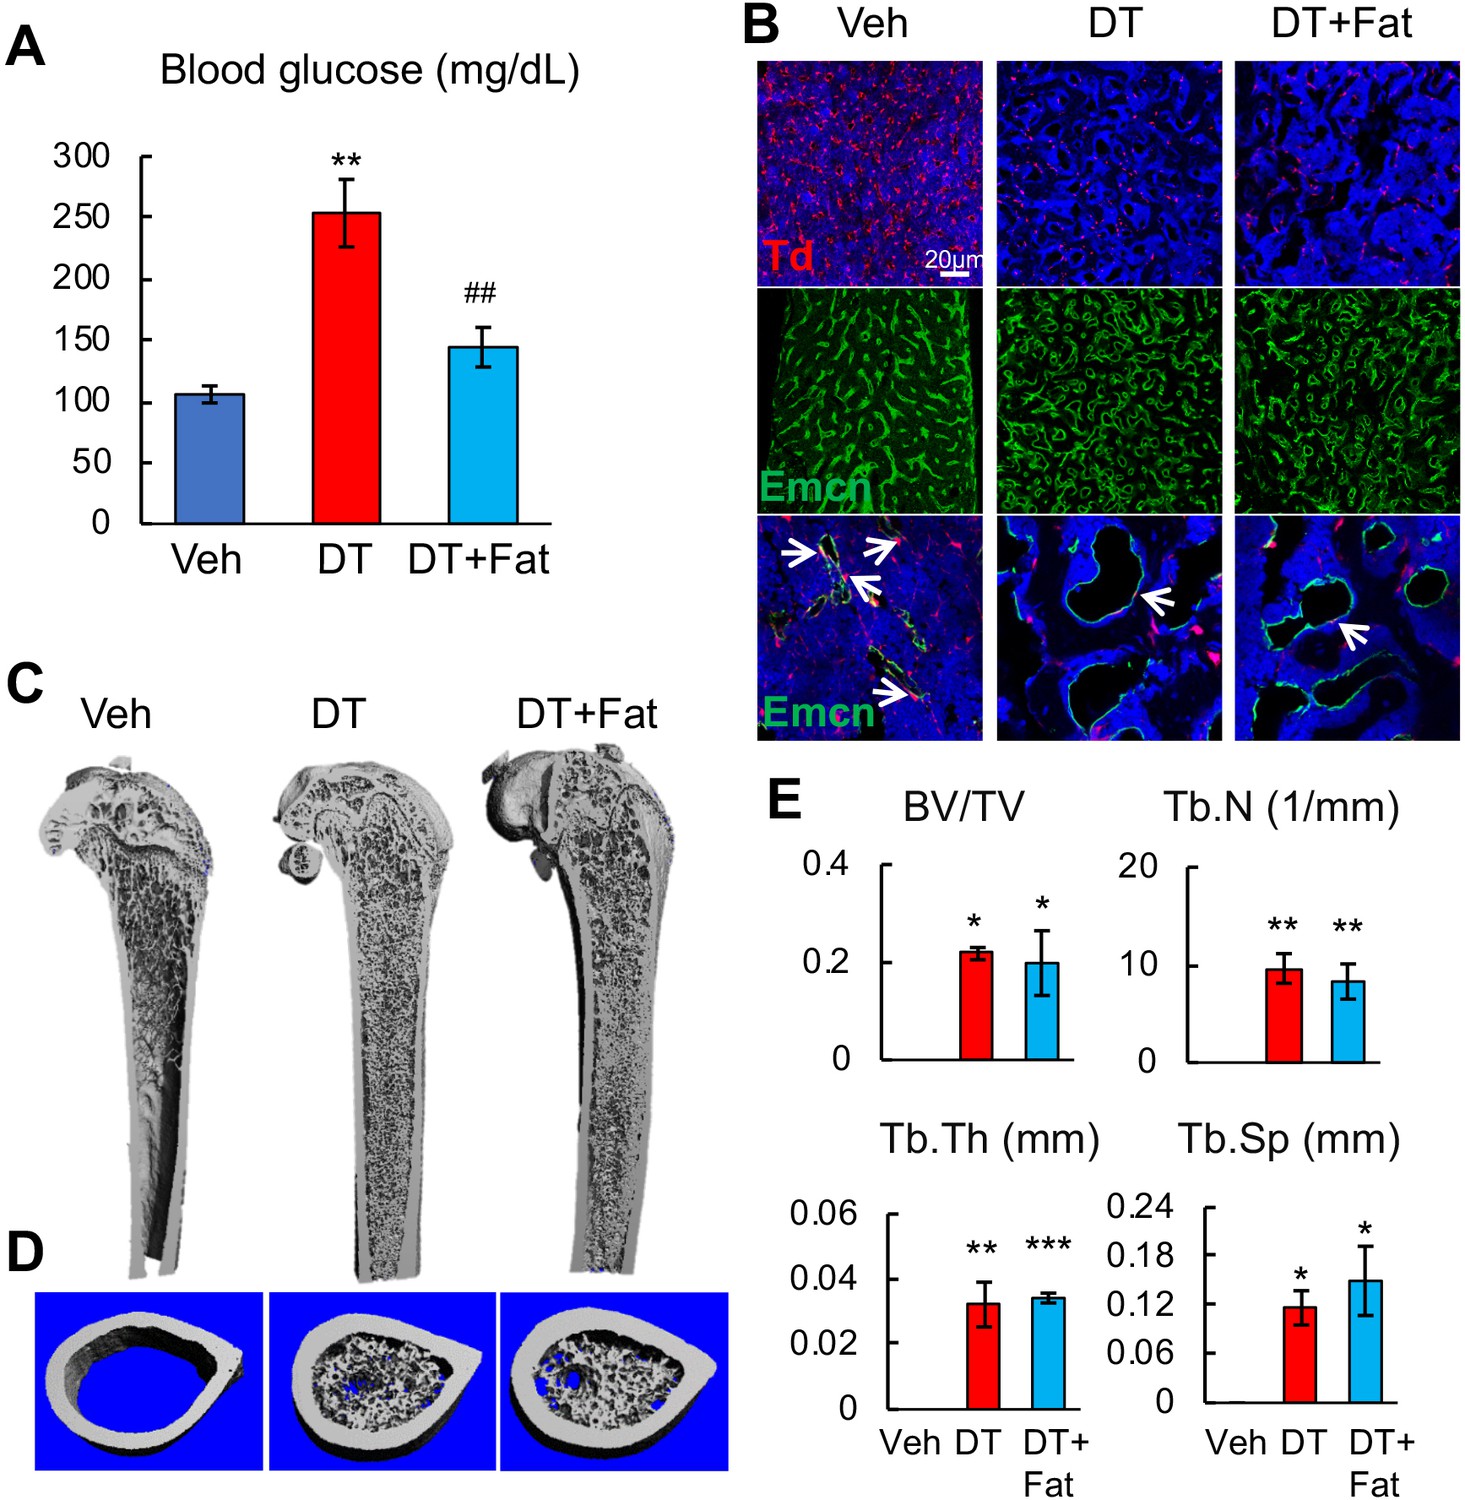
Fat transplantation does not rescue bone phenotypes induced by ablation of Adipoq+ cells.
(A) Blood glucose level was measured in Adipoq:Td:DTR mice received vehicle injections (veh group), DT injections (DT group), and DT injections after fat transplantation (DT+Fat group). n = 3 mice/group. **: p<0.01 DT vs veh, ##: p<0.01 DT+Fat vs DT. (B) Fat transplantation does not reverse DT-induced vessel damage in bone marrow. Top panel: fluorescent images of Td+ cells in femurs. Middle panel: fluorescent images of vessel staining at a low magnification. Bottom panel: fluorescent images of vessel staining at a high magnification. Arrows point to Td+ pericytes. (C) 3D μCT images of Adipoq;Td:DTR femurs reveal that fat transplantation does not block de novo bone formation in the midshaft region induced by DT injections. (D) 3D reconstructed microCT images of femoral midshaft region. (E) MicroCT measurement of trabecular bone structural parameters in femoral midshaft region. n = 3 mice/group. BV/TV: bone volume fraction; Tb.N: trabecular number; Tb.Th: trabecular thickness; Tb.Sp: trabecular separation. *: p<0.05; **: p<0.01; ***: p<0.001 vs veh.
Figure 8 with 2 supplements
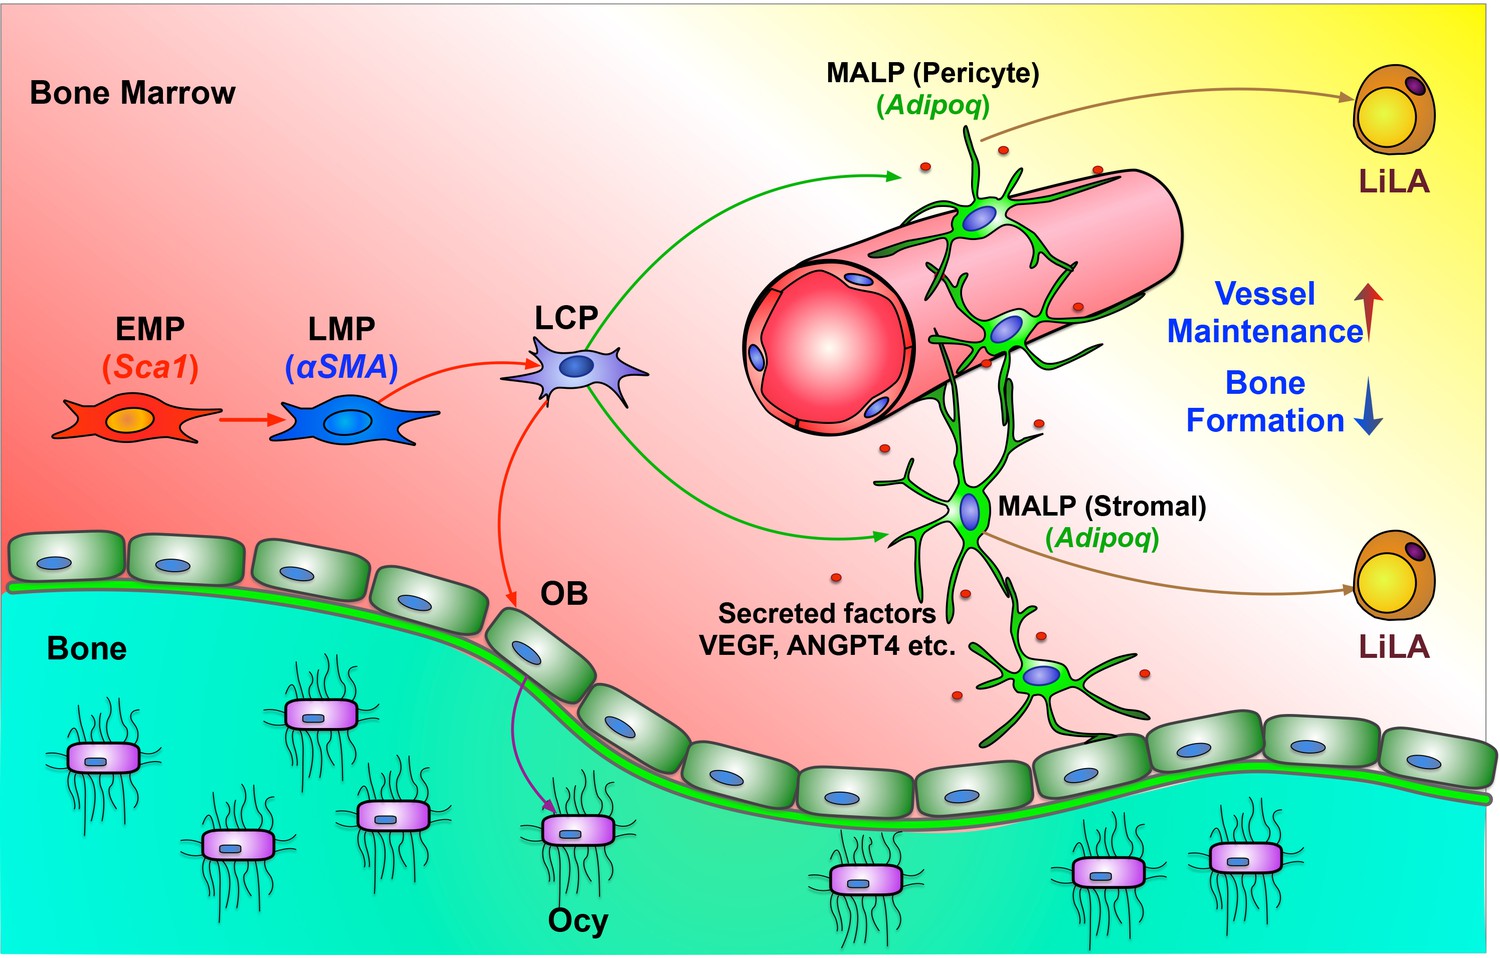
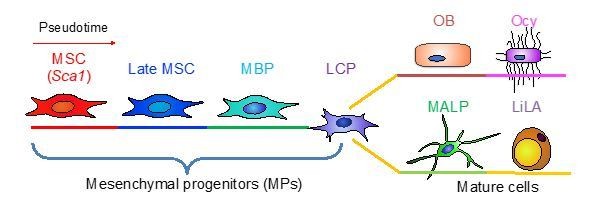
A schematic diagram depicts a model of bone marrow mesenchymal lineage cells and the role of MALPs.
OB: osteoblast; Ocy: osteocyte; EMP: early mesenchymal progenitor; LMP: late mesenchymal progenitor; LCP: lineage committed progenitors; MALPs: marrow adipogenic lineage precursors; LiLA: lipid-laden adipocytes.
Figure 8—figure supplement 1
A comparison of large scale scRNA-seq data of bone marrow mesenchymal lineage cells between our group (Zhong et al.) and Tikhonova et al. that was recently published (Tikhonova et al., 2019).
An alternative annotation of cell clusters based on our data is indicated by red in parentheses below Tikhonova’s annotation.
Figure 8—figure supplement 2
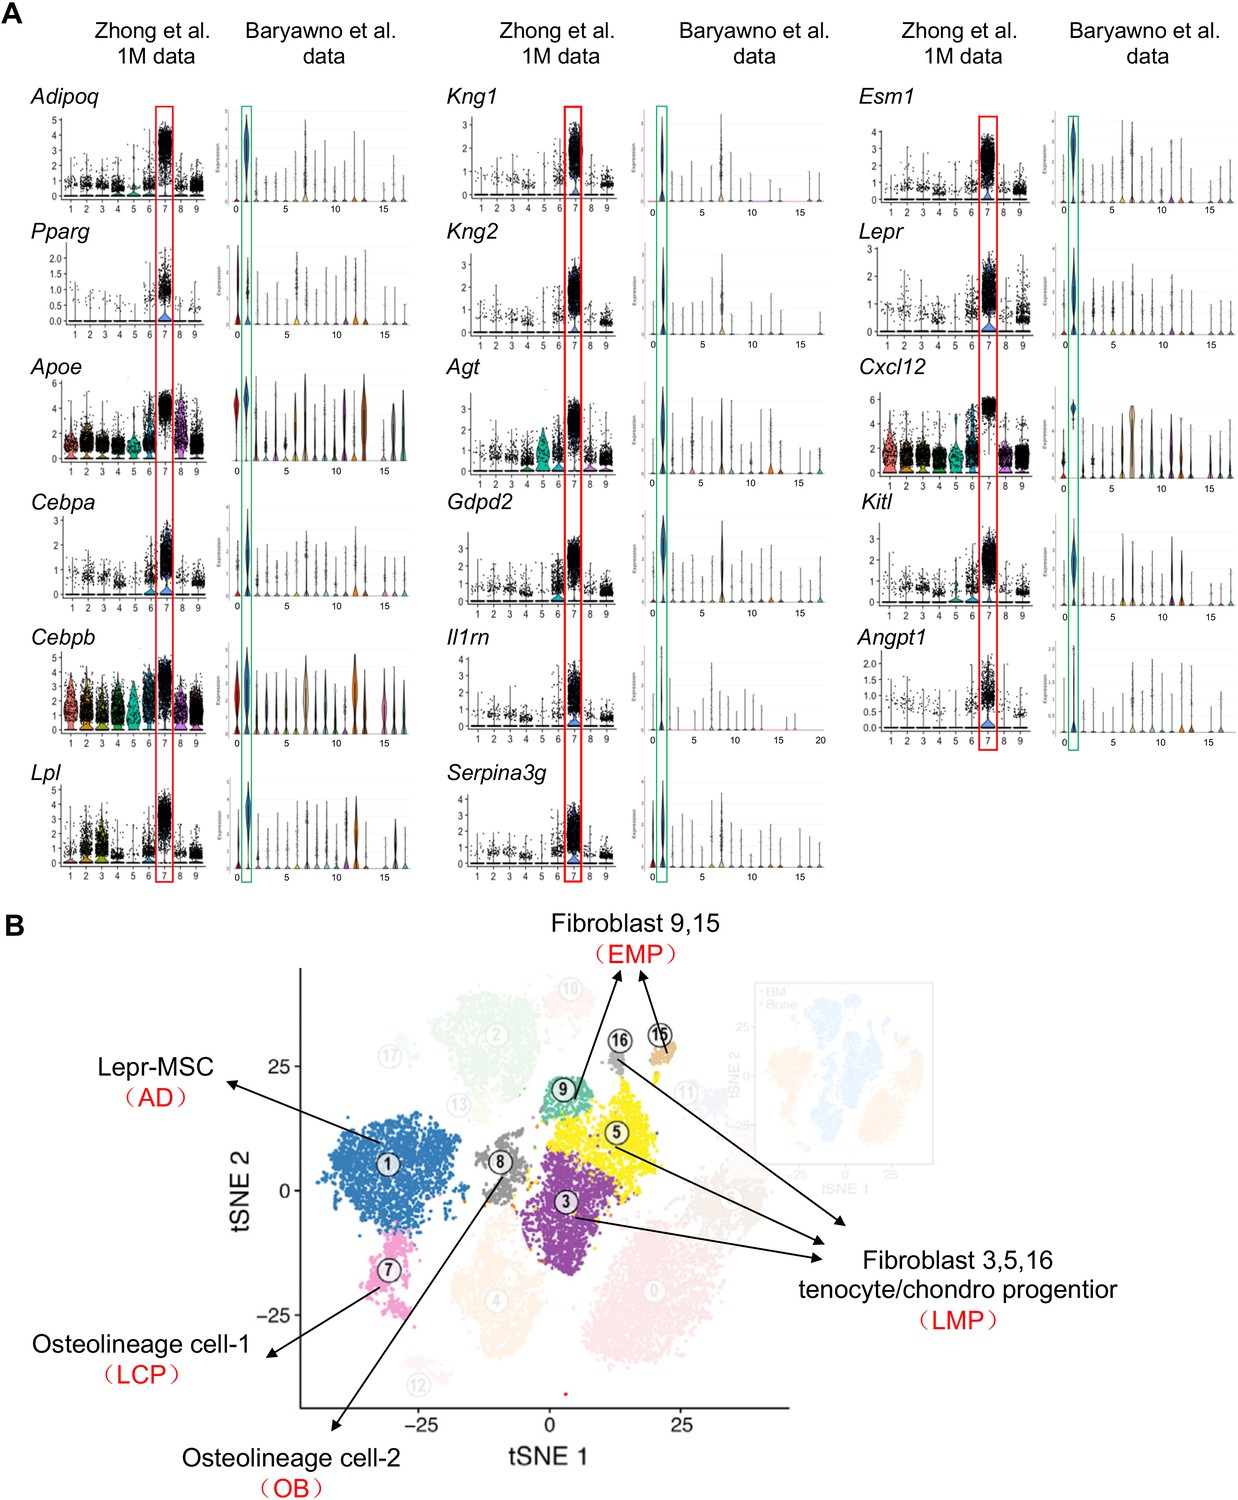
The comparison of large scale scRNA-seq data of bone marrow mesenchymal lineage cells between our group (Zhong et al.) and Baryawno et al. that was recently published (Baryawno et al., 2019) confirms the same distribution of mesenchymal subpopulations but with different annotation of cell clusters.
(A) Violin plots of cluster 7 markers, including known adipocyte markers and novel markers in Zhong’s 1–1.5 month-old dataset and Baryawno’s dataset. Red boxes are cluster 7 adipocyte in Zhong dataset and blue boxes are cluster 1 Lepr-MSC in Baryawno dataset. All those markers have the same expression patterns in adipocytes annotated by Zhong et al. and MSCs annotated by Baryawno et al. (B) An alternative annotation of cell clusters in the tSNE plot of Baryawno dataset. Our annotation results, indicated by red in parentheses below Baryawno’s annotation, are based on examining violin plots of all our cluster marker genes in Baryawno dataset.
Author response image 1
Large scale scRNA-seq identifies subpopulations of bone marrow mesenchymal lineage cells from MSCs to mature cells.
Author response image 2
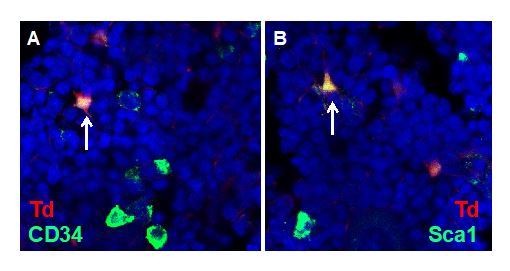
Detection of bone marrow MSCs in vivo.
Representative images of stromal MSCs in 1-month-old Col2/Td mice. Arrows point to CD34+Td+ cells in A and Sca1+Td+ cells in B.
Tables
Key resources table
| Reagent type (species) or resource | Designation | Source or reference | Identifiers | Additional information |
|---|---|---|---|---|
| Genetic reagent (M. musculus) | Col2-Cre | PMID:10686612 | ||
| Genetic reagent (M. musculus) | Dmp1-Cre | PMID:22623172 | ||
| Genetic reagent (M. musculus) | Adipoq-Cre | PMID:21356515 | ||
| Genetic reagent (M. musculus) | Acta2-CreER | PMID:18571490 | ||
| Genetic reagent (M. musculus) | Col1a1-GFP | PMID:11771662 | ||
| Genetic reagent (M. musculus) | Rosa26 iDTR | Jackson Laboratory | ||
| Genetic reagent (M. musculus) | Rosa26 | Jackson Laboratory | ||
| Antibody | goat anti-mouse LepR | R and D system | Cat.#: AF497 | IF(1:200) |
| Antibody | rabbit anti-mouse Laminin | Sigma | Cat.#: L9393 | IF(1:200) |
| Antibody | rat anti-mouse CD45 | Biolegend | Cat.#: 103101 | IF(1:200) |
| Antibody | rat anti-mouse Endomucin | Santa cruz | Cat.#: sc 65495 | IF(1:200) |
| Antibody | rabbit anti-Osterix | Abcam | Cat.#: ab22552 | IF(1:200) |
| Antibody | rabbit anti-Perilipin | Cell signaling | Cat.#: 9349 | IF(1:200) |
| Antibody | rat anti-mouse PDGFRβ | Biolegend | Cat.#: 136002 | IF(1:100) |
| Antibody | rabbit anti-mouse connexin 43 | Cell signaling | Cat.#: 3512 | IF(1:100) |
| Antibody | FITC rat anti-mouse Endomucin | Santa cruz biotechology | Cat.#: sc-65495 | Flow analysis (1:100) |
| Antibody | rat anti-Gr-1 APC-Cy7, | BD | Cat.#: 557661 | Flow analysis (1:100) |
| Antibody | rat anti-Mac-1 APC | eBioscience | Cat.#: 17-0112-83 | Flow analysis (1:100) |
| Antibody | rat anti-B220 FITC | eBioscience | Cat.#: 11-0452-82 | Flow analysis (1:100) |
| Antibody | hamster anti-CD3 PE-Cy7 | eBioscience | Cat.#: 25-0031-82 | Flow analysis (1:100) |
| Antibody | APC rat anti-mouse CD31 | Biolegend | Cat.#: 561814 | Flow analysis (1:100) |
| Antibody | Click-iT EdU Alexa Fluor 647 Imaging Kit | Thermo Fisher | Cat.#: D3822 | |
| Peptide, recombinant protein | Calcein | Sigma | Cat.#: C0875 | 15 mg/kg forin vivo injection |
| Chemical compound, drug | Diphtheria toxin | Sigma-Aldrich | Cat.#: D0564-1MG | 50 µg/kg forin vivo injection |
| Chemical compound, drug | ACK lysing buffer | ThermoFisher Scientific | Cat.#: A1049201 | 500 ul/ 50 million cells |
| Software, algorithm | Cellranger 3.02 | https://support.10xgenomics.com/single-cell-gene-expression/software/pipelines/latest/installation | ||
| Software, algorithm | Seurat V2, V3 | PMID:25867923 PMID:31178118 | https://satijalab.org/seurat/ | |
| Software, algorithm | Monocle V2 | PMID:24658644 | http://cole-trapnell-lab.github.io/monocle-release/docs | |
| Software, algorithm | Slingshot 1.5.1 | PMID:29914354 | https://bioconductor.org/packages/devel/bioc/vignettes/slingshot/inst/doc/vignette.html | |
| Other | BODIPY dye | ThermoFisher scientific | D3822 | IF (1:500) |
Additional files
-
Source code 1
R script for reading the matrix file of the dataset.
- https://cdn.elifesciences.org/articles/54695/elife-54695-code1-v3.zip
-
Supplementary file 1
Mouse real-time PCR primer sequences used in this study.
- https://cdn.elifesciences.org/articles/54695/elife-54695-supp1-v3.docx
-
Transparent reporting form
- https://cdn.elifesciences.org/articles/54695/elife-54695-transrepform-v3.docx
Download links
A two-part list of links to download the article, or parts of the article, in various formats.
Downloads (link to download the article as PDF)
Open citations (links to open the citations from this article in various online reference manager services)
Cite this article (links to download the citations from this article in formats compatible with various reference manager tools)
Single cell transcriptomics identifies a unique adipose lineage cell population that regulates bone marrow environment
eLife 9:e54695.
https://doi.org/10.7554/eLife.54695


