Genetic analysis of the Arabidopsis TIR1/AFB auxin receptors reveals both overlapping and specialized functions
- Section of Cell and Developmental Biology, University of California San Diego, United States
- Plant Molecular and Cellular Biology Laboratory and Integrative Biology Laboratory, Salk Institute for Biological Studies, United States
- Plant and Crop Sciences, School of Biosciences, University of Nottingham, United Kingdom
Figures
Figure 1 with 4 supplements
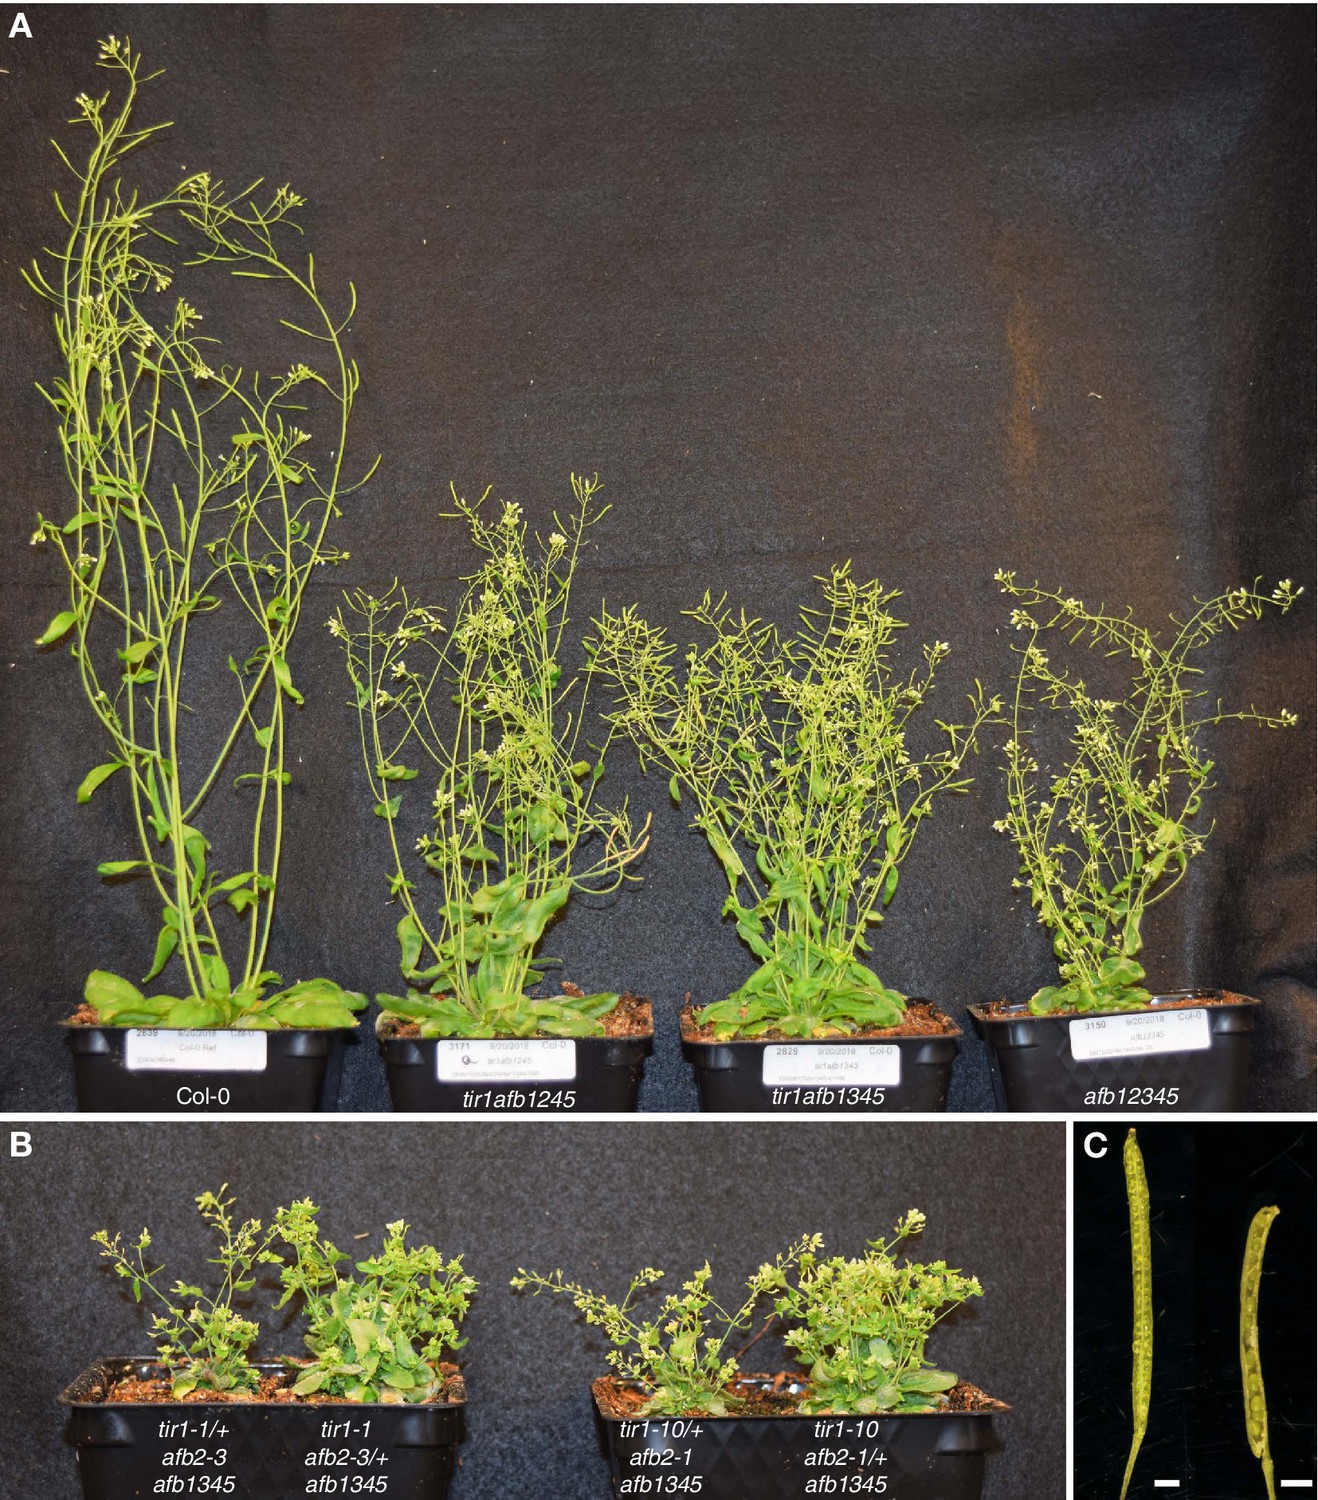
tir1/afb mutant lines exhibit a range of shoot phenotypes.
(A) The viable quintuple mutants, tir1afb1245, tir1afb1345, and afb12345, are each approximately half the height of Col-0 WT, but differ in other phenotypes. Note the curved silique tips of the tir1afb1245 mutant (indicative of gynoecium defects) and the short siliques (due to poor fertility) of the afb12345 mutant. (B) Lines with only one TIR1+ or one AFB2+ allele display similar phenotypes regardless of the mutant tir1 and afb2 alleles: left to right, tir1-1/+ afb2-3 afb1345, tir1-1 afb2-3/+ afb1345, tir1-10/+ afb2-1 afb1345, and tir1-10 afb2-1/+ afb1345. (C) Normal siliques (Col-0, left) have two valves containing developing seeds while 32% of tir1afb1245 siliques have only one. The adaxial half of the valve walls were removed to reveal the developing seeds. Scale bars are 1 mm. Plants were grown for 42 days at 22°C and 16 hr daylength.
Figure 1—figure supplement 1
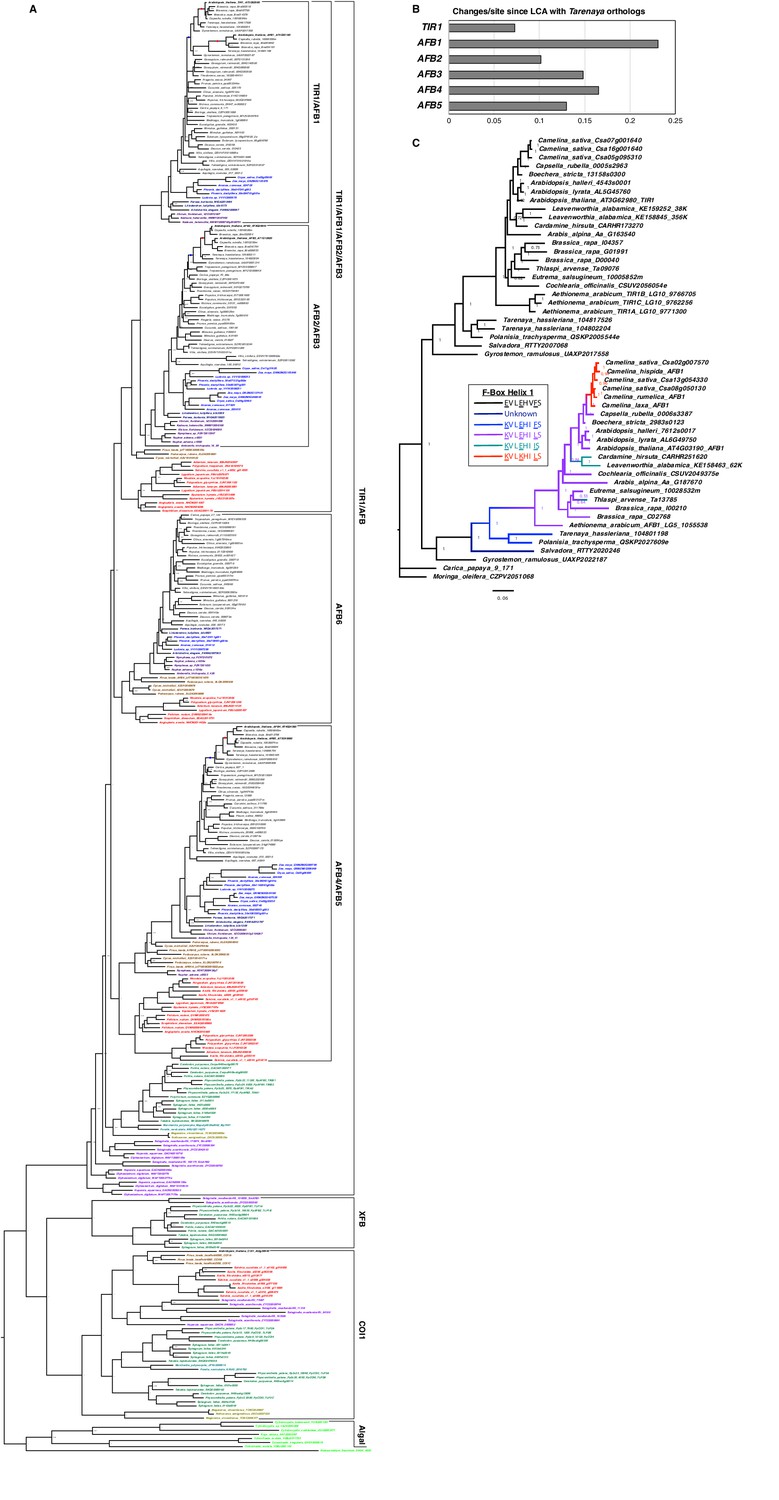
TIR1/AFB Phylogeny.
(A) The MrBayes-inferred gene tree illustrates the relationships between three F-Box-LRR protein families in land plants. The sources of the sequences are indicated by tip label colors: Arabidopsis thaliana, black; other eudicots, gray; monocots, light blue; magnoliids, dark blue; ANITA grade angiosperms, dark purple; gymnosperms, brown; ferns, red; lycophytes, light purple; mosses, dark green; liverworts, teal; hornworts, tan; and algae, light green. The branches leading to the At-α and At-β WGDs are indicated by red and blue dots, respectively. Three clades of TIR1/AFB proteins have well-supported fern sister clades indicating that first gene duplications in the family predated euphyllophyte radiation. Note that the position of the lycophyte TIR1/AFBs relative to those of bryophytes and seed plants was not resolved. (B) The graph shows the sum of branch lengths (amino-acid substitutions per site) from the node joining the Cleomaceae and Brassicaceae clades to the tip for the Arabidopsis member of the clade. (C) Gene tree for the TIR1 and AFB1 clades with the parsimoniously inferred relative dates for the appearance of the three substitutions in the first helix of the F-Box that were shown to interfere with SCF assembly. The Salvadora AFB1 transcript assembly lacked the sequence encoding this helix so that ancestor’s sequence could not be predicted.
Figure 1—figure supplement 2
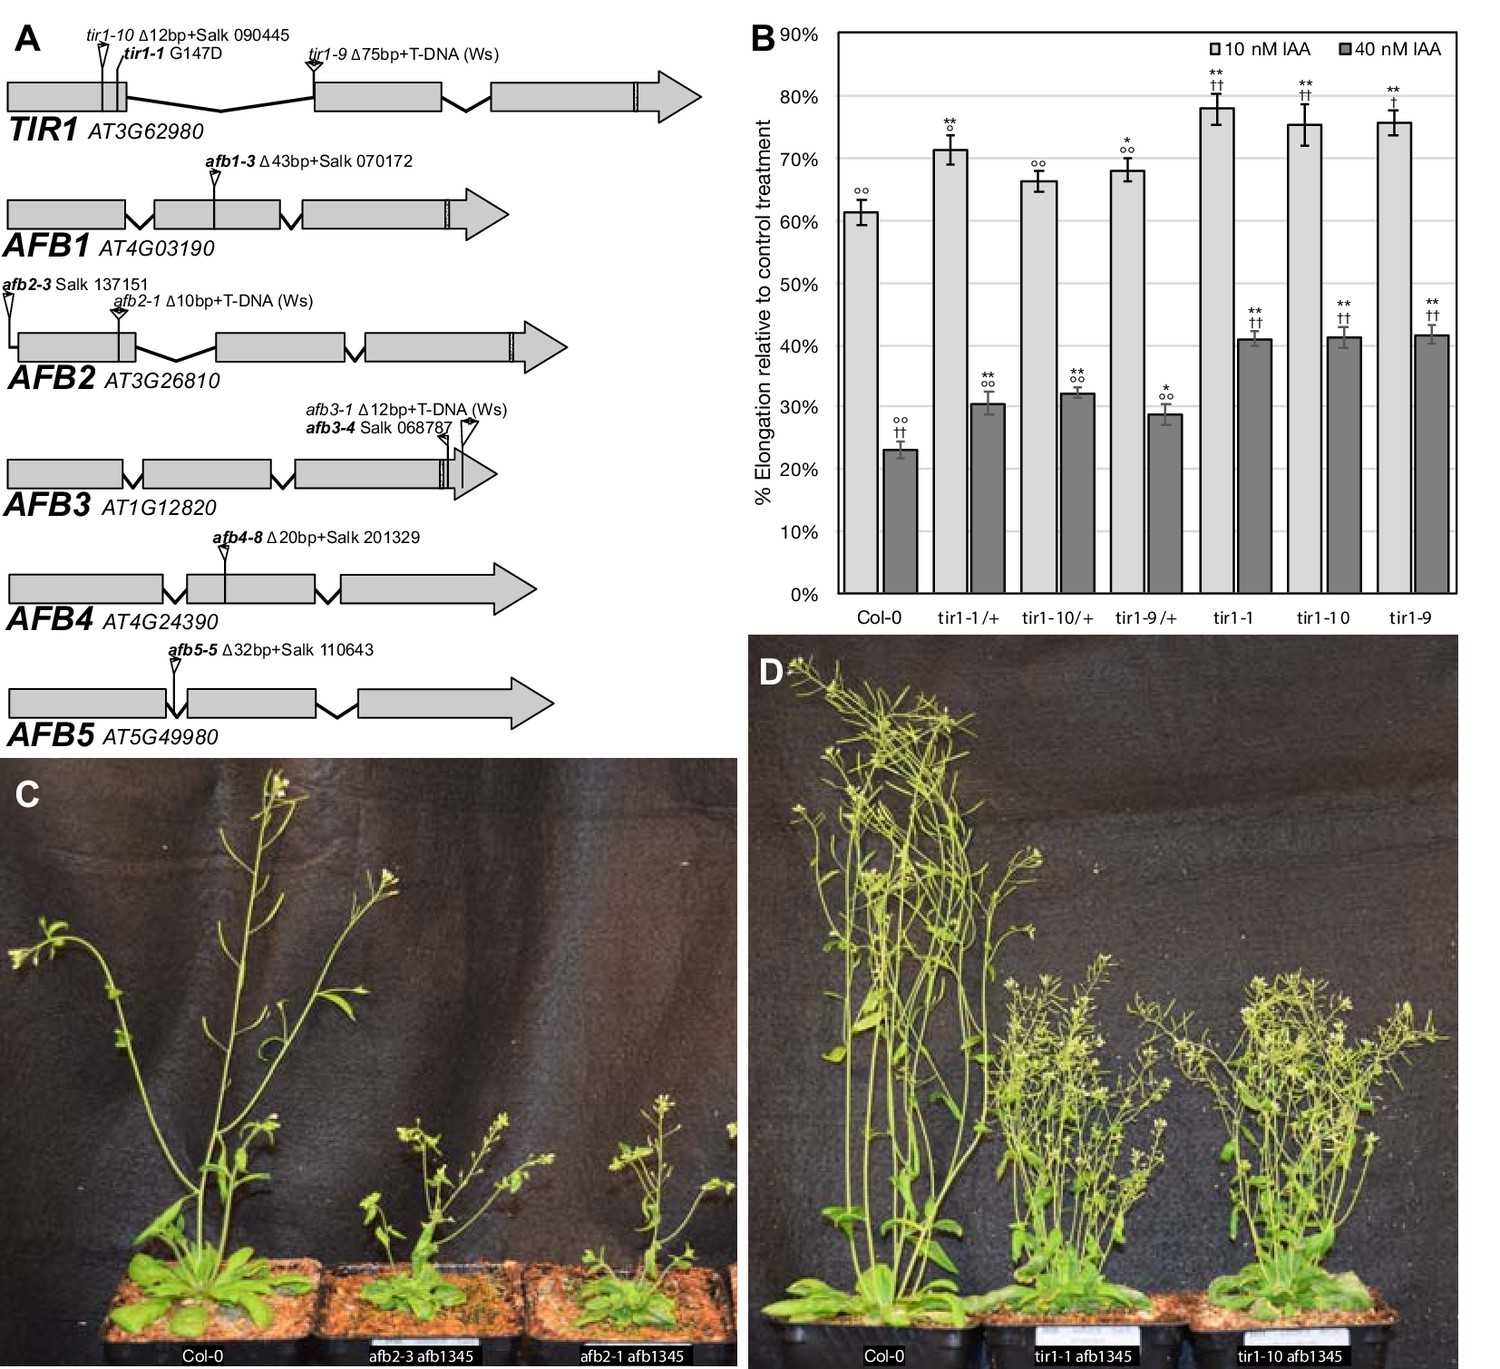
Alternate tir1/afb alleles.
(A) Diagram of exon/intron structure showing the locations of each mutation used in this study. T-DNA insertions are shown as triangles with the arrowheads indicating the locations of left-border sequences. The box in the third exons indicates the regions targeted by miR393. (B) Root elongation inhibition assay of seedlings homozygous or heterozygous (F1 progeny of Col-0 crosses) for three tir1 alleles. Sample sizes were 20–31 per treatment. Two-tailed t-test p values: *,≤0.05 and **,≤0.005 compared to Col-0; °,≤0.05 and °°,≤0.005 compared to tir1-10; and †,≤0.05; ††,≤0.005 compared to tir1-10/+. The tir1-9 allele (Ws-2 background) was backcrossed twice to Col-0 and an additional time for tir1-9/+. (C) 32 day old Col-0, afb2-3 afb1345, and afb2-1 afb1345 plants. (D) 42 day old Col-0, tir1-1 afb1345, and tir1-10 afb1345 plants.
-
Figure 1—figure supplement 2—source data 1
Source data for tir1 dominance test.
- https://cdn.elifesciences.org/articles/54740/elife-54740-fig1-figsupp2-data1-v2.xlsx
Figure 1—figure supplement 3

Shoot and root phenotypes of tir1/afb mutants.
The seedlings/plants were grown in three batches (separated by dashed lines). Average inflorescence height (A) and rosette diameter (B) of 42-day-old plants of the given genotypes. (C) Average numbers of inflorescence branches (≥1 cm) with the shades of gray distinguishing branches from primary, secondary, and tertiary inflorescences. In panels (A–C), n = 5 plants each except for afb2, tir1afb245, and Col-0 (batch C) for which n = 4. (D) Average numbers of emerged lateral roots after five days on media lacking IAA then four days on media containing 100 nM IAA (n = 10–24 seedlings). (E) Inhibition of root elongation assays. Seedlings were grown for five days on media lacking IAA then transferred to media containing 20 nM, 100 nM, 500 nM IAA, or DMSO-only control and grown for three days. Growth during the three days on media containing IAA is expressed as a percentage of the growth of the same genotype on control plates (n = 7–24 seedlings for each treatment). The lines with an asterisk included a cross to an afb4-2 containing line in their pedigrees, and alternate lines never exposed to the TILLING background were included in the third batch for five of the six such lines. The afb123 line included in the first batch—and none of the others—exhibited a long-hypocotyl phenotype presumably acquired from the afb4-2 line so it was excluded. The error bars indicate standard error of the mean (A–D) or the relative standard error of the ratio (E).
-
Figure 1—figure supplement 3—source data 1
Source data for phenotype measurements.
- https://cdn.elifesciences.org/articles/54740/elife-54740-fig1-figsupp3-data1-v2.xlsx
Figure 1—figure supplement 4
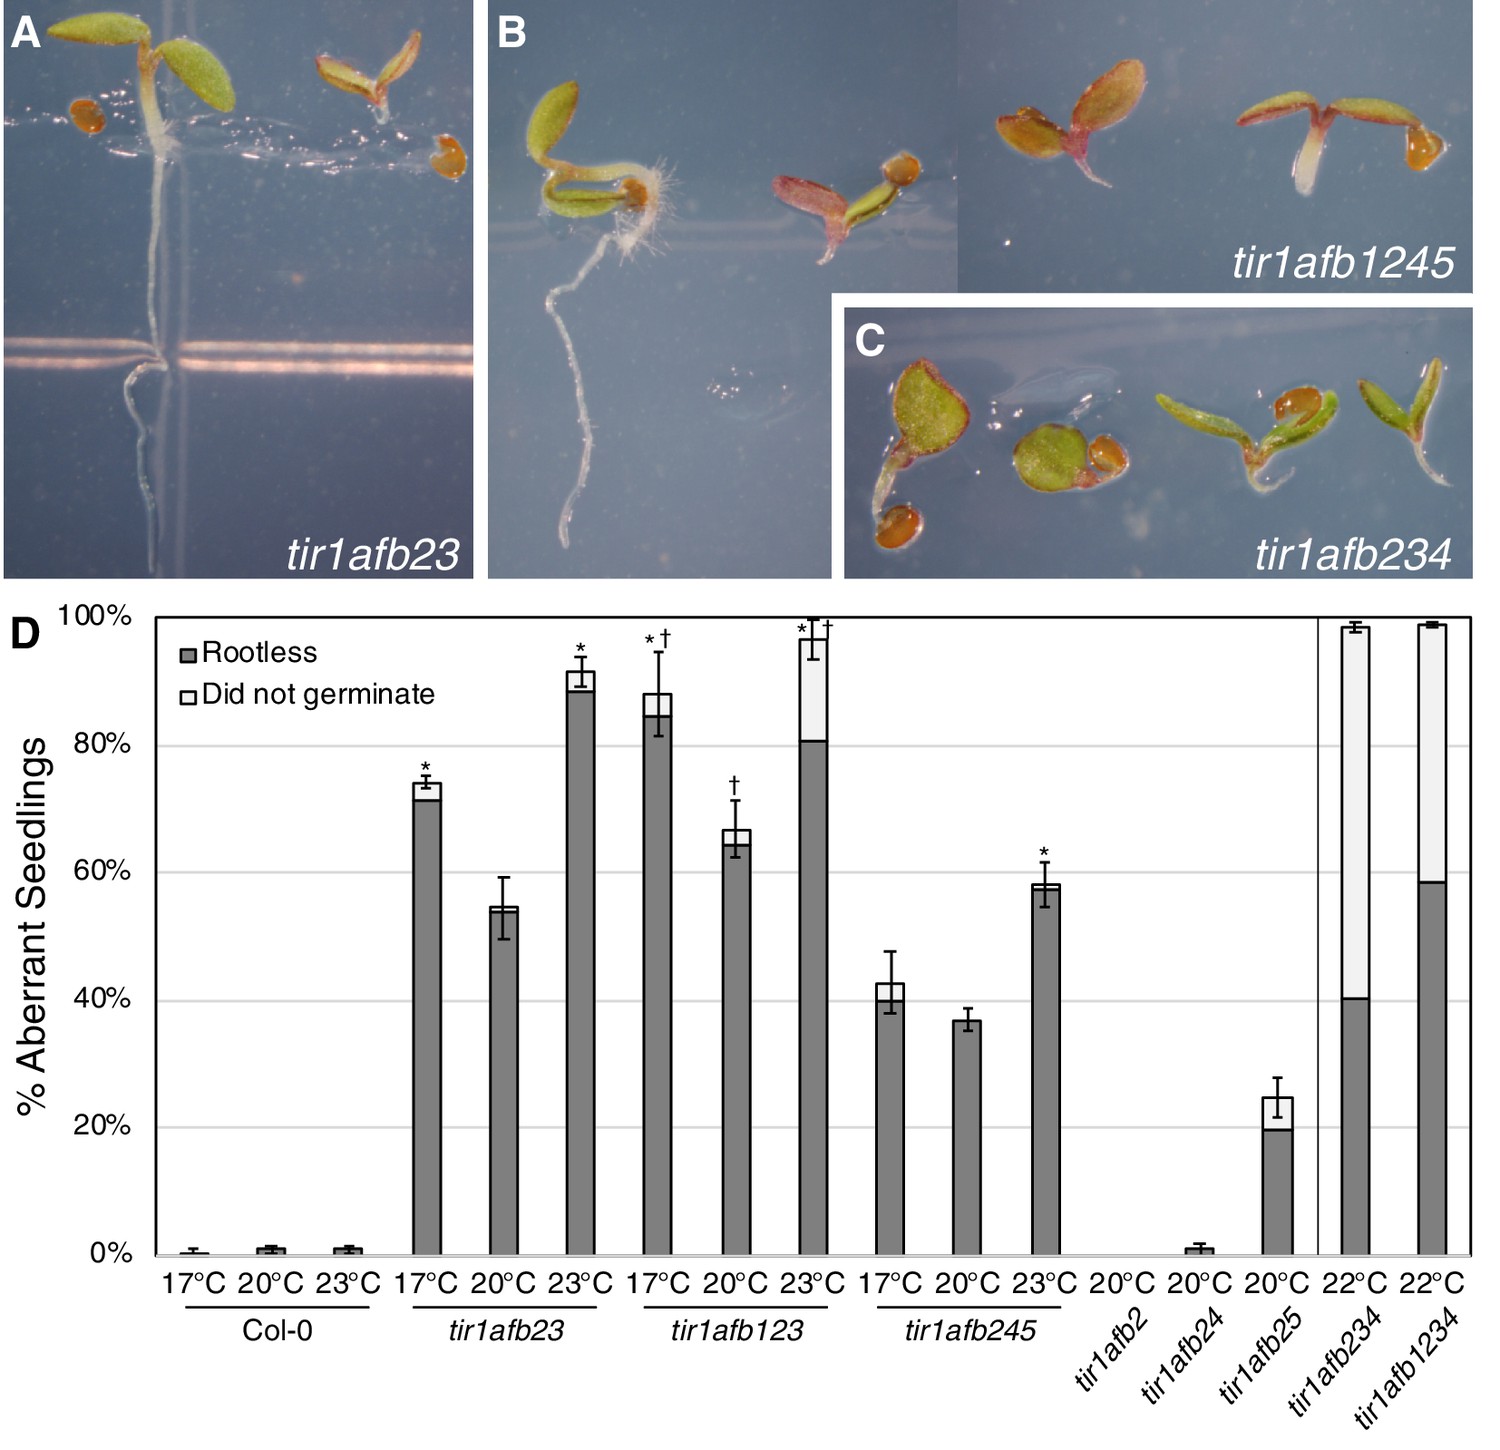
Embryonic root formation in tir1/afb mutants.
(A) Representative seedlings of tir1afb23 mutants with and without roots. (B) Four tir1afb1245 seedlings with (left) and without roots (three on right), (C) Four rootless tir1afb234 mutants. (D) Graph showing the percent of seedlings of different genotypes lacking roots (dark gray) or not germinating (light gray). The temperatures indicate the conditions in which the parents were grown, Percival growth chambers set to 17°C or 20°C or an environmental room with temperatures between 22°C and 23°C. For tir1afb234 and tir1afb1234, adventitious roots needed to be induced with a 3 day treatment on 10 µM NAA before transplanting to soil and growing for seed collection in a different Percival chamber set to 22°C. Error bars indicate standard error of the mean for progeny of four different parents of the given genotype/temperature combination. For the Fisher’s exact tests, all four families’ tallies were combined, from 142 to 255 seeds per genotype/condition were tested. *, Different from 20°C for the same genotype using Fisher’s exact test, p<0.001. †, Different from tir1afb23 using Fisher’s exact test, p<0.01.
-
Figure 1—figure supplement 4—source data 1
Source data for seedling phenotypes.
- https://cdn.elifesciences.org/articles/54740/elife-54740-fig1-figsupp4-data1-v2.xlsx
Figure 2
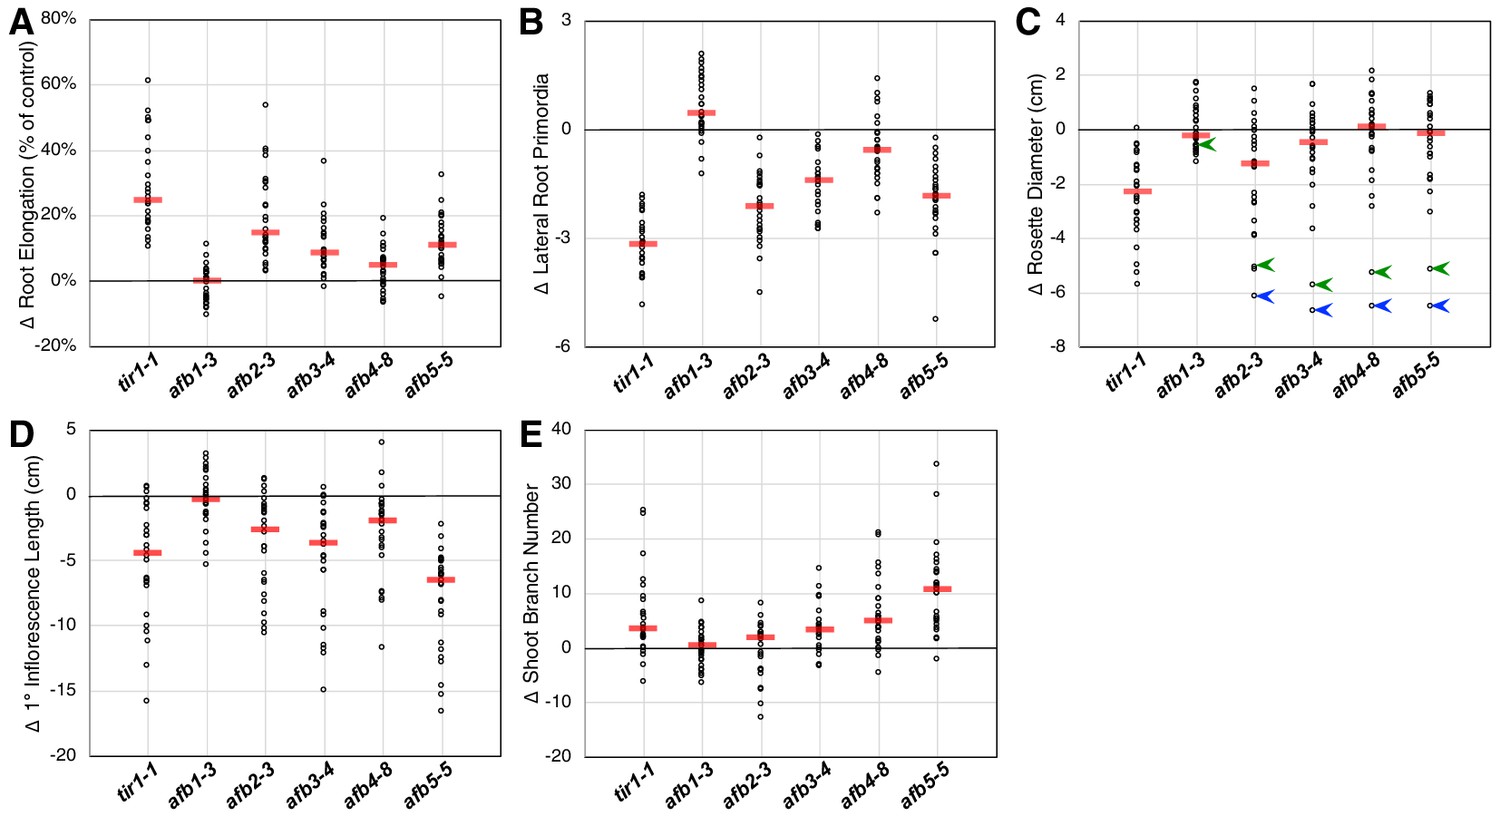
Relative TIR1/AFB gene effects.
For each of the five phenotype measurements (Figure 1—figure supplement 3), the normalized mean for each genotype with the given mutation was subtracted from the normalized mean for the corresponding genotype lacking that mutation and plotted (circles). The red bars indicate the median difference attributable to the given mutation. (A) Effects of each mutation on IAA-inhibition of root elongation. For each genotype, twelve five-day-old seedlings were transferred and grown for three days on media containing 100 nM IAA, and their average growth was divided by that of twelve seedlings grown on media lacking added auxin. (B) Effects of each mutation on auxin-induced lateral root production. Twelve five-day-old seedlings for each genotype were grown for four days on media containing 100 nM IAA and the numbers of emerged lateral roots were counted. (C) Effects of each mutation on the average rosette diameters of five 42 day old plants. The blue arrowheads indicate difference in phenotypes between the afb2345 quadruple mutant and the four triple mutants, and the green arrowheads indicate those for the afb12345 quintuple mutant and the five quadruple mutants. (D) Effects of each mutation on the average height of the primary inflorescences for five 42 day old plants. (E) Effects of each mutation on the average number of inflorescence branches (≥1 cm) on five 42 day old plants.
Figure 3 with 2 supplements
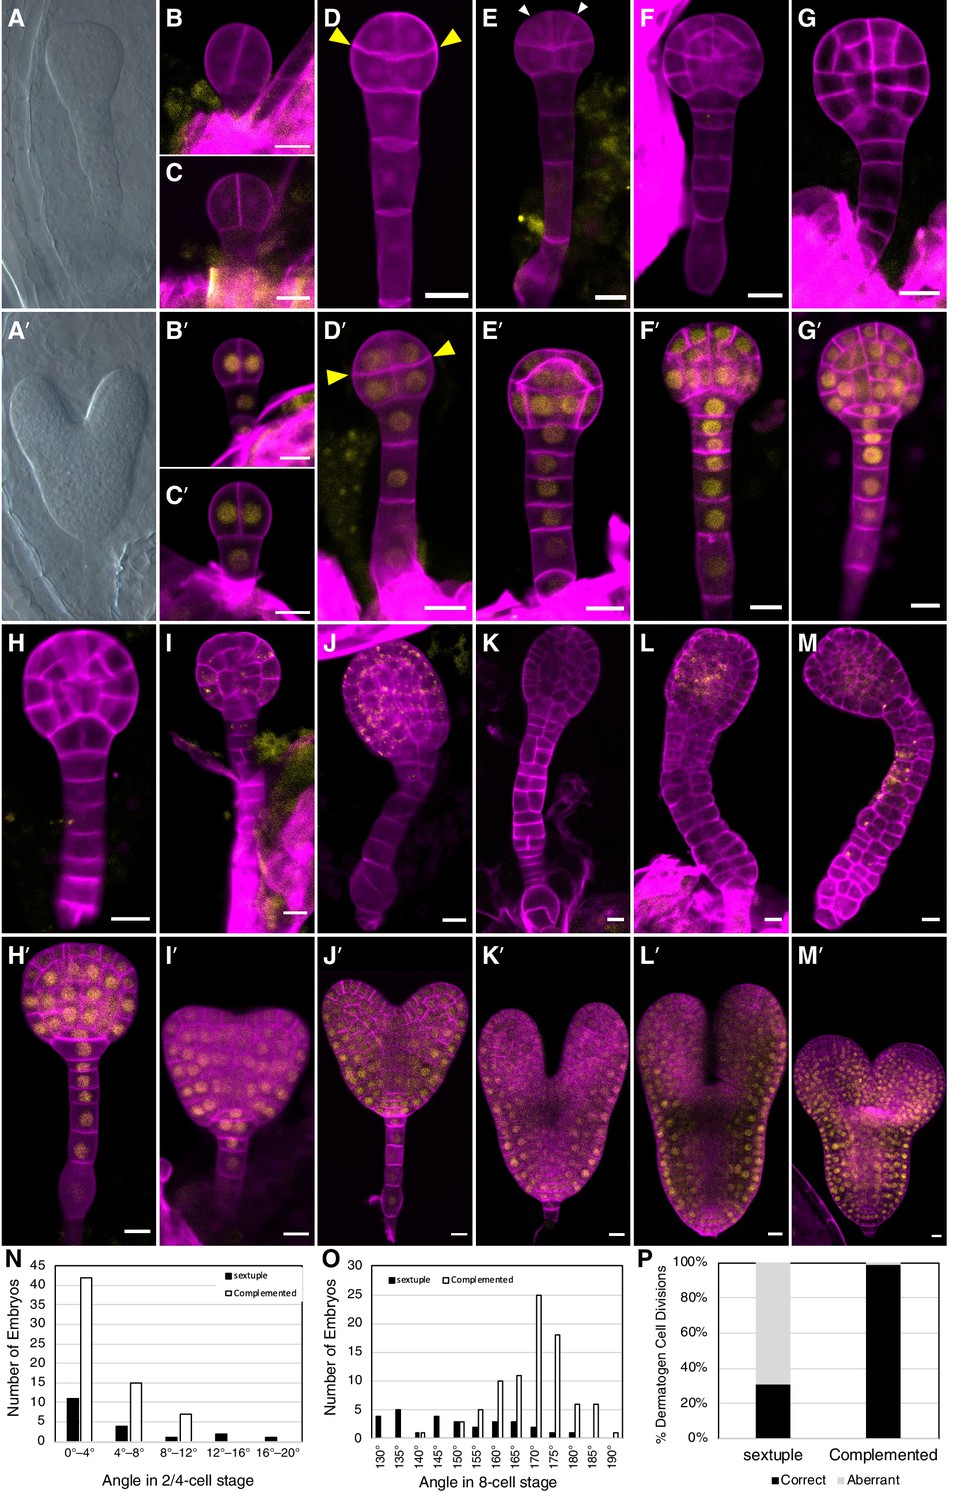
Embryo-lethal phenotypes of tir1/afb mutant lines.
Rows of panels alternate between defective and normal embryos. Approximately one-quarter of the chloral-hydrate-cleared embryos from siliques of afb2/+ tir1afb35 plants did not produce cotyledon primordia and have over-proliferated suspensors (A) while the remaining siblings from the same silique appear normal (A′). Embryos from TIR1/AFB5/AFB2/+ tir1afb12345 plants were fixed, stained with SR2200 (cell walls, magenta), and scanned for fluorescence from the AFB2-mCitrine fusion protein (yellow). All were progeny of ‘d2’ transgenic line and the standard alleles except panels (C and D) contained the tir1-10 and afb2-1 alleles and panels H′ and I were progeny of plants with the ‘d1’ transgenic line. The embryos in panels B–M are sextuple mutants lacking mCitrine signal while those in B′–M′ are complemented siblings. The embryo stages are 2-cell (B–C, B′–C′), 8-cell (octant; D, D′), 16-cell (dermatogen; E, E′), early globular (F, F′), late globular (G–H, G′–H′), late transition (I, I′), heart (J, J′), torpedo (K–L, K′–L′), and bent cotyledon (M, M′). The yellow cytoplasmic signal in panels (I) through (M) likely represents autofluorescence of senescing cells. (N) Histogram of the angles of the first division plane with 0° defined as perpendicular to a line connecting the upper corners of the hypophysis cell for sextuple (black) and complemented siblings (white). The average difference was not significantly different (p=0.32 from t-test, n = 19 and 64). (O) Histogram of the angles of lines connecting the upper and lower tiers of octant embryos from side to center to side (indicated by arrowheads in panels D, D′). The means for the sextuple and complemented siblings were 149.1° and 169.1°, respectively, and were significantly different (p=1.4 × 10⁻⁷ from t-test, n = 29 and 84). (P) Bar graph showing the frequencies of normal (periclinal) and aberrant (anticlinal, arrowheads in panel E) divisions in 16-cell embryos. While aberrant divisions were observed in complemented siblings, they were significantly more frequent in sextuple mutants (p=2.8 × 10−54 from Fisher’s exact test, n = 94 and 437 divisions).
Figure 3—figure supplement 1

Transgene complementing the tir1afb12345 sextuple mutant.
(A) Diagram of the Transfer-DNA region of pMP1855 containing genomic regions of TIR1, AFB5, and AFB2 fused to mOrange2, mCherry, and mCitrine, respectively. BAR, Basta- (phosphinothricin-) resistance gene flanked by the Agrobacterium nopaline synthase promoter and terminator. B–D, Confocal images of a globular-stage embryo from a TIR1/AFB5/AFB2 #d2/d2 plant detecting mOrange2 (B), mCherry, (C), and mCitrine (D). E–F, Phenotypes of a 32-day-old WT Col-0 plant and a tir1afb12345 plant hemizygous for the TIR1/AFB5/AFB2 #d2 transgene of the same age.
Figure 3—figure supplement 2

Appearance of autofluorescence in sextuple mutant embryos.
Torpedo-stage transgene-complemented sextuple mutant (A) and sextuple mutants equivalent to between early torpedo to bent-cotyledon stages (B–D) were imaged using similar microscope settings for SR2200 stain (blue), mCitrine (yellow), mOrange2 (orange), and mCherry (red). In the mutants, autofluorescence appears in all three fluorescent protein channels in the same patterns albeit much less intensely in the YFP channel. The settings for YFP were much less sensitive than the others because AFB2-mCitrine was much brighter than TIR1-mOrange2 and AFB5-mCherry (likely due to dimmer fluorescent proteins with much slower maturation rates as well as lower expression levels). Scale bars are 10 µm.
Figure 4
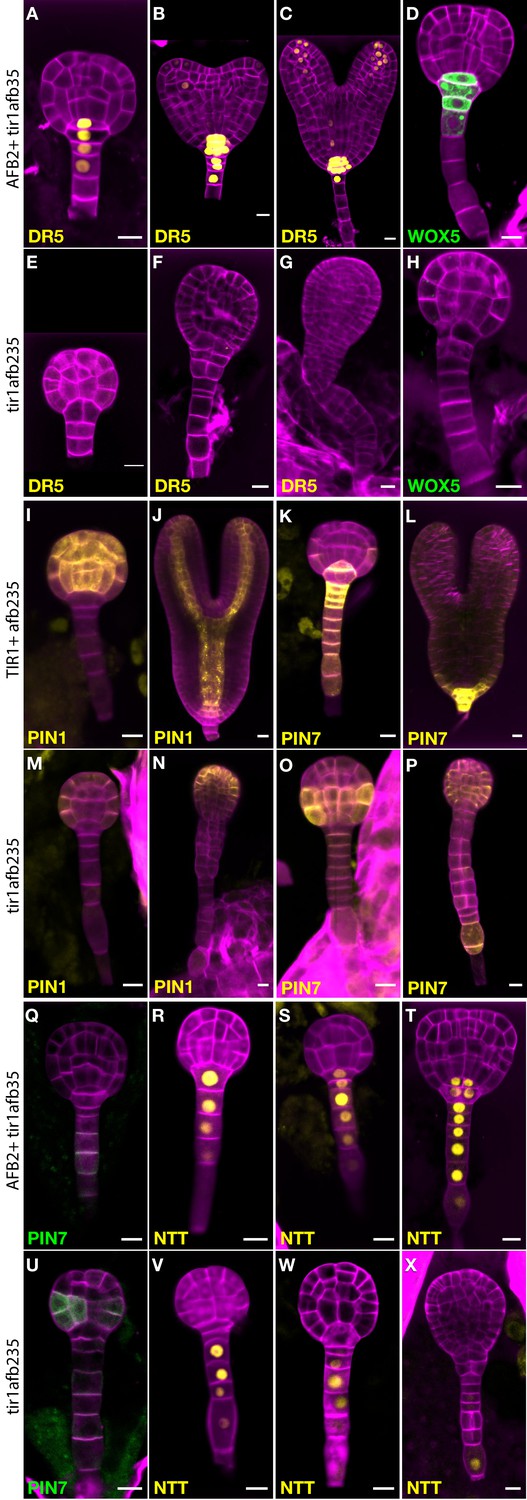
Marker gene expression in the tir1afb235 embryos.
Fluorescence in embryos from both afb2/+ tir1afb35 DR5rev:3×Venus-N7 (A–C, E–G) and afb2/+ tir1afb35 WOX5:GFPER (D, H) markers was present in phenotypically normal siblings (A–D) but absent in abnormal (presumed tir1afb235) embryos (E–H). Fluorescence in embryos from tir1/+afb235 PIN1-Venus plants: normal-phenotype globular embryo (I), normal-phenotype torpedo-stage embryo (J), mutant-phenotype globular embryo (M) and later-stage embryo (N). Progeny of tir1/+ afb235 PIN7-Venus or afb2/+ tir1afb35 PIN7-GFP plants: phenotypically normal globular embryos (K, Q) mutant globular embryos (O, U), and normal (L) and mutant (P) torpedo-stage embryos. Progeny of afb2/+ tir1afb35 NTT-YPet plants: normal-phenotype globular- (R–S) and transition- (T) stage embryos, and mutant embryos (V–X). Scale bars: 10 µm.
Figure 5 with 3 supplements
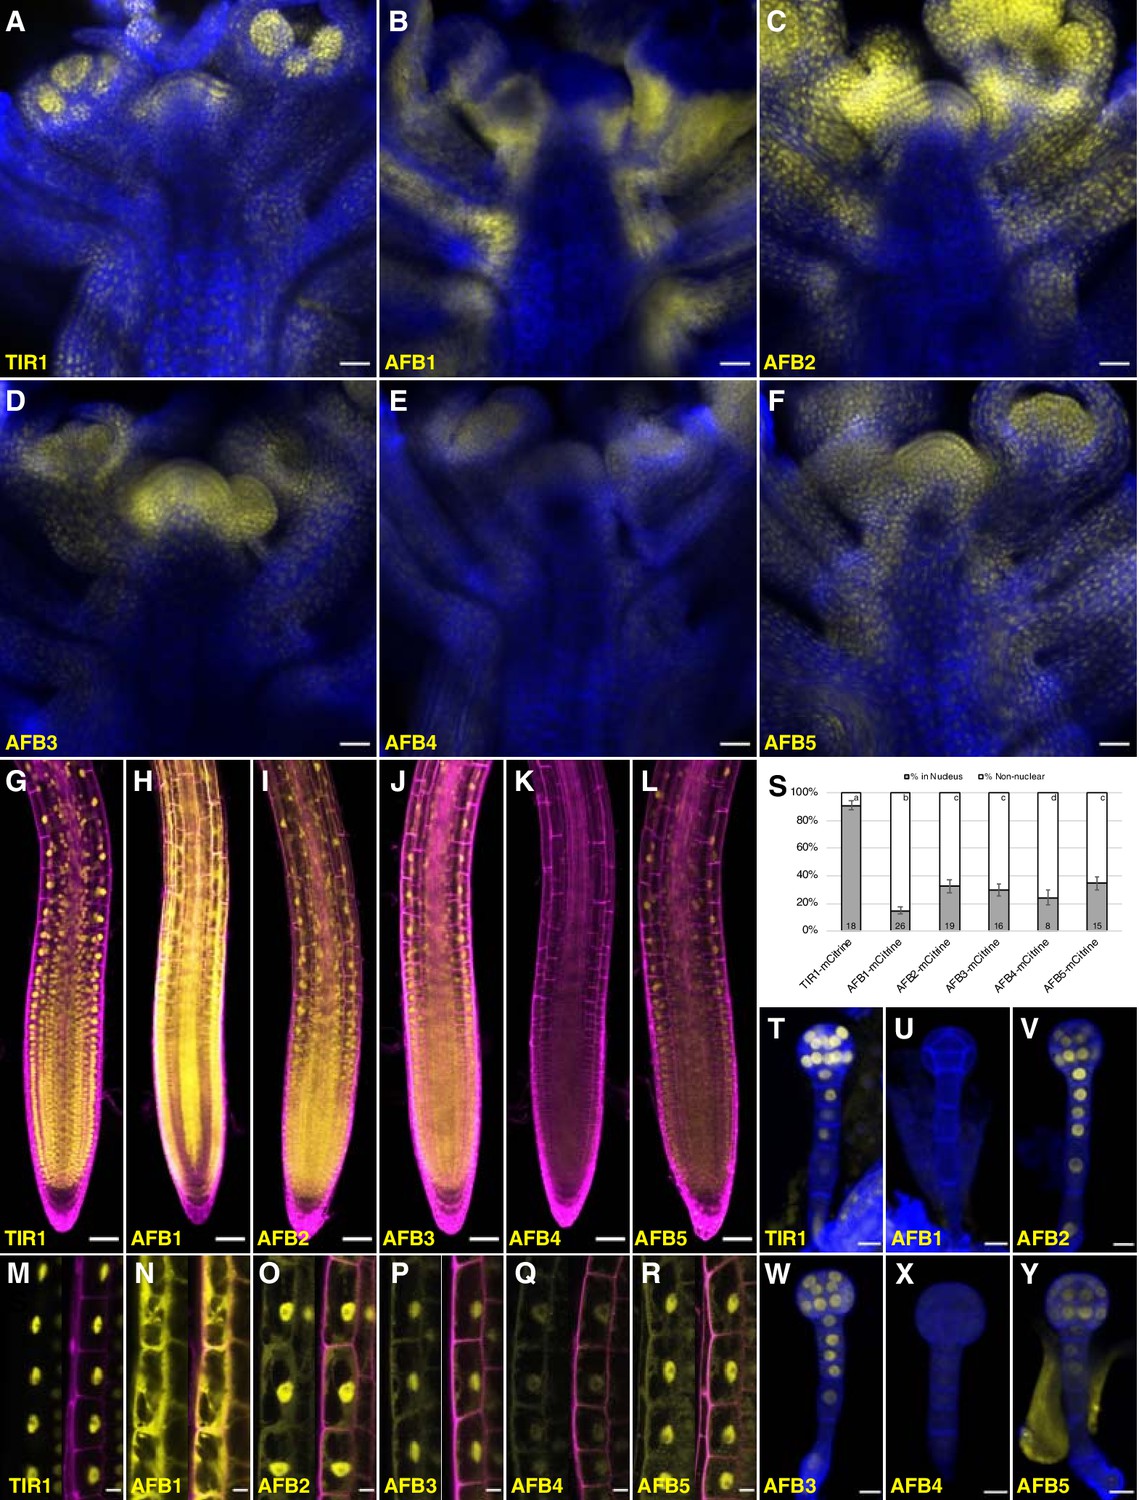
Expression of TIR1/AFB-mCitrine translational fusions.
(A–F) Confocal images of inflorescence apices from 4-week-old plants containing the specified TIR1/AFB-mCitrine transgenes. (G–R) Confocal images of roots of 5-day-old seedlings under lower magnification (G–L) or 7-day-old seedlings under higher magnification (M–R). Images in panels (G) and I–L used similar microscope settings while those in panel (H) used less sensitive settings. (S) Plot comparing the relative proportions of mCitrine signal inside the nucleus (gray) and outside the nucleus (white). Cells were imaged and measured for each TIR1/AFB-mCitrine line, and the averages ± standard deviations are shown. For AFB1-mCitrine, F1 hybrids with the UBQ10:H2B-mTurquoise2 nuclear marker were used so that the nuclei could be delineated (Figure 5—figure supplement 3). The numbers in the bars indicate the number of cells measured and the letters distinguish significantly different averages (two-tailed t-test p<0.05). (T–Y) Confocal images of dermatogen or early globular embryos. mCitrine signal is shown as yellow in all panels, and cell walls were stained with Calcofluor White M2R (blue; A–F), propidium iodide (magenta; G–R), and SCRI Renaissance 2200 (blue; T–Y). In panels M–R, mCitrine fluorescence is shown with and without merging with the propidium iodide stain image. Transgenic lines and genetic backgrounds used: (A, G, M, S, T) tir1-10 TIR1-mCitrine#2; (B, H, N, S, U) afb1-3 AFB1-mCitrine#7; (C, O, V) afb2-3 AFB2-mCitrine#3; (I, S) afb2-3 AFB2-mCitrine#5; (D, J, P, S, W) afb3-4 AFB3-mCitrine#1; (E, K, Q, S, X) afb4-8 AFB4-mCitrine#3; (F, L, Y) afb5-5 AFB5-mCitrine#19 and (R, S) afb5-5 AFB5-mCitrine#23. Scale bars equal 25 µm (A–F), 50 µm (G–L), and 10 µm (M–R, T–Y).
Figure 5—figure supplement 1
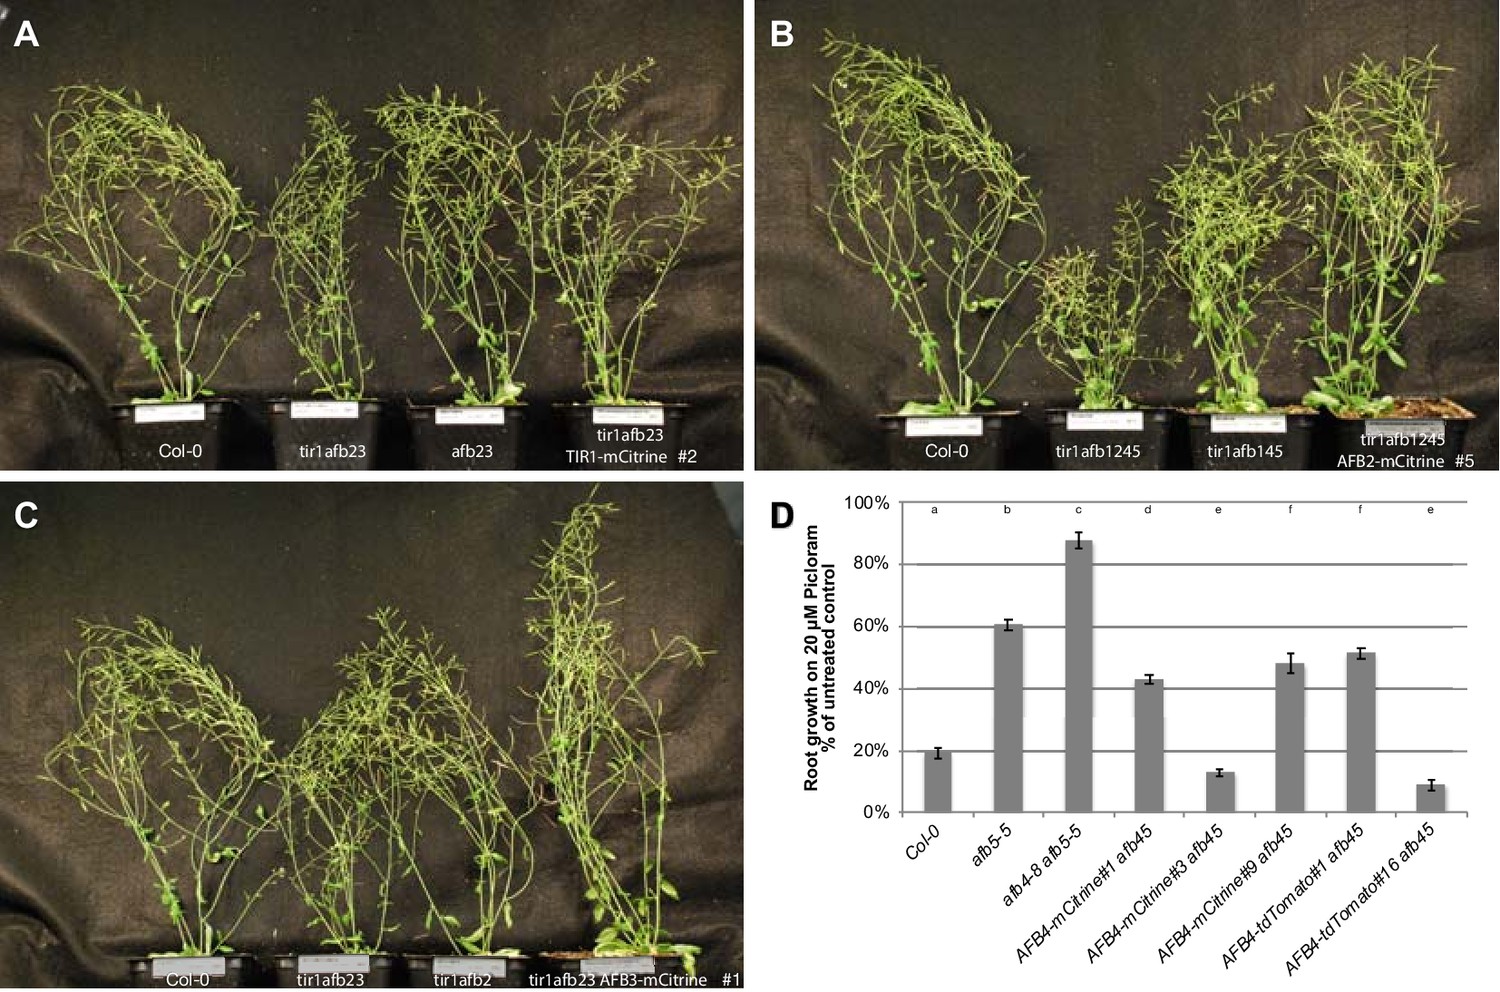
Complementation of mutant phenotypes by TIR1/AFB-mCitrine transgenes.
(A) Comparison of 42 day old Col-0, tir1afb23, afb23, and tir1afb23 TIR1-mCitrine#2 plants. (B) Comparison of 42 day old Col-0, tir1afb1245, tir1afb145, and tir1afb1245 AFB2-mCitrine#5 plant phenotypes. (C) Comparison of 42 day old Col-0, tir1afb23, tir1afb2, and tir1afb23 AFB3-mCitrine#1 plant phenotypes. Each of the transgenes complements the silique and inflorescence height phenotypes. (D) Sensitivities of AFB4-expressing transgenic lines to picloram. Root elongation was measured for seedlings grown on media containing 20 µM picloram, expressed as a percentage of elongation on media lacking picloram. Lines AFB4-mCitrine#3 and AFB4-tdTomato#16 are more sensitive to picloram than WT indicating that the transgene is likely expressed at higher levels than the endogenous AFB4 locus. Sample sizes were 15–16 per line per treatment. Error bars show the SE of the ratio. Letters at top distinguish lines with different responses to picloram (t-test, p<0.05).
-
Figure 5—figure supplement 1—source data 1
Source data for AFB4-mCitrine complementation.
- https://cdn.elifesciences.org/articles/54740/elife-54740-fig5-figsupp1-data1-v2.xlsx
Figure 5—figure supplement 2

Comparison of TIR1/AFB-mCitrine lines.
Roots of 5-day-old seedlings for two different lines are shown with a merged image of propidium iodide (magenta) and the fluorescent signal of mCitrine (yellow) or mEGFP (green) on the left and fluorescent signal alone on the right. (A) TIR1-mCitrine#2; (B) TIR1-mCitrine#4; (C) AFB1-mCitrine#7; (D) AFB1-mCitrine #5; (E) AFB2-mCitrine#5; (F) AFB2-mCitrine#3; (G) AFB3-mCitrine#1; (H) AFB3-mEGFP#2; (I) AFB4-mCitrine#1; (J) AFB4-mCitrine#3; (K) AFB5-mCitrine#23; and (L) AFB5-mCitrine#9. The first line for each gene is the same as shown in Figure 5 panels G–L. The numbers in the lower left corner indicate similar microscope settings from 1 (least sensitive) to 4 (most sensitive). Scale bars equal 25 µm.
Figure 5—figure supplement 3

AFB1-mCitrine expression is unchanged in F1 hybrids used for signal quantification.
Images of root epidermal cells in the elongation zone from 7-day-old seedlings are shown for the fluorescent signal of AFB1-mCitrine (yellow), propidium iodide (magenta) and mTurquoise2 (cyan), and a merged image. In panel (A), the mTurquoise2 signal is included in cyan. (A), afb1-3 AFB1-mCitrine#7 × UBQ10:H2B-2×mTurquoise2 F1 and (B), afb1-3 AFB1-mCitrine#7. Scale bars equal 10 µm.
Figure 6 with 4 supplements
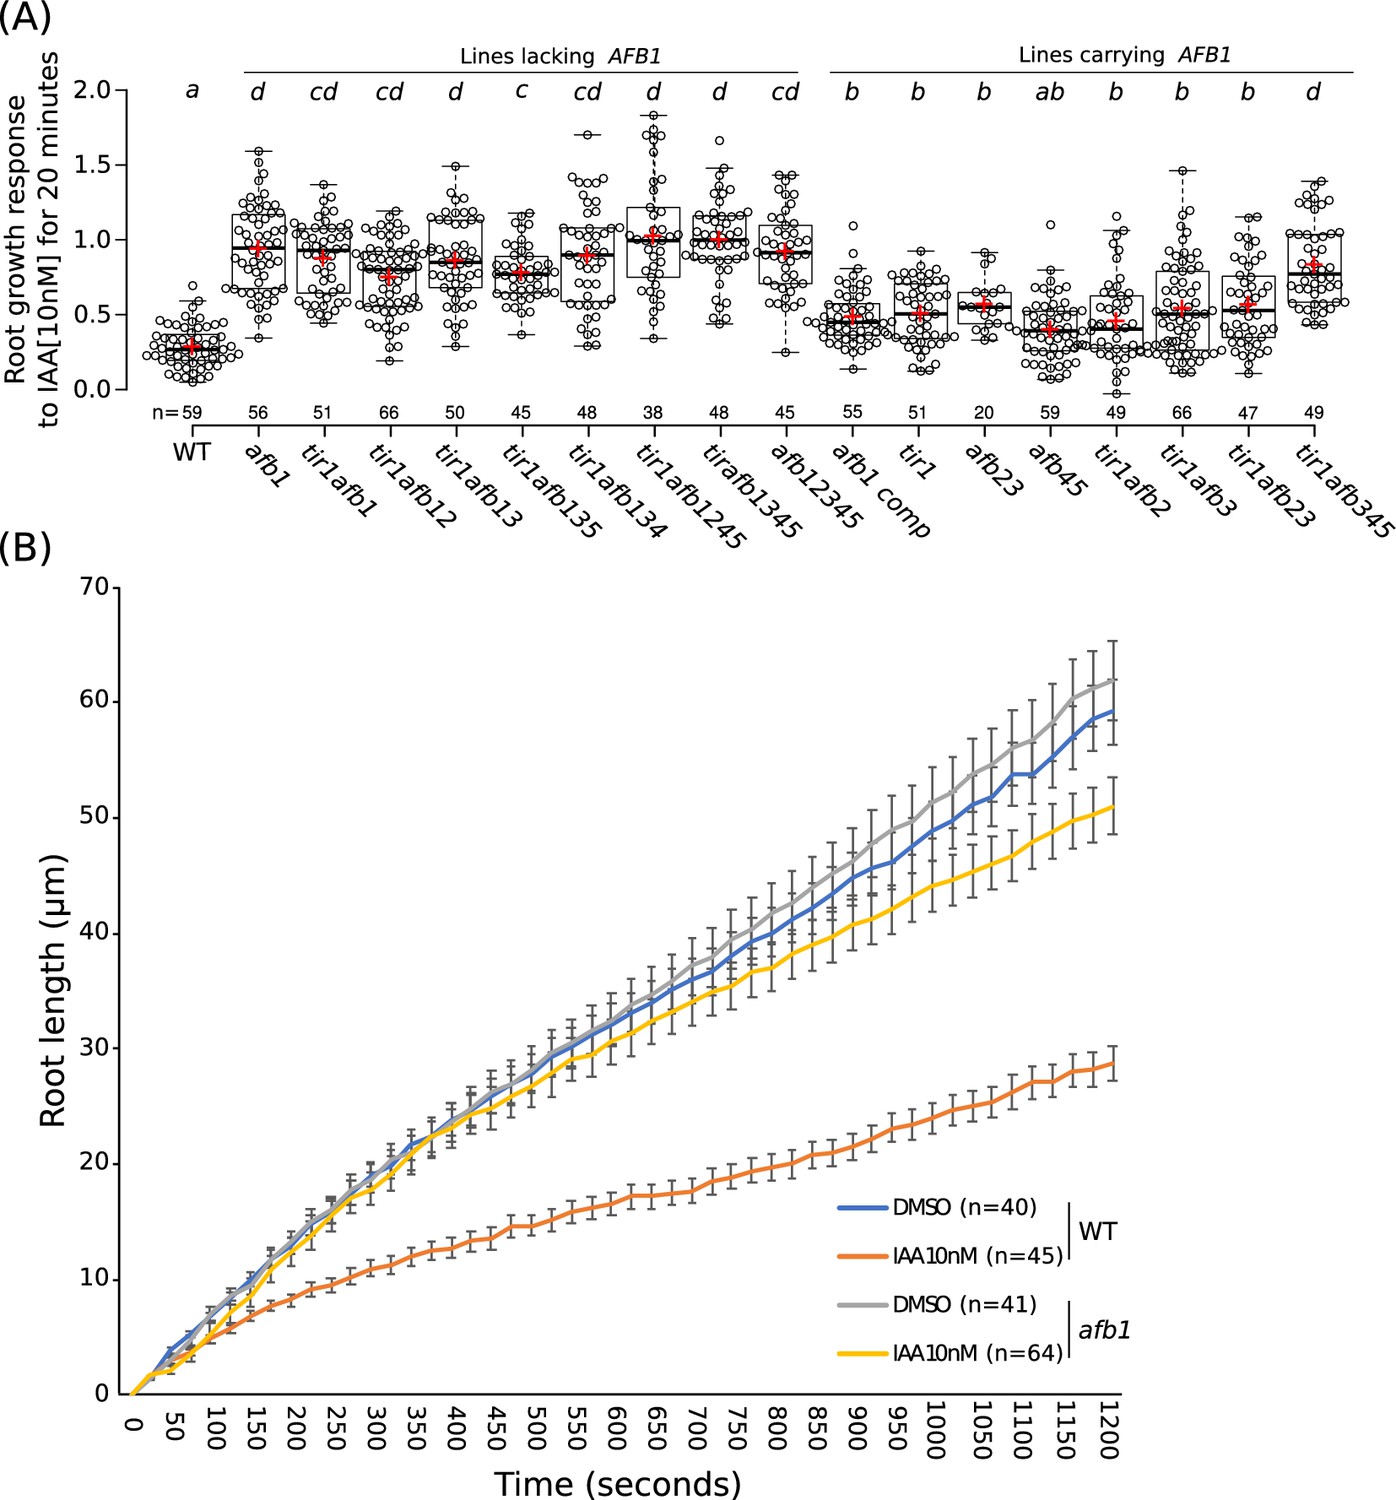
The role of AFB1 in rapid inhibition of root elongation.
(A) Plot of the root growth response of different genotypes to 10 nM IAA for 20 min. Black circles represent the response for one single root. Red crosses indicate the mean. Black bars indicate median. n indicates the number of roots obtained from three independent experiments. Letters indicate statistical differences according to one-way ANOVA coupled with post hoc Tukey honestly significant difference (HSD) test (p=0.05). (B) Graph of the root length in μm according to time in seconds of WT and afb1 in DMSO and 10 nM IAA treatments (blue, gray, orange and yellow lines, respectively). Bars indicates standard deviation of the mean (SEM). n indicates the number of roots obtained from three independent experiments.
-
Figure 6—source data 1
Source data for root elongation assay.
- https://cdn.elifesciences.org/articles/54740/elife-54740-fig6-data1-v2.xlsx
Figure 6—figure supplement 1
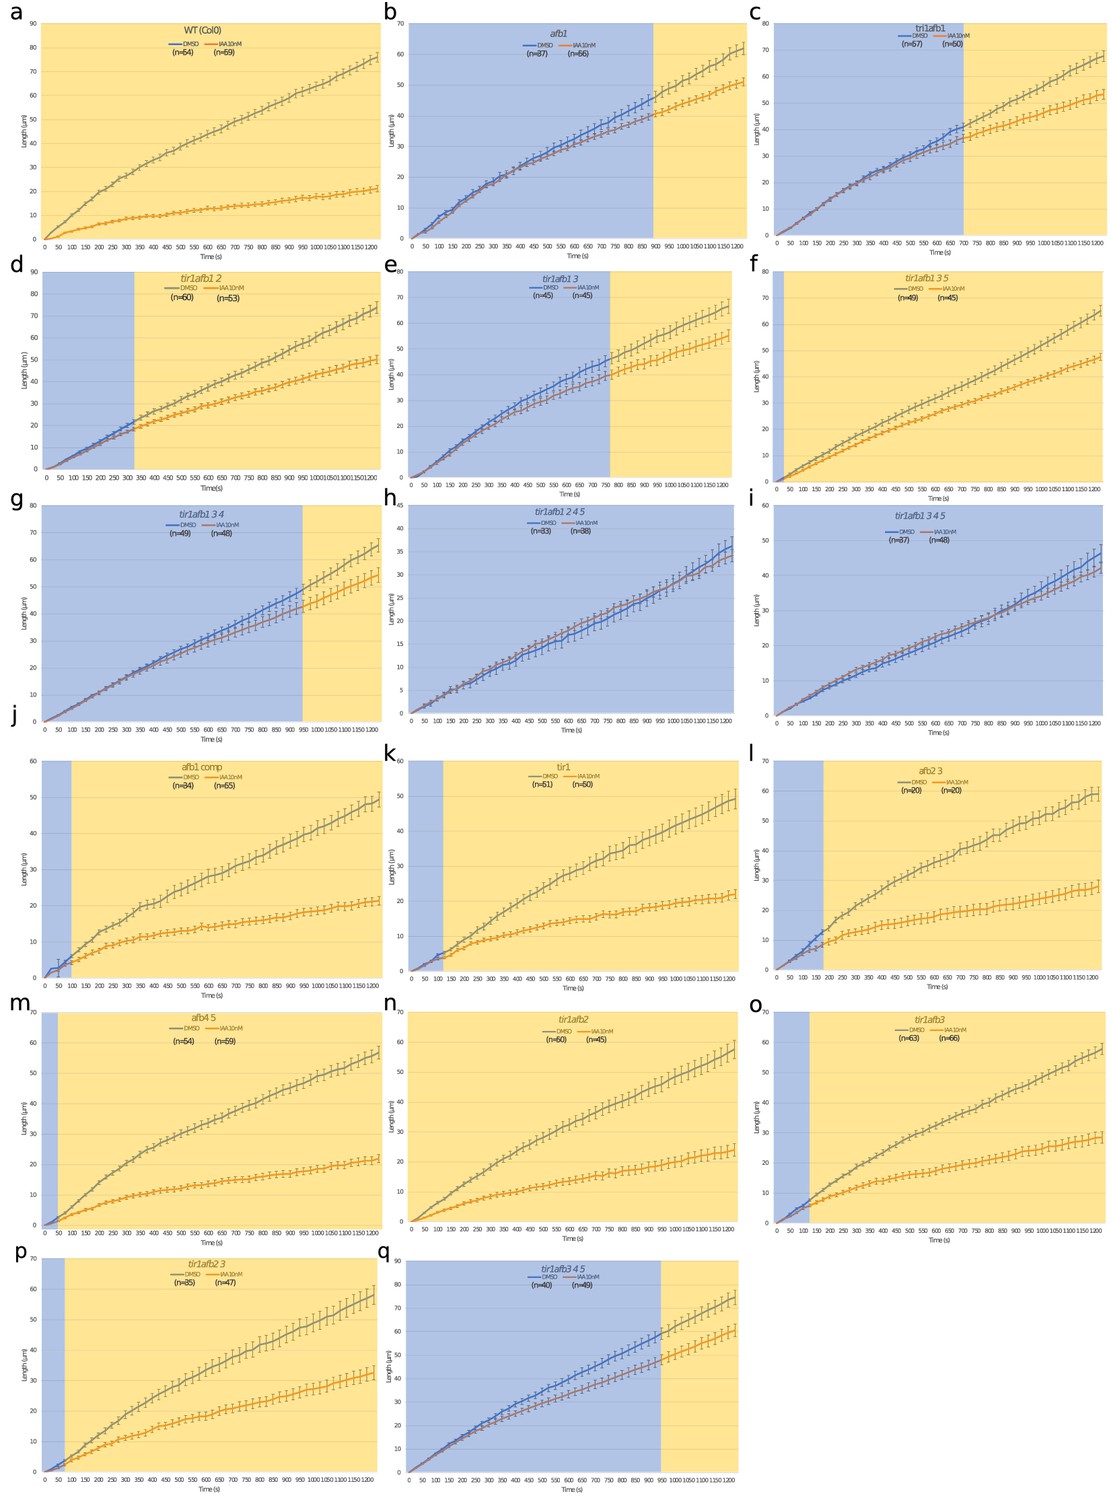
Time courses of root elongation.
Graph of the root length in μm versus time in seconds with DMSO and 10 nM IAA treatments (blue and orange lines, respectively) in wild type (a), afb1 (b), tir1afb1 (c), tir1afb12 (d), tir1afb13 (e), tir1afb135 (f), tir1afb134 (g), tir1afb1245 (h), tir1afb1345 (i), afb1 AFB1-mCitrine#7 (j), tir1 (k), afb23 (l), afb45 (m), tir1afb2 (n), tir1afb3 (o), tir1afb23 (p), tir1afb345 (q). Bars indicate standard deviation of the mean (SEM). Blue region indicates no differences between the length of treated and non-treated conditions while pale orange indicates significant difference according to two ways t-test (p=0.05). n indicates the number of roots imaged in three independent experiments.
Figure 6—figure supplement 2
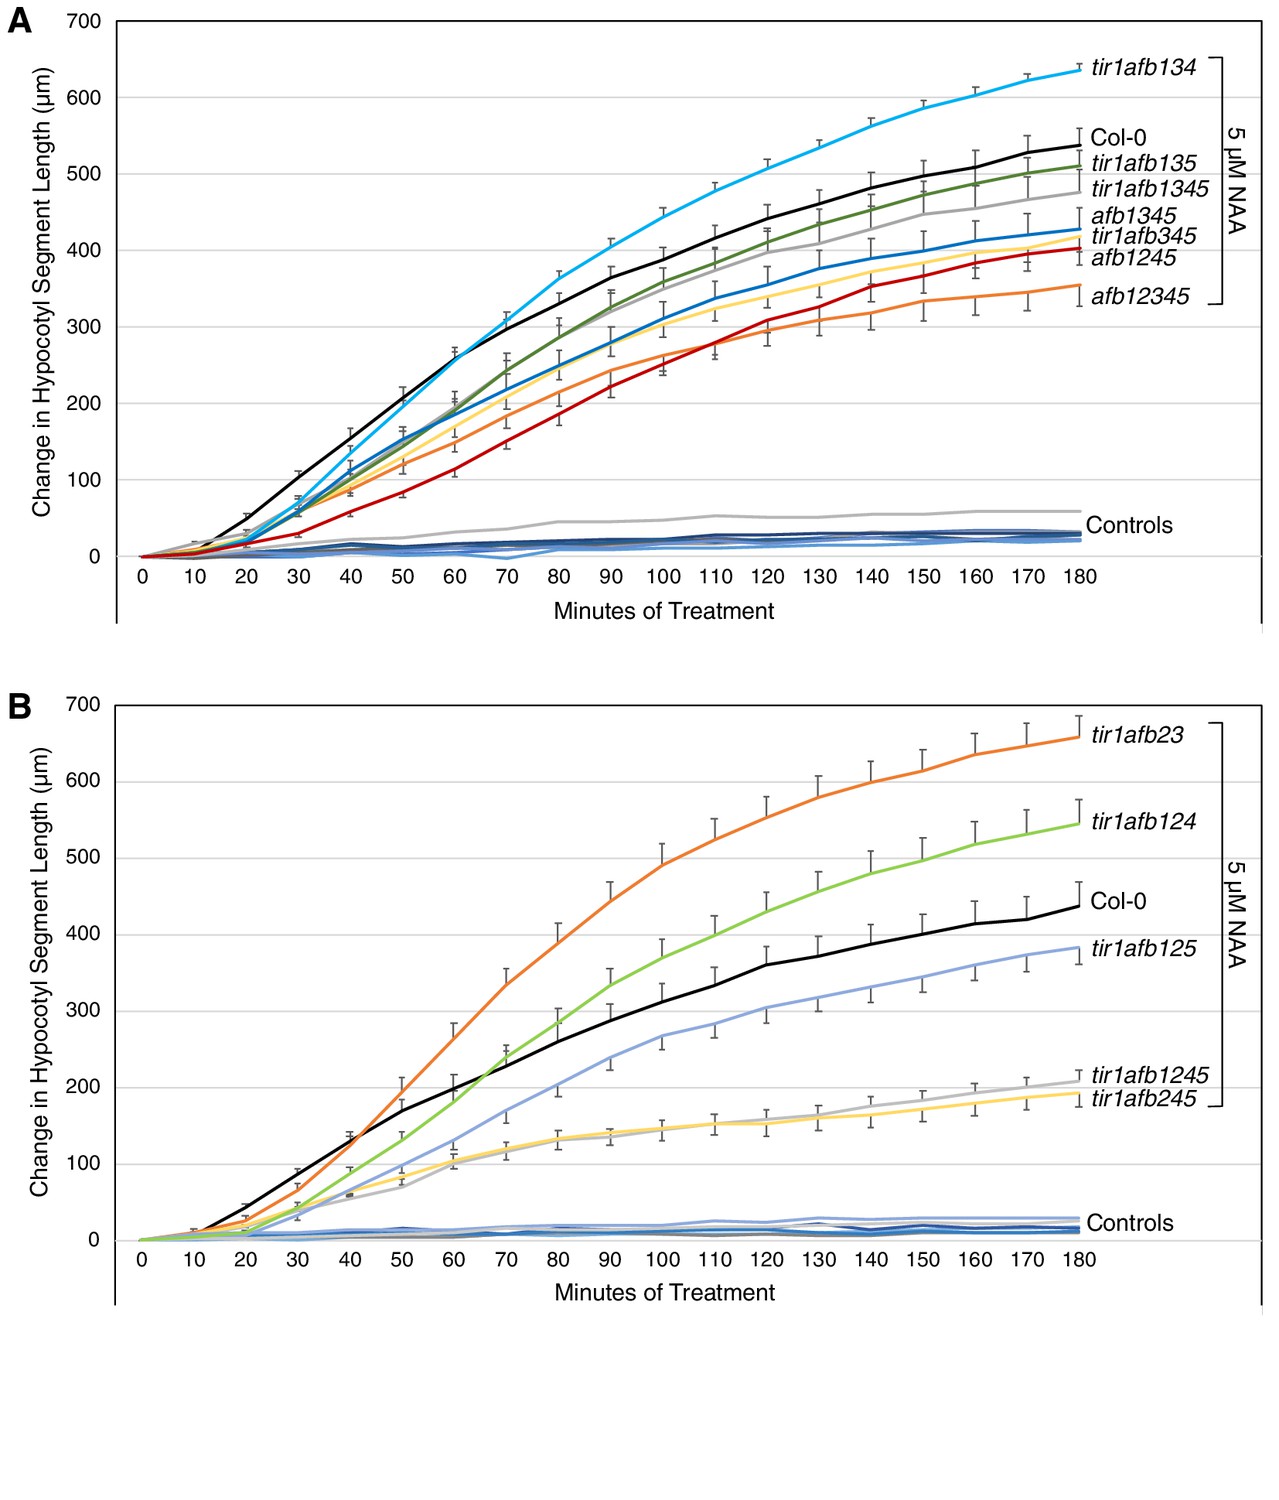
Graphs showing changes in length of hypocotyl segments treated with 5 µM NAA or 0.025% ethanol (Controls) for three hours.
The genotypes shown on the right correspond to the nearest curve with NAA treatment at the 180 min timepoint. The curves for the control treatment are not labeled. Error bars show standard error of the mean. For pairwise t-test p values for each treated genotype at each time point, see Supplementary file 7. The experiments shown in panels (A) and (B) were done on different days.
-
Figure 6—figure supplement 2—source data 1
Source data for hypocotyl elongation assay.
- https://cdn.elifesciences.org/articles/54740/elife-54740-fig6-figsupp2-data1-v2.xlsx
Figure 6—video 1
Movie of wild type root tip with mock (DMSO, left panel) and 10 nM IAA (right panel) treatments.
Images were acquired every 25 s for 20 min. Scale bar 100 μm.
Figure 6—video 2
Movie of afb1-3 root tip with mock (DMSO, left panel) and 10 nM IAA (right panel) treatments.
Images were acquired every 25 s for 20 min. Scale bar 100 μm.
Figure 7 with 1 supplement
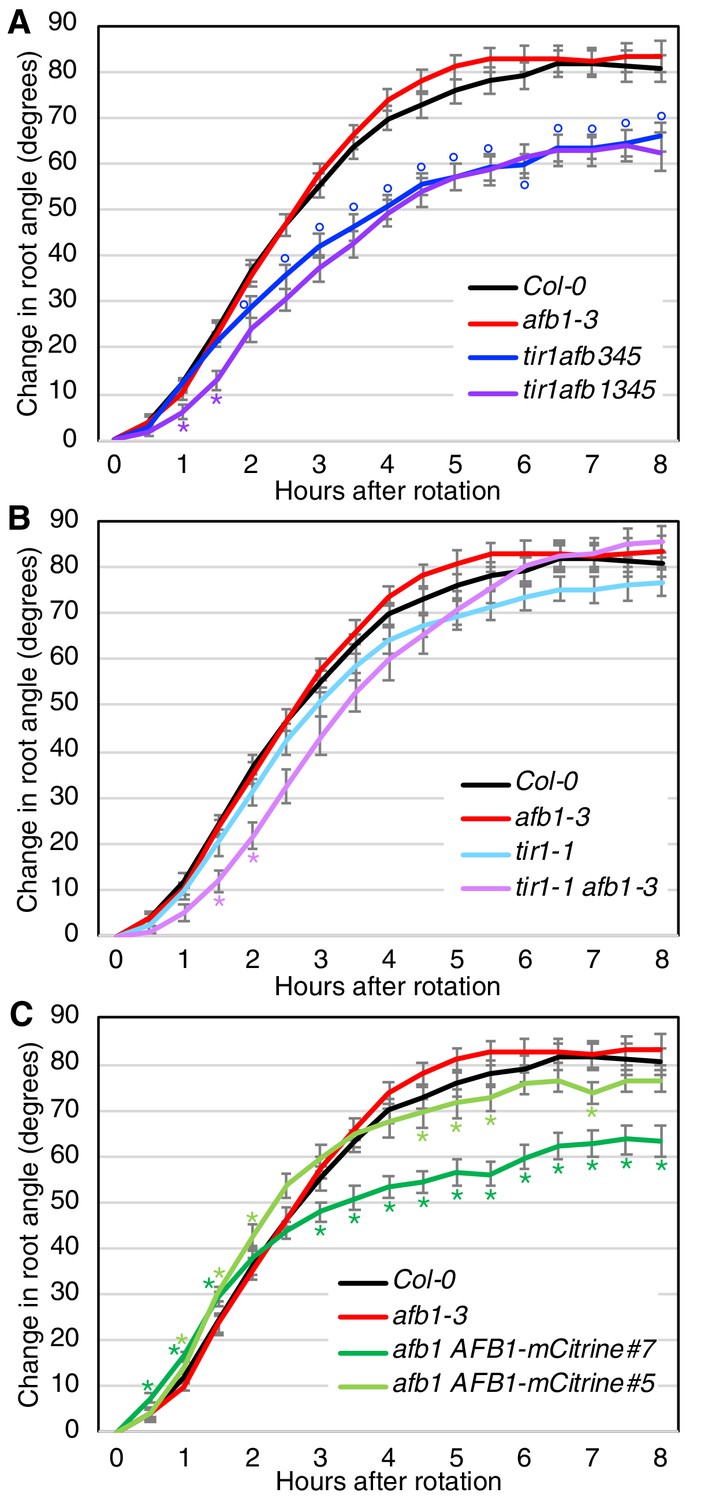
Gravitropic response of tir1/afb lines.
Sixteen seedlings for each line were imaged every 30 min after rotating the plates 90° and the mean difference in the root-tip angle from the original angle ± SEM are plotted versus time. Col-0 and afb1-3 are included in all panels for comparison. Time points at which lines differed from Col-0 are indicated by degree symbols (°) and differences between lines with and without the afb1 mutation are indicated by asterisks (*) of the colors shown in the legend (t-test, p<0.05). Colors: black, Col-0; red, afb1-3; blue, tir1afb345; purple, tir1afb1345; cyan, tir1-1; lavender, tir1-1 afb1-3; light green, afb1-3 AFB1-mCitrine#5; and dark green, afb1-3 AFB1-mCitrine#7.
-
Figure 7—source data 1
Source data for gravitropism assay.
- https://cdn.elifesciences.org/articles/54740/elife-54740-fig7-data1-v2.xlsx
Figure 7—figure supplement 1
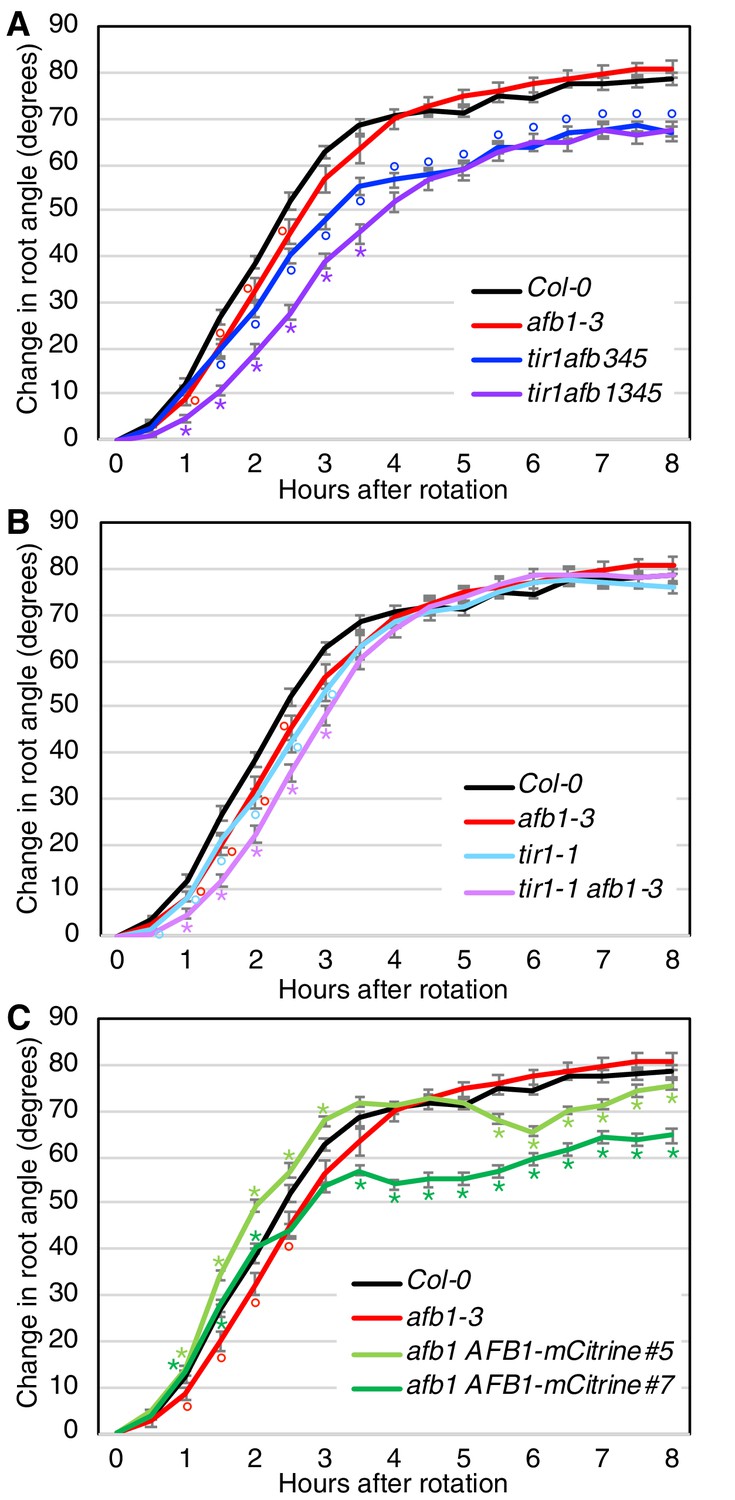
Gravitropic response of tir1/afb lines, repeat experiment.
Seedlings for each line were imaged every 30 min after rotating the plates 90° and the mean difference in the root-tip angle from the original angle ± SEM are plotted versus time. Col-0 and afb1-3 are included in all panels for comparison. Time points at which lines differed from Col-0 are indicated by degree symbols (°) and differences between lines with and without the afb1 mutation are indicated by asterisks (*) of the colors shown in the legend (t-test, p<0.05). Colors (sample size): black, Col-0 (33); red, afb1-3 (24); blue, tir1afb345 (42); purple, tir1afb1345 (41); cyan, tir1-1 (39); lavender, tir1-1 afb1-3 (40); light green, afb1-3 AFB1-mCitrine#5 (39); and dark green, afb1-3 AFB1-mCitrine#7 (41).
-
Figure 7—figure supplement 1—source data 1
Source data for gravitropism assay.
- https://cdn.elifesciences.org/articles/54740/elife-54740-fig7-figsupp1-data1-v2.xlsx
Figure 8
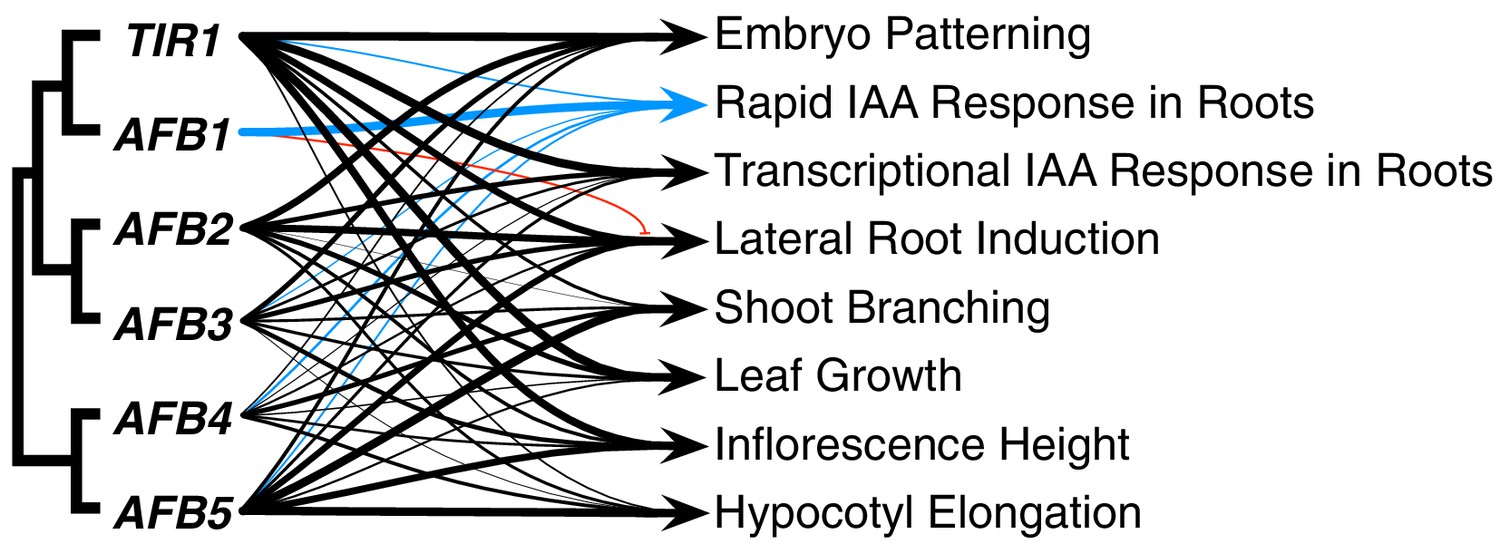
Summary of each TIR1/AFB gene’s contributions to different responses.
The line weights reflect the relative importance for each gene’s roles. The blue lines represent contributions to the rapid IAA-mediated inhibition of root elongation and the red line with the bar end indicates the antagonistic role observed for AFB1 in lateral root production.
Additional files
-
Supplementary file 1
Summary of phenotypes for mutant combinations.
- https://cdn.elifesciences.org/articles/54740/elife-54740-supp1-v2.xlsx
-
Supplementary file 2
Transmission of the sextuple mutant through megagametophytes and pollen.
- https://cdn.elifesciences.org/articles/54740/elife-54740-supp2-v2.xlsx
-
Supplementary file 3
List of databases for the sequences used in making the gene trees.
- https://cdn.elifesciences.org/articles/54740/elife-54740-supp3-v2.docx
-
Supplementary file 4
List of primers used for cloning and genotyping.
- https://cdn.elifesciences.org/articles/54740/elife-54740-supp4-v2.xlsx
-
Supplementary file 5
Nexus file for inferring the F-Box-LRR family tree.
- https://cdn.elifesciences.org/articles/54740/elife-54740-supp5-v2.nex
-
Supplementary file 6
Nexus file for inferring the TIR1+AFB1 tree.
- https://cdn.elifesciences.org/articles/54740/elife-54740-supp6-v2.nex
-
Supplementary file 7
Statistical tests.
- https://cdn.elifesciences.org/articles/54740/elife-54740-supp7-v2.xlsx
-
Supplementary file 8
Time Lapse Analysis 20 min Macro.
- https://cdn.elifesciences.org/articles/54740/elife-54740-supp8-v2.txt
-
Transparent reporting form
- https://cdn.elifesciences.org/articles/54740/elife-54740-transrepform-v2.second.docx
Download links
A two-part list of links to download the article, or parts of the article, in various formats.
Downloads (link to download the article as PDF)
Open citations (links to open the citations from this article in various online reference manager services)
Cite this article (links to download the citations from this article in formats compatible with various reference manager tools)
Genetic analysis of the Arabidopsis TIR1/AFB auxin receptors reveals both overlapping and specialized functions
eLife 9:e54740.
https://doi.org/10.7554/eLife.54740


