Pattern regulation in a regenerating jellyfish
- Sorbonne Université, CNRS, Laboratoire de Biologie du Développement de Villefranche-sur-mer (LBDV), France
Figures
Figure 1 with 2 supplements

Regenerative potential of Clytia hemisphaerica jellyfish.
(A–D) Anatomy of Clytia jellyfish. (A) Swimming female jellyfish (m: manubrium; g: gonads; tb: tentacle bulbs). (B) Tetraradial body organization: each umbrella quadrant comprises a radial canal (rc), a gonad (g), and up to 16 tentacle bulbs (tb). The tetraradially-shaped manubrium (m) lies at the center. A peripheral circular canal (cc) connects the tentacle bulbs. Radial smooth muscle fibers (smooth m.) and circular striated muscles (striated m.) line the subumbrellar surface. (C) The umbrella comprises an epithelial exumbrella layer, a connective mesoglea, and a subumbrella layer, constituted by an inner layer associated with the mesoglea and two layers of muscle fibers (smooth and striated). (D) Diagram of the manubrium, lateral view, showing the oral (distal)-aboral (proximal) axis. The base comprises four gastric pouches, connected to the four radial canals. The oral area is organized into four folds (lips). (E–J) Regenerative potential of Clytia. In each cartoon the cut is indicated by an orange dotted line, removed parts are veiled. (E) Manubrium regeneration is completed in 4 days, the white dashed line at 24 hpd circles the cell accumulation. (F) Gonad regeneration over 8 days. (G) Tentacle bulb regeneration over 8 days. (H) Detail of the tip of a regrowing radial canal shown by fluorescence microscopy; neural fibers associated with the canal are stained with an anti-tyr-Tub antibody (red). (I) A quarter jellyfish fragment that morphed within 24 hr into a small jellyfish. A tiny new manubrium was visible after 4 days (arrowhead). (J) Fragment from which the entire bell margin had been removed: it sealed upon itself without further regeneration. Abbreviations: (dpd) days post-dissection, (hpd) hours post-dissection. Scale bars- A,I-J: 1 mm; E-G: 100 µm; H: 20 µm.
Figure 1—figure supplement 1
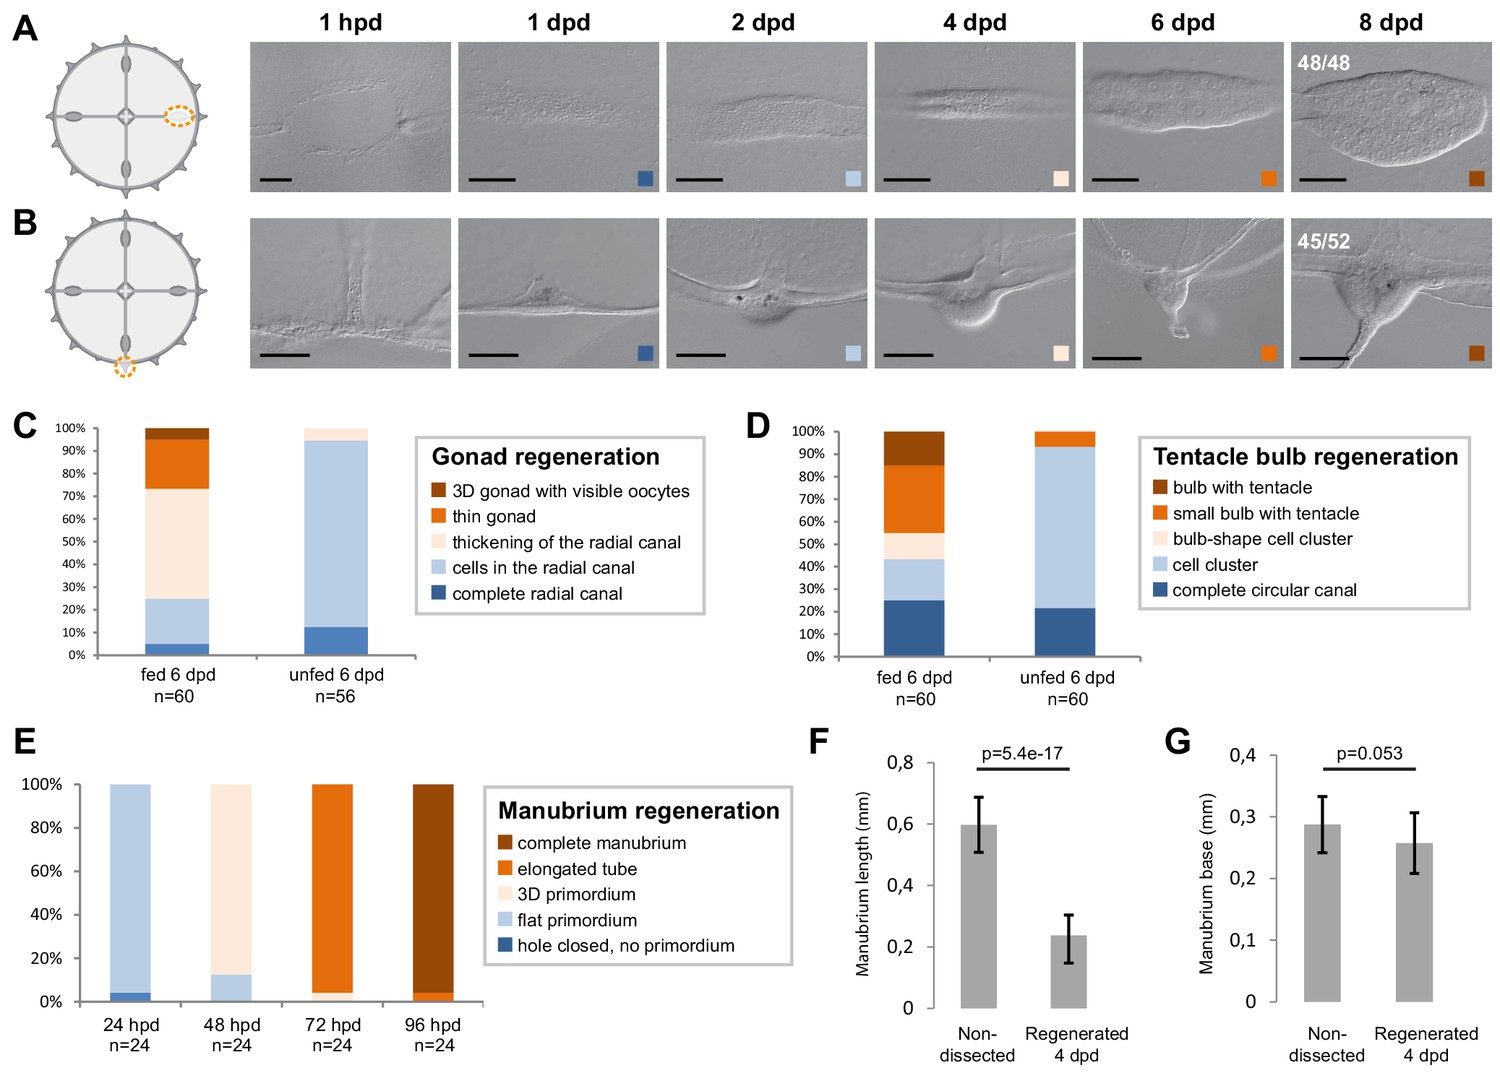
Organ regeneration in relation to feeding status.
(A,B) Examples of organ ablation in fed individuals, each illustrated by a cartoon showing the cut (as an orange dotted line) and images of the regenerate at successive times. The regenerated gonad (A) and tentacle bulb (B) were both visible after 6 days. (C–E) Quantification of regeneration of gonads, tentacle bulbs and manubria, respectively, in fed versus unfed animals, as indicated. Both groups were fed 12 hr before the dissection, and fed animals were given Artemia every day until the end of the experiment. For gonads (C) and bulbs (D), regeneration rates were variable, but proceeded more reliably in fed jellyfish. (E) Manubrium regeneration was highly stereotypical. (F, G) Comparison of the dimension of endogenous versus regenerated manubria (4 dpd). The length from base to lip (F) was longer for endogenous manubria (n = 20 jellyfish), while their bases (G) were of comparable sizes. Statistics: two tailed t-test. Raw data for (C–G): Figure 1—figure supplement 1—source data 1. The images in A and B are also shown in Figure 1F and G, respectively. Scale bars: 100 µm.
-
Figure 1—figure supplement 1—source data 1
Raw data for the plots shown in Figure 1—figure supplement 1C–G.
- https://cdn.elifesciences.org/articles/54868/elife-54868-fig1-figsupp1-data1-v2.xlsx
Figure 1—figure supplement 2
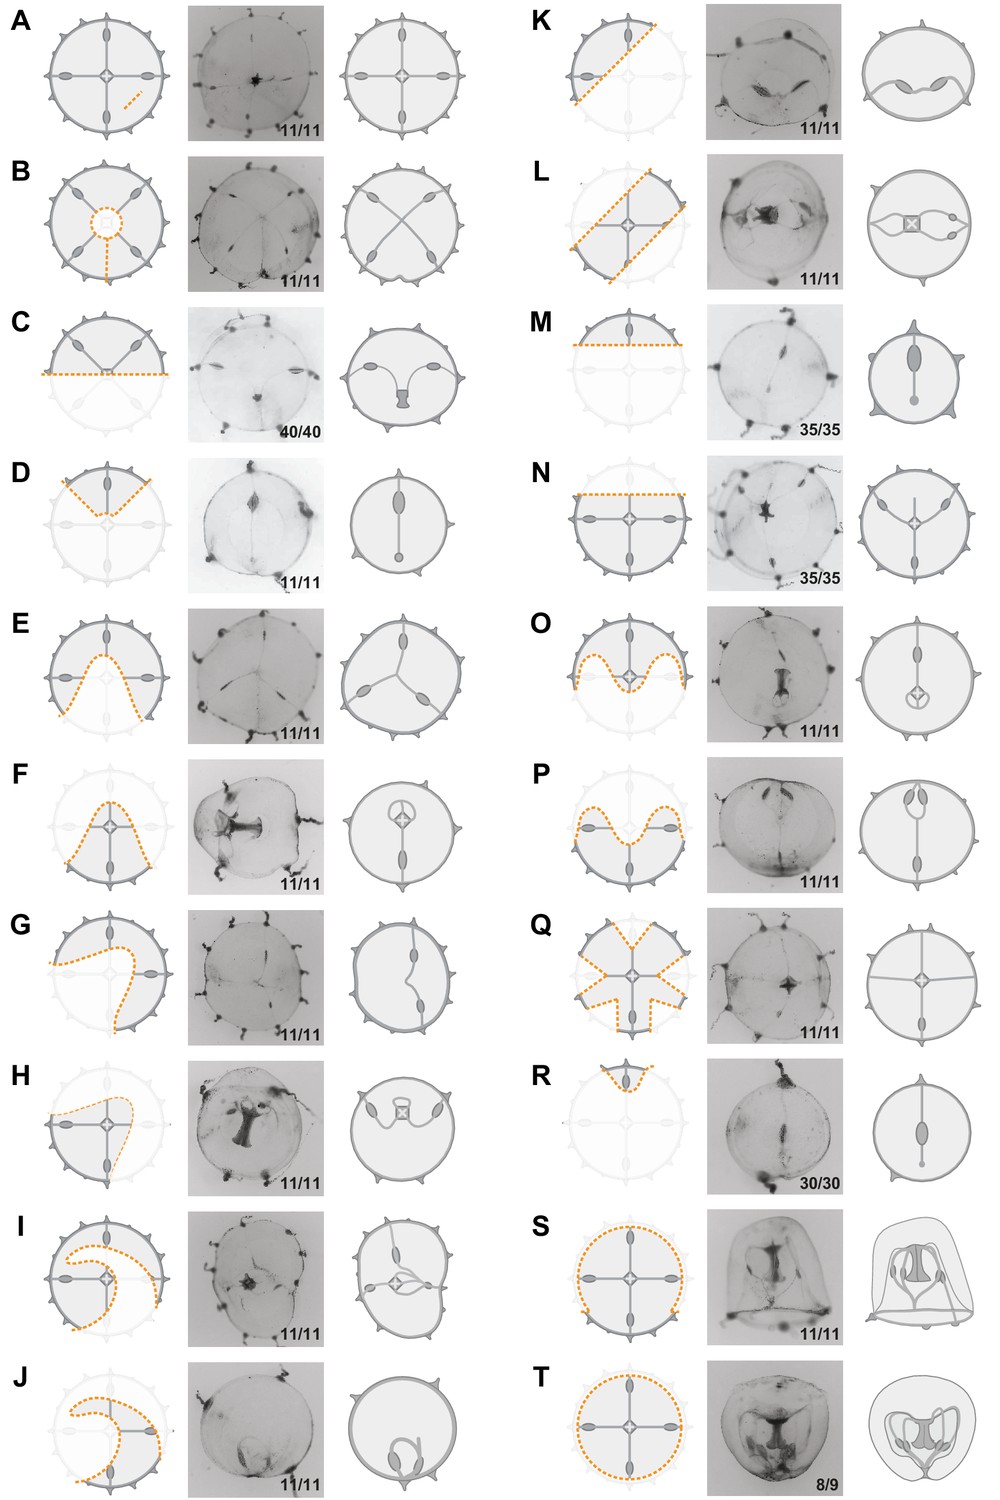
Umbrella restorative potential.
Examples of different kinds of ablation. Left cartoon illustrates the cut (as an orange dotted line, removed parts are veiled), in the middle is an image of the regenerate at 24 hpd, and to the right there is a cartoon illustrating the regenerate. All types of damage (A–T) triggered remodeling of the umbrella, driven by rapid reduction of the cut edges. Segments of severed peripheral circular canal fused together, defining the final perimeter of the regenerate. Circular shape was largely restored in all cases, but the original tetraradial symmetry was not recovered (exceptions in A, B). The images in C, D and T are also shown in Figures 8A, 1I and J, respectively.
Figure 2 with 1 supplement

Manubrium regeneration, but not umbrella remodeling, requires cell proliferation.
(A) Top: schematics of the different stages of manubrium regeneration following manubrium ablation. Below: Phalloidin staining (white) and EdU incorporation (1 hr pulse) at successive time points following manubrium ablation. EdU incorporation is detected from 24 hpd onward (quantification in B). Orange arrowhead: open gastric cavity from stage 3. Orange dotted line at 6 hpd: remodeling wound-area. The number of regenerating manubria used for quantification is indicated by the ‘n’ below each time point. (B, C) Quantification of EdU incorporation in the manubrium regeneration area (B) and in the radial canal (C). In (C), a 250 µm section of the MG-segment, at a standard distance of 250 µm from the manubrium, was considered for quantification. n.d.: radial canal from non-dissected medusae. Statistical test for (B) and (C): p values calculated with the Mann Whitney Wilcoxon test. Given that each time point is compared to the previous one, a Bonferroni correction was applied for identifying significant p-values: 0.0125 (B) and 0.01 (C), n.s. non-significant values. The number of individuals used for quantification is indicated by ‘n’ below each time point. (D) DIC (left) and phalloidin staining (right) images of regenerating manubria in control vs hydroxyurea (HU) treatment (0–48 hpd). HU treatment blocks blastema proliferation, but does not prevent the initial accumulation of cells. (E) DIC images of regenerating manubria, in control or HU-treated conditions (bottom: HU treatment for 0–48 hpd followed by washout). HU treatment prevents manubrium outgrowth and the correct formation of lobes. Orange arrowheads show the opening of the gastric cavity in control and HU-washed regenerating animals. (F, G) Remodeling does not require cell proliferation. (F) 24 hr after jellyfish bisection, EdU incorporation (12 hr pulse) is detected in the manubrium and close to the remodeling margin (left image: Hoechst-stained nuclei in blue, EdU in red; right: EdU in black). (G) Remodeled jellyfish fragments, in control conditions (left) or HU-treated (right). HU incubation does not affect shape restoration. Scale bars: A,D-F: 100 µm, G: 1 mm.
-
Figure 2—source data 1
Raw data for the plots shown in Figure 2B,C and Figure 2—figure supplement 1B,E.
- https://cdn.elifesciences.org/articles/54868/elife-54868-fig2-data1-v2.xlsx
Figure 2—figure supplement 1
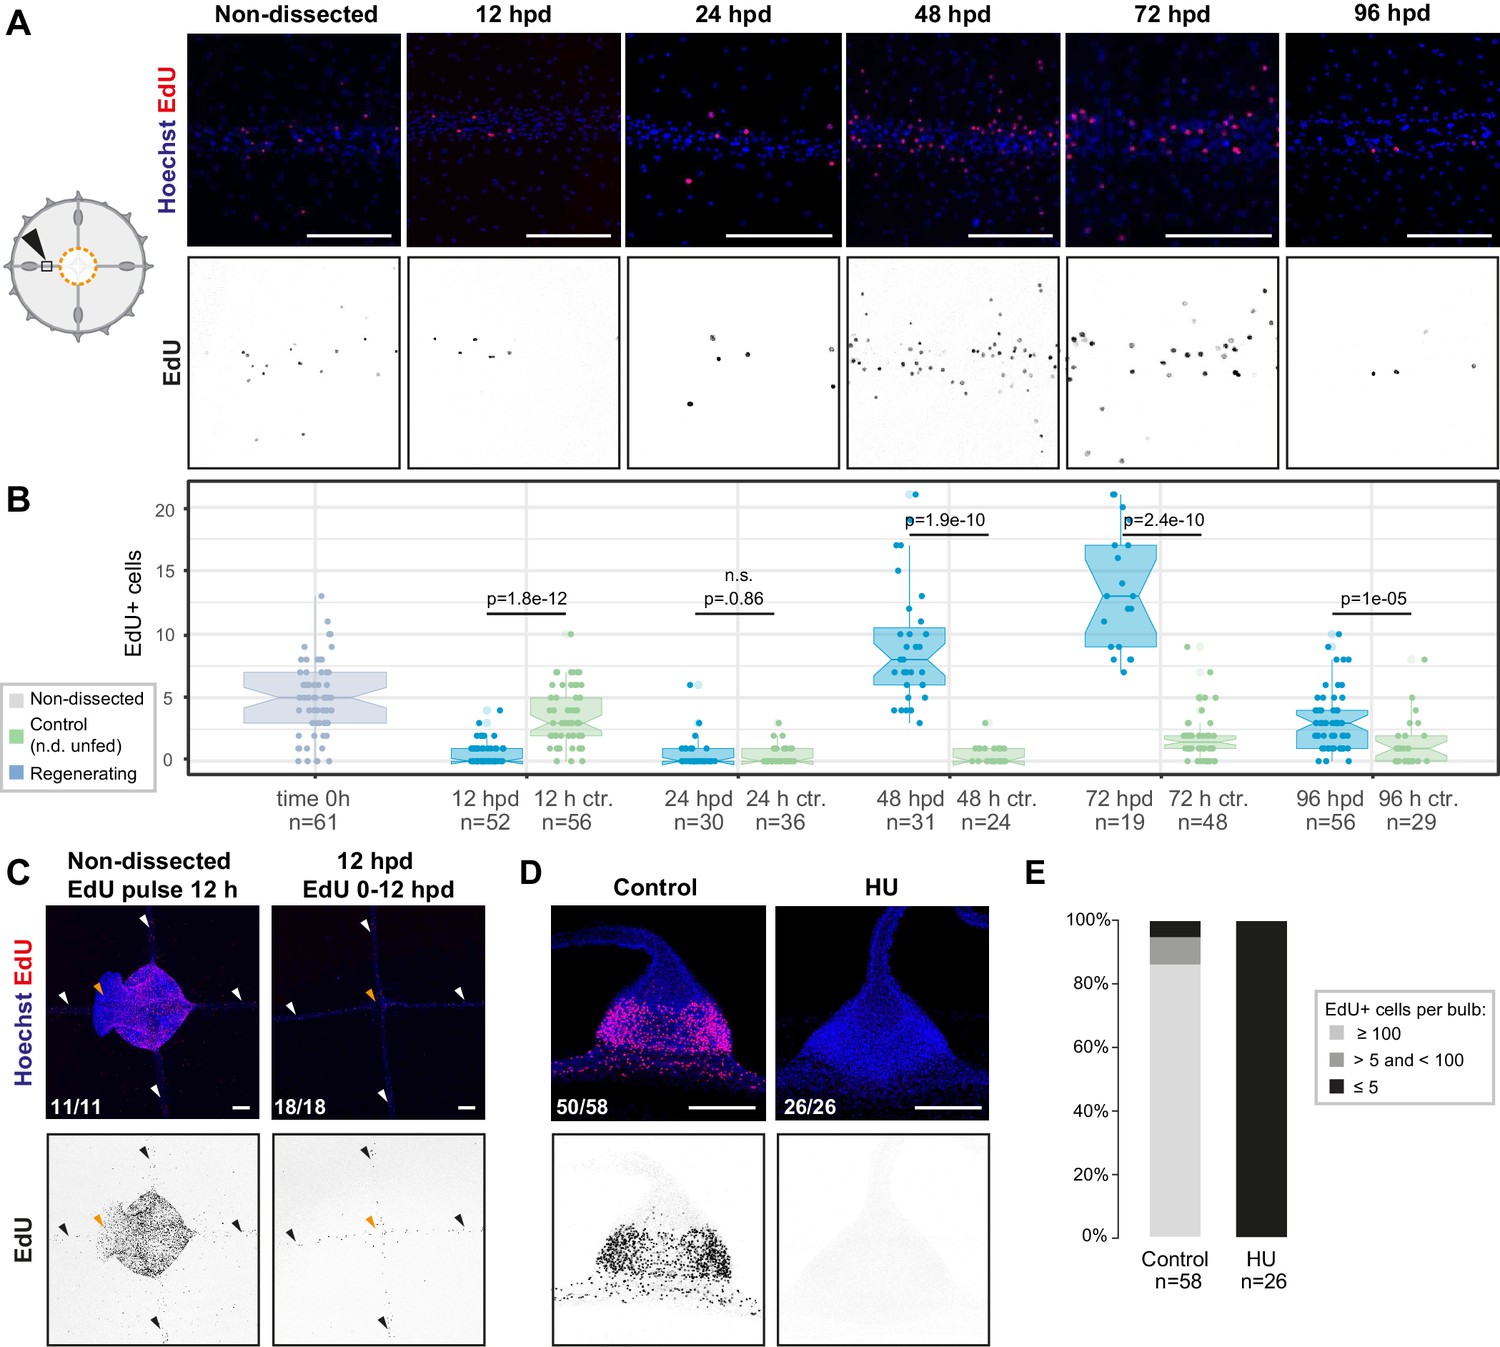
Cell proliferation increases in the radial canals during manubrium regeneration, and is efficiently blocked by hydroxyurea treatment.
(A, B) EdU incorporation at successive time points following manubrium ablation (1 hr pulse) detects cell proliferation in the MG-segment of radial canals. (A) Images of EdU detection (red in top panels; black in lower panels) within the MG-segment of radial canals. (B) Quantification, raw data presented in Figure 2—source data 1. Same data as Figure 2C, here compared to the unfed control. At 48 hpd and 72 hpd the number of EdU-positive cells in regenerating medusae (in blue) was significantly higher compared to control (shown in green; controls were non-dissected and unfed, indicated as n.d. unfed) animals. The number of radial canals per condition (‘n’) used for the quantification is reported below the boxplots. Statistical test: Mann Whitney Wilcoxon. (C) EdU incorporation detected, following a 12 hr pulse, in the central area of non-dissected (left) and manubrium–ablated (right) medusae; colors as in (A). EdU incorporation around the ablation site (0–12 hpd) is very low. (D) Images of EdU detection in tentacle bulbs, following a 1 hr pulse, in animals incubated in HU for 3 hr (EdU added after 2 hr; right) or untreated (left); colors as in (A). No EdU-positive cells are detected following HU treatment. (E) Quantification of EdU-positive cells in tentacle bulbs from jellyfish treated as in (D). The number of tentacle bulbs used for the quantification is reported below each bar. Raw data: Figure 2—source data 1. Scale bars: 100 µm.
Figure 3 with 1 supplement
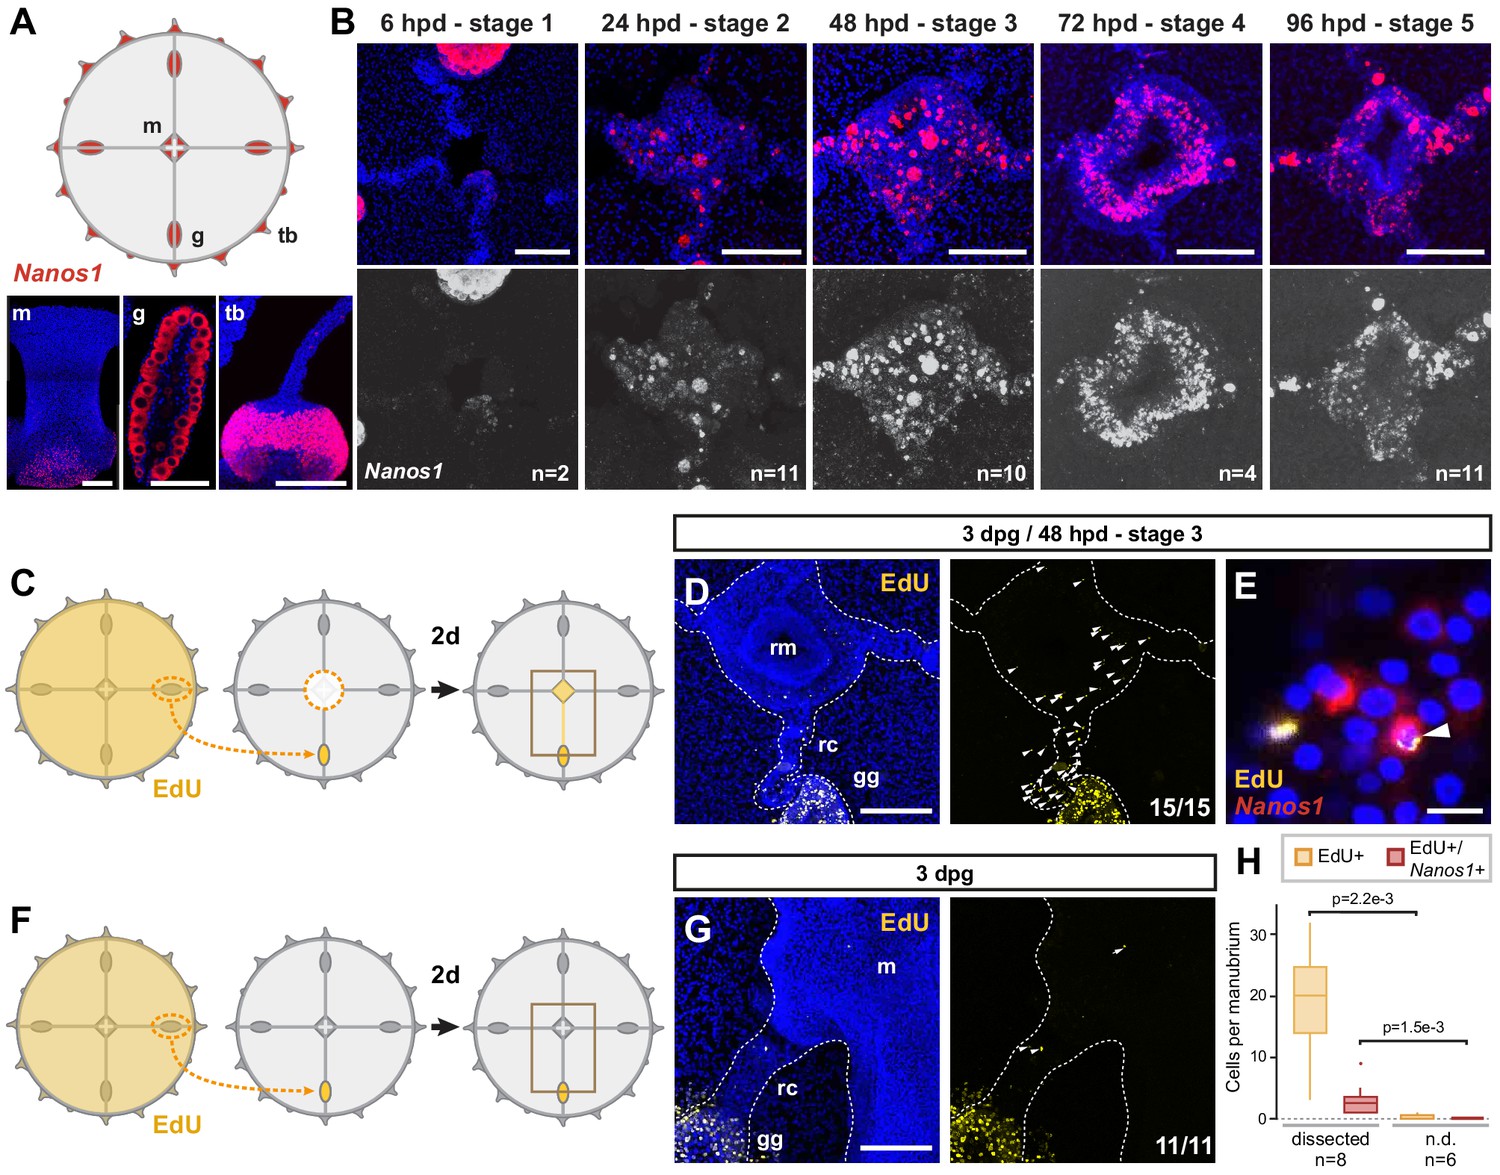
Dynamics of i-cell migration during manubrium regeneration.
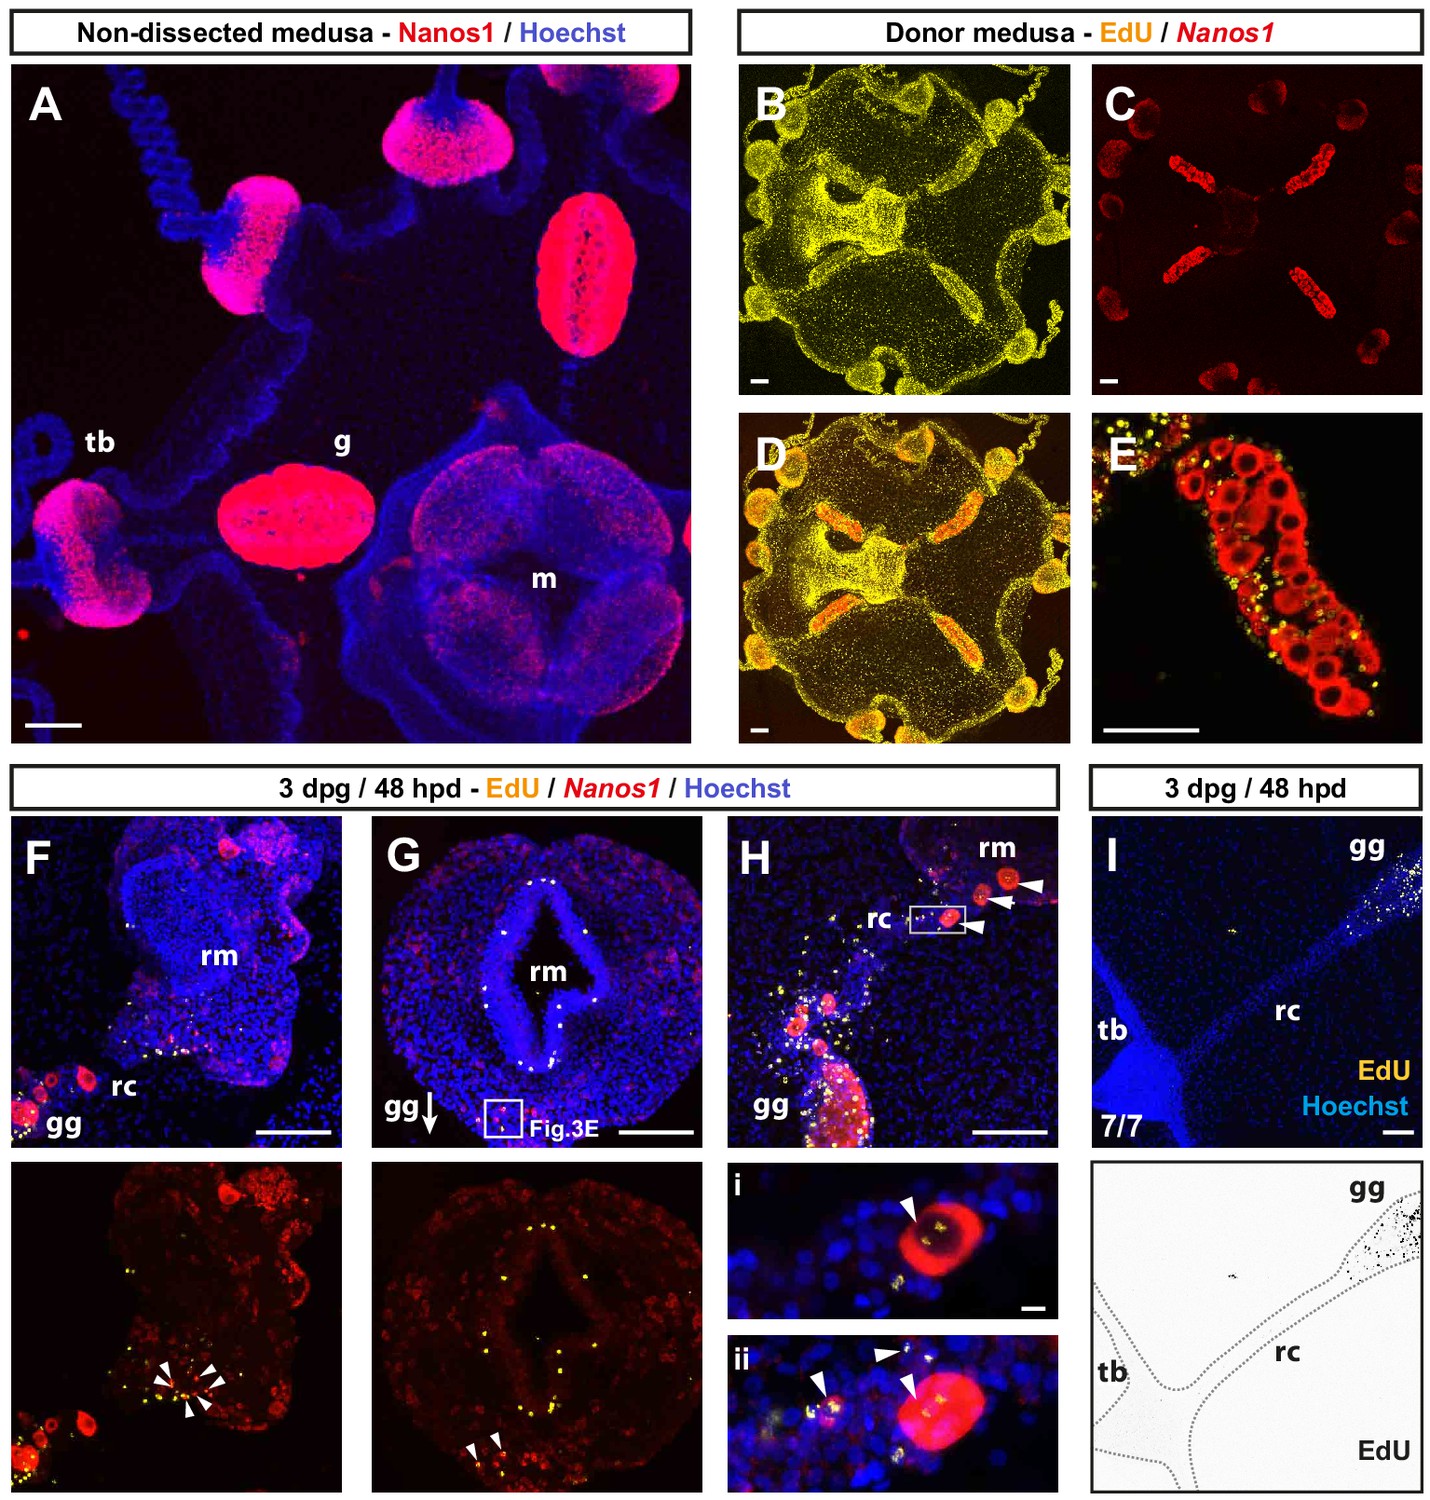
(A) Cartoon illustrates the distribution of CheNanos1-expressing cells (in red), also shown by FISH images in the bottom panels (CheNanos1+ cells in red; nuclei counter-stained with Hoechst, in blue). CheNanos1-expressing cells reside at the base of the manubrium (m), in the gonads (g) and in a band of epidermis around the tentacle bulbs (tb). (B) FISH detection of CheNanos1 in manubrium-ablated jellyfish, showing CheNanos1-expressing cells in the manubrium anlage and in the radial canals, at successive stages of manubrium regeneration. The larger cells are likely maturing oocytes. Colors in top row as in (A); CheNanos1 mRNA detection alone is shown in white in the bottom images. (C–G) Grafting experiments detecting cell migration from gonad to the site of manubrium regeneration. (C) Diagram of experimental design: the donor medusa is incubated with EdU (24 hr pulse), one gonad is then excised and grafted at the place of one of the gonads of a non-treated host, which is then left to heal for 24 hr. Host manubrium is dissected, and regeneration proceeds for 48 hr. (D) Images from a host medusa 48 hpd - hours post manubrium dissection (3 days post graft - dpg). Left panel shows 2-channels image with EdU-positive cells (yellow), and nuclear counterstain (Hoechst, blue), right panel shows EdU-positive cells alone (white arrowheads). EdU-positive cells are detected within the radial canal connecting the grafted gonad to the regenerating manubrium, and in the manubrium primordium itself. (E) Higher magnification image from host medusa, showing putative migrating i-cell (white arrowhead), with colocalization of EdU and CheNanos1 FISH staining - EdU cells (yellow), CheNanos1 FISH (red), Hoechst nuclear counterstain (blue). (F) Diagram of control experiment, performed in parallel to (C): an EdU-labeled gonad (24 hr pulse) is grafted to a non-regenerating host (manubrium non dissected), let recover for 24 hr. EdU is detected in the host after two more days. (G) Images from a host control jellyfish; colors as in (D). Only few EdU-positive cells are detected in the non-dissected manubrium and the radial canal connected to the grafted gonad (white arrowheads; detail from larger image shown in Figure 3—figure supplement 1G). (H) Quantification of EdU-positive and EdU/CheNanos1 double positive cells in regenerating manubria compared to non-regenerating manubria; raw data: Figure 3—source data 1. Abbreviations: (m) manubrium, (rm) regenerating manubrium, (g) gonad, (gg) grafted gonad, (tb) tentacle bulb, (rc) radial canal, (dpg) days post grafting, (dpd) days post dissection. Statistical test: p values calculated with the Mann Whitney Wilcoxon test. Scale bars: A-D,G: 100 µm, E: 10 µm.
-
Figure 3—source data 1
Raw data for the plots shown in Figure 3H.
- https://cdn.elifesciences.org/articles/54868/elife-54868-fig3-data1-v2.xlsx
Figure 3—figure supplement 1
I-cell migration during manubrium regeneration.
(A) Fluorescent in situ hybridization (FISH) showing the localization of CheNanos1-expressing cells (shown in red), in a two-week-old non-operated medusa. Blue: Hoechst-counter-stained nuclei, here and all other panels, where present. (B–E) Gonad-donor medusae, showing double staining for EdU, following a 24 hr pulse: EdU only in (B), (yellow), CheNanos1 FISH only in (C) (red), overlay in (D, E) Gonad of a donor medusa, showing EdU+/CheNanos1+ cells in the gonad (single plane of z-stack). (F–H) Three gonad-grafted regenerating medusae showing single and double (white arrowheads) labeling for EdU (yellow) and CheNanos1 FISH (red), in the regenerating manubrium and in the connecting radial canal. White square in G indicates the area shown in Figure 3E, while the arrow indicates the position of the grafted gonad (gg, out of field). (H) EdU/Nanos1 double positive small oocytes (white arrowheads), originating from the grafted gonad, are found in the regenerating manubrium and within the connecting canal. Oocytes are distinguishable for their larger size, here we considered cells greater than 25 µm in diameter to be growing oocytes. Lower panel: close up (i: single plane; ii: maximum projection of z-stack) corresponding to the square shown on the upper panel. (I) Image of EdU-detection (yellow in top panel, black in lower panel) in the tentacle bulb and the radial canal connecting to the EdU+ grafted gonad. Abbreviations: (m) manubrium, (rm) regenerating manubrium, (g) gonad, (gg) grafted gonad, (tb) tentacle bulb, (rc) radial canal, (dpg) days post grafting, (dpd) days post dissection. Sample sizes for panels F-I are as reported in Figure 3H. Scale bars: 100 µm, except in the lower panels of (H): 10 µm.
Figure 4
Non-targeted cell recruitment of Mobilizing Gastro-Digestive (MGD) cells during regeneration.
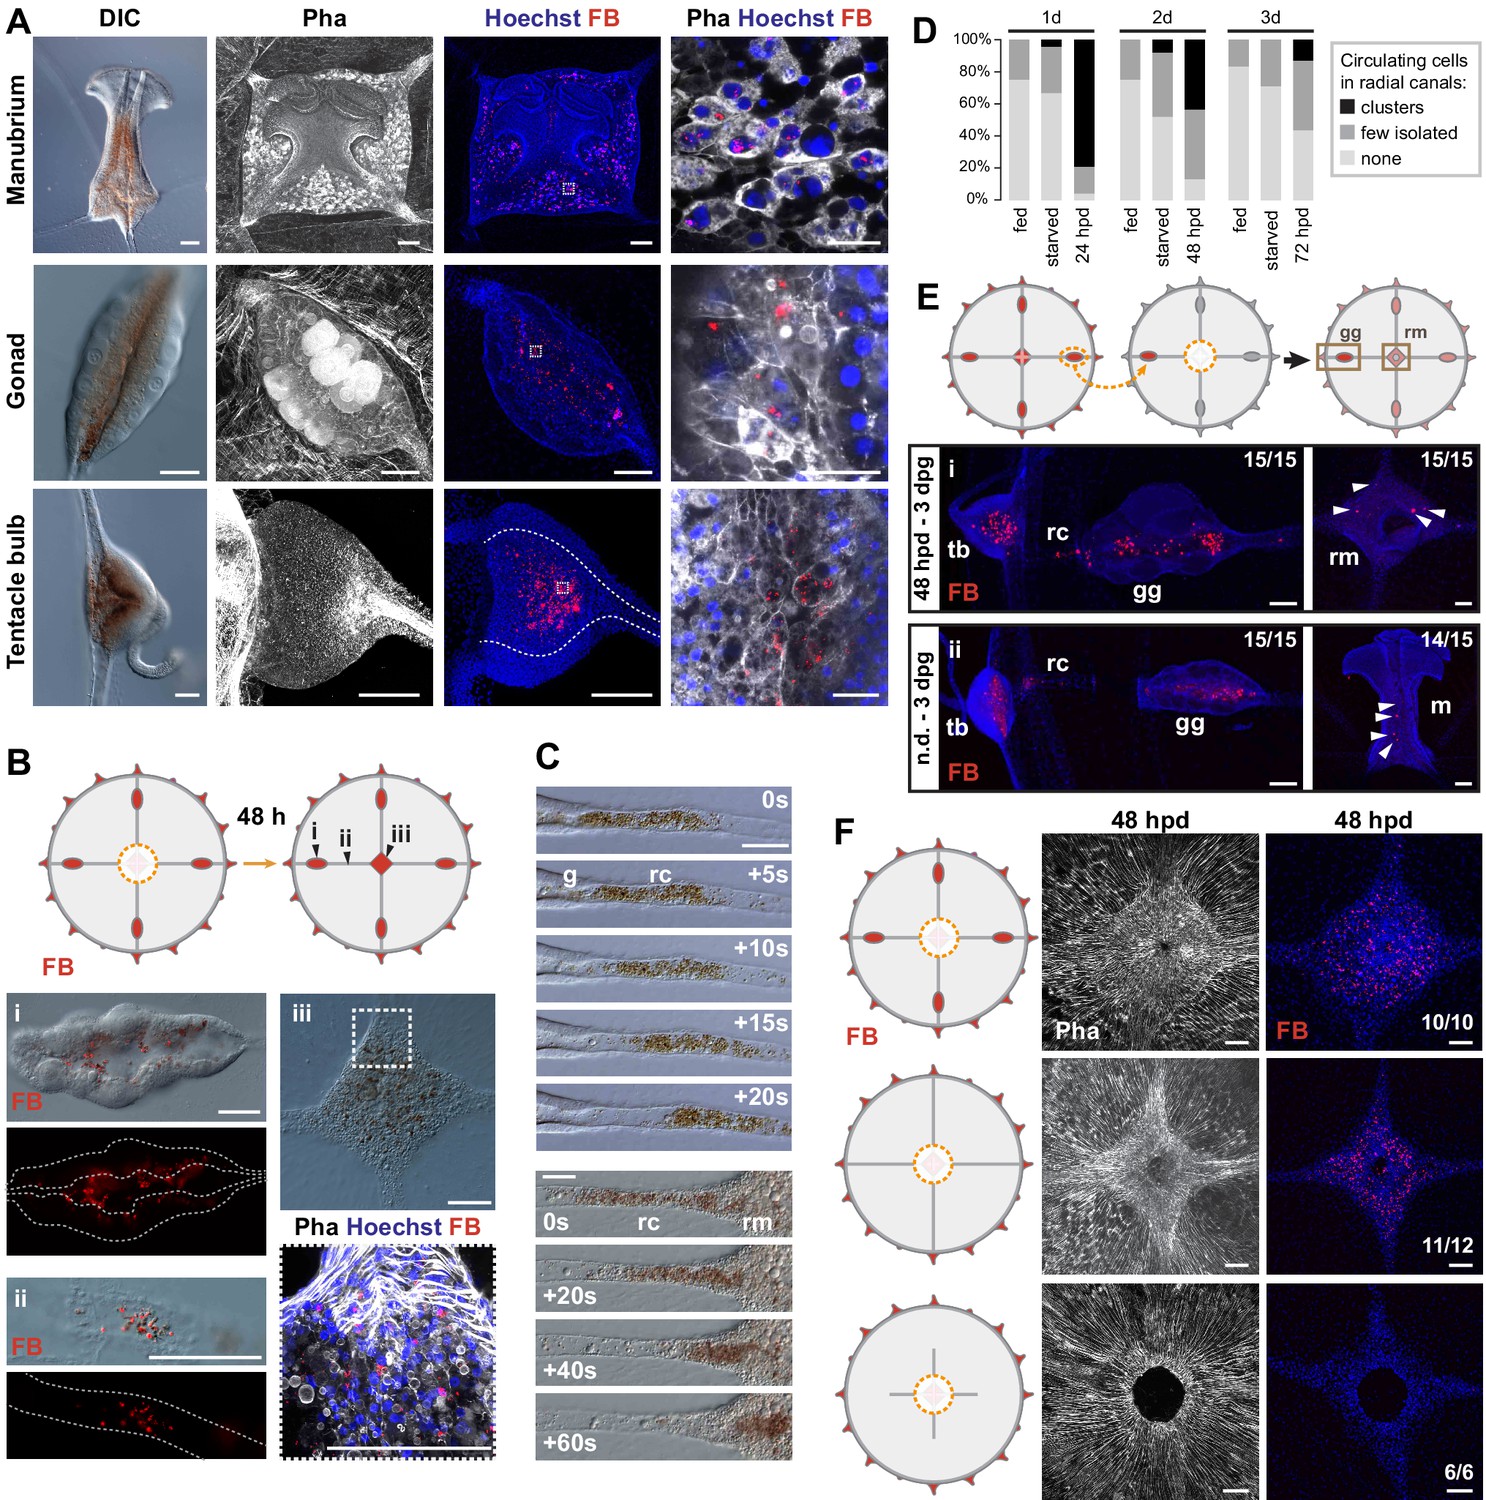
(A) Images illustrating the distribution of MGD cells in Clytia organs (manubrium, gonads, tentacle bulbs), as indicated for each row. MGD cells can be recognized by the orange/brown pigment (DIC images in left panels). Second and third panels: Fluorescent micro-Beads (FB, in red) are ingested by cells residing in the gastroderm. Nuclei are counterstained with Hoechst (in blue), the organization of tissues in shown by phalloidin staining (in white). Right panel: higher magnification images including all three channels showing MGD cell morphology. All confocal images are maximum projection except the close-up image of the manubrium MGD cells that is a single plane of a z-stack. (B) Tracking of FB-labeled cells (following 24 hr feeding) in manubrium-regenerating medusae, cartoon illustrates experimental design. Distribution of FB-labeled MGD cells, 48 hr after manubrium dissection: DIC and fluorescence images (colors as in A) show FB-labeled cells in the gonad digestive cavity (i), in the radial canals (ii) and in the regenerating manubrium (iii). (C) Frames from time lapse movies of the MG-segment of radial canal (rc), showing rapid movement of MGD cells in the lumen. The five top panels show outward movement from the gonad (g), the bottom series shows movement into the regenerating manubrium (rm). (D) Quantification of circulating cells in the MG-segment of all four radial canals in fed, starved and regenerating jellyfish. Starved and dissected animals were last fed 8 hr before experiment (n: 24 for each condition, see Figure 4—source data 1) (E) Grafting of a FB-labeled gonad to a naïve host (cartoon illustrates experimental design) demonstrates untargeted migration of FB-labeled cells into all organs, either in regenerating jellyfish (manubrium dissected, i - top panel) or in non-dissected condition (n.d. ii – bottom panel). Panels show, from left to right: tentacle bulb, gonad, manubrium; FB in red, nuclear counterstain (Hoechst) in blue. (F) Experiment to determine the source of FB-labeled cells during manubrium regeneration (48 hpd), cartoons illustrate the three experimental conditions (from top to bottom): manubrium-dissected jellyfish, manubrium- and gonad-dissected (connection to tentacle bulbs is maintained), manubrium- dissected and canal-disconnected (gonads removed). Images show phalloidin staining (in white, to the left) visualizing the tissue organization around the manubrium site and fluorescent micro-beads (FB, right column, shown in red with Hoechst staining of nuclei in blue). FB-labeled cells are present in the regenerating manubrium in the first two conditions, but if there is no connection to another organ, manubrium regeneration is stalled, and no FB-labeled cells can be detected. Scale bars: 100 µm, except in the right column of (A): 25 µm.
-
Figure 4—source data 1
Raw data for the plots shown in Figure 4D.
- https://cdn.elifesciences.org/articles/54868/elife-54868-fig4-data1-v2.xlsx
Figure 5
Radial canals locally dictate the morphology of regenerating manubrium.
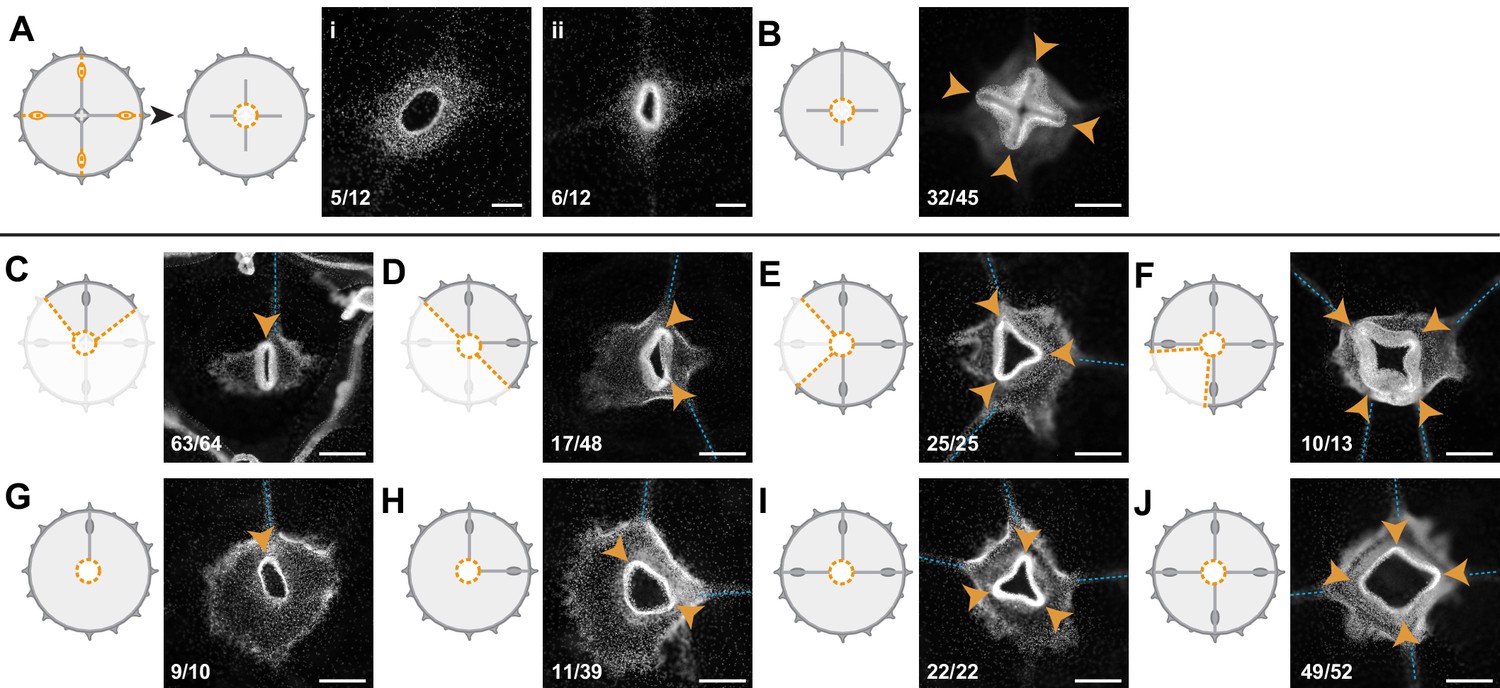
Cartoons illustrate experimental designs, with orange dotted lines showing cuts; fluorescence images show nuclear Hoechst staining (in white) of regenerated manubria (6 dpd), with blue dashed lines and orange arrowheads highlighting canals and lobes of the regenerated manubrium, respectively. Quantification of phenotypes at the bottom left of each image. (A) Experiment testing the contributions of gonads and tentacle bulbs to manubrium morphogenesis. All four gonads and the peripheral portions of the four radial canals were removed, prior to manubrium ablation. Two main morphologies were obtained (6 dpd): (i) arrested manubrium regeneration; (ii) impaired manubrium regeneration. (B) Similar to (A), but one complete canal (connected to another organ) has regrown prior to manubrium regeneration: normal morphogenesis occurred. Orange arrowheads point to the regenerated manubrium lobes. (C–J) Experiments demonstrating the correlation between the number of connected radial canals and regenerating manubrium morphology. Cartoons illustrate the strategy for manipulating number of canals: removal of either entire umbrella quadrants (in C-F), or of the gonad/canal system (in G-J). (C, G) Tubular regenerates formed when only a single canal is connected. (D, H) Bi-lobed regenerates formed in the presence of two connecting canals, the two lobes (orange arrowheads) follow the angular orientation of canals. (E, I) Three-lobed regenerates, connected to three radial canals. (F, J) Tetraradial manubria regenerated in the presence of four connecting canals. Scale bars: 100 µm.
Figure 6 with 1 supplement

Smooth muscle hubs mark the position of regenerating manubria.
For each experiment, cartoons illustrate the cut (orange dotted lines), and stereomicroscope images the responses of live regenerates, while fluorescent images show phalloidin staining (in white) of the regions outlined by brown squares in the stereomicroscope images. Quantification of phenotypes at the bottom left of each image. (A) Quarter fragments: 24 hpd, a radially arranged hub of muscle fibers (orange arrowhead) is detected away from the wound site, close to the injured end of the remaining radial canal. At 5 dpd, a regenerated manubrium is located at the smooth muscle hub. (B) Umbrella fragments devoid of radial canals observed after 4 dpd (top panel: re-circularized, no manubrium regeneration) and 14 dpd (bottom panel: a tubular manubrium-like structure, unable to feed, rarely forms). (C) Removal of canal segments, between the ablated manubrium and gonads: at 24 hpd (left) a muscle hub - but no manubrium blastema - is visible; regrowing radial canals (blue outline in phalloidin image) have not yet reached the hub. At 5 dpd (right panel) three radial canals (blue dashed line) are connected to the muscle hub and manubrium regeneration has occurred (orange arrowhead). (D) Manubrium dissection, coupled to a long cut through the umbrella: 24 hpd (left panel) two muscle hubs are visible (orange arrowheads). At 5 dpd (right) two manubria have formed (orange arrowheads), at the corresponding locations. Scale bars: A-C: 150 µm; D: 300 µm; for all stereoscope images: 1 mm.
Figure 6—figure supplement 1
Multiple muscle hubs correlate with the regeneration of multiple manubria.
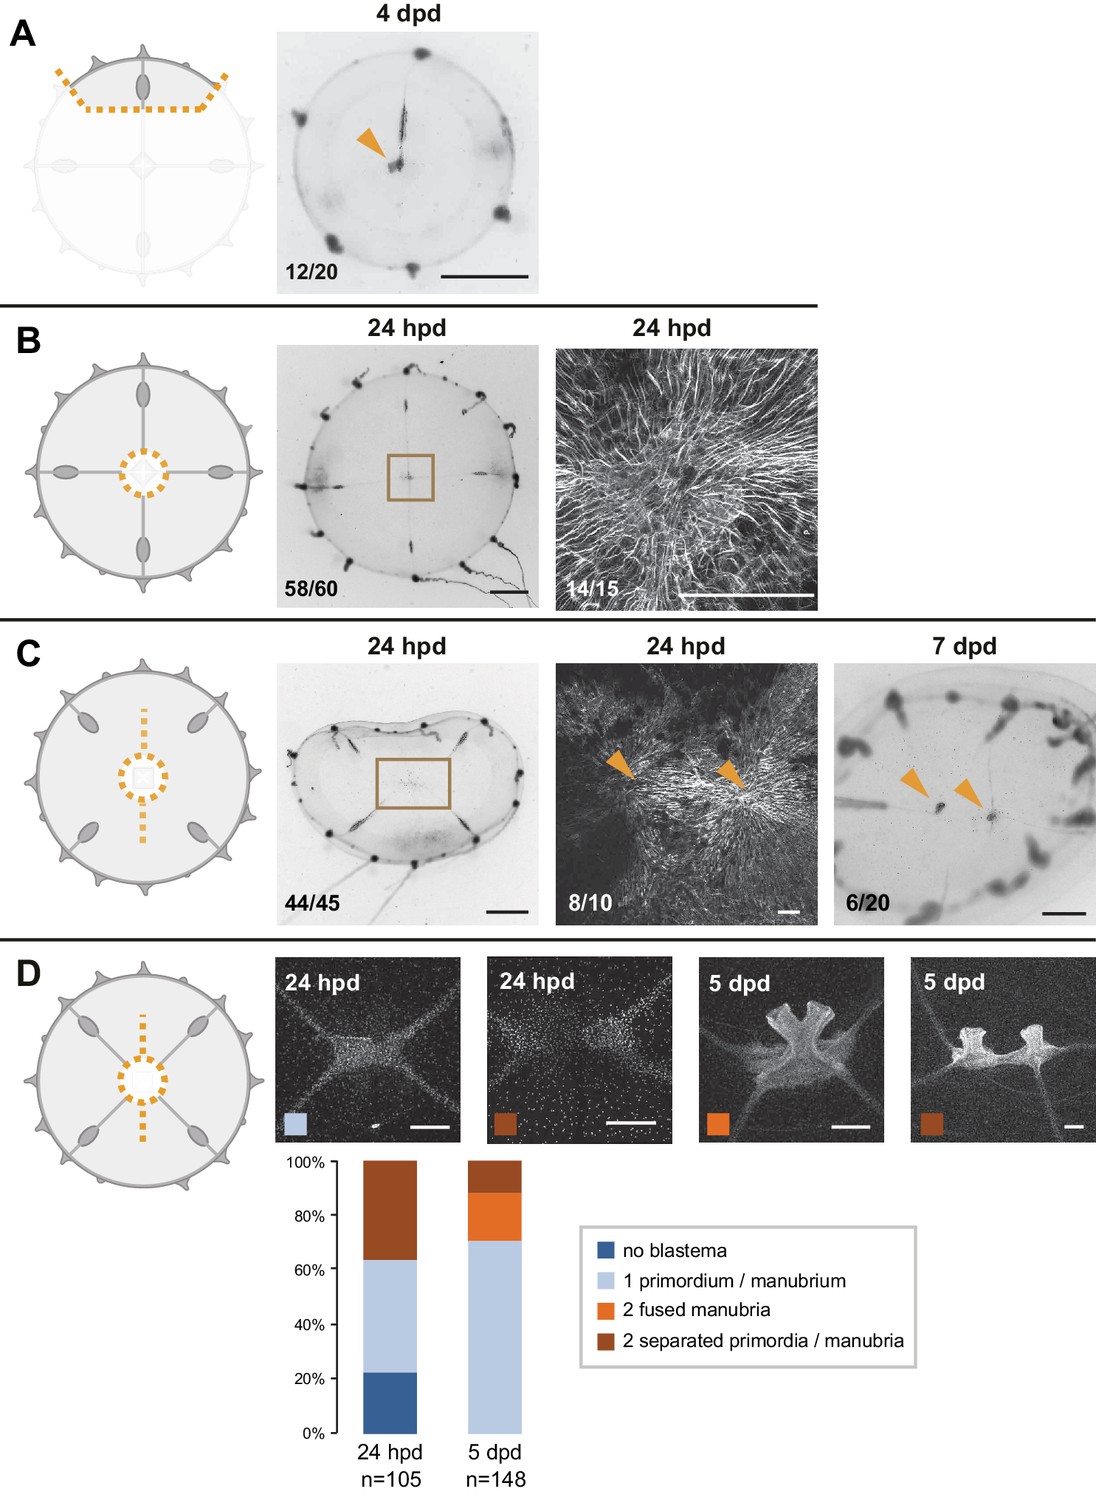
For each experiment, cartoons illustrate the cut (orange dotted lines), and stereomicroscope images the responses of live regenerates, while fluorescent images show phalloidin staining (in white) of the regions outlined by brown squares in the stereomicroscope images. Quantification of phenotypes at the bottom left of each image. (A) Small fragment containing a gonad and a canal section, with a regenerated manubrium visible at 4 dpd. (B) Manubrium dissection: at 24 hpd, radial smooth muscle fibers have joined at the center of the jellyfish, forming a ‘muscle hub’. Right panel is the same shown in Figure 2A. (C) Manubrium dissection, coupled to a long cut through the umbrella and to the removal of radial canal connections to gonads. Fluorescent image shows a double hub forming 24 hpd (phalloidin staining). The stereomicroscope image of a 7 dpd regenerate shows two manubria, formed once the canal connections were reestablished. (D) Manubrium dissection, coupled to a long cut through the umbrella: Hoechst staining images illustrating the possible outcomes at 24 hpd and 5 dpd, quantified below (as indicated by the color code, see: Figure 6—figure supplement 1—source data 1). Scale bars: 1 mm for stereomicroscope images, 200 µm for fluorescent images.
-
Figure 6—figure supplement 1—source data 1
Raw data for the plots shown in Figure 6—figure supplement 1D.
- https://cdn.elifesciences.org/articles/54868/elife-54868-fig6-figsupp1-data1-v2.xlsx
Figure 7
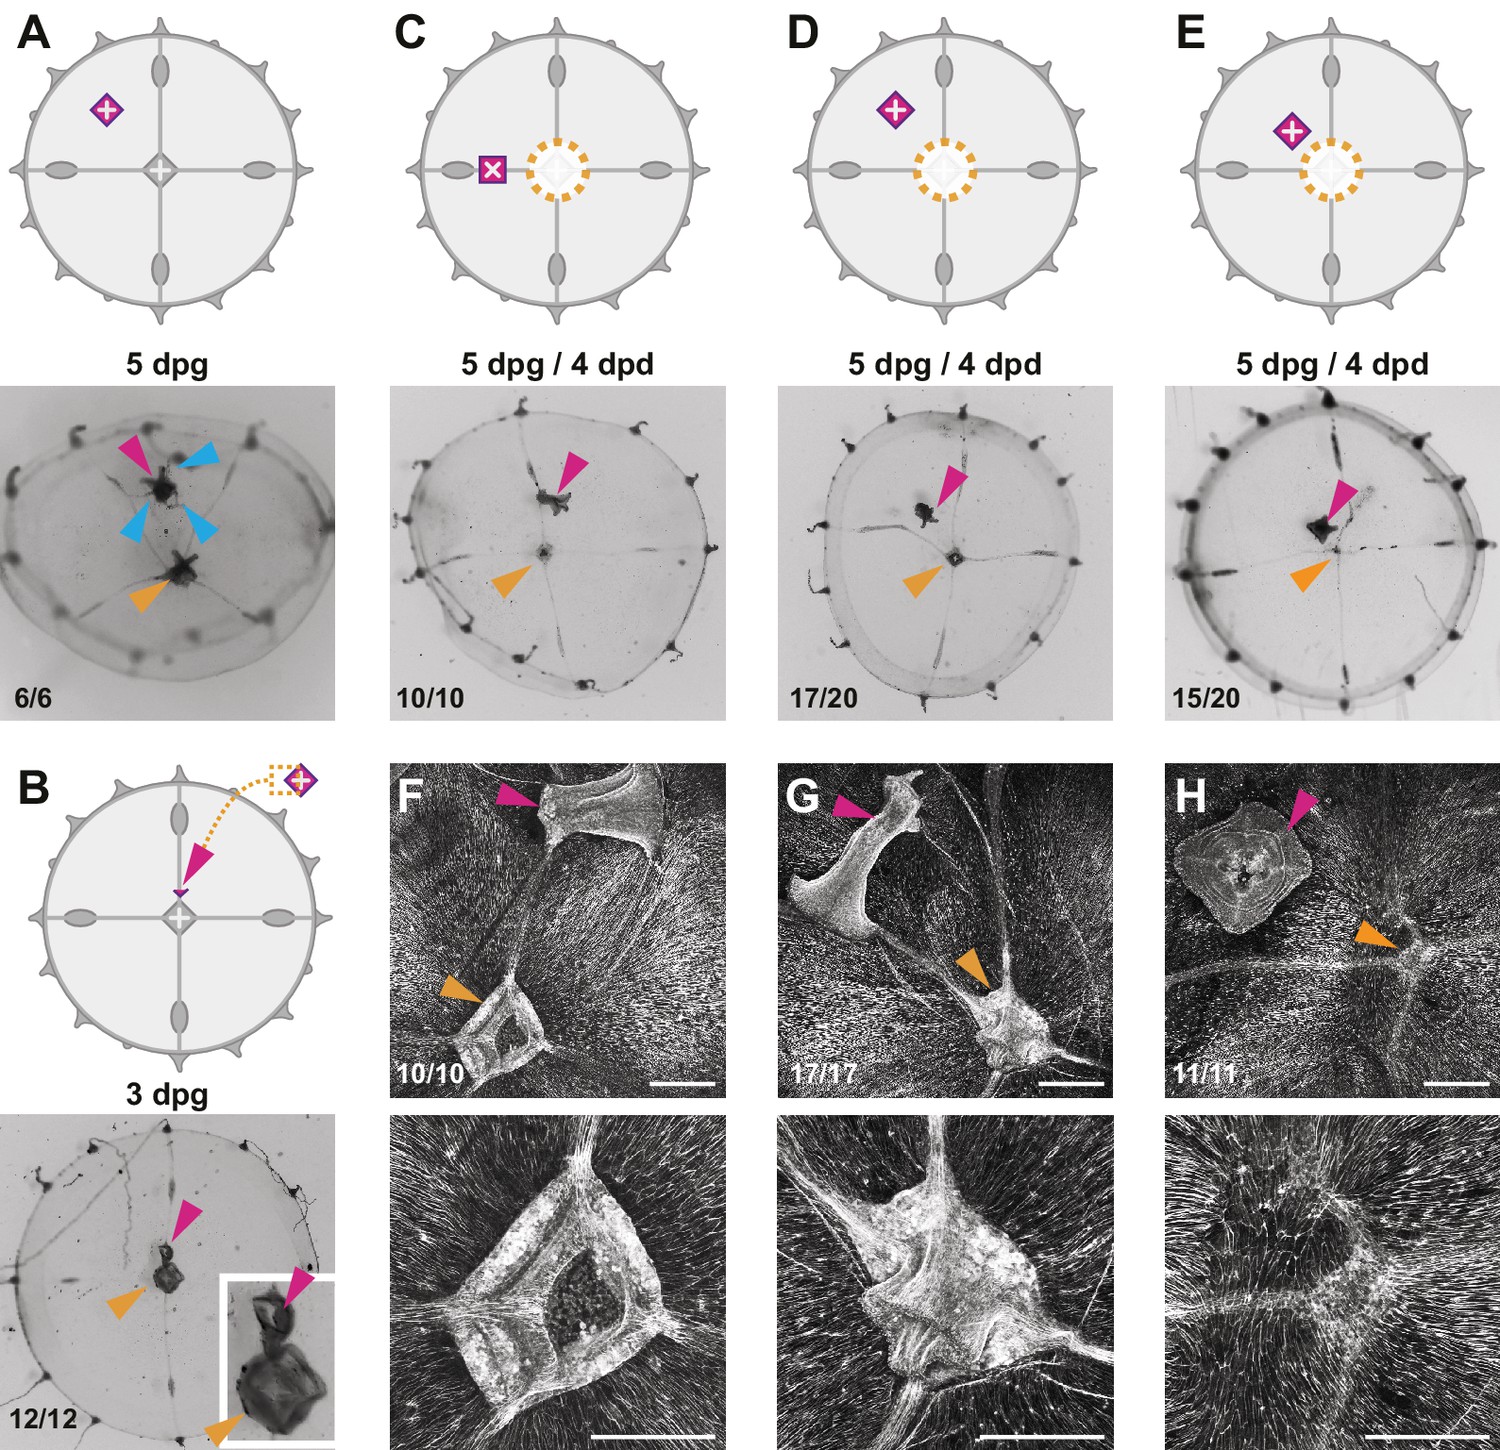
Effects of additional manubria on manubrium regeneration.
Cartoons illustrate the grafting experiments, showing the ablation (orange dotted lines) and the grafted manubria position (in magenta). In (A–E), stereomicroscope images show live regenerates, in (F–H) fluorescent images of phalloidin staining (in white). Quantification of phenotypes at the bottom left of each image. (A) Grafting of an additional manubrium on the umbrella of a non-dissected jellyfish. After 5 days, the jellyfish bears two manubria (magenta and orange arrowheads indicate the grafted and the endogenous one, respectively), and the grafted manubrium has sprouted radial canals (blue arrowheads) from its base. Canals have no apparent directionality, and connect to the endogenous canal system. (B) Grafting of a fragment of manubrium base onto a non-dissected medusa, on a radial canal. After 3 days an extra manubrium is visible (magenta arrowhead). (C–E) Effect of ectopic manubria on manubrium regeneration. Grafting was performed one day prior to manubrium ablation. When manubria were grafted onto the radial canal (C) or in the middle of the umbrella (D), the endogenous manubria regenerated (orange arrowheads). (E) When the additional manubrium was grafted adjacent to the regeneration site, no manubrium regenerated (orange arrowhead). (F–H) Phalloidin staining of specimens corresponding to (C–E), showing graft-dependent muscle fiber topology: in manubrium-dissected jellyfish, muscle hubs form when the grafted manubrium was positioned on a radial canal (F) or on the umbrella (G) (orange arrowheads in the lower magnification images of the upper row), while muscles are disorganized when the graft is close to the ablation site (regeneration in this case is inhibited; orange arrowhead). (H) The radial canals have reconnected at the ablation site in all cases. (dpg) days post grafting. Scale bars: 100 µm.
Figure 8 with 1 supplement
Actomyosin-driven subumbrella remodeling restores medusa shape.
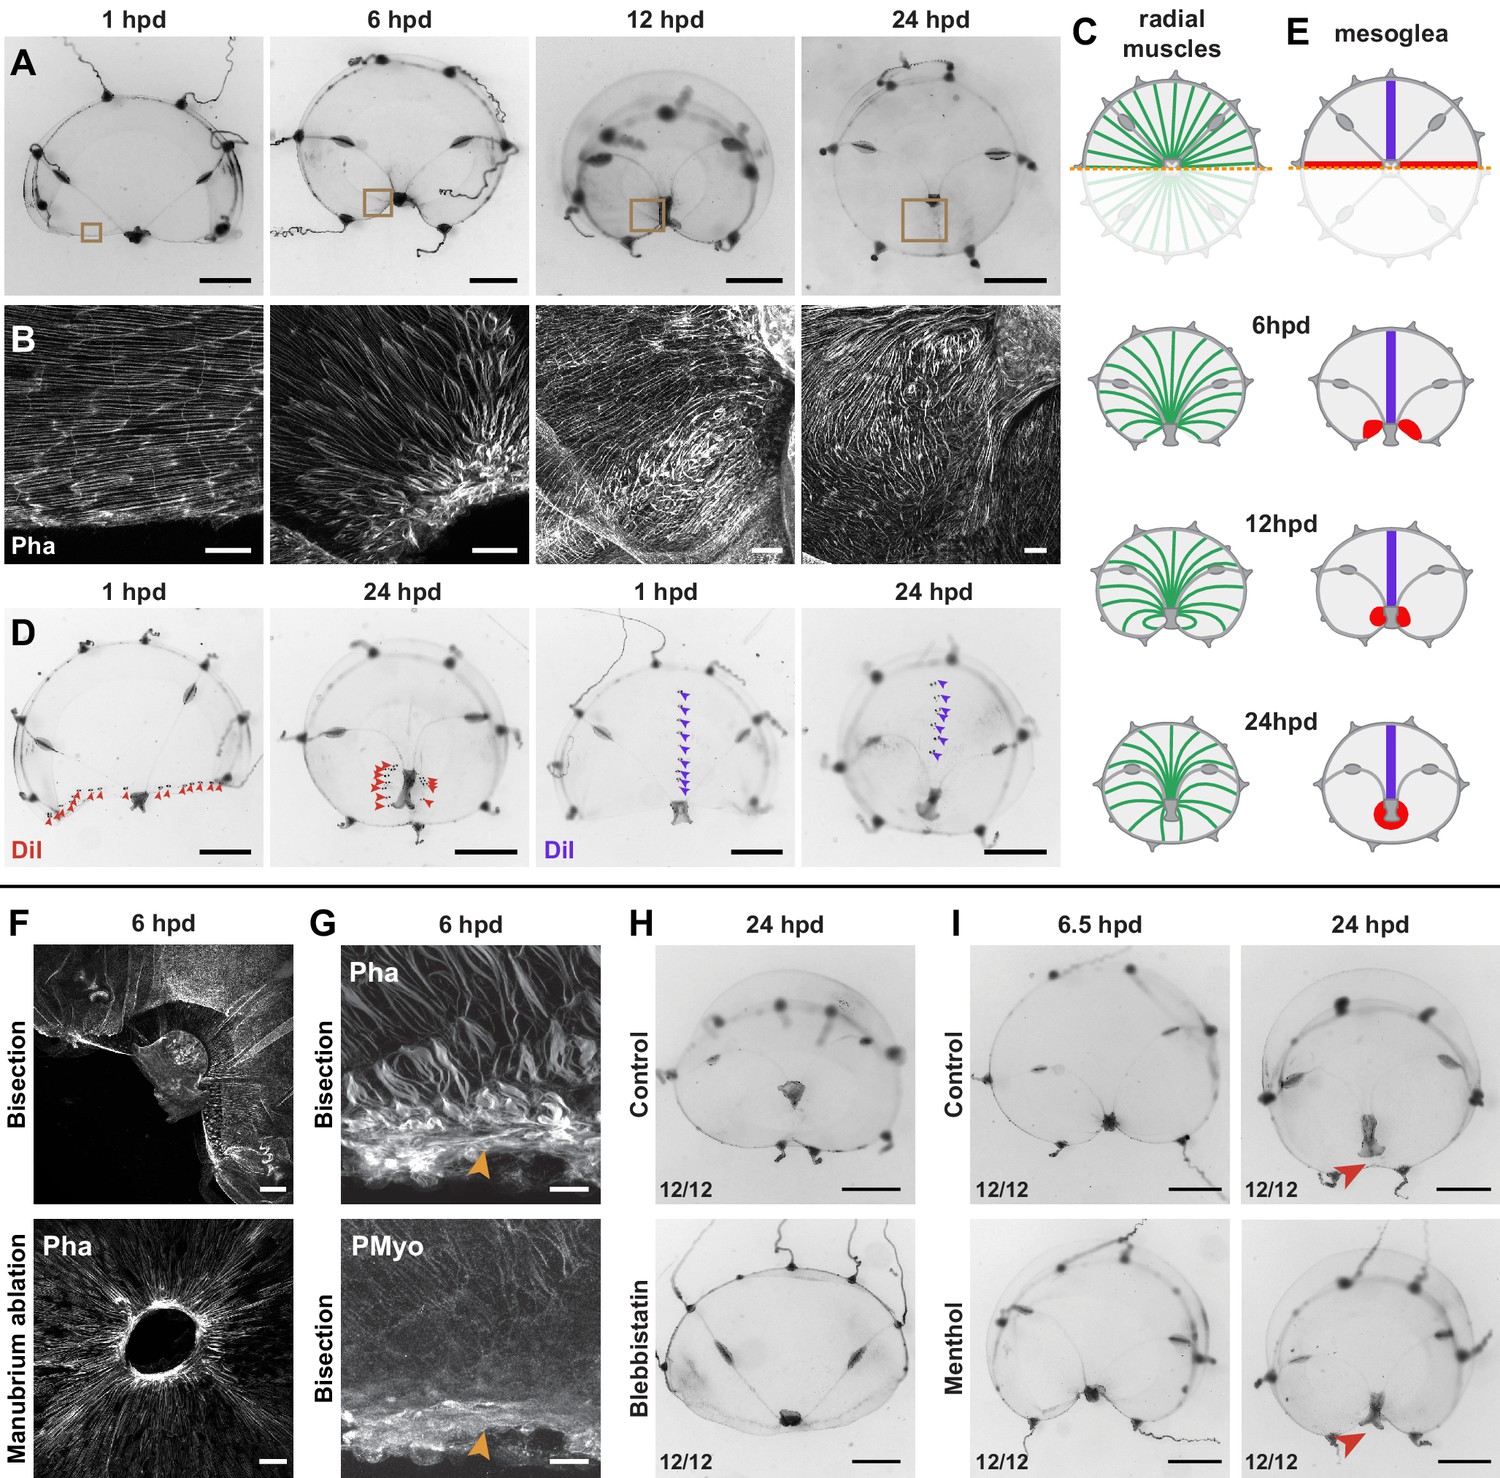
(A) Morphology of remodeling bisected medusae; successive stereomicroscope images showing the rapid reduction of exposed edges. After closure of the wound, the manubrium migrates towards the center, by 24 hpd only a scar-like trace is visible in the umbrella, which will then disappear. (B, C) Muscle fiber organization in remodeling jellyfish: in (B) phalloidin staining of the remodeling edge (corresponding to the regions highlighted by brown squares in A), in (C) diagram. The initially ordered radial fibers disorganize at the wound edge, and are extensively rearranged following the movements of the umbrella. (D, E) Images showing DiI droplets (in D) injected into the thick mesoglea layer of hemi-medusae, along the wound (left images, DiI droplets shown with red arrowheads, n: 8/8 jellyfish) or perpendicular to it (right images, DiI droplets shown with purple arrowheads, n: 6/6 jellyfish). Mesoglea was rearranged close to the wound area, while its more distal region seemed unaffected (diagram in E). (F) Phalloidin staining showing an actomyosin cable assembled at the wound edge in bisected (top) and manubrium-dissected (bottom) jellyfish. (G) Phalloidin (top) and antibody staining (PMyo; bottom) recognizing phospho-Myosin Light Chain 2 (Ser19) of the same specimen (6 hpd) showing enrichment of both actin and phosphorylated myosin at the wound site (orange arrowheads), during remodeling. (H) Halved jellyfish incubated (bottom) or not (top) with the myosin inhibitor blebbistatin: remodeling has not occurred in the presence of blebbistatin. (I) Halved jellyfish incubated (bottom) or not (top) in menthol, which inhibits striated muscle-based rhythmic contractions (see Figure 8—figure supplement 1C). Wound closure and remodeling (red arrowhead) have occurred in the menthol-treated specimen, with only a slight delay. Scale bars: A,D: 1 mm; F: 50 µm, B,G: 25 µm, H, I: 1 mm.
Figure 8—figure supplement 1
Actomyosin-driven subumbrella remodeling restores medusa shape.
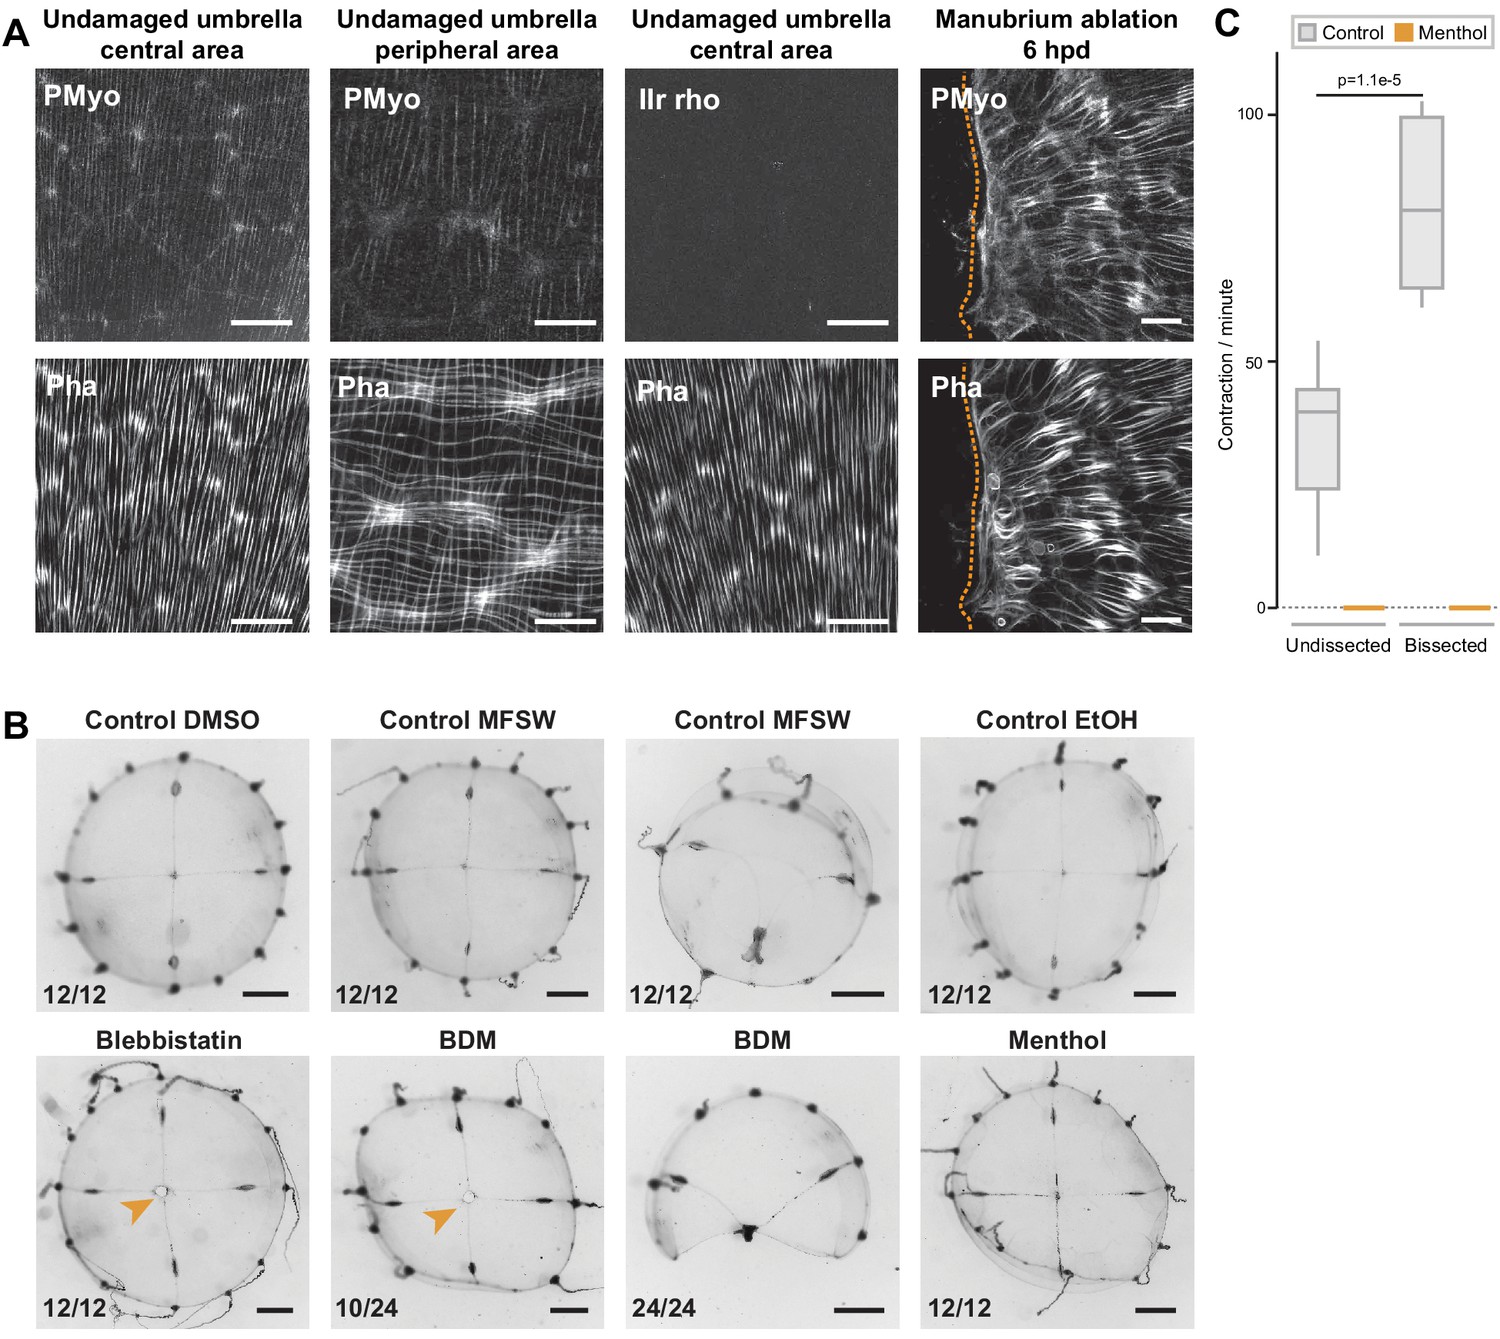
(A) Anti phospho-Myosin Light Chain 2 (Ser19) antibody (here indicated as PMyo) staining (upper row) of intact and remodeling muscle fibers, visualized by phalloidin staining (bottom row). PMyo antibody decorated radial smooth muscle fibers (central and peripheral umbrella), but not the circular striated muscle fibers (peripheral umbrella only). A negative control with only the secondary antibody (IIr rho) shows no staining in the smooth muscle fibers of an undamaged jellyfish. Disorganizing muscle fibers close to the wound (6 hpd) show strong myosin phosphorylation (right panel). (B) Manubrium-ablated jellyfish were incubated in different drugs (see Materials and methods), and observed 24 hpd. Controls treated in parallel with the carrier solvents (DMSO, ethanol) in FASW are shown in the top row. Jellyfish incubated in myosin inhibitors (blebbistatin and BDM) show impaired wound healing and remodeling, while inhibition of muscle contraction with menthol had no major effect. Stereomicroscope images. Scale bars: A: 1 mm, C: 25 µm. (C) Quantification of muscle contraction in non-dissected and bisected jellyfish in the absence (grey) and presence (orange) of menthol. Note that jellyfish contract significantly faster after amputation. Number of contractions per minutes was recorded for 5 min for 10 non-dissected and 10 newly bissected jellyfish, in control (0,04% ethanol) and menthol (400 µM in ethanol/FASW) conditions (see Figure 8—figure supplement 1—source data 1). Statistical test: Mann Whitney Wilcoxon.
-
Figure 8—figure supplement 1—source data 1
Raw data for the plots shown in Figure 8—figure supplement 1C.
- https://cdn.elifesciences.org/articles/54868/elife-54868-fig8-figsupp1-data1-v2.xlsx
Figure 9 with 1 supplement
Hub stabilization is required for manubrium blastema formation.
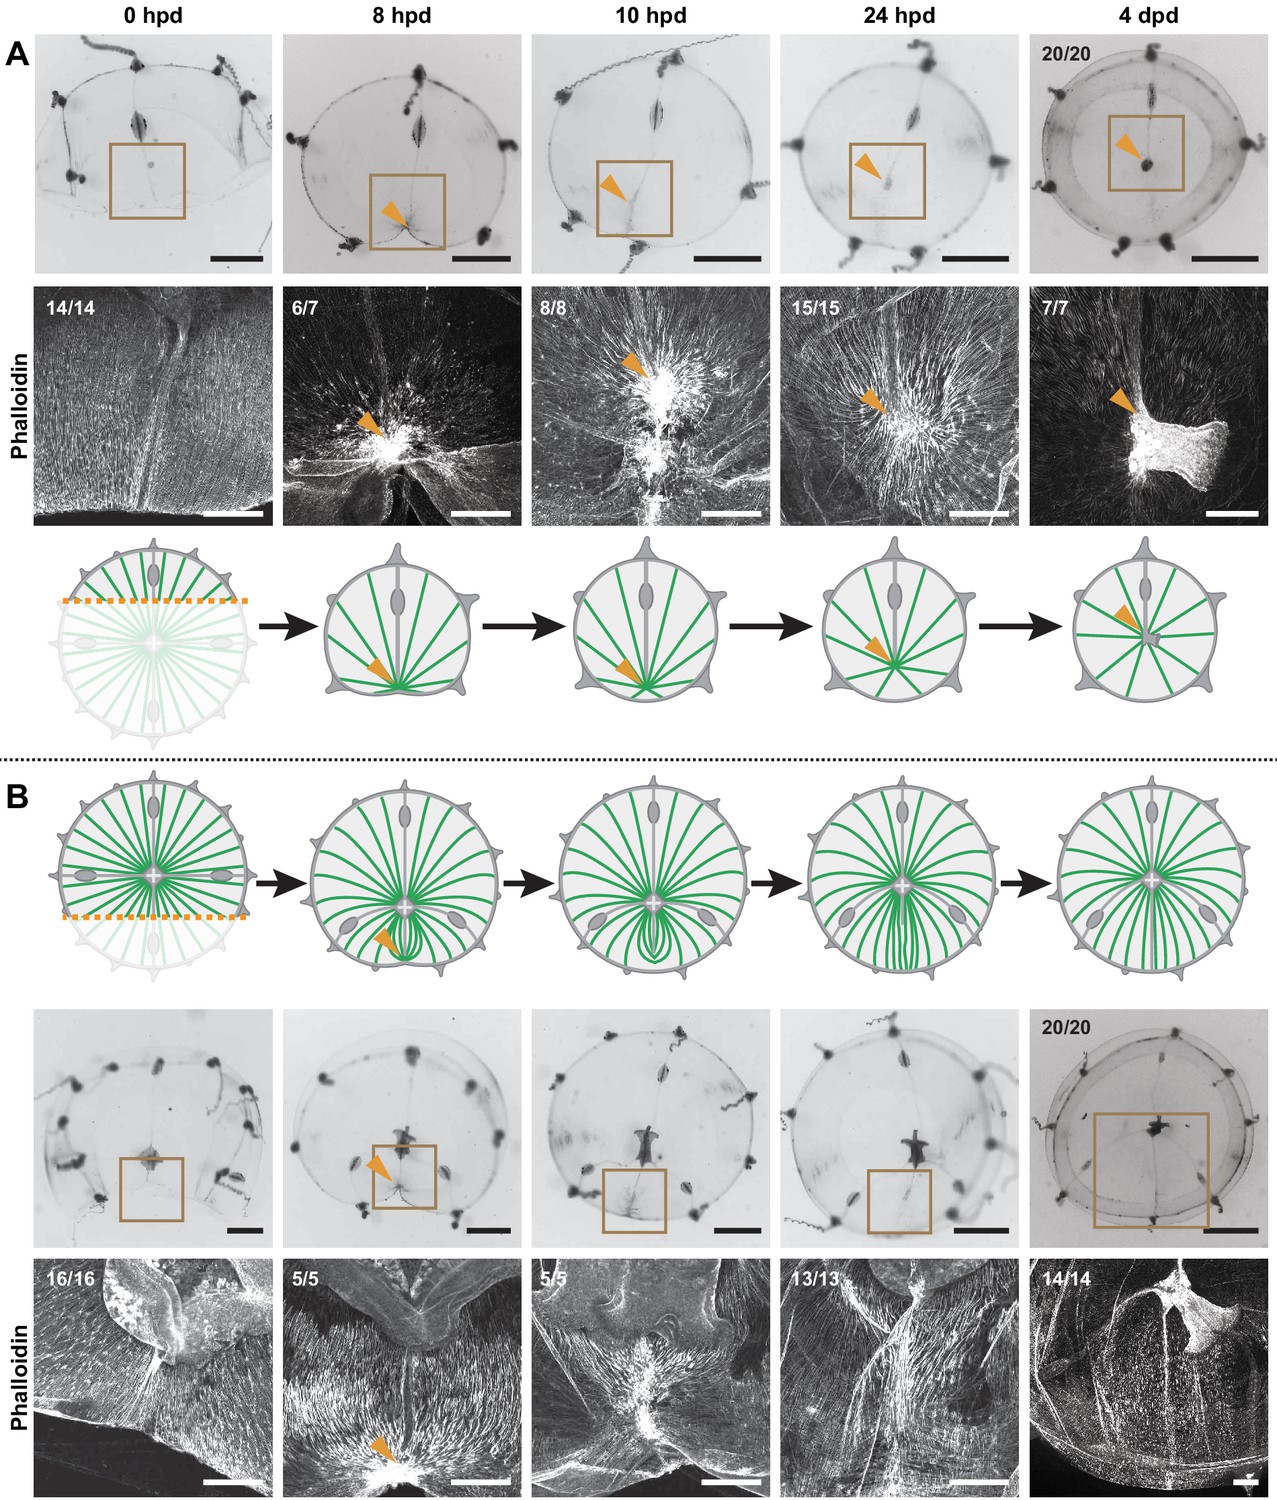
(A,B) Successive images (0, 8, 10, 24 hpd and 4 dpd) of remodeling jellyfish fragments, deriving from an asymmetric cut across the umbrella, which generates one smaller fragment (‘S’) without manubrium (A) and one larger fragment (‘L’) bearing a manubrium (B). For each case it is shown: stereomicroscope images of immobilized specimens, phalloidin staining (in white) of the region highlighted in the brown square, diagram showing the topology of radial smooth muscle fibers (in green). All S and L fragments displayed, respectively, the same morphological progression (n: 20/20 each condition). Orange arrowheads indicate hubs. Scale bar: 200 µm, except for stereomicroscope images: 1 mm.
Figure 9—figure supplement 1
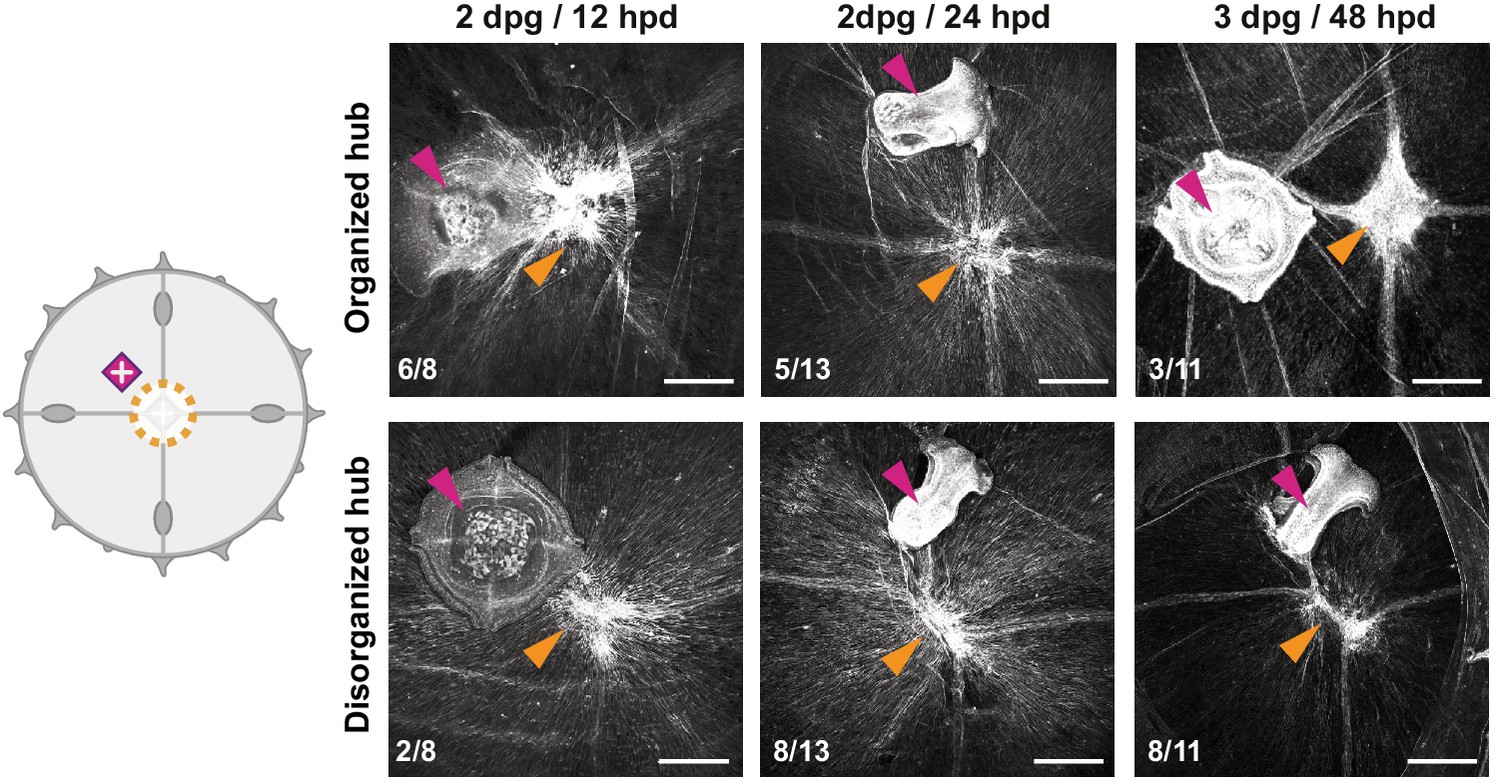
Muscle hub dynamics in proximal manubrium grafts.
Dynamics of smooth muscle fibers in the case of grafted and manubrium-ablated jellyfish (cartoon). Representative images are shown for each case: 12 hpd most (n: 6/8) specimens show an organized hub (top row), while at 24 hpd they tend (n: 8/13) to show a disorganized one (bottom row). At 48 hpd most specimens have no organized hub on the wound site, and manubrium does not regenerate. Purple arrowhead: grafted manubria; orange arrowhead: hub on manubrium-ablation site. Phalloidin-stained muscles in white. Scale bars: 100 µm.
Figure 10 with 2 supplements
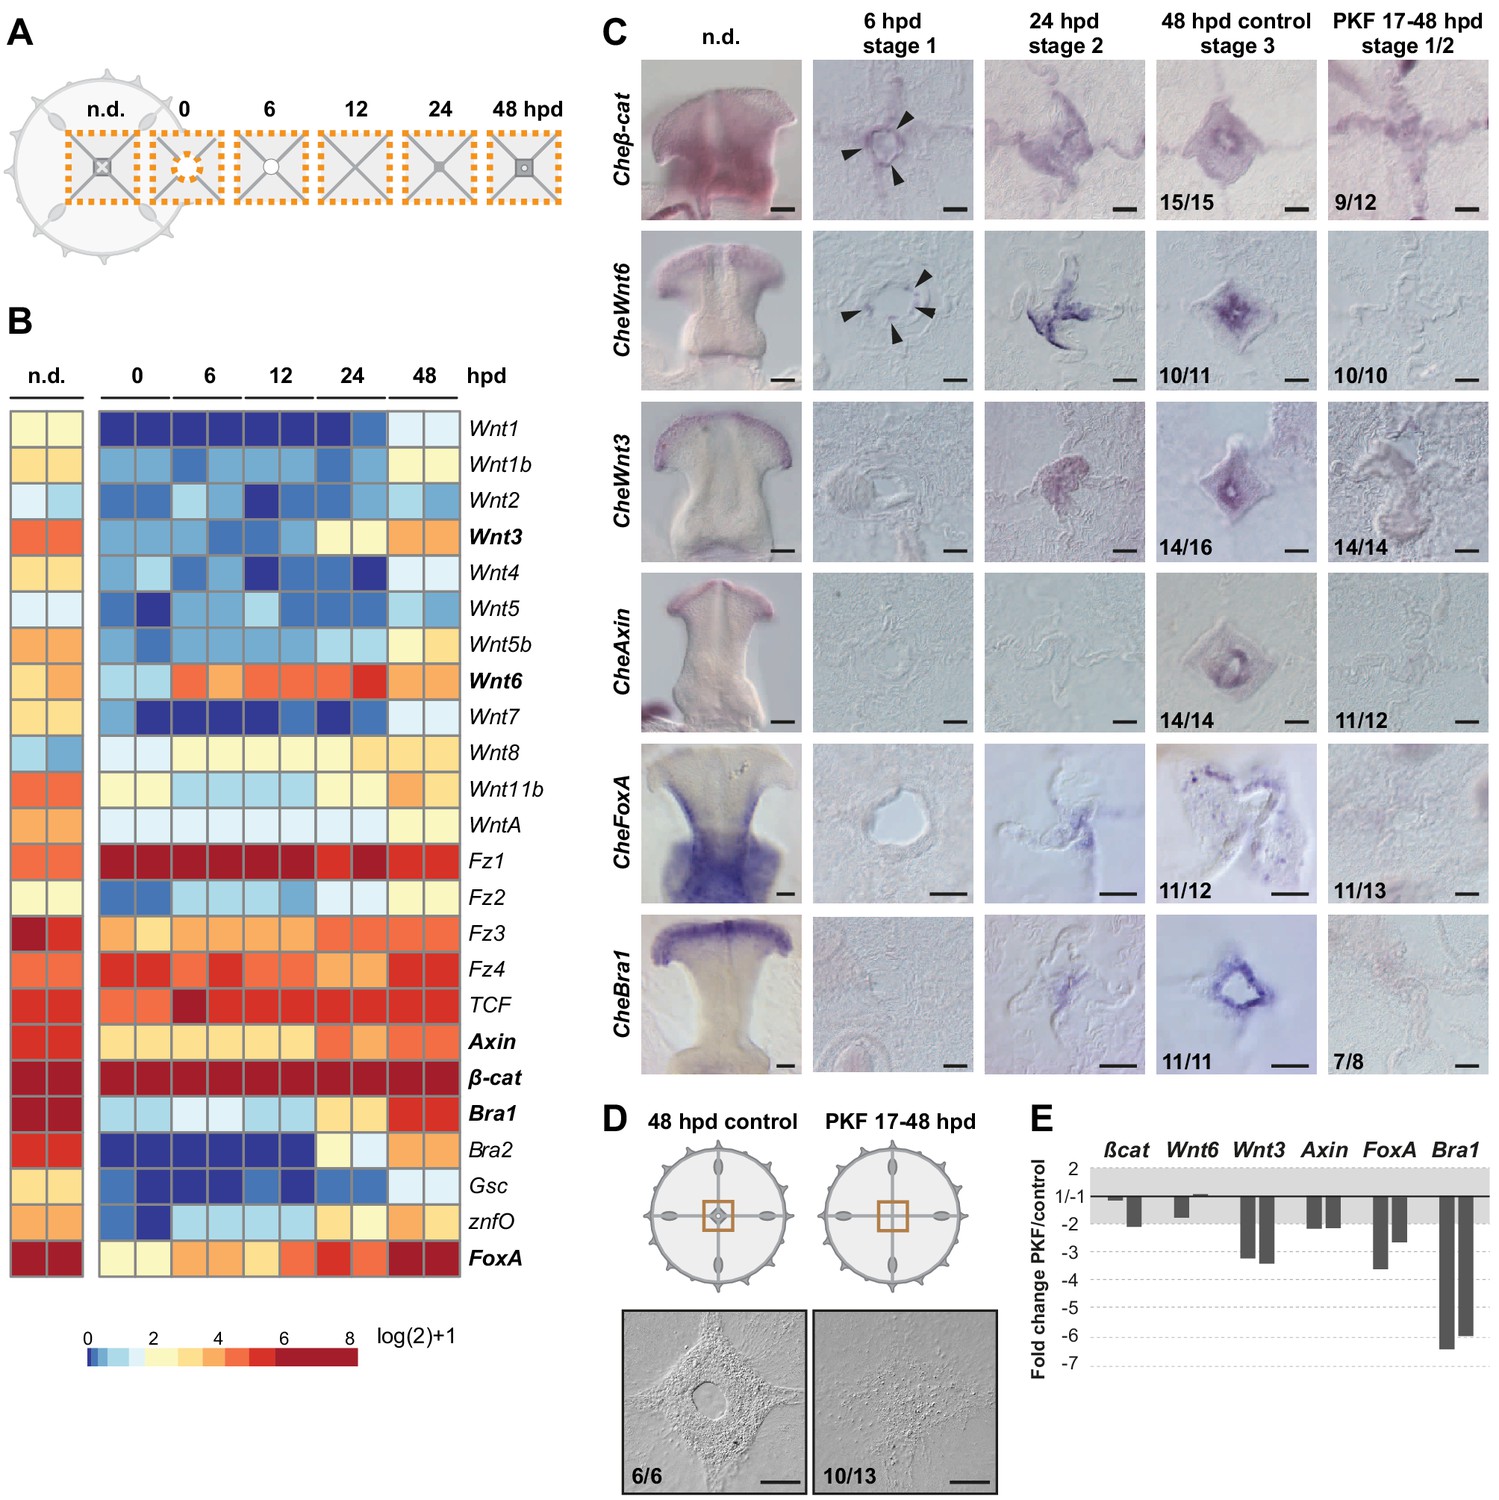
Wnt/ß-catenin signaling drives manubrium regeneration.
(A) Sampling strategy for transcriptomic analyses: fragments of the central umbrella (orange dotted area) were collected at different times, prior (n.d.) or following manubrium ablation. (B) Heatmap displaying quantification of transcript levels (tpm, log2 normalized) for selected Wnt/ß-catenin pathway components and downstream targets. Color scale based on quantile values. (C) In situ hybridization detection of Wnt pathway components, together with CheFoxA and CheBra1 (genes in bold in B). Genes are expressed in staggered domains along the oral-aboral axis of the undamaged manubrium. Cheß-cat and CheWnt6 transcripts can be detected at the wound site at 6 hpd (black arrowheads), while CheWnt3, CheFoxA and CheBra1 are detected only at the stabilized hub (24 hpd). Treatment with PKF118-310 (0.8 µM) inhibits expression of Wnt/ß-catenin pathway components, and their targets. (D) Schematics and DIC images of manubrium-ablated jellyfish, treated with PKF118-310 (right) or control (left): following drug treatment blastema did not form and manubrium did not regenerate. (E) Reduction (expressed as fold-change) of expression of some Wnt/ß-catenin pathway components, and their targets, determined by qPCR between PKF118-310 (17–48 hpd) and control non-treated medusae (48 hpd) (see Materials and methods for sampling details), for two biological replicates. The ratio of expression levels of selected genes were normalized with respect to eF1α.
-
Figure 10—source data 1
Raw expression data used to construct the heatmap shown in Figure 10B; information about the RNAseq samples; expression values (tpm) for all the Clytia hemisphaerica transcripts for the 12 RNAseq samples.
- https://cdn.elifesciences.org/articles/54868/elife-54868-fig10-data1-v2.xlsx
-
Figure 10—source data 2
Primers and raw data of the qPCR experiments shown in Figures 10E and 11C and Figure 11—figure supplement 1.
- https://cdn.elifesciences.org/articles/54868/elife-54868-fig10-data2-v2.xlsx
Figure 10—figure supplement 1
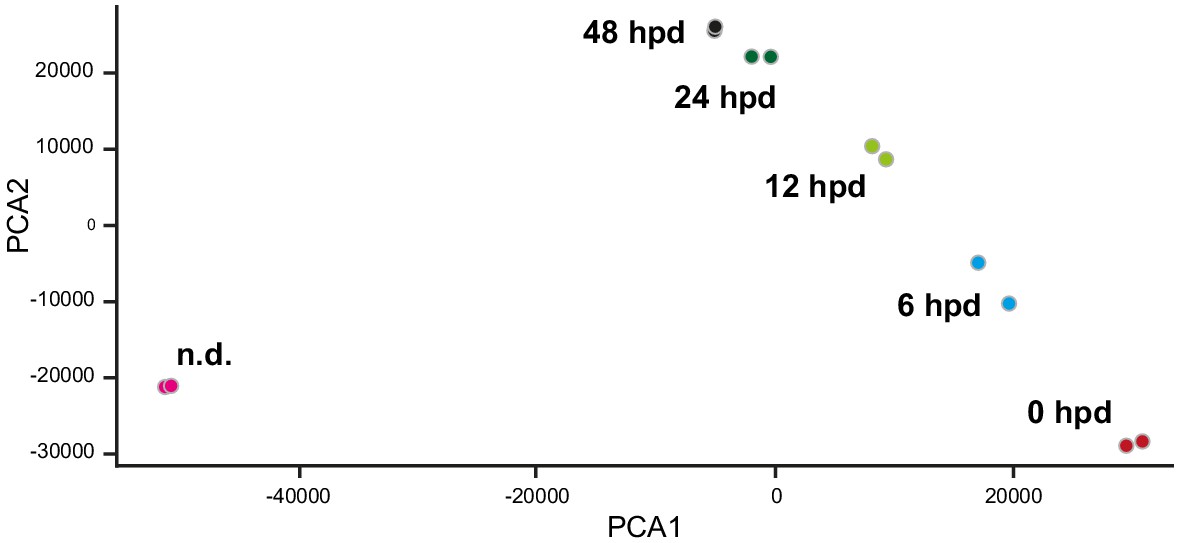
PCA plot of RNAseq samples from the manubrium area.
Non-dissected (n.d.), 0 hpd, 6 hpd, 12 hpd, 24 hpd (hub stabilization), 48 hpd (blastema onset). Two biological replicates of pooled samples were sequenced, per condition. PCA demonstrates samples reproducibility and indicates that at 48 hpd manubrium regeneration is not complete as the transcript composition remains distinct from the non-dissected manubrium.
Figure 10—figure supplement 2
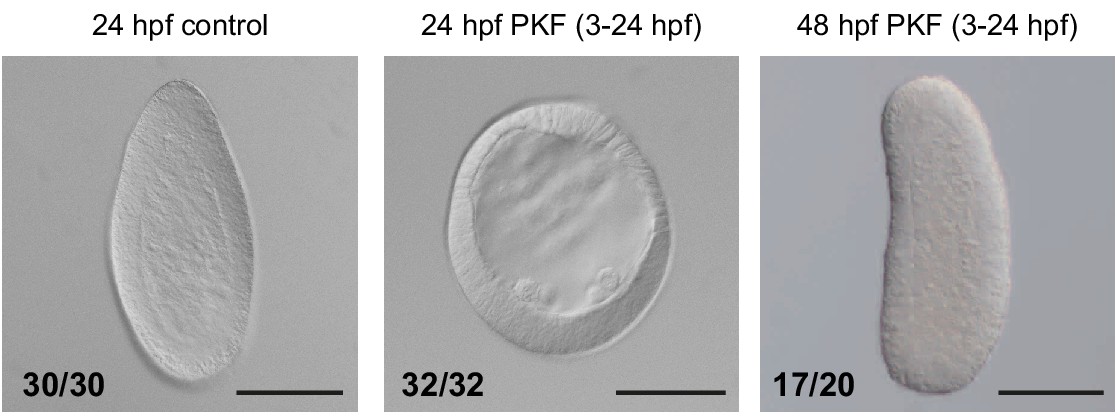
PKF118-310 treatment of embryos.
DIC images of Clytia embryos incubated from the 4-cell stage in 0.7-µM PKF118-310 (middle and right) or in FASW (left). The spherical morphology and lack of endoderm of drug-treated embryos at 24 hpf (hours post fertilization) strongly resembles the phenotypes obtained through knockdown of Wnt signaling using antisense morpholinos targeting Wnt3 and Fz1 (Lapébie et al., 2014). Removal of inhibition (FASW 24–48 hpf) allows endoderm formation and larval elongation. Details on phenotype quantification: FASW control embryos (24 hpf): 30/30 ‘torpedo-shaped planulae’; PKF118-310 treated (3–24 hpf) embryos: 32/49 ‘delayed blastulae’ (comprising: 15/49 ‘empty blastulae’, 17/49 ‘blastulae with cells within the blastocoel’), 17/49 dead embryos; PKF118-310 treated (3-24hpf) and washed embryos (48 hpf): 17/50 ‘planulae’ (comprising: 7/50 ‘torpedo-shaped planulae’, 10/50 ‘irregularly-shaped planulae’), 3/50 ‘un-polarized planulae’, 30/50 dead embryos. Dead embryos have been removed from the total sample numbers shown on figures. Scale bars: 100 µm.
Figure 11 with 1 supplement
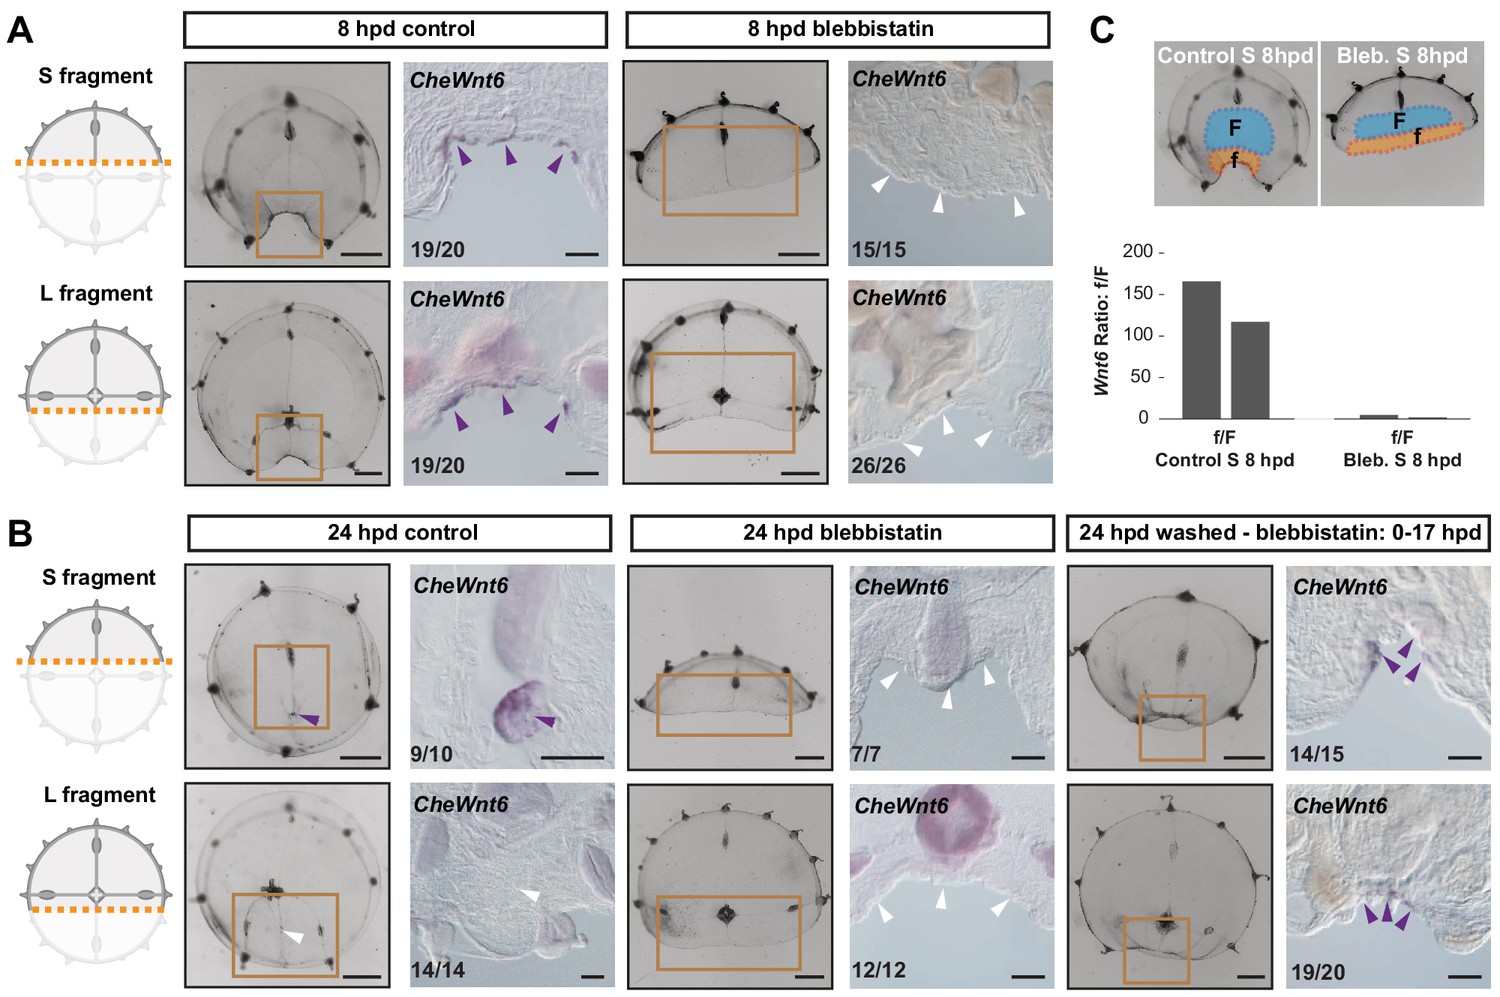
Remodeling-dependent activation of CheWnt6 expression.
(A) Schematics of S/L fragments to the left, and stereomicroscope/in situ hybridization images of 8 hpd control and blebbistatin-treated to the right. At 8 hpd CheWnt6 expression was detected at the remodeling wound site of both fragments (purple arrowheads). In blebbistatin-treated samples, no CheWnt6 expression was detected at the wound sites (white arrowheads). (B) At 24 hpd CheWnt6 was not detected in the L fragments at the site of hub disassembly (white arrowheads), while it was detected at the hub site in S fragments (purple arrowhead). No CheWnt6 expression was detected at the wound sites in blebbistatin-treated samples at 24 hpd, while CheWnt6 signal was detected following washout of blebbistatin (blebbistatin treatment: 0–15 hpd) at the remodeling wound site (at 24 hpd), in both S and L fragments. (C) CheWnt6 expression ratio between ‘f’ (corresponding to wound area) and ‘F’ (nearby umbrella area) tissue pieces, as determined by qPCR, for control and blebbistatin-treated S fragments (8 hpd), for two biological replicates normalized with respect to eF1α expression. See Materials and methods and Figure 11—figure supplement 1 for further details, and Figure 10—source data 2 for the raw qPCR data. (A,B) Scale bars: 100 µm, except for stereomicroscope images: 1 mm.
Figure 11—figure supplement 1
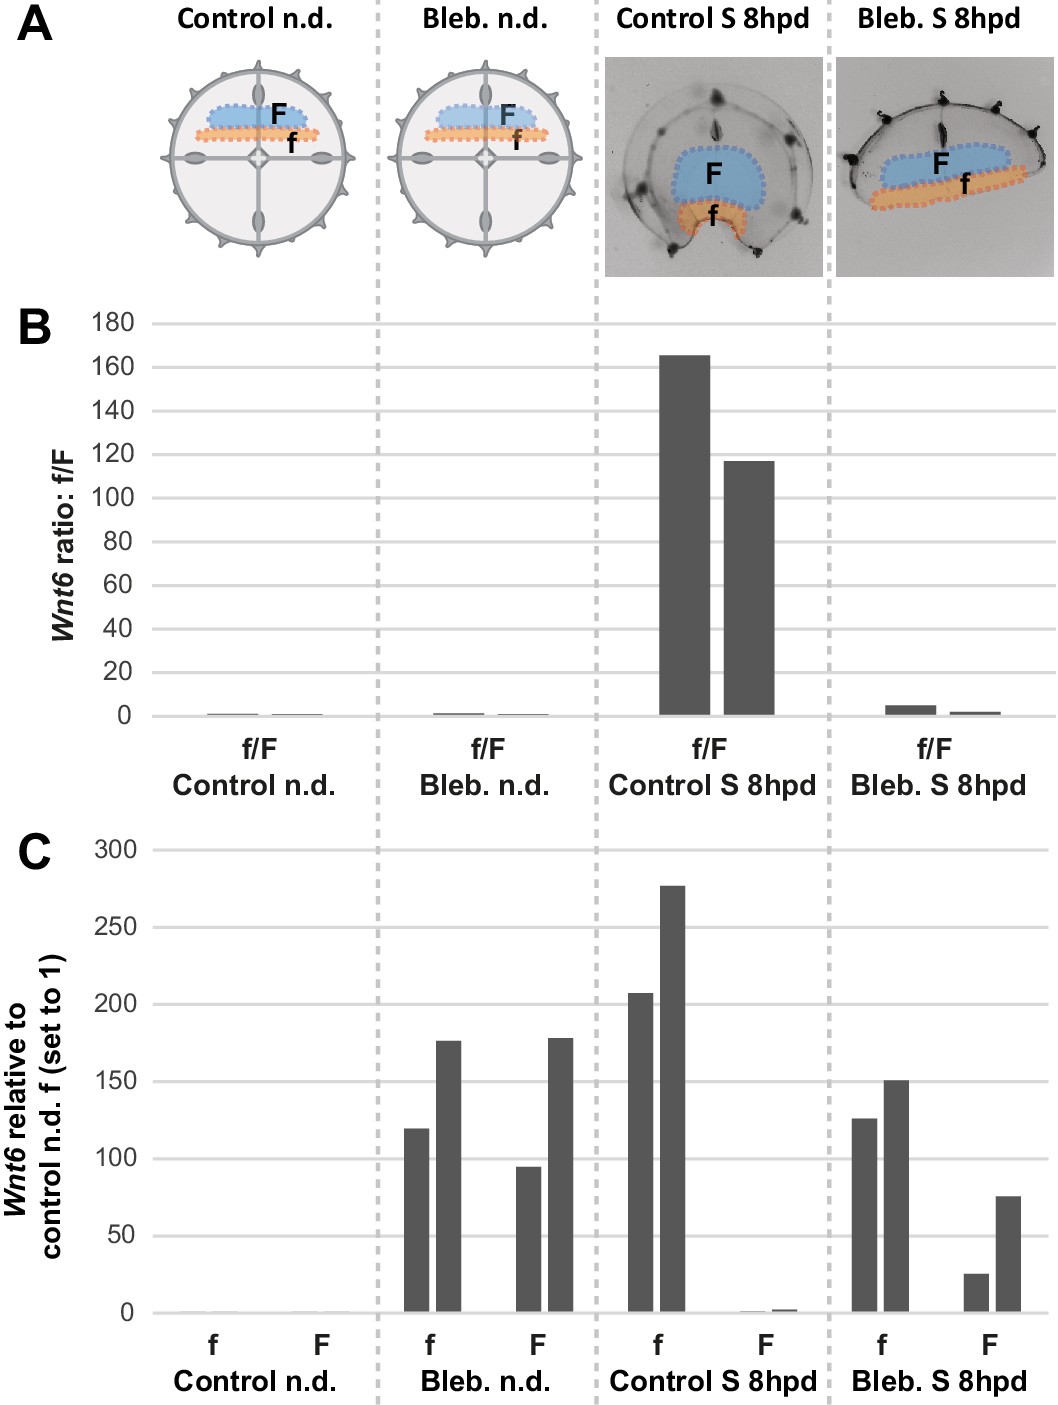
Treatment with blebbistatin inhibits early increase of CheWnt6 expression at wound area.
(A) Schematic of ‘f’ and ‘F’ dissected tissue fragments from: (i) non-dissected (n.d.) and non-treated controls, (ii) non-dissected, blebbistatin-treated for 8 hr, (iii) control S fragments 8 hpd non-treated, and (iv) blebbistatin-treated S fragments 8 hpd. (B) f/F ratio of CheWnt6 expression values, as determined by qPCR for two biological replicates, for each of the four conditions represented in (A). (C) Corresponding CheWnt6 expression values for f and F fragments, normalized with respect to eF1α, and relative to the condition ‘non-dissected non-treated f control’ (which was arbitrarily set to 1.00). See Materials and methods for more sampling details, and Figure 10—source data 2 for the raw qPCR data.
Figure 12
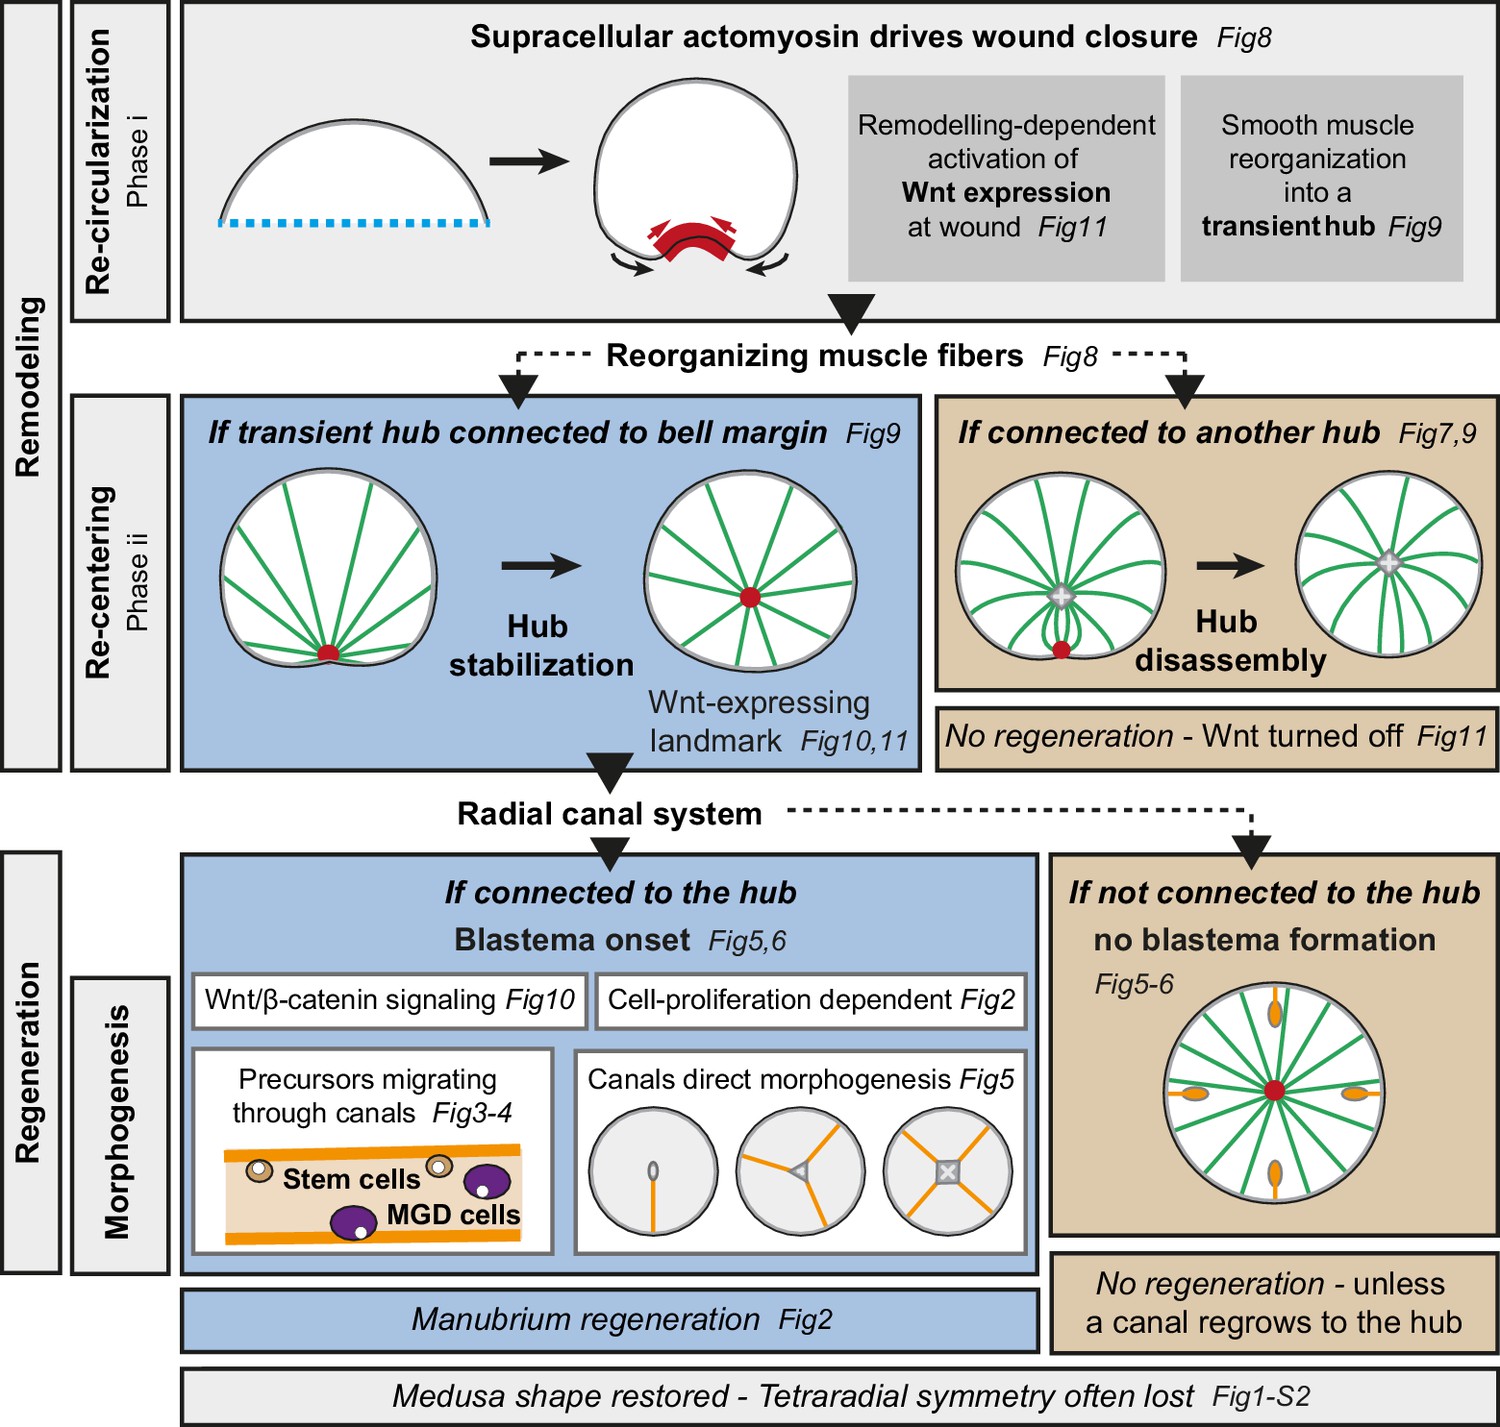
Summary figure.
Actomyosin-driven remodeling restores the circular shape (phase i), and generates a transient hub of remodeling smooth muscle fibers expressing CheWnt6. If stabilized after the re-centering step (phase ii), the hub maintains CheWnt6 expression and transforms into a Wnt-signaling landmark, enabling blastema initiation. Manubrium regeneration is fueled by cells traveling through at least one radial canal. The circular medusa shape is almost systematically restored, but the original tetraradial symmetry is often lost after completion of remodeling and regeneration.
Tables
Key resources table
| Reagent type (species) or resource | Designation | Source or reference | Identifiers | Additional information |
|---|---|---|---|---|
| Gene (Clytia hemisphaerica) | CheNanos1 | GenBank | JQ397274 | |
| Gene (Clytia hemisphaerica) | CheWnt3 | GenBank | EU374721 | |
| Gene (Clytia hemisphaerica) | CheWnt6 | GenBank | EU374719 | Named CheWnt6 following Condamine et al., 2019 |
| Gene (Clytia hemisphaerica) | CheAxin | GenBank | EU374716 | |
| Gene (Clytia hemisphaerica) | Cheβ-cat | GenBank | JQ438997 | |
| Gene (Clytia hemisphaerica) | CheBra1 | GenBank | DQ872898 | |
| Gene (Clytia hemisphaerica) | CheFoxA | GenBank | GBGP01000196 | |
| Gene (Clytia hemisphaerica) | Z4B strain | Leclère et al., 2019 | Polyp colony producing female jellyfish | |
| Antibody | Rhodamine goat anti-rabbit secondary antibody | Jackson ImmunoResearch | IF (1:500) | |
| Antibody | Alexa Fluor 488 or 594 goat anti-rat secondary antibodies | Thermo Fisher Scientific | #A-11006 #A-11007 | IF (1:200) |
| Antibody | anti-Myosin Light Chain two phosphorylated at serine19 (PMyo) rabbit polyclonal | Cell signaling technology | #3671 | IF (1:200) |
| Antibody | anti-tyrosinated tubulin antibody (YL1/2) rat monoclonal | Abcam | #6160 | IF (1:50) |
| Chemical compound, drug | Hydroxyurea | Sigma-Aldrich | #H8627 | |
| Chemical compound, drug | Blebbistatin | Sigma-Aldrich | #B0560 | |
| Chemical compound, drug | BDM (2,3-Butanedione monoxime) | Sigma-Aldrich | #B0753 | |
| Chemical compound, drug | Menthol | Sigma-Aldrich | #M2772 | |
| Chemical compound, drug | PKF118-310 | Sigma-Aldrich | #K4394 | |
| Commercial assay, kit | EdU Click-It kit (Alexa Fluor 555) | Thermo Fisher Scientific | #C10338 | |
| Other | FluoSpheres | Molecular Probes | #F8812 | |
| Other | DiI | Thermo Fisher Scientific | #D3911 | |
| Other | Alexa Fluor 488 Phalloidin | Thermo Fisher Scientific | #10125092 | (1:100) |
| Other | Hoechst dye | Sigma-Aldrich | #94403 | (1 µg/ml) |
| Other | Reference transcriptome (Clytia hemisphaerica) | Leclère et al., 2019 | ENA identifier: PRJEB28006 | Genome guided transcriptome |
| Other | RNAseq samples (Clytia hemisphaerica) | This study | ENA identifier: PRJEB37920 | BGISEQ-500 50nt single reads generated for 12 RNA samples:pooled samples of umbrella central area collected at six time points during manubrium regeneration (two biological replicates for each). |
Additional files
Download links
A two-part list of links to download the article, or parts of the article, in various formats.
Downloads (link to download the article as PDF)
Open citations (links to open the citations from this article in various online reference manager services)
Cite this article (links to download the citations from this article in formats compatible with various reference manager tools)
Pattern regulation in a regenerating jellyfish
eLife 9:e54868.
https://doi.org/10.7554/eLife.54868


