Cell-specific exon methylation and CTCF binding in neurons regulate calcium ion channel splicing and function
- The Robert J and Nancy D Carney Institute for Brain Science & Department of Neuroscience, Brown University, United States
Figures
Figure 1 with 1 supplement
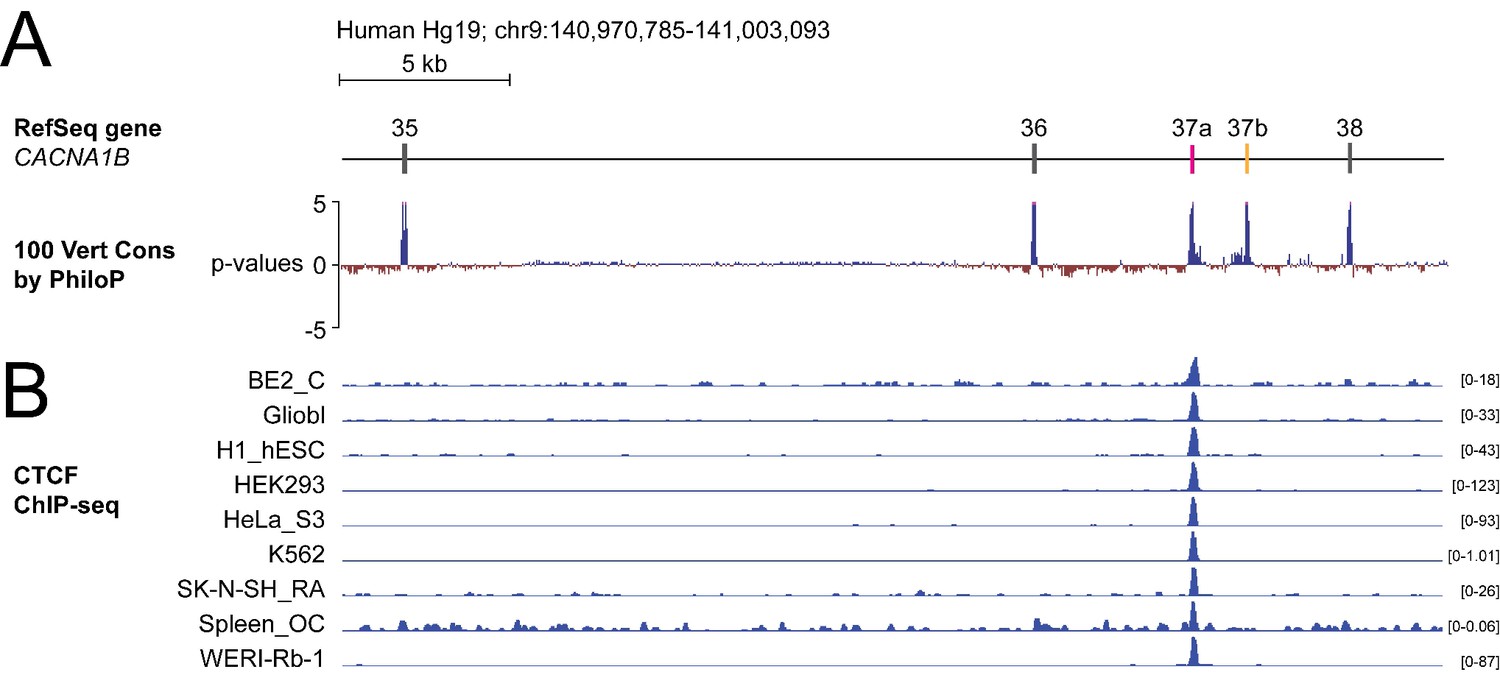
The DNA binding protein CTCF binds CACNA1B e37a but not e37b in vivo.
(A) The 100 vertebrate basewise conservation track for ~30 kb region of CACNA1B (Hg19; chr9:104,970,785–141,003,093). Five conserved elements align to e35, e36, e37a, e37b, and e38. (B) ChIP-seq signals for CTCF binding in nine different human cell lines are aligned to CACNA1B region in A. Y-axes for ChIP-seq tracks are scaled to the maximum signal within the selected region. In total, there is CTCF signal at CACNA1B e37a in 27 of 50 human cell lines. Link to the UCSC genome output (https://genome.ucsc.edu/s/ejlopezsoto/Cacna1b%20e35%20to%20e38%20conservation%20track) (ENCODE Project Consortium, 2012).
Figure 1—figure supplement 1
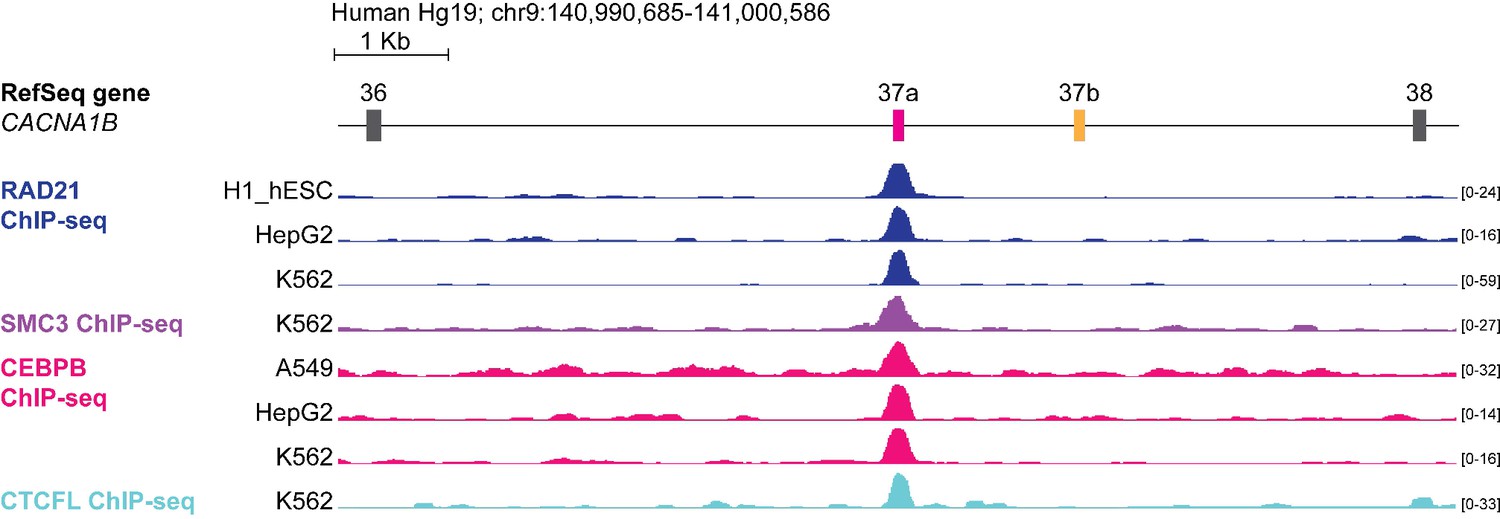
The DNA binding proteins RAD21, SMC3, CEBPB and CTCFL bind CACNA1B e37a locus in a small number of human cell lines.
ChIP-seq signals for RAD21, SMC3, CEBPB and CTCFL binding in human cell lines aligned to ~10 kb region of CACNA1B (Hg19; chr9: 140,990,685–141,000,586). Y-axes for ChIP-seq tracks are scaled to the maximum signal within the selected region. Tracks with positive binding signals are shown. In total, there were binding signals in CACNA1B e37a locus for RAD21 in 3 of 27 cell lines, SMC3 in 1 of 27 cell lines, CEBPB in 3 of 27 cell lines, and CTCFL in 1 of 27 cell lines (https://genome.ucsc.edu/s/ejlopezsoto/Cacna1b%20e35%20to%20e38%20conservation%20track) (ENCODE Project Consortium, 2012).
Figure 2 with 1 supplement
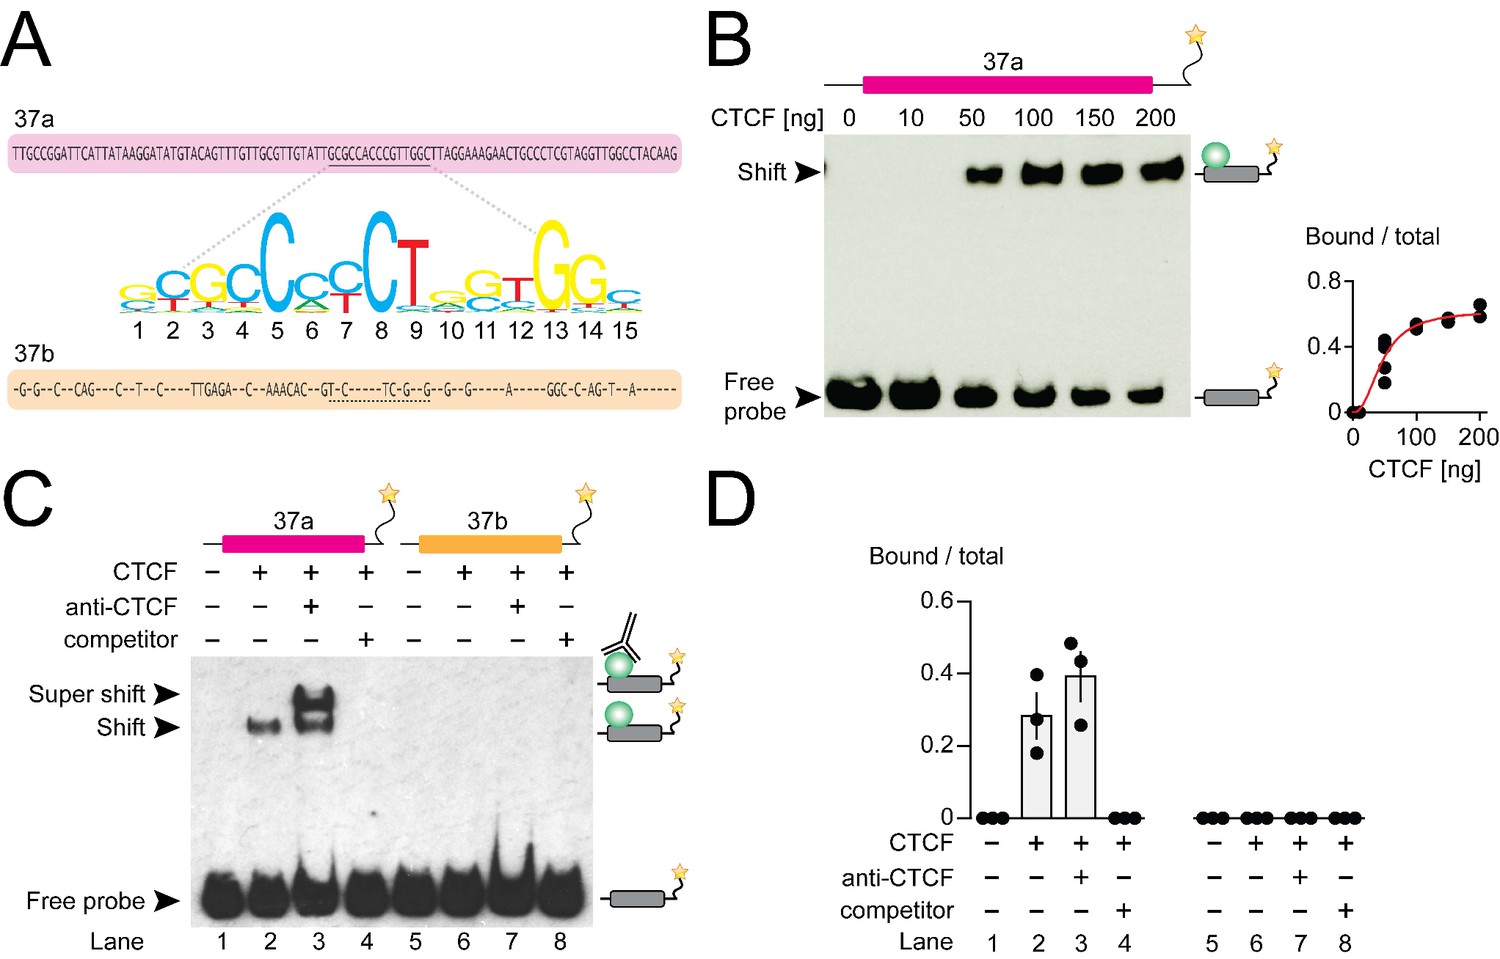
CTCF binds mouse Cacna1b e37a in vitro.
(A) Mouse Cacna1b e37a and e37b sequences are ~60% identical. Nucleotides conserved across exons are shown as dashes in the e37b sequence. A 15 nucleotide CTCF binding motif in e37a (underlined) is not present in e37b. (B) Gel shift assay for CTCF and a Cacna1b e37a DNA probe (139 bp) that also contains 5’ and 3’ flanking intron sequences alone (0 ng) or with increasing concentrations of recombinant CTCF (10–200 ng). Quantification of CTCF bound to e37a probe relative to total e37a probe at different CTCF concentrations (red line represents fitted Hill equations r2 = 0.9338; Kd = 0.0461 ± 0.0055 ng) (at least two biological replicates per CTCF concentration). (C) Gel shift assay for CTCF and DNA probes (139 bp) containing either Cacna1b e37a or e37b alone (lanes 1 and 5) or preincubated with 50 ng recombinant CTCF (lanes 2 and 6), CTCF plus 0.5 μg anti-CTCF (lanes 3 and 7), or CTCF plus 1000-fold excess unlabeled e37a or e37b probes (lanes 4 and 8). (D) Quantification of CTCF bound to e37 probes relative to total e37a or e37b probe (ANOVA P value = 0.0006 for e37a probe, Dunnett’s multi-comparison P values for lane 1 vs 2 = 0.0067, lane 1 vs 3 = 0.0009, lane 1 vs 4 = 0.9999) (three biological replicates per condition). Biological replicates represent independent gel shift assays.
Figure 2—figure supplement 1
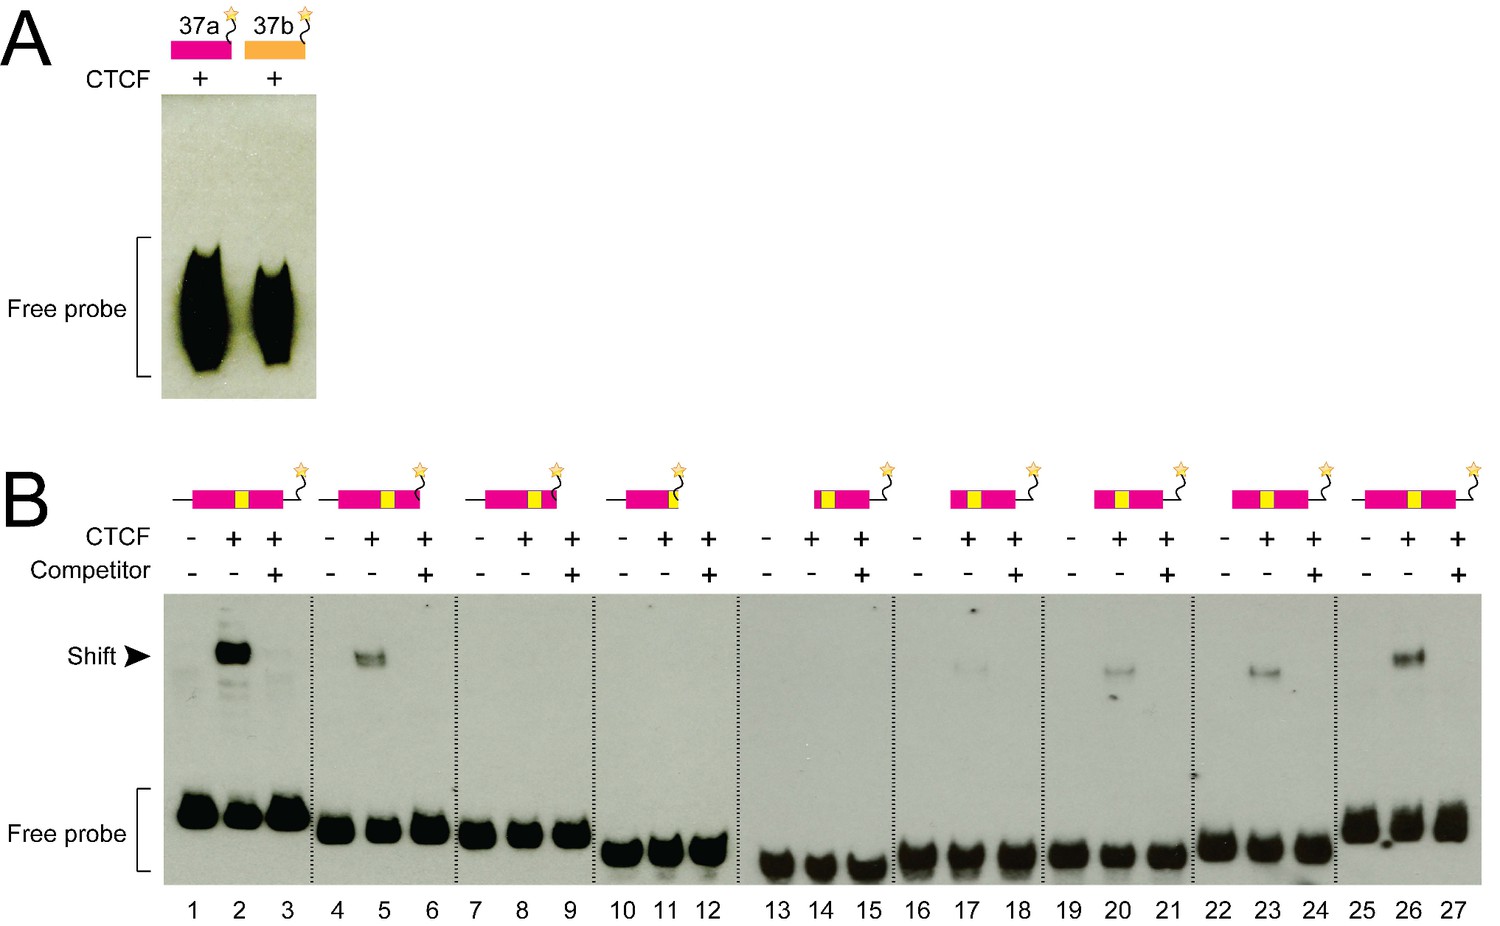
CTCF does not bind RNA Cacna1b e37a and CTCF binding to DNA Cacna1b e37a in vitro increases with probe length.
(A) RNA gel shift assay for Cacna1b probes (97 bp) containing e37a or e37b with 50 ng recombinant CTCF. (B) DNA gel shift assay for different length e37a Cacna1b DNA probes. Full length, 3’ truncated, and 5’ truncated DNA probes containing e37a either alone (lanes 1, 4, 7, 10, 13, 16, 19, 22 and 25) or preincubated with 50 ng recombinant CTCF (lanes 2, 5, 8, 11, 14, 17, 20, 23 and 26), or CTCF plus 1000-fold excess unlabeled e37a competitor (lanes 3, 6, 9, 12, 15, 18, 21, 24 and 27). Cacna1b probes containing e37a (purple) and CTCF binding motif (yellow) are shown. 3’ truncated DNA probes are shown in lanes 4 to 12, and 5’ truncated DNA probes in lanes 13 to 27.
Figure 3
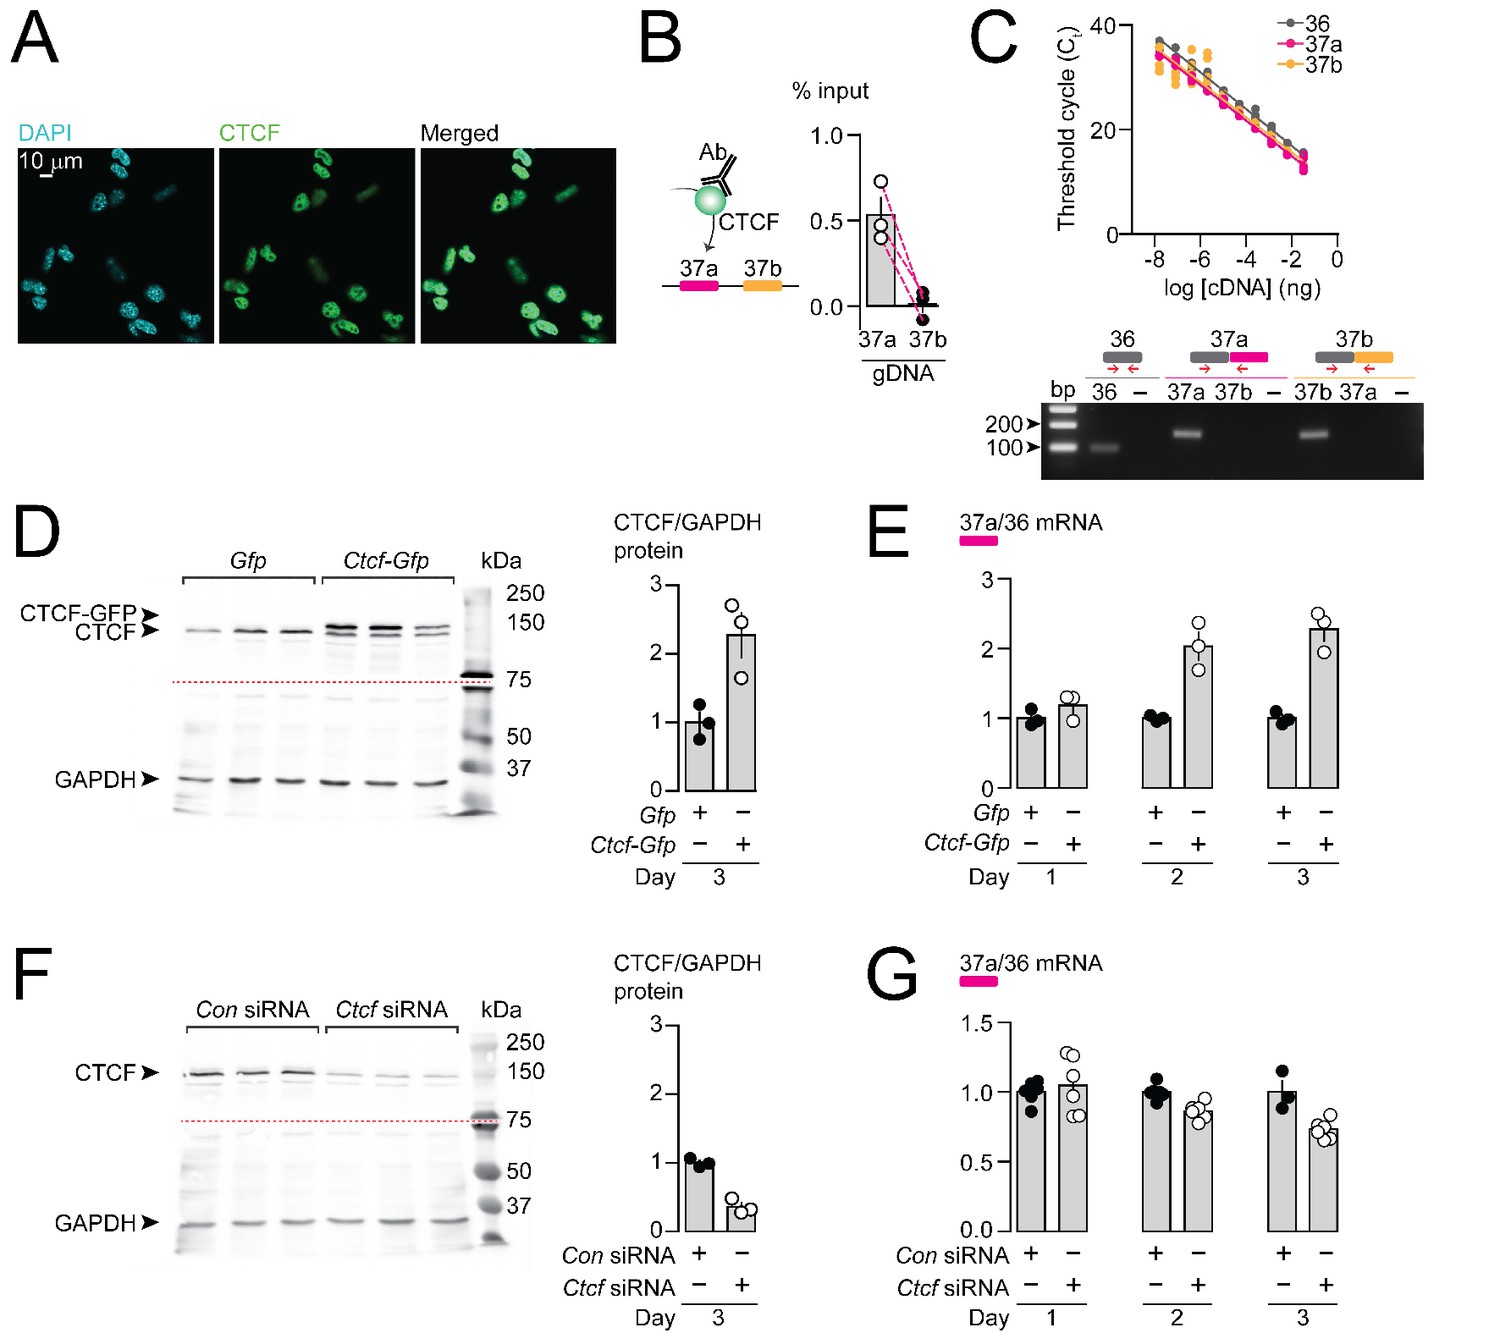
CTCF binds Cacna1b e37a locus in DRG-derived F11 cells and influences e37a splicing.
(A) CTCF is expressed in F11 cells and is localized to cell nuclei. Fluorescence images show DAPI (nuclear maker), anti-CTCF, and overlay. (B) CTCF ChIP-qPCR targeted to Cacna1b e37 loci in F11 cells (Paired t-test, P value = 0.0274 for e37a vs e37b) (three biological replicates per condition). (C) Efficiency and specificity of qPCR primers. Cacna1b e36, e37a and e37b-specific primers amplify DNA with similar log-linear relationships between 1 × 10⁻⁸ and 1.5 × 10⁻¹ ng cDNA (upper panel) (gray, pink and orange lineal regression lines for e36, e37a and e37b data sets have similar slopes; Fisher's tests P value = 0.4383). qPCR primer specificity was confirmed by using Cacna1b e37a and e37b cDNA clones (lower panel). (D) Western blot from F11 cells expressing control Gfp or Ctcf-Gfp cDNA 3 days after transfection. In control cells, anti-CTCF identifies a single band at ~135 kDa. Whereas, in cells overexpressing Ctcf-Gfp, anti-CTCF identifies two bands, endogenous ~135 kDa and a second ~160 kDa band consistent with the expected size of the CTCF-GFP fusion protein. Transfer membrane was cut at ~75 kDa (dotted red line) and the lower part treated with anti-GAPDH to measure GAPDH levels for protein expression and loading reference. CTCF protein levels relative to GAPDH (t-test P value = 0.0227 for Gfp vs Ctcf-Gfp) (three biological replicates per condition). (E) qRT-PCR of Cacna1b e37a relative to e36 in F11 cells overexpressing Gfp or Ctcf -Gfp cDNA over three days (t-test P values = 0.2263 for Gfp vs Ctcf -Gfp for day 1; p=0.0065 for day 2; and p=0.0019 for day 3) (three biological replicates per condition). (F) Western blot from F11 cells expressing control siRNA (Con) or Ctcf siRNA 3 days after transfection. In control cells, anti-CTCF identifies endogenous CTCF at ~135 kDa, and reduced CTCF levels in cells expressing Ctcf siRNA. Transfer membrane was cut at ~75 kDa (dotted red line) and the lower part treated with anti-GAPDH to measure GAPDH levels for protein expression and loading reference. CTCF protein levels relative to GAPDH (t-test P value = 0.0008 for Con vs Ctcf siRNA) (three biological replicates per condition). (G) qRT-PCR of Cacna1b e37a relative to e36 in F11 cells expressing control siRNA (Con) or Ctcf siRNA over three days (t-test P values = 0.6035 for Con vs Ctcf siRNA for day 1; p=0.0022 for day 2; and p=0.0046 for day 3) (at least three biological replicates per condition). Biological replicates represent independent cell cultures, treatment and transfections.
Figure 4 with 1 supplement
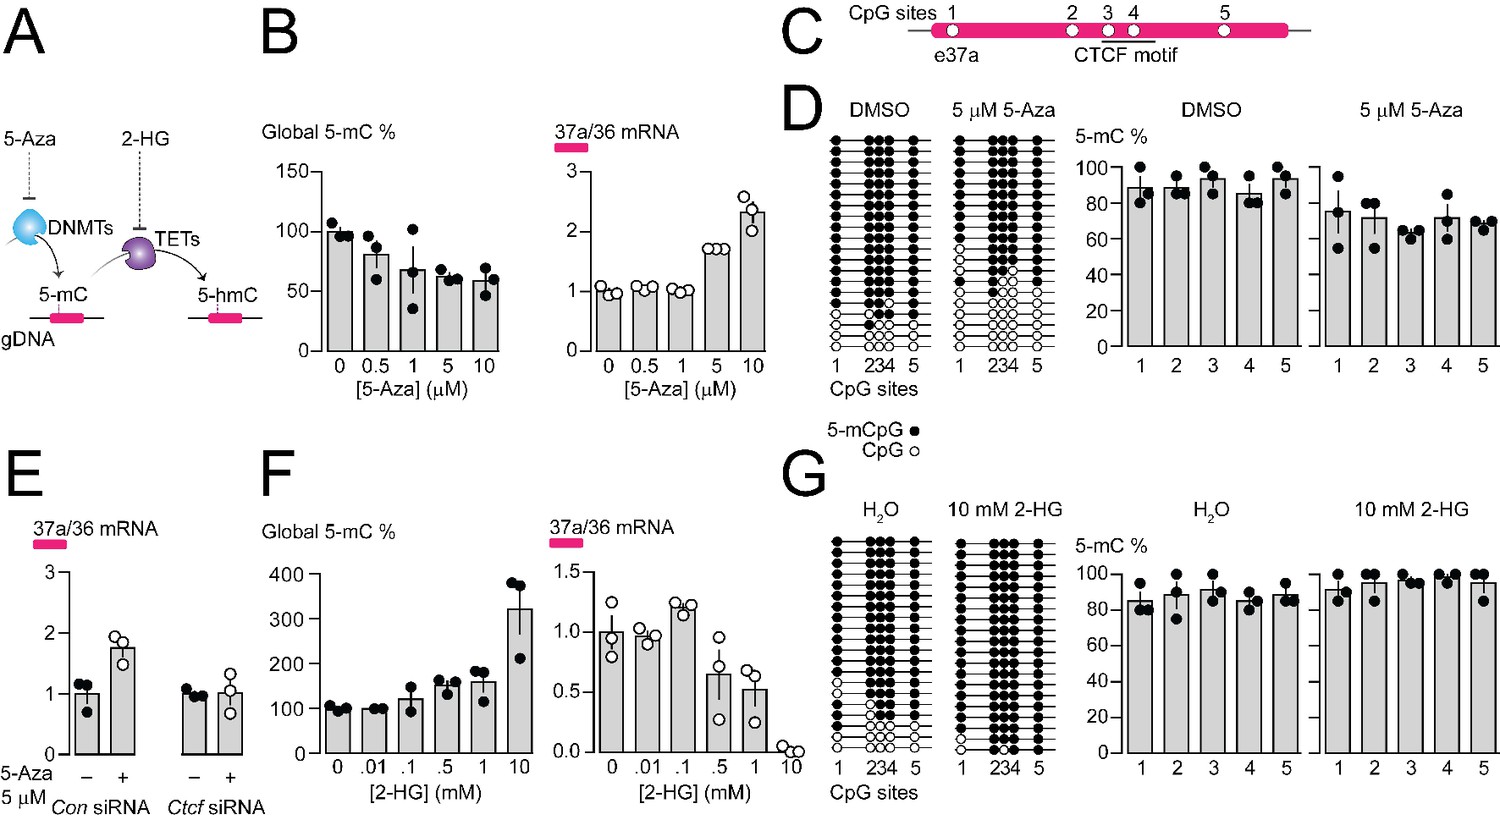
Pharmacological manipulation of gDNA methylation in F11 cells alters 5-mC levels at CpG sites in Cacna1b e37a locus and e37a inclusion.
(A) 5-Azacytidine (5-Aza) inhibits the activity of DNA methyltransferases (DNMTs), and 2-hydroxyglutarate (2-HG) inhibits the activity of ten-eleven translocation proteins (TETs). (B) Global 5-mC levels in F11 cells after 3 day exposure to different concentrations of 5-Aza (left) (ANOVA P value = 0.056, Dunnett’s multi-comparison P values for 0 vs 0.5 μM = 0.5371, 0 vs 1 μM = 0.1333, 0 vs 5 μM = 0.0688, 0 vs 10 μM = 0.0421, and 0 vs 10 μM = 0.0280) and associated qRT-PCR of Cacna1b e37a relative to e36 levels (right) (ANOVA P value = <0.0001, Dunnett’s multi-comparison P values for 0 vs 0.5 μM = 0.9874, 0 vs 1 μM = 0.9998, 0 vs 5 μM = 0.0015, 0 vs 10 μM = <0.0001) (three biological replicates per condition). (C) Location of 5 CpG sites in Cacna1b e37a locus (open circles) and CTCF binding motif (underlined). (D) 5-mC levels at CpG sites in Cacna1b e37a locus in control F11 cells (DMSO, left) and after 3 day treatment with 5 μM 5-Aza (right). Methylated (5-mCpG, filled circle) and unmethylated (CpG, open circle) sites are shown for independent clones ordered from most to least methylated. 5-mC levels for both conditions (two-way ANOVA P value = 0.0260 for treatment factor) (three biological replicates per condition). (E) qRT-PCR of Cacna1b e37a relative to e36 in F11 cells in the absence and after 3 day treatment with 5 μM 5-Aza for cells expressing control siRNA (Con) or Ctcf siRNA (t-test P value = 0.0219 for untreated vs 5-Aza with Con siRNA; and = 0.9303 for untreated vs 5-Aza with Ctcf siRNA) (three biological replicates per condition). (F) Global 5-mC levels in F11 cells following 1 day exposure to different concentrations of 2-HG (left) (ANOVA P value = 0.0022, Dunnett’s multi-comparison P values for 0 vs 0.01 mM = >0.9999, 0 vs 0.1 mM = 0.9878, 0 vs 0.5 mM = 0.6062, 0 vs 1 mM = 0.4755, and 0 vs 10 mM = 0.0010), and associated qRT-PCR of Cacna1b e37a relative to e36 levels (right) (ANOVA P value = 0.0001, Dunnett’s multi-comparison P values for 0 vs 0.01 mM = 0.9997, 0 vs 0.1 mM = 0.6026, 0 vs 0.5 mM = 0.1799, 0 vs 1 mM = 0.0487, and 0 vs 10 mM = 0.0003) (three biological replicates per condition). (G) 5-mC levels at CpG sites in Cacna1b e37a locus in control F11 cells (H2O, left) and after 1 day treatment with 10 mM 2-HG (right). Methylated (5-mCpG, filled circle) and unmethylated (CpG, open circle) sites are shown for independent clones ordered from most to least methylated. 5-mC levels for both conditions (two-way ANOVA P value = 0.0745 for treatment factor) (three biological replicates per condition). Biological replicates represent independent cell cultures, treatment and transfections.
Figure 4—figure supplement 1
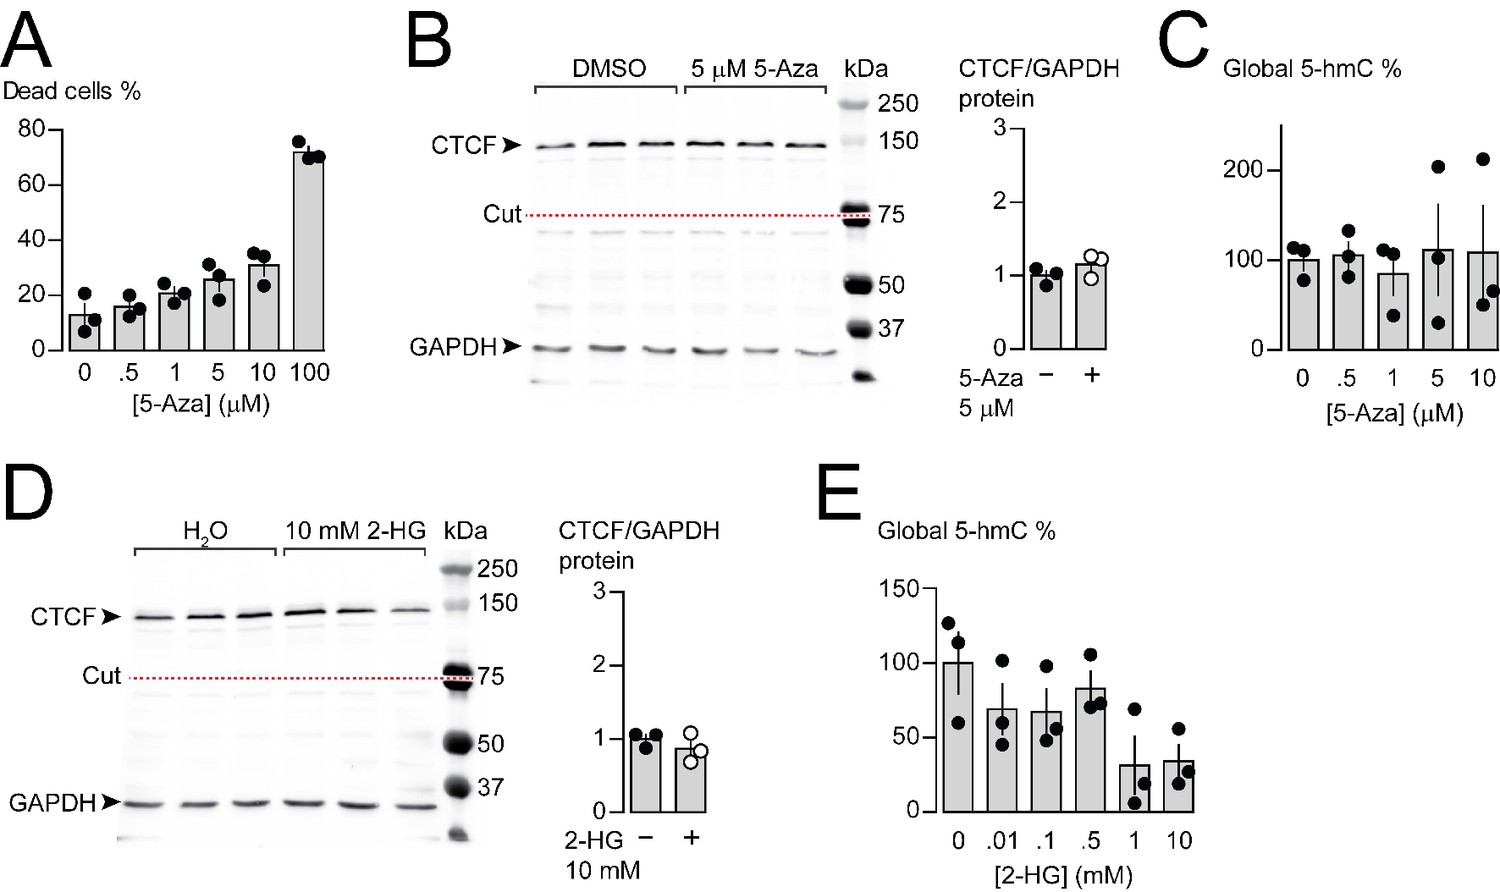
Effects of 5-Azacytidine and 2-hydroxyglutarate on cytotoxicity, CTCF and 5-hmC levels in F11 cells.
(A) F11 cytotoxicity with different concentrations of 5-Azacytidine (5-Aza) for 3 days (ANOVA P value = <0.0001, Dunnett’s multi-comparison P values for 0 vs 0.5 μM = 0.9380, 0 vs 1 μM = 0.3112, 0 vs 5 μM = 0.0518, 0 vs 10 μM = 0.0061, 0 vs 100 μM = <0.0001) (three biological replicates per condition). (B) CTCF protein levels in F11 cells after 3 days of control (DMSO) or 5 μM 5-Aza treatment. Anti-CTCF identifies a single band at ~135 kDa. Transfer membrane was cut at ~75 kDa (dotted red line) and the lower part treated with anti-GAPDH to measure GAPDH levels for protein expression and loading reference. CTCF protein levels relative to GAPDH (t-test P value = 0.2637 for DMSO vs 5-Aza) (three biological replicates per condition). (C) Global 5-hydroxymethylcytosine (5-hmC) levels in F11 cells after 3 days exposure to different concentrations of 5-Aza (ANOVA P value = 0.9832, Dunnett’s multi-comparison P values for 0 vs 0.5 μM = 0.9998, 0 vs 1 μM = 0.9935, 0 vs 5 μM = 0.9975, and 0 vs 10 μM = 0.99971) (three biological replicates per condition). (D) CTCF protein levels in F11 cells after 1 day of control (H2O) or 10 mM 2-hydroxyglutarate (2-HG) treatment. Anti-CTCF identifies a single band at ~135 kDa. Transfer membrane was cut at ~75 kDa (dotted red line) and the lower part treated with anti-GAPDH to measure GAPDH levels for protein expression and loading reference. CTCF protein levels relative to GAPDH (t-test P value = 0.3716 for H2O vs 2-HG) (three biological replicates per condition). (E) Global 5-hmC levels in F11 cells after 1 day exposure to different concentrations of 2-HG (ANOVA P value = 0.0667, Dunnett’s multi-comparison P values for 0 vs 0.01 mM = 0.5444, 0 vs 0.1 mM = 0.4971, 0 vs 0.5 mM = 0.9087, 0 vs 1 mM = 0.0417, and 0 vs 1 mM = 0.0511) (three biological replicates per condition). Biological replicates represent independent cell cultures, treatment and transfections.
Figure 5

The DNA methyltransferase 3a inhibits, and ten-eleven translocating protein 1 and 2 promote Cacna1b e37a inclusion.
(A) DNA methyltransferases (DNMTs) methylate CpG sites in gDNA. qRT-PCR of Cacna1b e37a relative to e36 levels in F11 cells in the absence and after 3 day treatment with 5 μM 5-Aza (t-test P value = 0.0923), and in cells expressing control siRNAs (Con) or siRNAs targeting Dnmt1, Dnmt3a, or Dnmt3b after 3 days (ANOVA P value = 0.0002, Dunnett’s multi-comparison P values for Con vs Dnmt1 siRNA = 0.6925, Con vs Dnmt3a siRNA = 0.0003, and Con vs Dnmt3b siRNA = 0.9226) (three biological replicates per condition). (B) Ten-eleven translocating proteins (TETs) promote demethylation of CpG sites in gDNA. qRT-PCR of Cacna1b e37a relative to e36 levels in F11 cells expressing control Gfp, Tet1, Tet2, or Tet3 cDNAs for 3 days (ANOVA P value = <0.0001, Dunnett’s multi-comparison P values for Gfp vs Tet1 cDNA = <0.0001, Gfp vs Tet2 cDNA = 0.0008, and Gfp vs Tet3 cDNA = 0.8676) (three biological replicates per condition). (C) dCAS-targeting strategy to localize TET1 to Cacna1b e37a locus using guide RNAs (gRNA). qRT-PCR of Cacna1b e37a relative to e36 levels in F11 cells expressing dCas9-Tet1 alone (Con) or with gRNAs to the 5’ (1) or 3’ (2) ends of Cacna1b e37a locus or non-targeting gRNA (nt) (ANOVA P value = 0.0010, Dunnett’s multi-comparison P values for Con vs gRNA 1 = 0.0010, Con vs gRNA 2 = 0.0186, and Con vs gRNA nt = 0.9914) (three biological replicates per condition). Biological replicates represent independent cell cultures, treatment and transfections.
Figure 6
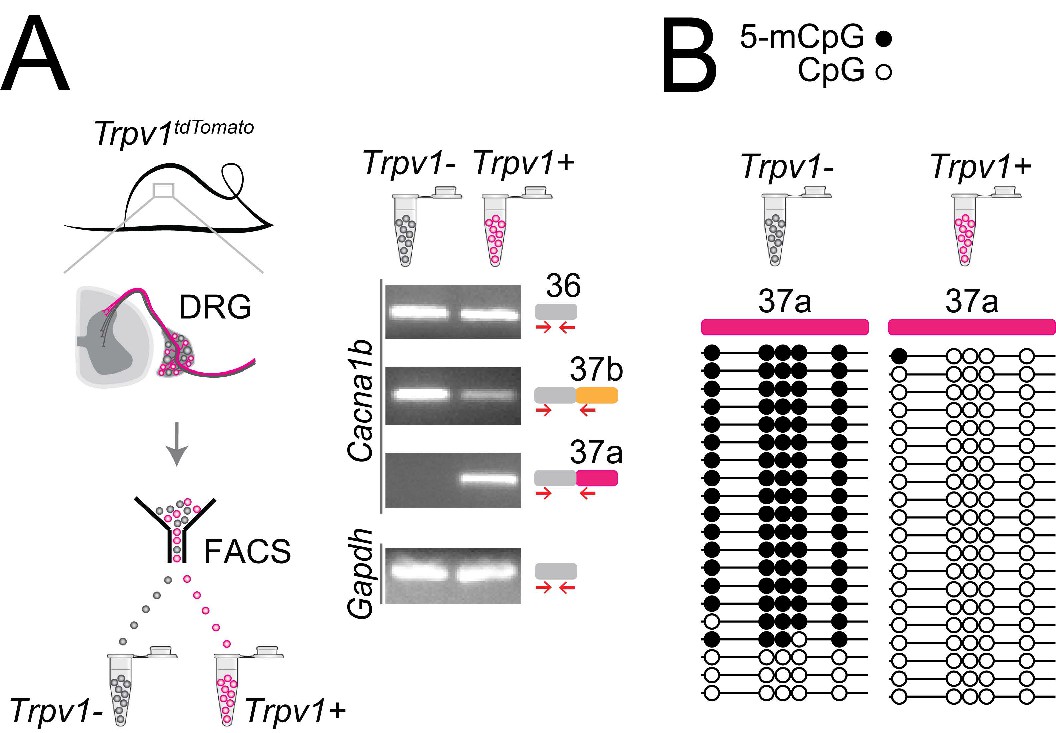
Cell-specific Cacna1b e37a inclusion and methylation in Trpv1-lineage nociceptors.
(A) Trpv1Cre mouse strain crossed to lox-STOP-loxTdTomato expressed the TdTomato reporter in Trpv1-lineage neurons (Trpv1TdTomato). DRG cells were separated into Trpv1-lineage and non-Trpv1-lineage cells by fluorescence-activated cell sorting (FACS). Using specific primer pairs RT-PCR products amplified: constitutive Cacna1b e36, alternative spliced e37a and e37b, and Gapdh in Trpv1-lineage and non Trpv1-lineage cells for all primer pairs except for non Trpv1-lineage cells that failed to amplify from e37a-specific primers. Data shown are representative of a biological replicate from at least three different FACS-separated DRGs from three animals. (B) Methylation state of 5 CpG sites in Cacna1b e37a locus in non Trpv1-lineage (left) and in Trpv1-lineage neurons (right). Methylated (5-mCpG, filled circle) and unmethylated (CpG, open circle) sites are shown for independent clones ordered from most to least methylated. Each set of sequences represents data pooled from at least 10 FACS-separated DRG cells from one animal. These results are confirmed in Figure 7D for six additional animals.
Figure 7

Methylation in Cacna1b e37a locus increased and e37a inclusion decreased in Trpv1-lineage neurons following peripheral nerve injury.
(A) Spared nerve injury (SNI) model was used to induce prolonged hyperalgesia in Trpv1TdTomato mice. Behavioral assessments are shown in B. Trpv1-lineage and non Trpv1-lineage cells of contralateral and ipsilateral L3 and L4 DRG from Sham and SNI mice were separated by FACS. Trpv1-lineage neurons were analyzed by qRT-PCR in C, and Trpv1-lineage and non Trpv1-lineage cells pooled from three mice per condition for bisulfite sequencing in D. (B) Thermal sensitivity assessment of mice prior to, and 8 days after surgery. Plantar, hind paw withdrawal latencies measured in response to a radiant heat source both ipsilateral and contralateral to the site of surgery in sham and SNI mice. SNI mice developed hyperalgesia in ipsilateral but not contralateral hind paws (two-way ANOVA P value = 0.0173 for side to the surgery factor, and P value = <0.0001 for time factor). By contrast, sham surgery had no effect on paw withdrawal latencies in response to heat source (two-way ANOVA P value = 0.2136 for side to the surgery factor, and P value = 0.7780 for time factor) (four biological replicates per condition). (C) qRT-PCR of e37a relative to e36 in Trpv1-lineage neurons. Dotted lines connect contra and ipsilateral L3 and L4 DRG values from the same animals (Paired t-test P values for contra vs ipsilateral DRG = 0.3671 from sham, and P value = 0.0384 from SNI mice) (four biological replicates per condition). (D) Methylation state of 5 CpG sites in Cacna1b e37a locus in non Trpv1-lineage and in Trpv1-lineage neurons from L3 and L4 DRG ipsilateral to the site of surgery for sham (left) and SNI (right) mice. Methylated (5-mCpG, filled circle) and unmethylated (CpG, open circle) sites are shown for independent clones ordered from most to least methylated. Each set of sequences represents data pooled from L3 and L4 DRG from three animals, for a total of 6 animals per condition. Biological replicates are independent mice.
Figure 8
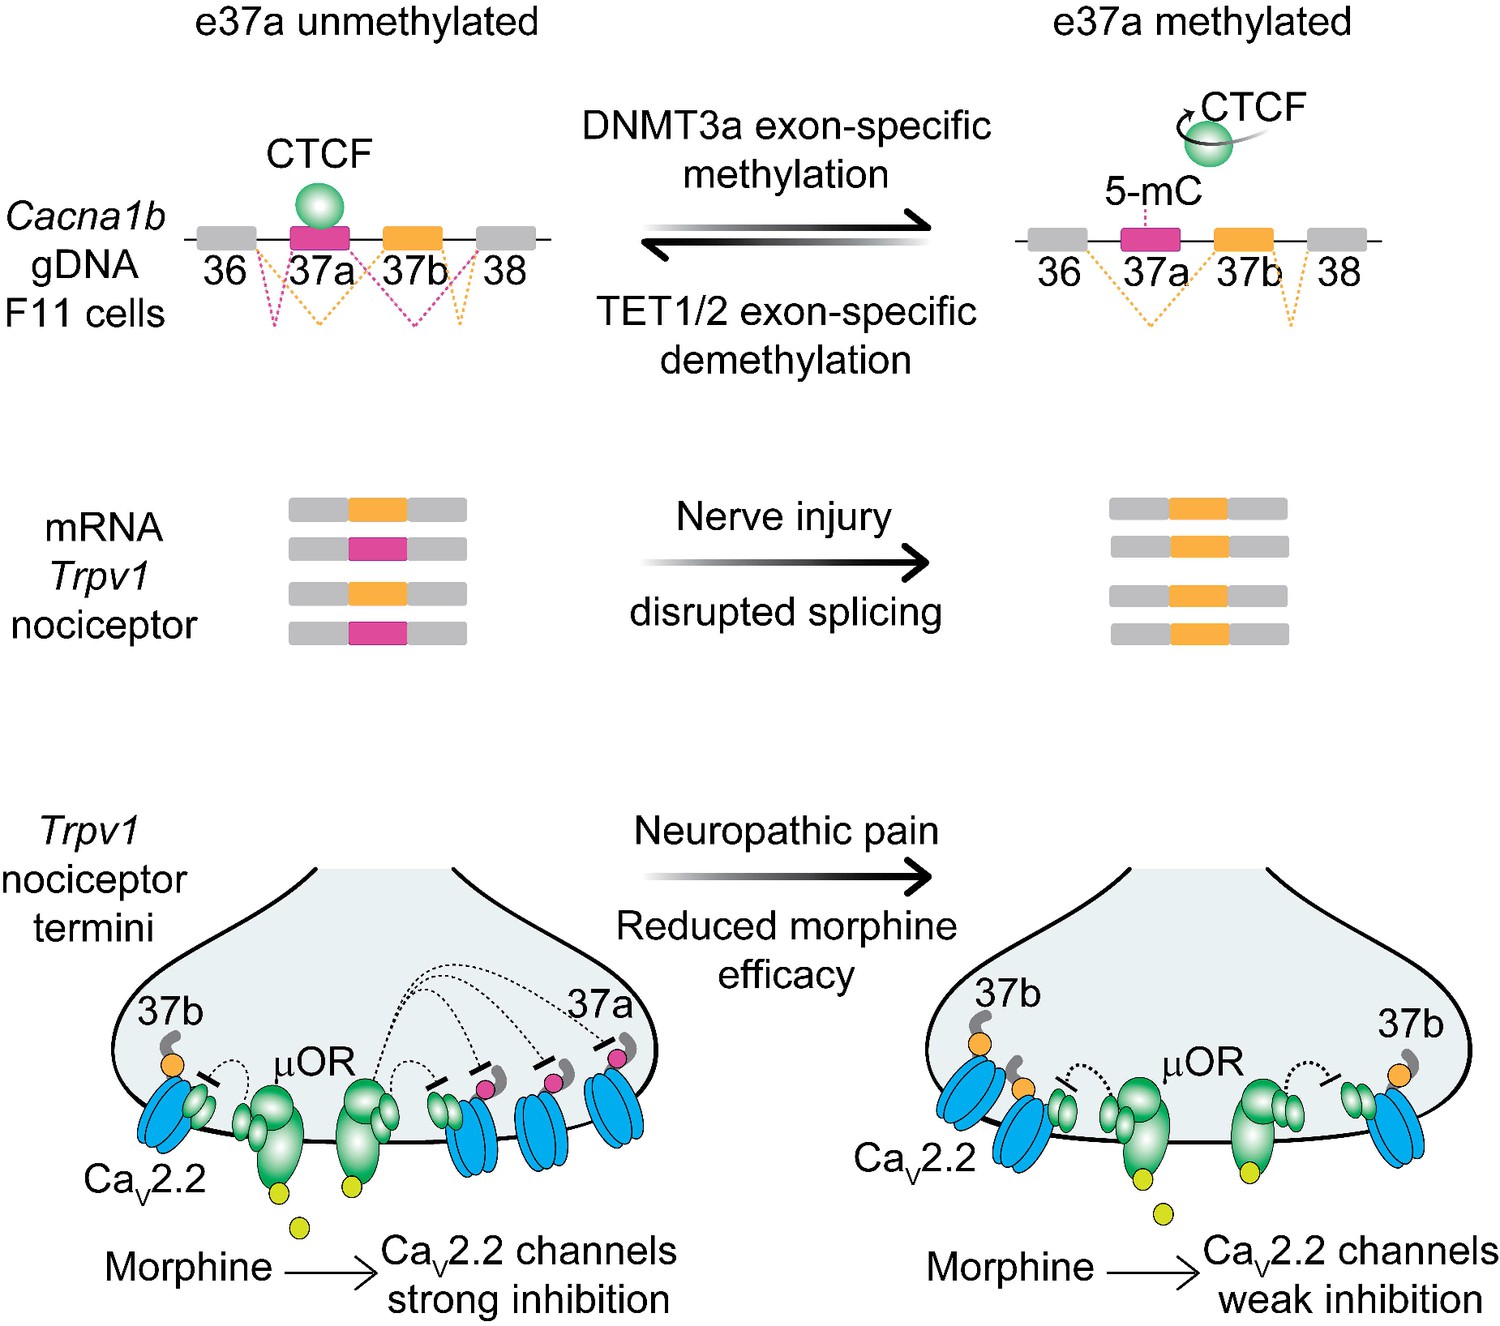
Proposed model for cell-specific epigenetic modifications in a synaptic calcium ion channel gene controls cell-specific splicing.
In naïve animals, in most neurons, Cacna1b e37a locus is hypermethylated (5-mC) and CTCF is presumed not to bind this locus based on our results in the DRG-derived F11 cell line. During splicing, e37a is skipped and Cacna1b mRNAs include e37b. In contrast, in Trpv1-lineage neurons, Cacna1b e37a locus is hypomethylated and is presumed to be permissive for CTCF binding. Hypomethylation promotes e37a inclusion and both Cacna1b e37a and e37b mRNAs are expressed. E37a confers strong sensitivity to the CaV2.2 channel to inhibition by μ-opioid receptors (μOR; [Andrade et al., 2010; Raingo et al., 2007]). Morphine is more effective at inhibiting e37a-containing CaV2.2 channels. After peripheral nerve injury that results in pathological pain, methylation level of Cacna1b e37a locus is increased, CTCF binding is presumed to be impaired, and Cacna1b e37a mRNA levels are decreased. This disrupted splicing pattern is associated with reduced efficacy of morphine in vivo (Jiang et al., 2013).
Additional files
-
Supplementary file 1
Key resources table.
- https://cdn.elifesciences.org/articles/54879/elife-54879-supp1-v2.docx
-
Transparent reporting form
- https://cdn.elifesciences.org/articles/54879/elife-54879-transrepform-v2.pdf
Download links
A two-part list of links to download the article, or parts of the article, in various formats.
Downloads (link to download the article as PDF)
Open citations (links to open the citations from this article in various online reference manager services)
Cite this article (links to download the citations from this article in formats compatible with various reference manager tools)
Cell-specific exon methylation and CTCF binding in neurons regulate calcium ion channel splicing and function
eLife 9:e54879.
https://doi.org/10.7554/eLife.54879


