The pattern of nodal morphogen signaling is shaped by co-receptor expression
- Department of Molecular and Cellular Biology, Harvard University, United States
- Systems, Synthetic, and Quantitative Biology PhD Program, Harvard University, United States
- Biozentrum, University of Basel, Switzerland
- Allen Discovery Center for Cell Lineage Tracing, University of Washington, United States
Figures
Figure 1 with 2 supplements
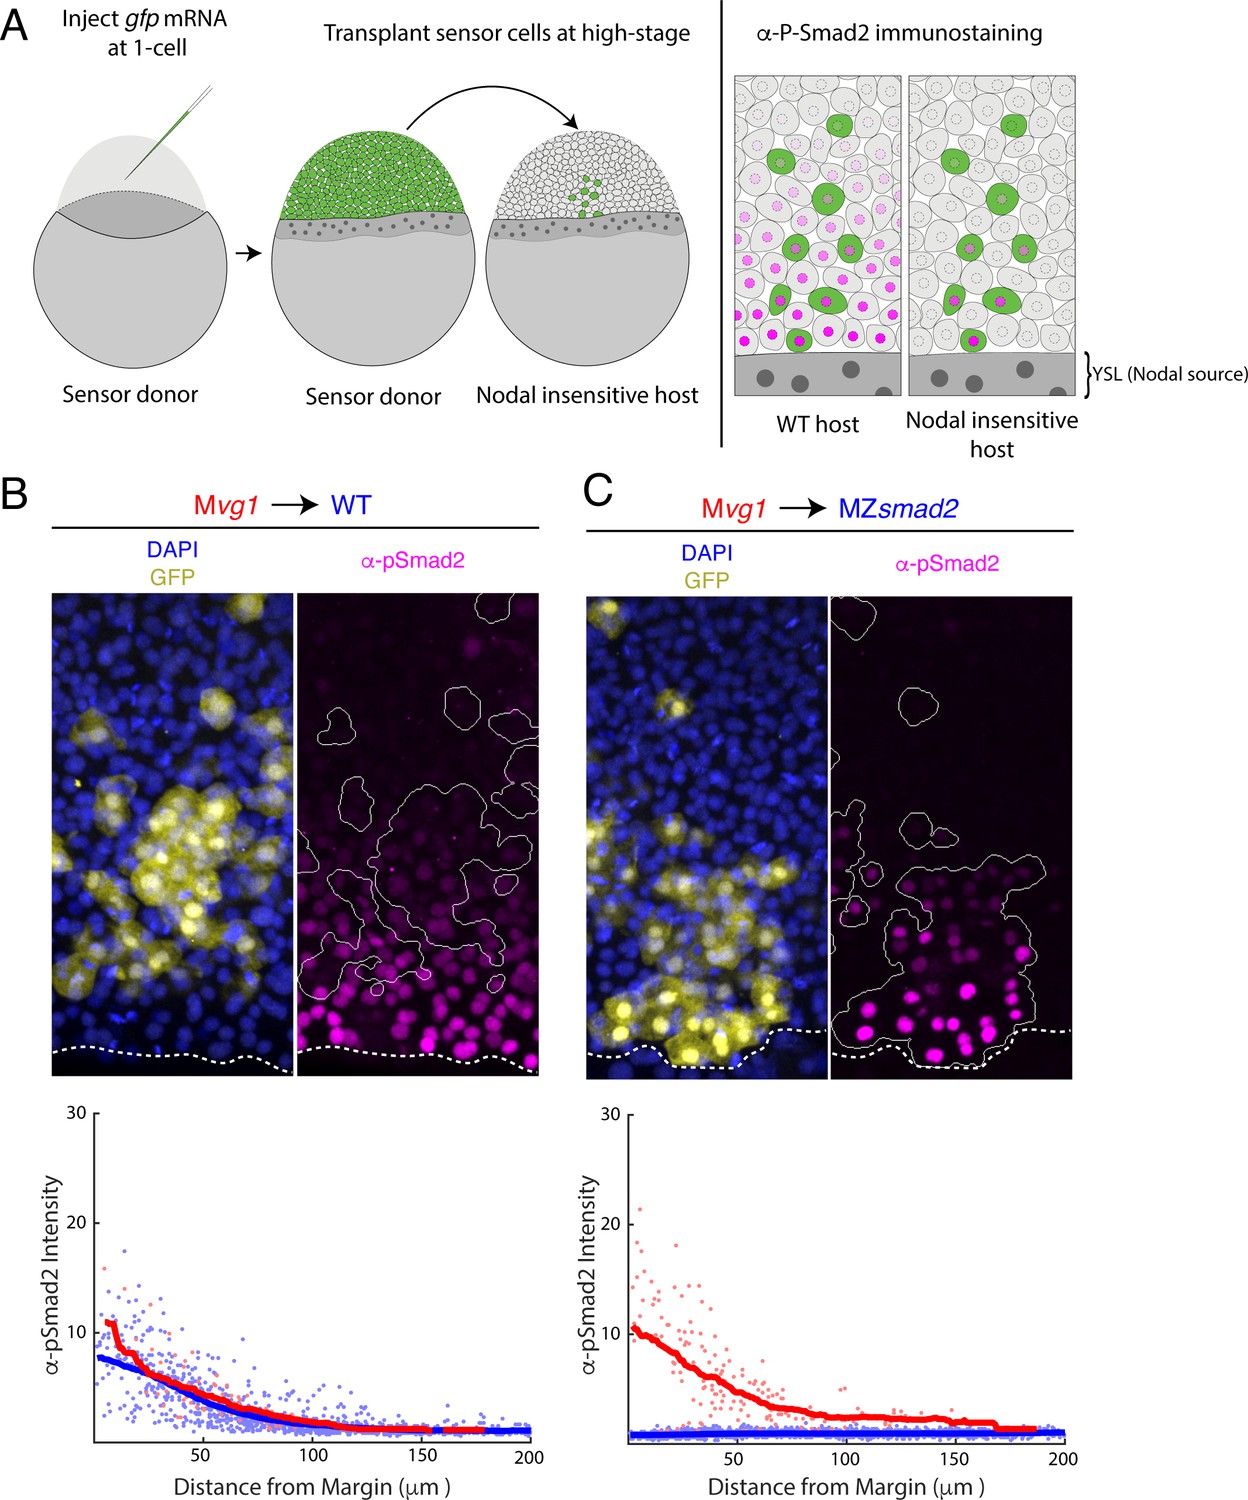
Nodal gradient formation in the absence of feedback.
(A) Schematic of sensor cell assay. Mvg1 donor embryos were marked by injecting gfp mRNA at the 1-cell stage. At high stage, just before the onset of Nodal signaling, GFP-marked sensor cells were transplanted from the animal pole of the donor to the margin of a Nodal-insensitive host. At 50% epiboly, embryos were fixed and immunostained for GFP and Nodal signaling activity (α-pSmad2). Imaging of chimeric embryos (far right) enables inference of the gradient shape from α-pSmad2 staining (magenta) in sensor cells (green). Because host embryos lack the ability to respond to Nodal, YSL-derived Nodal ligands are responsible for the shape of the Nodal signaling gradient. (B) Control visualization of the Nodal signaling gradient in wild-type hosts using a sensor cell assay. Upper panel; Mvg1 sensor cells (yellow) were transplanted to the margin of a wild-type host. Nodal signaling was visualized by α-pSmad2 staining (magenta), and sensor cell boundaries were segmented with an automated pipeline (white curves). YSL boundaries are marked with dashed white curves. Lower panel; quantification of staining intensity in host (blue) and sensor (red) cells across replicate embryos. Nuclei were segmented from DAPI signal using an automated analysis pipeline implemented in MATLAB. Sensor and host cells were identified as being clearly GFP positive or negative, respectively. Solid curves represent sliding window averages. Plot was derived from three replicate embryos. (C) Sensor cell assay in MZsmad2 host embryos. Upper panel; GFP-marked Mvg1 sensor cells (yellow) were transplanted to the margin of MZsmad2 host embryos. Nodal signaling was visualized with α-pSmad2 staining (magenta). Sensor cell boundaries are marked with white outlines, and YSL boundaries are marked with dashed white curves. Lower panel; quantification of host (blue) and sensor (red) cell staining intensities were carried out as in (B). Plot was derived from six replicate embryos.
-
Figure 1—source data 1
In Figure 1B, sensor cell assay results were quantified by segmenting nuclei and classifying each nucleus as host- or donor-derived by GFP intensity.
The quantified fluorescence intensities are organized in this table. Each row corresponds to an individual nucleus. The following characteristics were quantified: average GFP pixel intensity (‘GFP’), average pixel intensity for α-pSmad2 staining (‘pSmad2Raw’), α-pSmad2 staining intensity normalized to background (‘pSmad2 Normalized’), average DAPI pixel intensity (‘DAPI’), distance from the embryonic margin in μm (‘marginDist’), GFP staining status (‘GFP_Flag’, 0 denotes a cell host nucleus, one denotes a sensor cell nucleus), and embryo replicate number (‘Embryo Number’). We note that normalized α-pSmad2 staining was used to generate the figure panel.
- https://cdn.elifesciences.org/articles/54894/elife-54894-fig1-data1-v2.xlsx
-
Figure 1—source data 2
In Figure 1C, sensor cell assay results were quantified by segmenting nuclei and classifying each nucleus as host- or donor-derived by GFP intensity.
The quantified fluorescence intensities are organized in this table. Each row corresponds to an individual nucleus. The following characteristics were quantified: average GFP pixel intensity (‘GFP’), average pixel intensity for α-pSmad2 staining (‘pSmad2Raw’), α-pSmad2 staining intensity normalized to background (‘pSmad2 Normalized’), average DAPI pixel intensity (‘DAPI’), distance from the embryonic margin in μm (‘marginDist’), GFP staining status (‘GFP_Flag’, 0 denotes a cell host nucleus, one denotes a sensor cell nucleus), and embryo replicate number (‘Embryo Number’). We note that normalized α-pSmad2 staining was used to generate the figure panel.
- https://cdn.elifesciences.org/articles/54894/elife-54894-fig1-data2-v2.xlsx
Figure 1—figure supplement 1
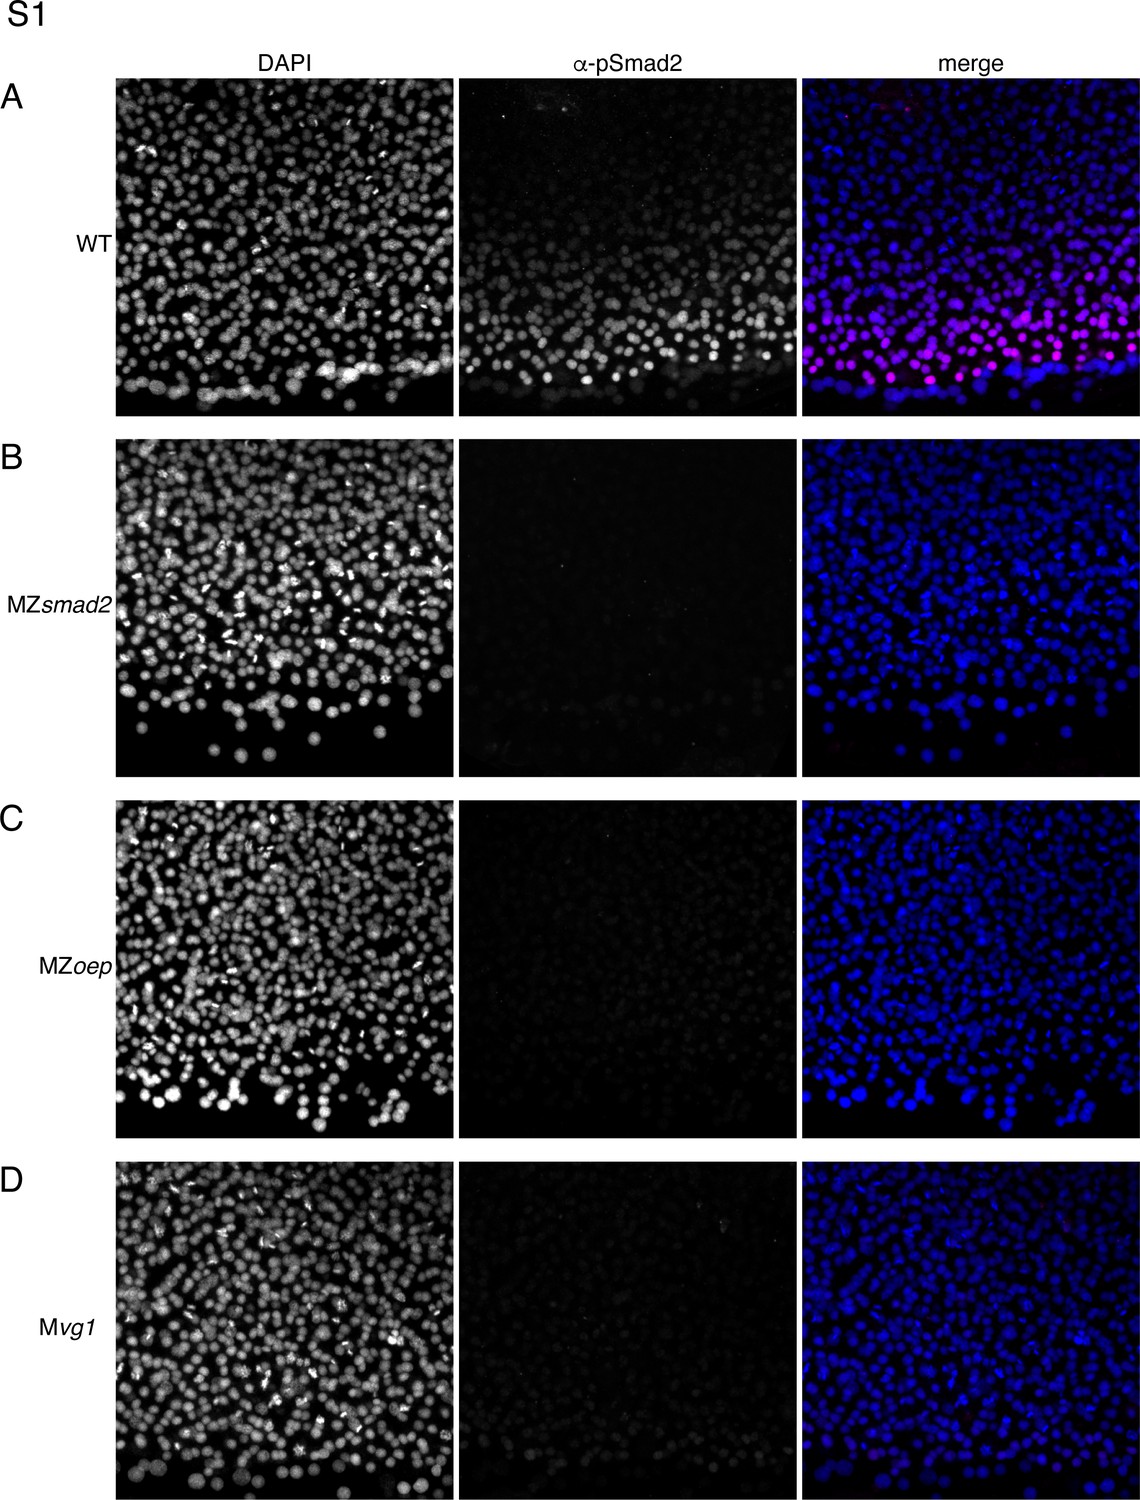
MZsmad2, Mvg1, and MZoep mutants lack pSmad2.
This experiment summarizes control experiments that verify that our α-pSmad2 staining protocol detects Nodal signaling activity in wild-type embryos but not MZsmad2, MZoep, or Mvg1 mutants. Pixel intensities are directly comparable between all α-pSmad2 channel images. (A) Flat-mount image of wild-type 50% epiboly embryo stained with DAPI and α-pSmad2 antibody. Images are maximum intensity projections from a representative embryo. (B) Flat-mount image of MZsmad2 50% epiboly embryo stained with DAPI and α-pSmad2 antibody. Images are maximum intensity projections from a representative embryo. (C) Flat-mount image of MZoep 50% epiboly embryo stained with DAPI and α-pSmad2 antibody. Images are maximum intensity projections from a representative embryo. (D) Flat-mount image of Mvg1 50% epiboly embryo stained with DAPI and α-pSmad2 antibody. Images are maximum intensity projections from a representative embryo.
Figure 1—figure supplement 2
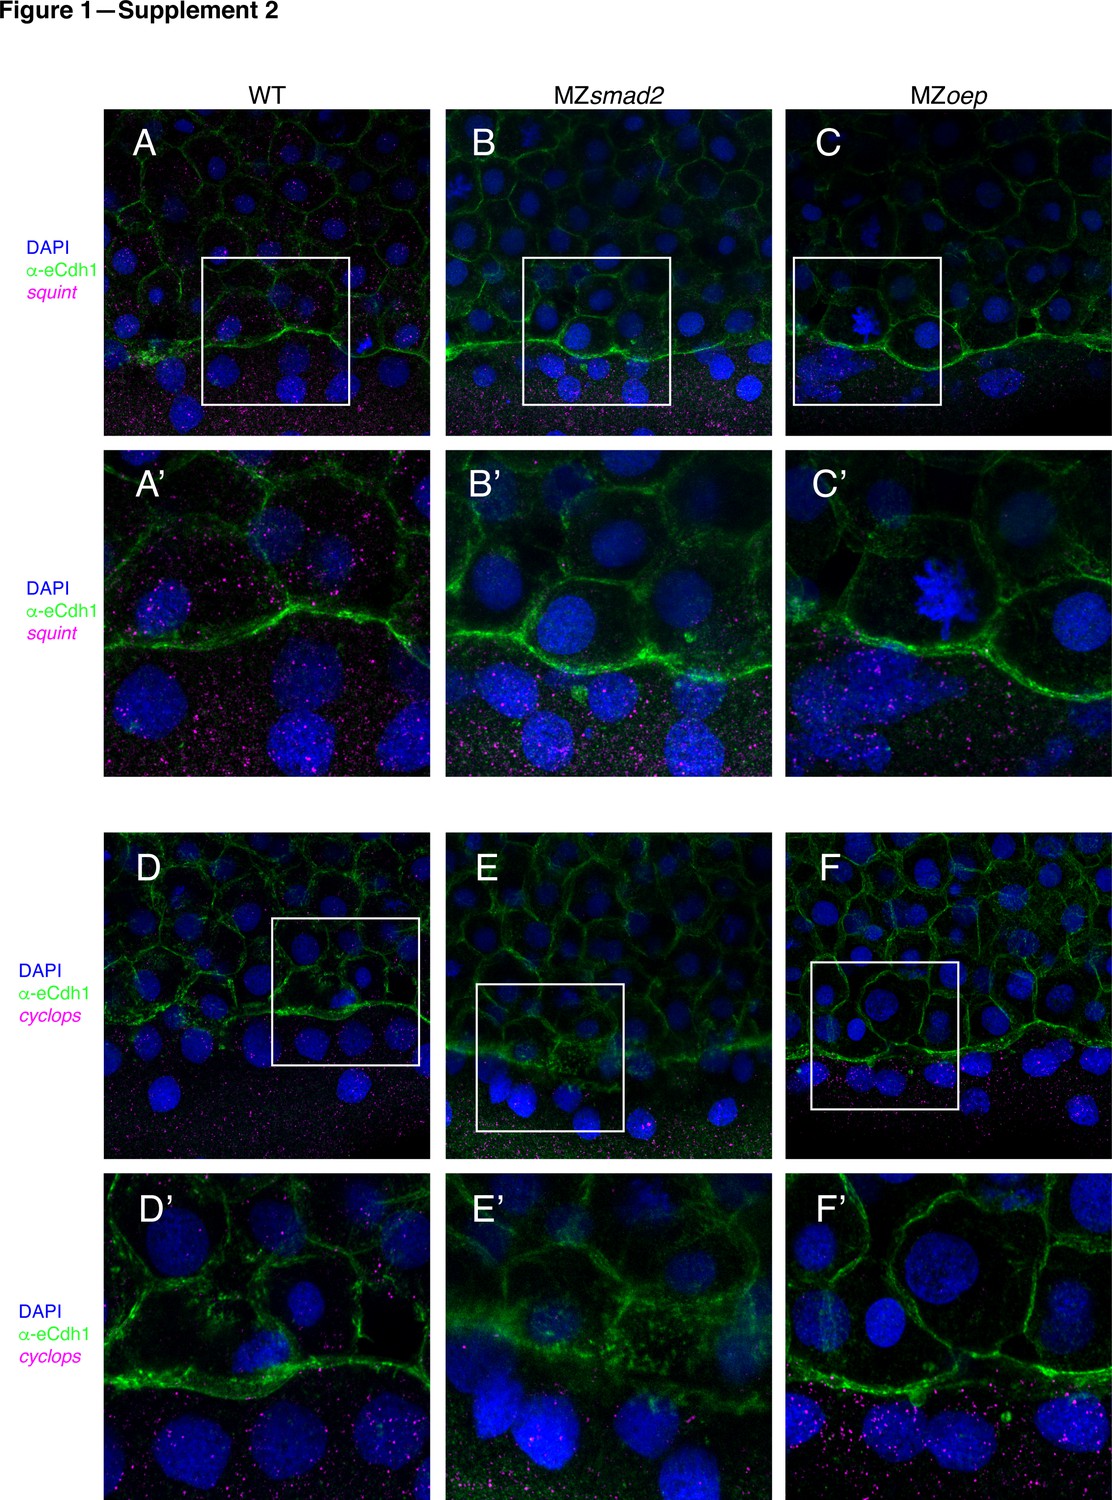
MZsmad2 and MZoep embryos have intact Nodal sources.
To verify that MZsmad2 and MZoep embryos express Nodals in the YSL, we stained for cyclops and squint mRNA by smFISH. All depicted embryos were counterstained with DAPI to mark nuclei and α-eCdh1 to mark cell boundaries (A) Wild-type embryos express squint mRNA in the YSL and blastoderm at 50% epiboly. (A’) Enlarged view of area within the white box from panel (A). (B) MZsmad2 embryos express squint mRNA in the YSL, but not the blastoderm, at 50% epiboly. (B’) Enlarged view of area within the white box from panel (B). (C) MZoep embryos express squint mRNA in the YSL, but not the blastoderm, at 50% epiboly. (C’) Enlarged view of area within the white box from panel (C). (D) Wild-type embryos express cyclops mRNA in the YSL and blastoderm at 50% epiboly. (D’) Enlarged view of area within the white box from panel (D). (E) MZsmad2 embryos express cyclops mRNA in the YSL, but not the blastoderm, at 50% epiboly. (E’) Enlarged view of area within the white box from panel (E). (F) MZoep embryos express cyclops mRNA in the YSL, but not the blastoderm, at 50% epiboly. (F’) Enlarged view of area within the white box from panel (F).
Figure 2 with 3 supplements
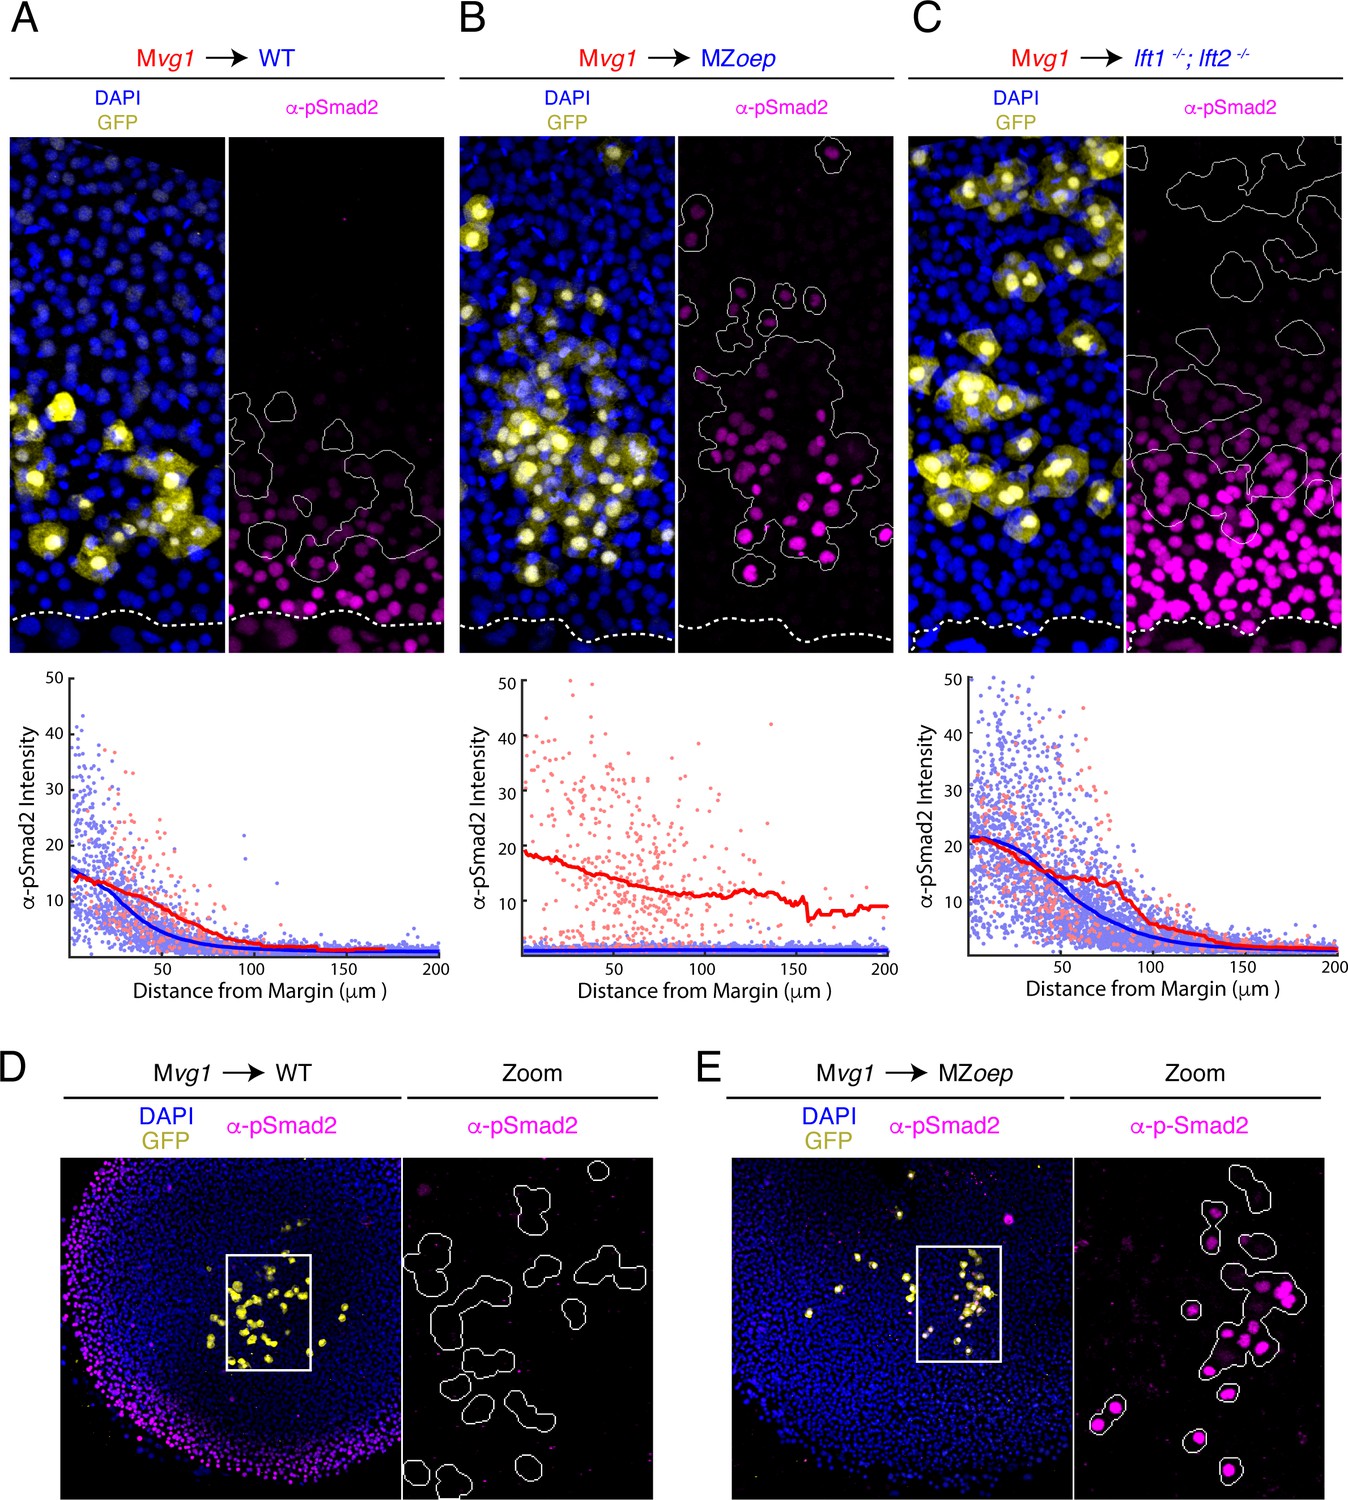
The Nodal gradient is expanded in MZoep mutants.
(A-C) Sensor cell assay and gradient quantifications in (A) wild type, (B) MZoep, and (C) lft1-/-;lft2-/- embryos. Mvg1 sensor cells were marked with GFP (yellow) and transplanted to the margin of host embryos. Nodal signaling activity is measured by α-pSmad2 immunostaining (magenta). YSL boundaries are marked with dashed curves and sensor cell boundaries are outlined in solid white in all α-pSmad2 panels. Gradient quantifications for each experiment are below images; host and sensor cell staining intensities are plotted as blue and red points, respectively. Sliding window averages are plotted as solid curves. Plots for wild type, MZoep, and lft1-/-;lft2-/- backgrounds were derived from 8, 10, and 8 replicate embryos, respectively. Decay parameters for single-exponential model fits (±95% confidence bounds) are −0.02 ± 0.004 μm−1,–0.007 ± 0.002 μm−1 and −0.013 ± 0.002 μm−1 for wild-type, MZoep and lft1-/-;lft2-/ hosts, respectively. (D) Left panel; Mvg1 sensor cells (yellow) were transplanted directly to the animal pole of a wild-type host. The endogenous Nodal signaling gradient is visible at the embryonic margin (magenta). White box highlights region expanded for detail view in right panel. Right panel; Nodal signaling activity is absent in both host and sensor cells. (E) Left panel; Mvg1 sensor cells (yellow) were transplanted to the animal pole of an MZoep embryo. Nodal signaling is absent at the embryonic margin. White box highlights region expanded in the right panel. Right; sensor cells detect Nodal at the animal pole (magenta).
-
Figure 2—source data 1
In Figure 2A, sensor cell assay results were quantified by segmenting nuclei and classifying each nucleus as host- or donor-derived by GFP intensity.
The quantified fluorescence intensities are organized in this table. Each row corresponds to an individual nucleus. The following characteristics were quantified: average GFP pixel intensity (‘GFP’), average pixel intensity for α-pSmad2 staining (‘pSmad2Raw’), α-pSmad2 staining intensity normalized to background (‘pSmad2 Normalized’), average DAPI pixel intensity (‘DAPI’), distance from the embryonic margin in μm (‘marginDist’), GFP staining status (‘GFP_Flag’, 0 denotes a cell host nucleus, one denotes a sensor cell nucleus), and embryo replicate number (‘Embryo Number’). We note that normalized α-pSmad2 staining was used to generate the figure panel.
- https://cdn.elifesciences.org/articles/54894/elife-54894-fig2-data1-v2.xlsx
-
Figure 2—source data 2
In Figure 2B, sensor cell assay results were quantified by segmenting nuclei and classifying each nucleus as host- or donor-derived by GFP intensity.
The quantified fluorescence intensities are organized in this table. Each row corresponds to an individual nucleus. The following characteristics were quantified: average GFP pixel intensity (‘GFP’), average pixel intensity for α-pSmad2 staining (‘pSmad2Raw’), α-pSmad2 staining intensity normalized to background (‘pSmad2 Normalized’), average DAPI pixel intensity (‘DAPI’), distance from the embryonic margin in μm (‘marginDist’), GFP staining status (‘GFP_Flag’, 0 denotes a cell host nucleus, one denotes a sensor cell nucleus), and embryo replicate number (‘Embryo Number’). We note that normalized α-pSmad2 staining was used to generate the figure panel.
- https://cdn.elifesciences.org/articles/54894/elife-54894-fig2-data2-v2.xlsx
-
Figure 2—source data 3
In Figure 2C, sensor cell assay results were quantified by segmenting nuclei and classifying each nucleus as host- or donor-derived by GFP intensity.
The quantified fluorescence intensities are organized in this table. Each row corresponds to an individual nucleus. The following characteristics were quantified: average GFP pixel intensity (‘GFP’), average pixel intensity for α-pSmad2 staining (‘pSmad2Raw’), α-pSmad2 staining intensity normalized to background (‘pSmad2 Normalized’), average DAPI pixel intensity (‘DAPI’), distance from the embryonic margin in μm (‘marginDist’), GFP staining status (‘GFP_Flag’, 0 denotes a cell host nucleus, one denotes a sensor cell nucleus), and embryo replicate number (‘Embryo Number’). We note that normalized α-pSmad2 staining was used to generate the figure panel.
- https://cdn.elifesciences.org/articles/54894/elife-54894-fig2-data3-v2.xlsx
Figure 2—figure supplement 1
Cyclops and Squint signal over a long range in the absence of Oep.
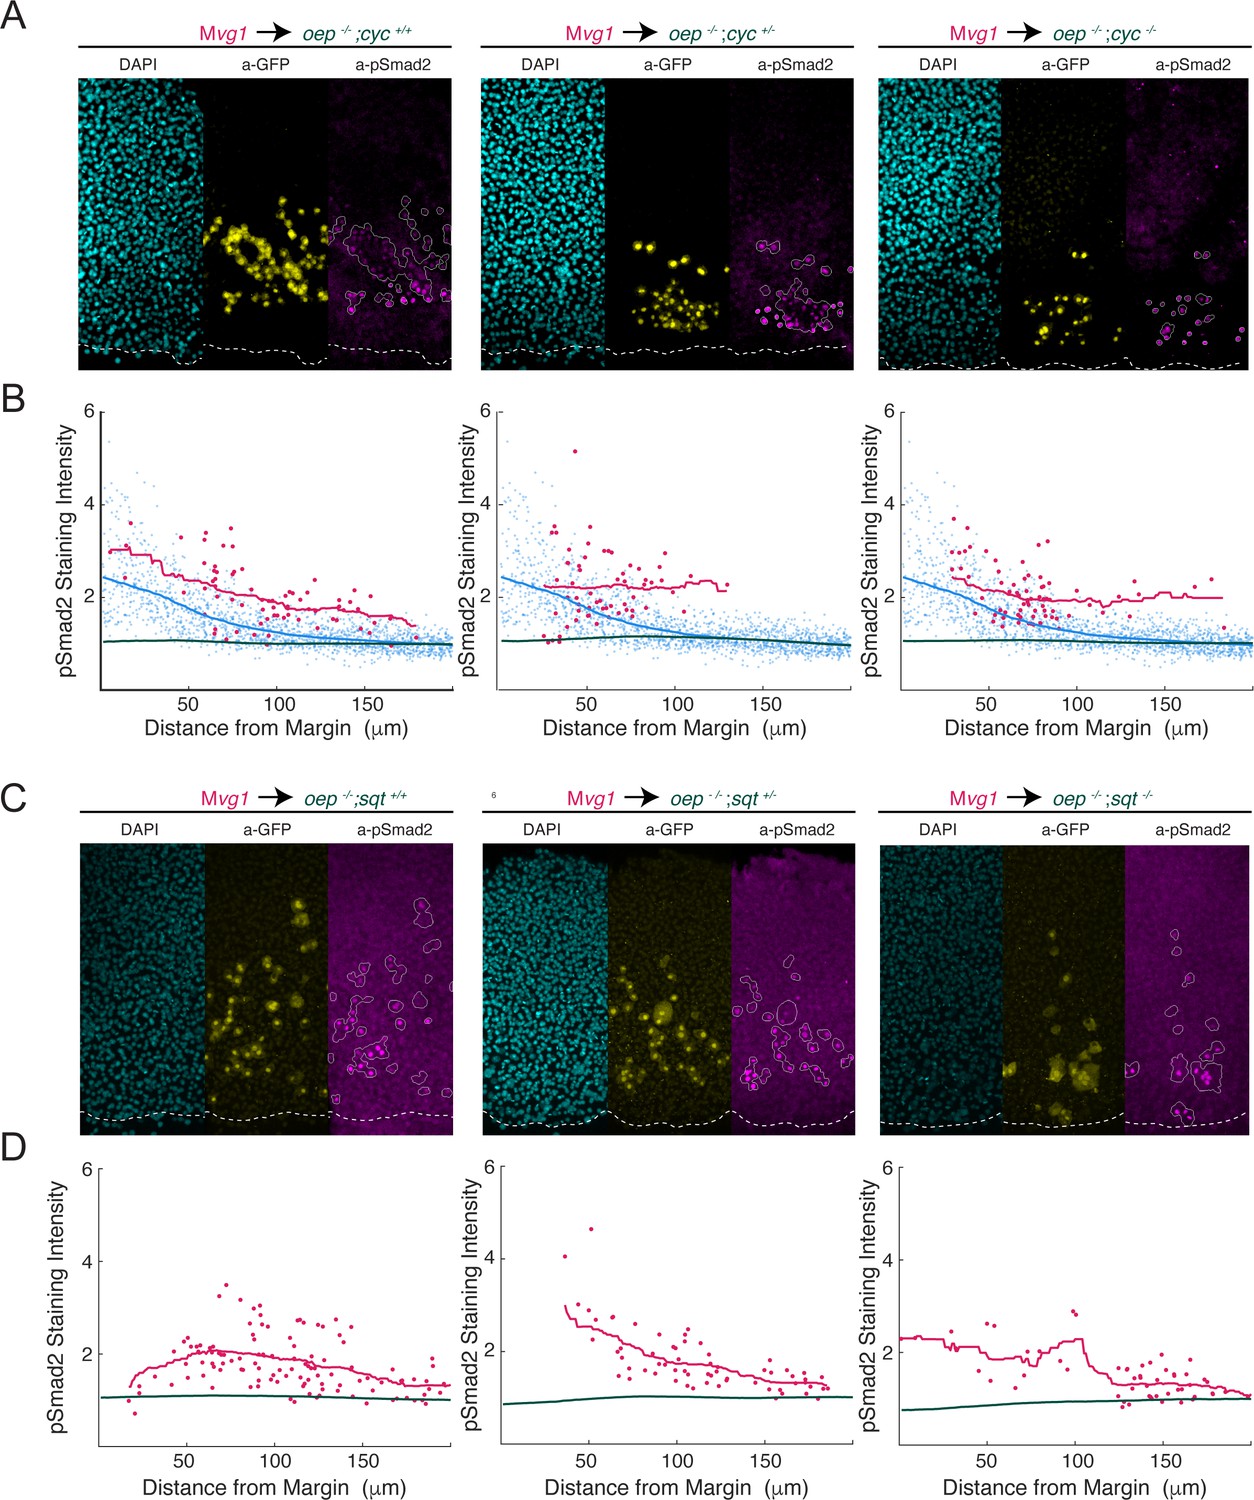
To test whether Cyclops and Squint spread over a long range in the absence of Oep, we generated MZoep;cyc and MZoep;sqt double mutants and performed sensor cell assays. (A) Squint signals over a long range in the absence of Oep. Representative sensor cell assays for MZoep;cyc+/+ (left), MZoep;cyc+/- (middle) and MZoep;cyc-/- (right) are presented. Mvg1 sensor cells are marked with α-GFP immunostaining (yellow), and sensor cell boundaries are outlined in white in the α-pSmad2 images (magenta). YSL boundaries are marked with a white dashed curve in all images. (B) Quantification of Nodal signaling in sensor (red) and host cells (green) in MZoep;cyc double mutant embryos. Host cells lack oep, and so represent immunostaining background. A pSmad2 gradient from a wild-type embryo was quantified and plotted in each panel for comparison (blue). Gradients for MZoep;cyc+/+ (left), MZoep;cyc+/- (middle) and MZoep;cyc-/- (right) were derived from 2, 2 and 3 replicate embryos, respectively. Sliding window averages are plotted as solid curves. (C) Cyclops signals over a long range in the absence of Oep. Representative sensor cell assays for MZoep;sqt+/+ (left), MZoep;sqt+/- (middle) and MZoep;sqt-/- (right) are presented. Mvg1 sensor cells are marked with α-GFP immunostaining (yellow), and sensor cell boundaries are outlined in white in the α-pSmad2 images (magenta). (D) Quantification of Nodal signaling in sensor (red) and host cells (green) in MZoep;sqt double mutant embryos. Host cells lack oep, and so represent immunostaining background. Gradients for MZoep;sqt+/+ (left), MZoep;sqt+/- (middle) and MZoep;sqt-/- (right) were derived from 4, 3, and 5 replicate embryos, respectively. Sliding window averages are plotted as solid curves.
Figure 2—figure supplement 2
Clustering does not contribute to Nodal sensitivity in sensor cells.
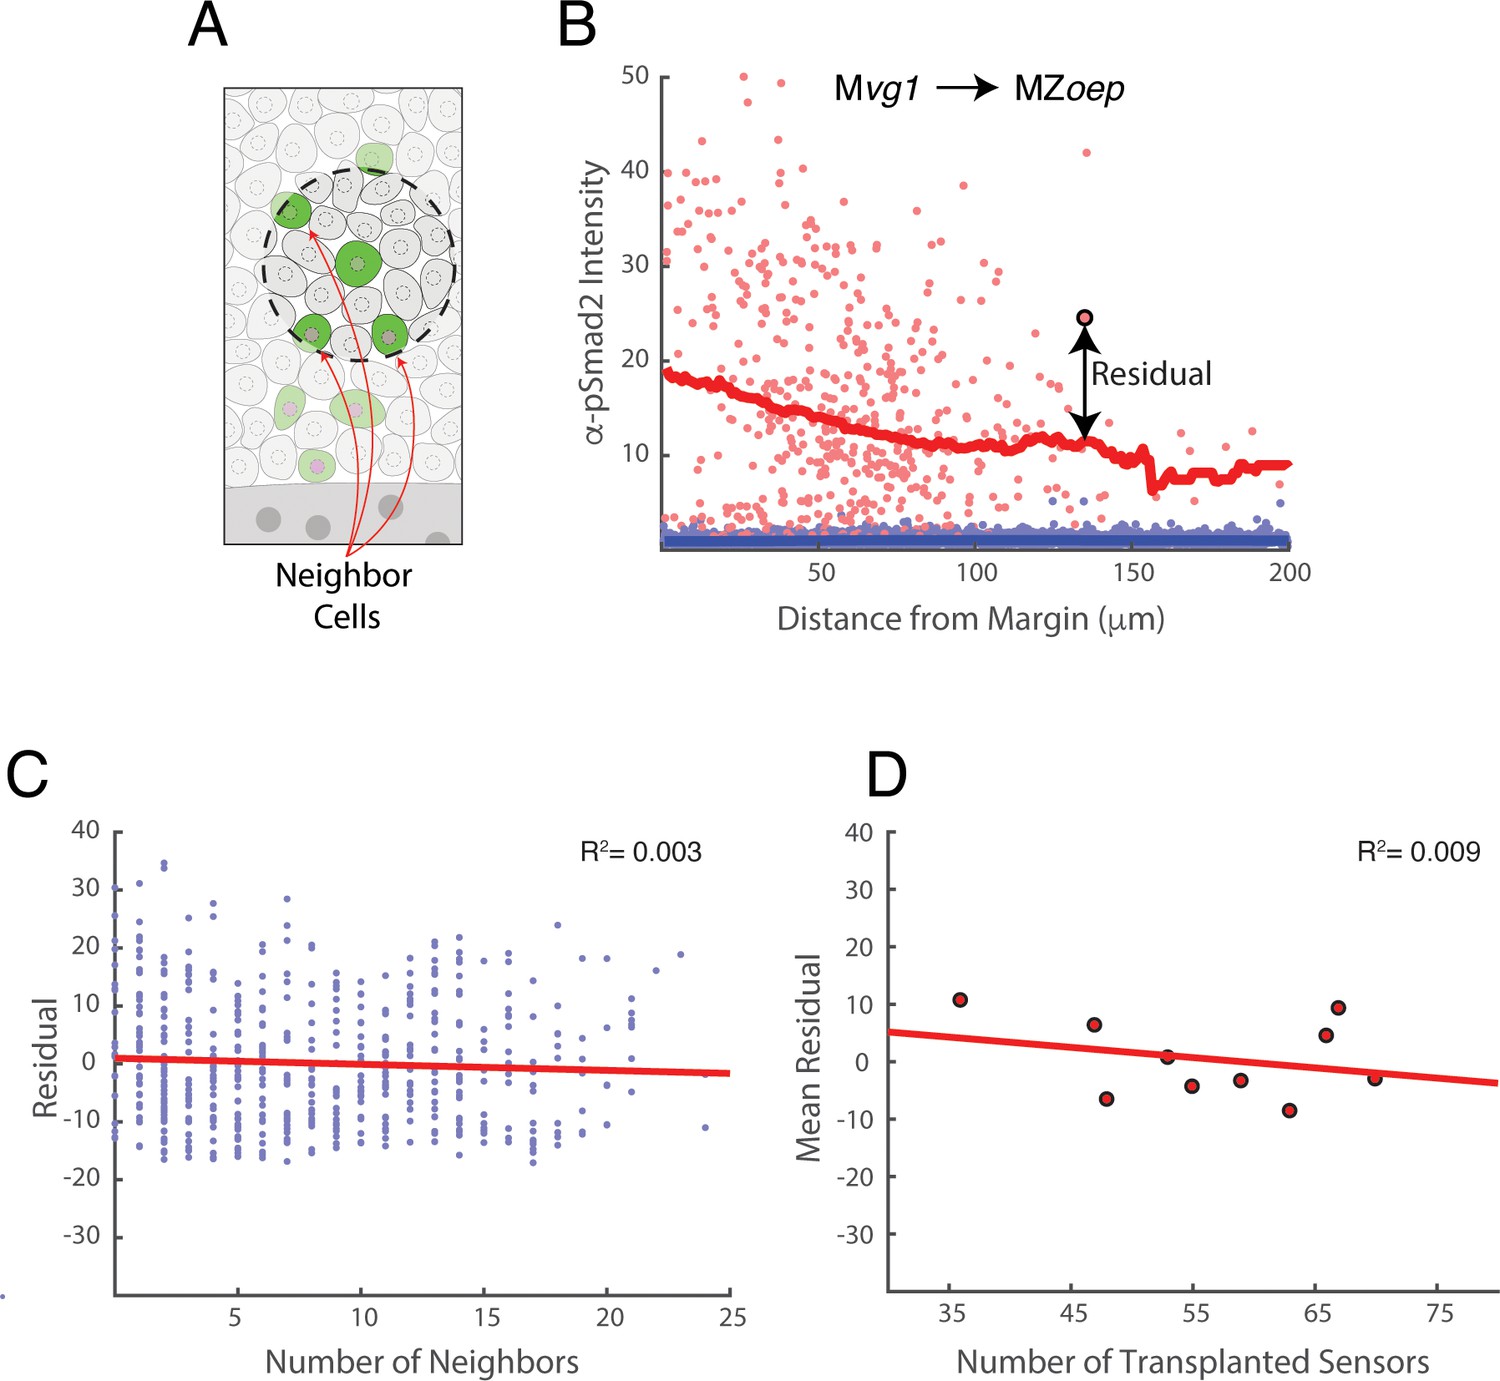
Our transplantation procedure leads to random variation in the number and position of sensor cells in host embryos. We therefore investigated whether clustering (i.e. variation in the number of nearby sensor cells) affects the behavior of each sensor. The data presented in this figure derive from the Mvg1 to MZoep sensor cell experiment of main text Figure 2B. (A) Definition of neighboring cells. For each sensor cell (center of dashed circle), sensor cells within a 30 μm radius (area within dashed circle) are counted as neighbors. (B) Illustration of pSmad2 staining residual using main text Figure 2B. We define the pSmad2 staining residual for each sensor as the difference between its observed staining intensity and the expected intensity given its distance from the Nodal source. In this illustration, the residual for the highlighted sensor cell (large red point) is the vertical distance (arrow) to the sliding window average of all sensor cells (red curve). Host cell staining intensities are depicted as blue points. (C) Neighbor number does not influence pSmad2 staining residual. Scatter plot of the number of sensor cells within a 30 μm radius against pSmad2 staining residual. Each point represents a sensor cell, and the figure pools sensors from 10 host embryos. The least-squares linear fit is plotted (red line, R2 = 0.003). If Nodal sensitivity increased or decreased with the number of nearby sensors, the plot would show an increasing or decreasing trend, respectively. (D) Sensor behavior is independent of total number of transplanted cells. The total number sensors transplanted into each MZoep host embryo is scattered against the average pSmad2 staining residual for all sensors in that embryo. The least-squares linear fit is plotted (red line, R2 = 0.009). If Nodal sensitivity increased or decreased with the total number of transplanted cells, the plot would show a clear positive or negative trend, respectively.
Figure 2—figure supplement 3
The Nodal ligand gradient is shaped by oep expression.
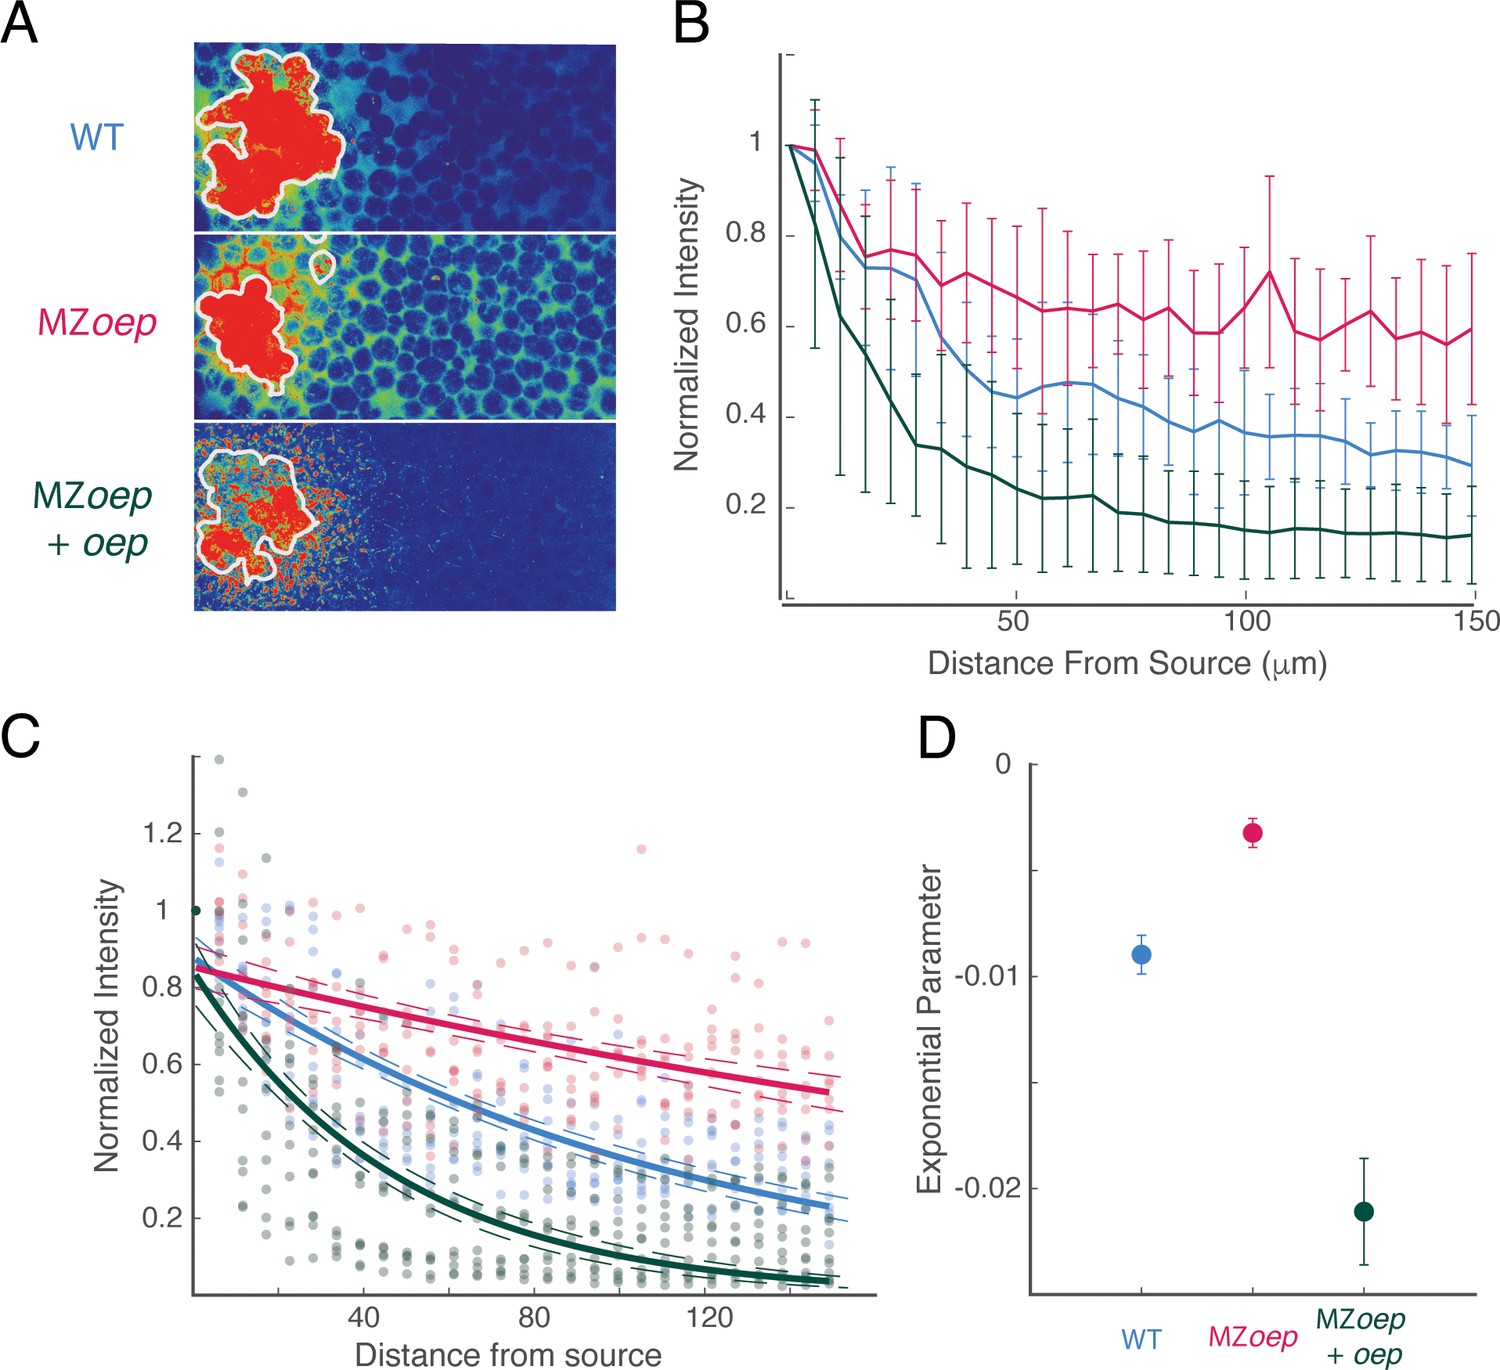
(A) Measurement of Squint-sfGFP gradients generated by transplanted source cells. Donor embryos were injected with 250 pg sqt-sfgfp mRNA and Alexa-647 dextran at the one-cell stage. At sphere stage, cells from the animal pole of donor embryos were transplanted to the animal pole of wild-type (top), MZoep (middle), or MZoep embryos injected with an excess of oep mRNA at the one-cell stage. Gradients were visualized in grafted embryos by confocal microscopy 100 min after transplantation. Images are maximum intensity projections of 15 consecutive confocal slices. White contours mark source boundaries as determined by segmentation of Alexa-647 channel images. (B) Quantification of Squint-sfGFP gradients created by ectopic sources. Average GFP intensities at each position were compiled from maximum intensity projections and normalized to the intensity adjacent to the source. Gradients from wild-type (blue), MZoep (red) and oep-injected MZoep (green) embryos were compiled from 9, 8, and 11 grafted embryos, respectively. Error bars denote the standard error of the mean at each position. (C) Exponential fits for gradients in wild-type (blue), MZoep (red), and oep-injected MZoep (green) hosts are plotted. Dashed contours indicate 95% confidence intervals for each exponential fit. Experimental data for each condition are scattered as points in the corresponding color. (D) Comparison of exponential fit parameters for wild-type (blue), MZoep (red), and oep-injected MZoep (green) host embryos. Error bars denote 95% confidence intervals.
Figure 3 with 1 supplement
Oep levels regulate Nodal ligand capture and signaling range.
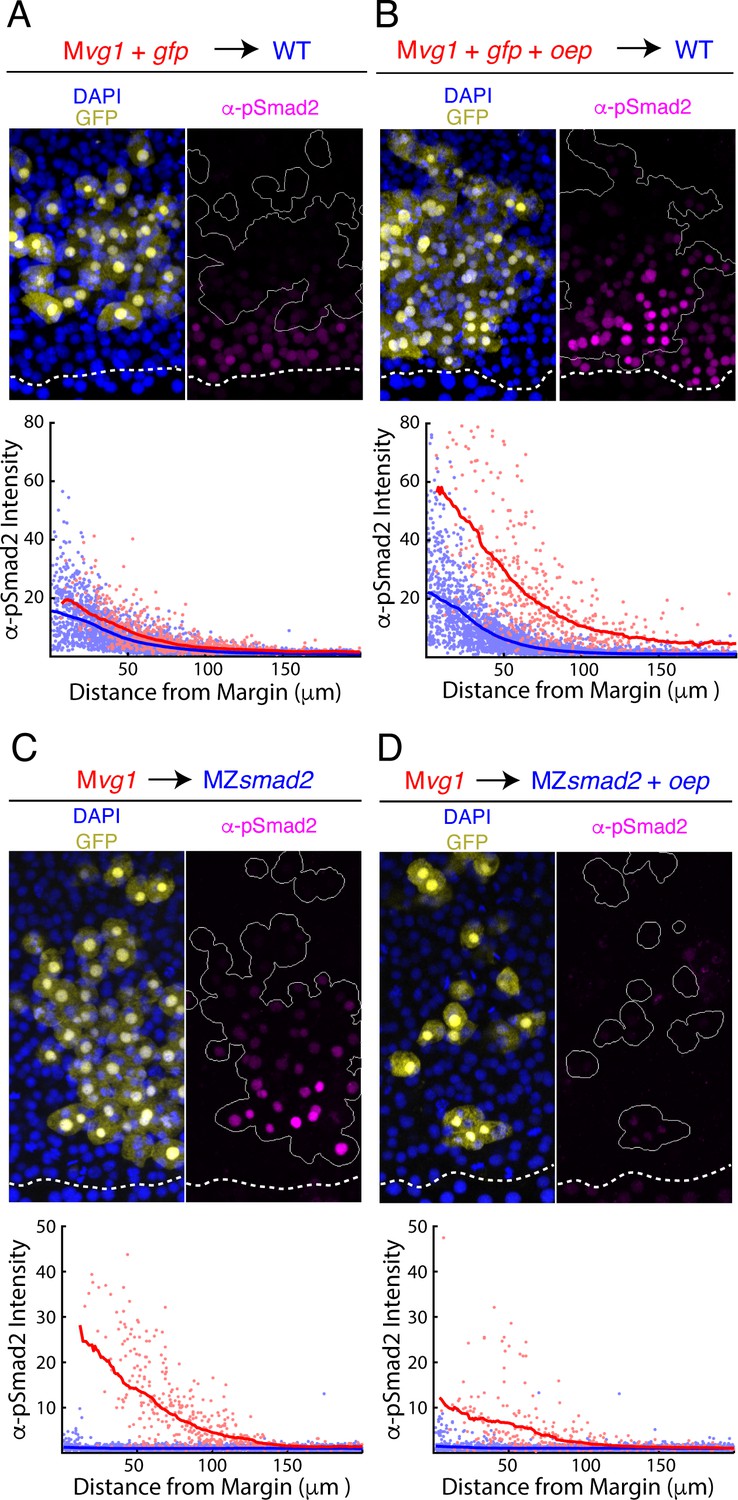
(A–B) Oep overexpression increases sensitivity to Nodal ligands. (A) Upper panel: control transplant of GFP-marked Mvg1 sensor cells (yellow) to the margin of wild-type hosts. Nodal signaling activity was measured by α-pSmad2 immunostaining (magenta). In all panels, YSL boundaries are marked with dashed white curves, and sensor cells have been outlined in solid white in all α-pSmad2 panels. Lower panel: quantification of Nodal signaling in sensor (red) and host cells (blue) across replicate embryos. Sliding window averages are plotted as solid curves. Plot was derived from eight replicate embryos. (B) Upper panel: transplant of sensor cells from an Mvg1 donor injected with gfp and 110 pg oep mRNA at the one-cell stage to the margin of wild-type hosts. Sensor cells (yellow) exhibit enhanced Nodal signaling activity (magenta) compared to their host-derived neighbors. Lower panel; staining of host (blue) and sensor (red) cells was quantified as in (A). Plot was derived from nine replicate embryos. (C-D) Oep overexpression restricts Nodal spread. (C) Upper panel: sensor cell measurement of the Nodal gradient in MZsmad2 embryos. Mvg1 sensor cells were marked with GFP (yellow), and Nodal signaling activity was measured by α-pSmad2 immunostaining (magenta). Lower panel: quantification of Nodal signaling in sensor (red) and host cells (blue) was quantified as in (A). Plot was derived from nine replicate embryos. (D) Upper panel: Mvg1 sensor cell measurement of the Nodal signaling gradient in MZsmad2 hosts injected with 110 pg oep mRNA at the one-cell stage. Lower panel; gradients were quantified as in (A). Plot was derived from nine replicate embryos.
-
Figure 3—source data 1
In Figure 3A, sensor cell assay results were quantified by segmenting nuclei and classifying each nucleus as host- or donor-derived by GFP intensity.
The quantified fluorescence intensities are organized in this table. Each row corresponds to an individual nucleus. The following characteristics were quantified: average GFP pixel intensity (‘GFP’), average pixel intensity for α-pSmad2 staining (‘pSmad2Raw’), α-pSmad2 staining intensity normalized to background (‘pSmad2 Normalized’), average DAPI pixel intensity (‘DAPI’), distance from the embryonic margin in μm (‘marginDist’), GFP staining status (‘GFP_Flag’, 0 denotes a cell host nucleus, one denotes a sensor cell nucleus), and embryo replicate number (‘Embryo Number’). We note that normalized α-pSmad2 staining was used to generate the figure panel.
- https://cdn.elifesciences.org/articles/54894/elife-54894-fig3-data1-v2.xlsx
-
Figure 3—source data 2
In Figure 3B, sensor cell assay results were quantified by segmenting nuclei and classifying each nucleus as host- or donor-derived by GFP intensity.
The quantified fluorescence intensities are organized in this table. Each row corresponds to an individual nucleus. The following characteristics were quantified: average GFP pixel intensity (‘GFP’), average pixel intensity for α-pSmad2 staining (‘pSmad2Raw’), α-pSmad2 staining intensity normalized to background (‘pSmad2 Normalized’), average DAPI pixel intensity (‘DAPI’), distance from the embryonic margin in μm (‘marginDist’), GFP staining status (‘GFP_Flag’, 0 denotes a cell host nucleus, one denotes a sensor cell nucleus), and embryo replicate number (‘Embryo Number’). We note that normalized α-pSmad2 staining was used to generate the figure panel.
- https://cdn.elifesciences.org/articles/54894/elife-54894-fig3-data2-v2.xlsx
-
Figure 3—source data 3
In Figure 3C, sensor cell assay results were quantified by segmenting nuclei and classifying each nucleus as host- or donor-derived by GFP intensity.
The quantified fluorescence intensities are organized in this table. Each row corresponds to an individual nucleus. The following characteristics were quantified: average GFP pixel intensity (‘GFP’), average pixel intensity for α-pSmad2 staining (‘pSmad2Raw’), α-pSmad2 staining intensity normalized to background (‘pSmad2 Normalized’), average DAPI pixel intensity (‘DAPI’), distance from the embryonic margin in μm (‘marginDist’), GFP staining status (‘GFP_Flag’, 0 denotes a cell host nucleus, one denotes a sensor cell nucleus), and embryo replicate number (‘Embryo Number’). We note that normalized α-pSmad2 staining was used to generate the figure panel.
- https://cdn.elifesciences.org/articles/54894/elife-54894-fig3-data3-v2.xlsx
-
Figure 3—source data 4
In Figure 3D, sensor cell assay results were quantified by segmenting nuclei and classifying each nucleus as host- or donor-derived by GFP intensity.
The quantified fluorescence intensities are organized in this table. Each row corresponds to an individual nucleus. The following characteristics were quantified: average GFP pixel intensity (‘GFP’), average pixel intensity for α-pSmad2 staining (‘pSmad2Raw’), α-pSmad2 staining intensity normalized to background (‘pSmad2 Normalized’), average DAPI pixel intensity (‘DAPI’), distance from the embryonic margin in μm (‘marginDist’), GFP staining status (‘GFP_Flag’, 0 denotes a cell host nucleus, one denotes a sensor cell nucleus), and embryo replicate number (‘Embryo Number’). We note that normalized α-pSmad2 staining was used to generate the figure panel.
- https://cdn.elifesciences.org/articles/54894/elife-54894-fig3-data4-v2.xlsx
Figure 3—figure supplement 1
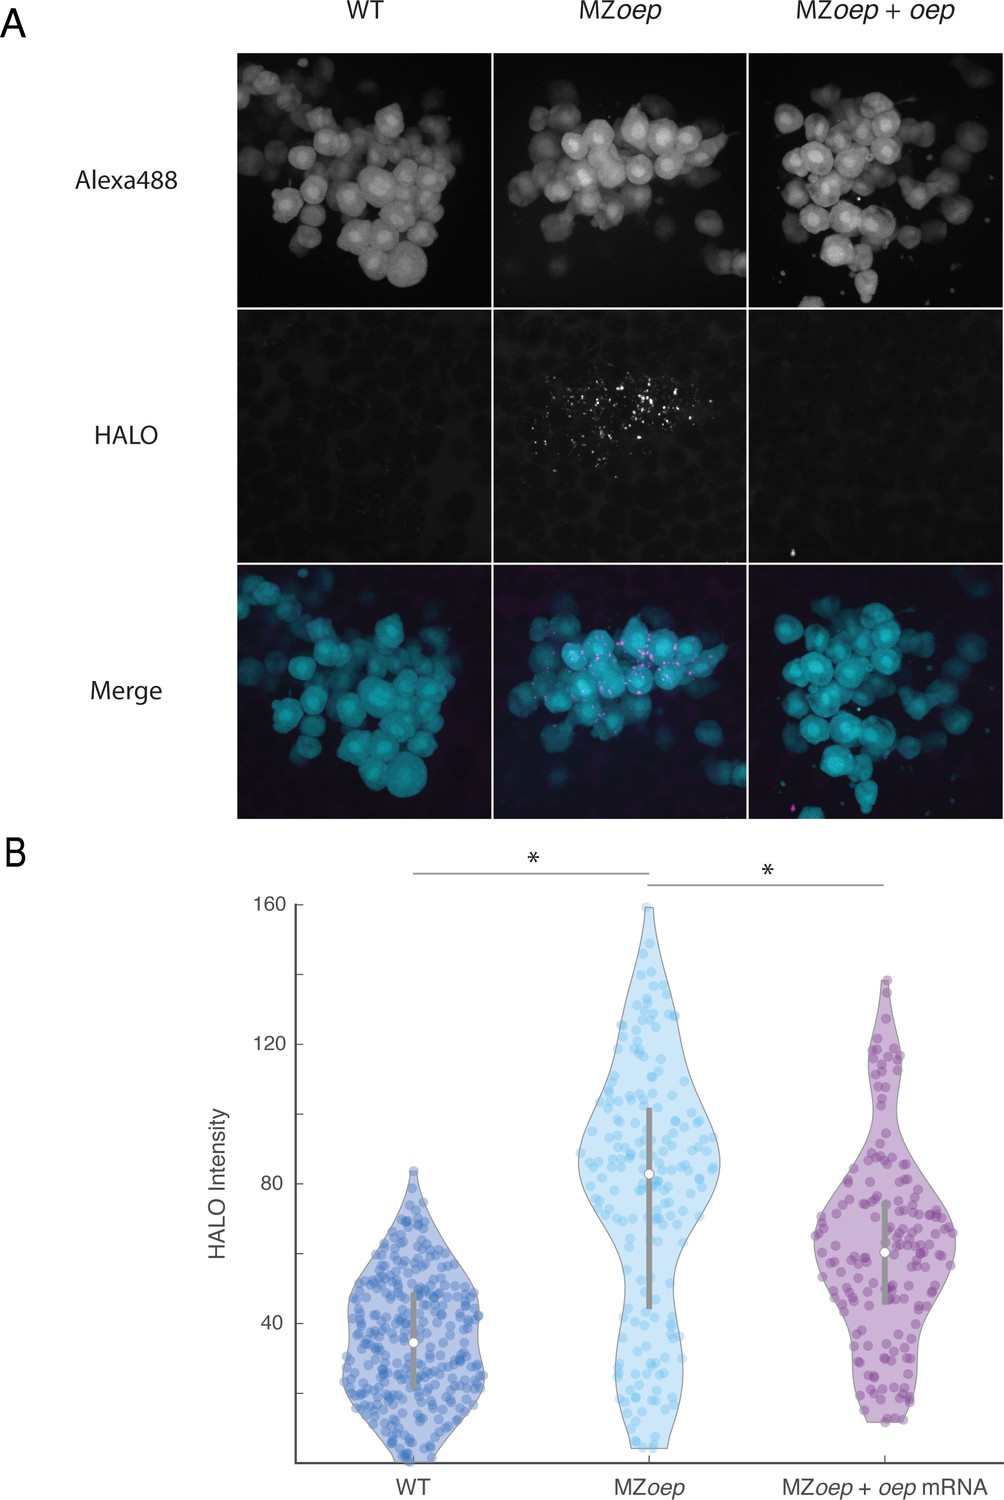
Nodal ligand range is expanded in MZoep mutants.
(A) Direct visualization of long-range spread of Nodal ligand was carried out using a modified sensor cell assay in host embryos producing Vg1-HaloTag and Squint in the YSL. Sensor cells from a wild-type donor embryo injected with 110 pg oep mRNA were transplanted to the animal pole of host embryos injected with vg1-halotag and squint mRNAs in the YSL. Sensor cells producing extra Oep were used to enhance the sensitivity of the assay, akin to previous morphotrap studies (Stapornwongkul et al., 2020; Almuedo-Castillo et al., 2018; Harmansa et al., 2017; Harmansa et al., 2015). The experiment compared wild-type hosts (left), MZoep hosts (middle), or MZoep hosts injected with 110 pg oep mRNA at the one-cell stage (right). HALO-tagged ligands were labeled by staining with Janelia Fluor 646 Halo ligand. Sensor cells were transplanted to the animal pole of labeled host embryos after 1 hr of staining (approximately sphere stage). Loss of oep results in increased accumulation of tagged ligand at the animal pole. (B) Quantification of ligand accumulation in sensor cells. Sensors were manually segmented and average Janelia Fluor 646 channel pixel intensities were calculated. Each point represents a single sensor cell. Violin plots depict the median (white circle) and 25–75 percentile ranges (grey line). Asterisks denote statistical significance of median comparisons between indicated samples (Wilcoxon rank-sum test).
Figure 4
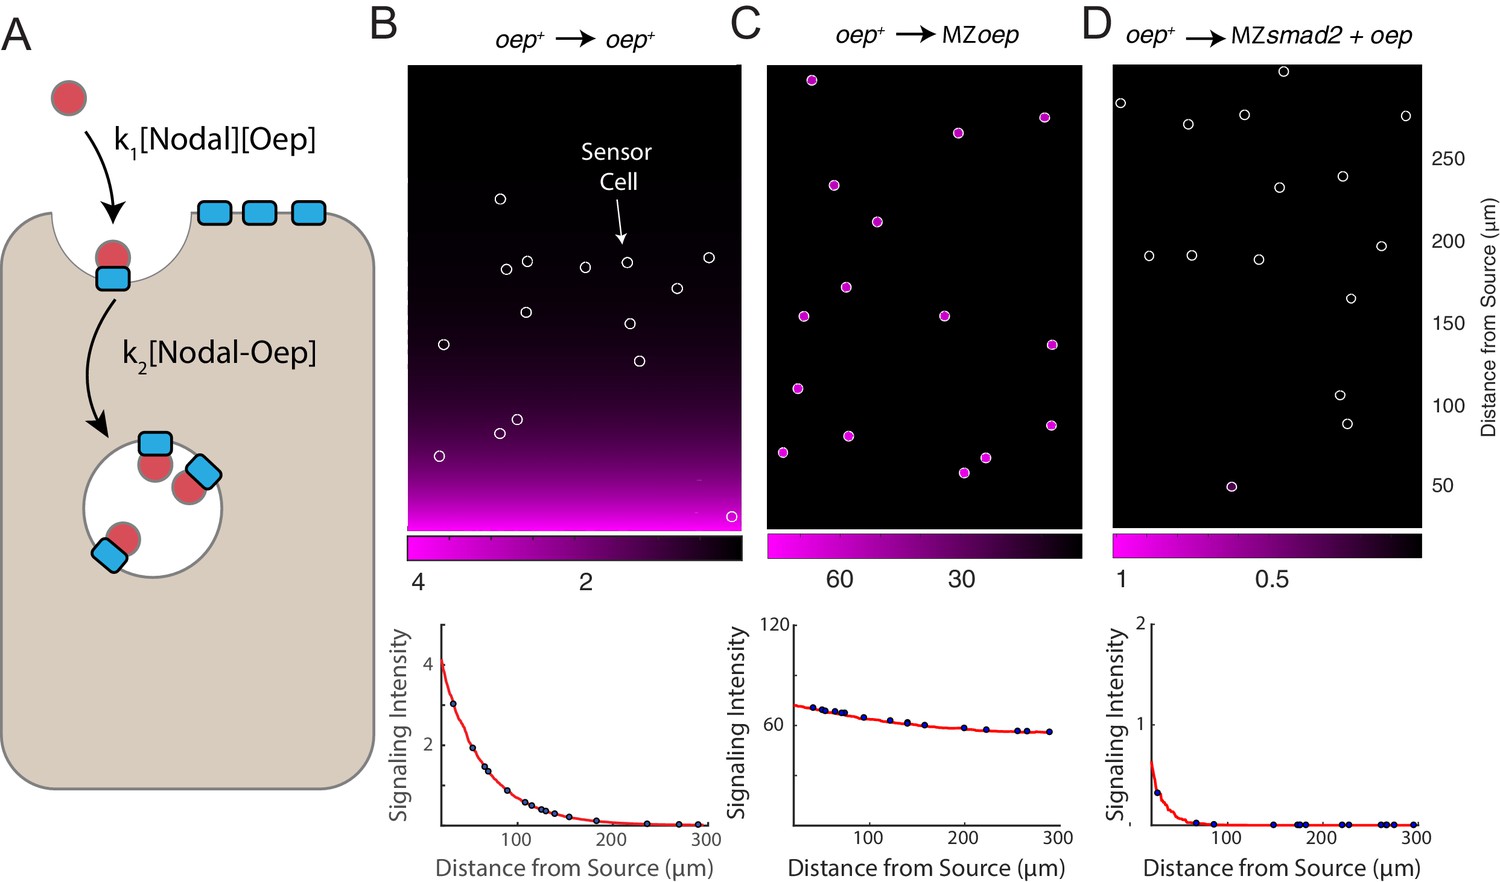
A simple model of Nodal diffusion and capture reproduces experimental observations.
(A) Schematic of Nodal diffusion-capture model. Simulations were performed on a two-dimensional tissue of 100 μm x 300 μm. Nodal molecules are secreted at a constant rate from a localized source at one boundary of the tissue (i.e. 0 < x < 5 μm) and diffuse freely until capture by cell surface receptors (‘Oep’). Ligand-receptor complexes are removed from the system by internalization. To track signaling activity, Smad2 phosphorylation is simulated with rate proportional to the concentration of receptor-ligand complexes. (B-D) Simulation of transplant experiments. In each simulation, the behavior of sensor cells (white outlines) is compared with the behavior of the host embryo (remainder of tissue). Parameters were independently set for host and sensor regions, allowing for simulation of experiments with mutations and overexpression. Signaling activity (i.e. [pSmad2]) is plotted in magenta. Upper panels present representative simulations with randomly-positioned sensor cells. Lower panels depict quantified signaling intensities for sensor cells from the panel above (blue points) and average intensities derived from replicate simulations (red curves). (B) Wild-type gradient simulation. Sensor cells with normal Oep levels are transplanted into a host with normal Oep levels. A stable gradient forms, and signaling is identical in sensor cells and neighboring regions. (C) Gradient expansion in MZoep mutants. Sensor cells contain normal Oep levels, but host cells lack Oep. Sensor cells detect ligand throughout the tissue. (D) Gradient contraction with oep overexpression. Sensor cells contain normal Oep levels, whereas host cells lack Smad2, but overexpress oep. Signaling is absent in the host tissue—due to lack of Smad2—but elevated receptor expression restricts Nodal spread to the sensors.
Figure 5 with 1 supplement
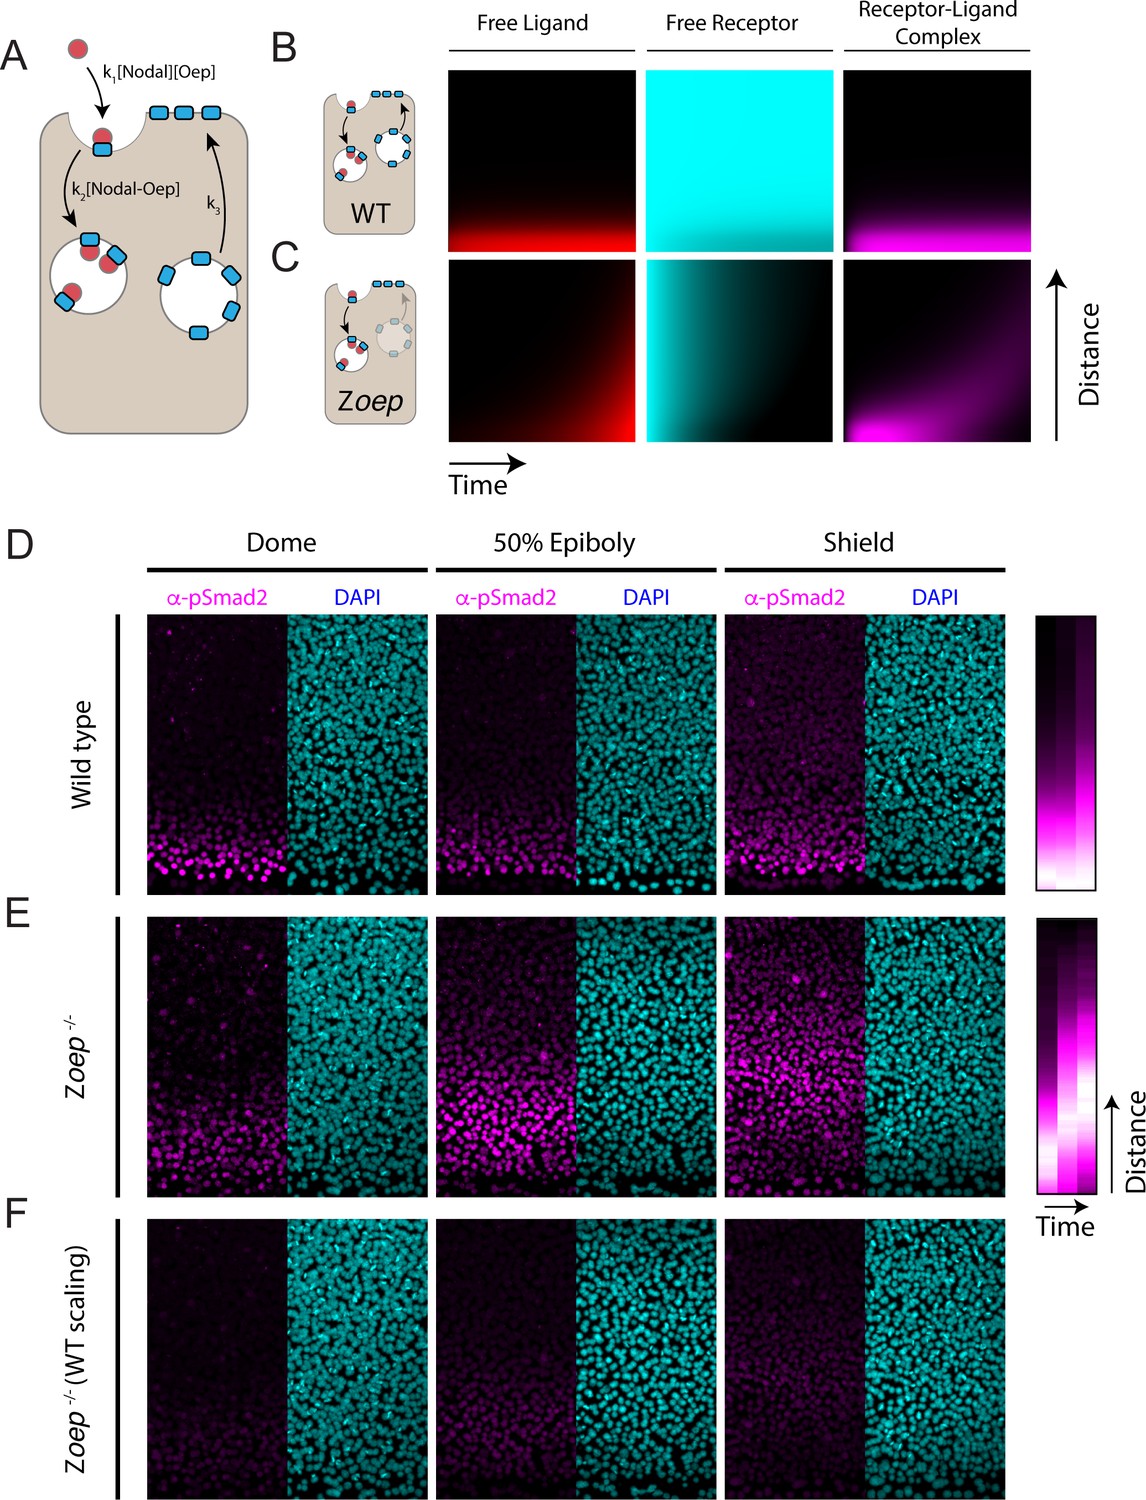
Loss of Oep replacement destabilizes the Nodal signaling gradient.
(A) Schematic of model incorporating production and consumption of receptors. Simulations presented here were performed on a one-dimensional tissue with length 300 μm. Oep replacement is assumed to be constant with rate k3, and Oep removal reflects a combination of constitutive and ligand-dependent endocytosis. In panels A and B, simulations are presented as kymographs; each image column shows the state of the system with the source at the bottom and animal pole at the top. Time proceeds from left to right. (B) Simulation of a wild-type gradient. With continual receptor replacement, the system achieves an exponential steady state gradient with length scale set by the ligand diffusion rate and receptor abundance. The free ligand, free receptor, and receptor-ligand complex concentrations are plotted from left to right in red, cyan, and magenta, respectively. (C) Simulation of gradient formation in a zygotic oep mutant. Simulation details are identical to (B), but with receptor replacement rate (k3) set to zero. The system fails to establish a steady state due to gradual consumption and degradation of receptors. Over time, the Nodal ligand gradient expands (red) to drive a propagating wave of signaling activity (i.e. receptor occupancy, magenta). (D) Time course of Nodal signaling activity in wild-type embryos. Representative α-pSmad2 (magenta) and DAPI (cyan) are shown for dome, 50% epiboly and shield stages (left, middle and right panels, respectively). Compilation of signaling gradients across replicates (far right) shows the establishment of the signaling gradient. Composite gradients were derived from 5, 6, and 6 replicate embryos for dome, 50% epiboly and shield stages, respectively. (E) Time course of Nodal signaling activity in zygotic oep mutants. Over time, the signaling pattern evolves from a gradient (dome stage) to a band displaced far from the margin (shield) as the wave travels outward. Compilation of signaling gradients across replicates (far right) illustrates the outward propagation of signaling. Composite gradients were derived from 7, 6, and 3 replicate embryos for dome, 50% epiboly, and shield stages, respectively. (F) Time course of Nodal signaling activity in zygotic oep mutants presented with pixel scaling equal to that used in (D). In accord with simulations, the wave of signaling propagates with a lower intensity than signaling at the margin of wild-type embryos.
Figure 5—figure supplement 1
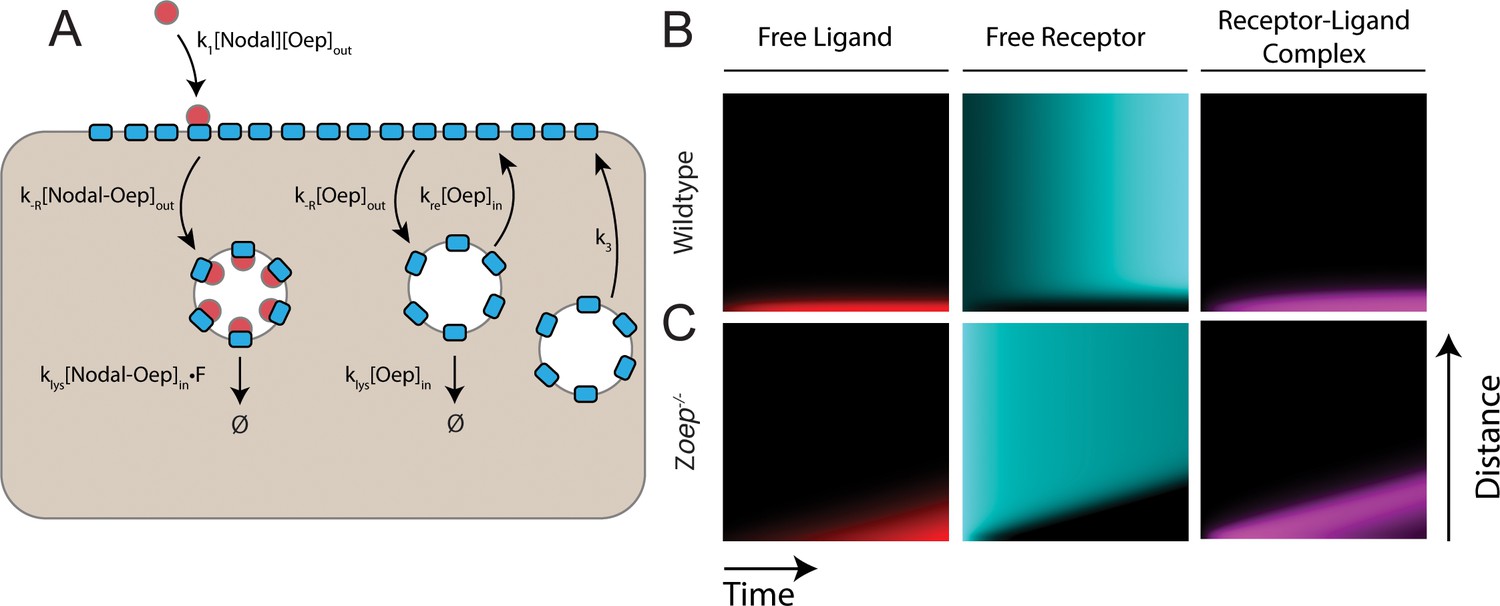
An endocytic trafficking model predicts wave formation in Zoep mutants.
(A) Schematic of model incorporating endocytic trafficking of Nodal receptors. Simulations presented here were performed on a one-dimensional tissue with length 300 μm. New Oep is added to the surface with at constant rate k3, and Oep is internalized via constitutive endocytosis of both bound and unbound receptors. Unbound receptors can be recycled to the surface or degraded. Ligand-bound receptors are not recycled. In panels B and C, simulations are presented as kymographs; each image column shows the state of the system with the source at the bottom and animal pole at the top. Time proceeds from left to right. (B) Simulation of a wild-type gradient. With continual receptor replacement, the system achieves a steady state gradient with length scale set by the balance between ligand diffusion and capture. The free ligand, free receptor and receptor-ligand complex concentrations are plotted from left to right in red, cyan and magenta, respectively. (C) Simulation of gradient formation in a zygotic oep mutant. Simulation details are identical to (B), but with receptor replacement rate (k3) set to zero. The system fails to establish a steady state due to gradual consumption and degradation of receptors. As observed in the model presented in the main text, the Nodal ligand profile expands (red) to drive a propagating wave of signaling activity (magenta).
Tables
Key resources table
| Reagent type (species) or resource | Designation | Source or reference | Identifiers | Additional information |
|---|---|---|---|---|
| Gene (Danio rerio) | oep (tdgf1) | ZFIN | ZDB-GENE-990415–198 | |
| Gene (Danio rerio) | ndr1 (sqt) | ZFIN | ZDB-GENE-990415–256 | |
| Gene (Danio rerio) | ndr2 (cyc) | ZFIN | ZDB-GENE-990415–181 | |
| Gene (Danio rerio) | smad2 | ZFIN | ZDB-GENE-990603–7 | |
| Gene (Danio rerio) | vg1 (gdf3) | ZFIN | ZDB-GENE-980526–389 | |
| Gene (Danio rerio) | lft1 | ZFIN | ZDB-GENE-990630–10 | |
| Gene (Danio rerio) | lft2 | ZFIN | ZDB-GENE-990630–11 | |
| Strain, strain background (Danio rerio) | AB | ZIRC | ZDB-GENO-960809–7 | |
| Strain, strain background (Danio rerio) | TL | ZIRC | ZDB-GENO-990623–2 | |
| Genetic reagent (Danio rerio) | oeptz57 | Hammerschmidt et al., 1996 | RRID:ZDB-ALT-980203-1256 | |
| Genetic reagent (Danio rerio) | sqttcz35 | Feldman et al., 1998 | RRID:ZDB-ALT-000913-2 | |
| Genetic reagent (Danio rerio) | cycm294 | Sampath et al., 1998 | RRID:ZDB-ALT-980203-609 | |
| Genetic reagent (Danio rerio) | smad2vu99 | Dubrulle et al., 2015 | RRID:ZDB-ALT-150807-1 | |
| Genetic reagent (Danio rerio) | vg1a165 | Montague and Schier, 2017 | RRID:ZDB-ALT-180515-7 | |
| Genetic reagent (Danio rerio) | lft1a145 | Rogers et al., 2017 | RRID:ZDB-ALT-180417-4 | |
| Genetic reagent (Danio rerio) | lft2a146 | Rogers et al., 2017 | RRID:ZDB-ALT-180417-5 | |
| Recombinant DNA reagent | pJZoepFlag1-2 | Zhang et al., 1998 | Template for in vitro transcription | |
| Recombinant DNA reagent | SV40NLS-sfgfp in pCS2+ | Gift from Dr. Jeffrey Farrell | Template for in vitro transcription | |
| Recombinant DNA reagent | sqt-sfGFP in pCS2+ | Montague and Schier, 2017 | Template for in vitro transcription | |
| Recombinant DNA reagent | vg1-halotag in pCS2+ | This study | Plasmid can be obtained by reaching out to N.L. | Template for in vitro transcription. |
| Recombinant DNA reagent | sqt in pCS2+ | Müller et al., 2012 | Template for in vitro transcription | |
| Antibody | Anti-phospho-smad2/3 (rabbit monoclonal) | Cell Signaling Technology | #18338 | 1:1000 dilution |
| Antibody | Anti-GFP (chicken monoclonal) | Aves Labs | (RRID:AB_2307313) | 1:1000 dilution |
| Antibody | Anti-eCdh1 (mouse monoclonal) | BD Biosciences | #610181 (RRID:AB_397580) | 1:100 dilution |
| Antibody | Goat α-rabbit Alexa 647 conjugate (goat monoclonal) | Thermo-Fisher Scientific | A-21245 (RRID:AB_2535813) | 1:2000 dilution |
| Antibody | Goat α-chicken Alexa 488 (goat monoclonal) | Thermo-Fisher Scientific | A-11039 (RRID:AB_142924) | 1:2000 dilution |
| Antibody | Goat α -mouse IgG (H + L)-Alexa 488 (goat monoclonal) | Thermo-Fisher | A-32723 (RRID:AB_2633275) | 1:750 dilution |
| Peptide, recombinant protein | Pronase | Millipore Sigma | 53702 | |
| Commercial assay or kit | mMessage mMachine Sp6 kit | Thermo-Fisher | AM1340 | |
| Commercial assay or kit | E.Z.N.A. Cycle Pure | Omega Bio-Tek | D6492-01 | |
| Commercial assay or kit | E.Z.N.A. Total RNA Kit I | Omega Bio-Tek | R6834-01 | |
| Chemical compound, drug | kDa Alexa488-dextran conjugate | Thermo-Fisher | D34682 | |
| Chemical compound, drug | Janelia Fluor HaloTag Ligand 646 | Promega | GA1120 | |
| Software, algorithm | ImageJ/FIJI | ImageJ/FIJI | RRID:SCR_002285 | Image Analysis |
| Software, algorithm | MATLAB | Mathworks | RRID:SCR_001622 | Image Analysis, Simulations |
Additional files
-
Supplementary file 1
Single-molecule FISH probe set sequences.
Measurement of expression of cyclops and squint mRNA by smFISH in wild type, MZoep and MZsmad2 backgrounds is presented in Figure 1—figure supplement 2. Sequences for the requisite smFISH probe sets are organized in this table. Details of probe-dye coupling and embryo staining are contained in the Materials and Methods section of the manuscript.
- https://cdn.elifesciences.org/articles/54894/elife-54894-supp1-v2.xlsx
-
Supplementary file 2
PCR primer sequences.
This table organizes the PCR primers used for mutant genotyping. Genotyping protocols are described in detail in the Materials and methods section.
- https://cdn.elifesciences.org/articles/54894/elife-54894-supp2-v2.xlsx
-
Transparent reporting form
- https://cdn.elifesciences.org/articles/54894/elife-54894-transrepform-v2.pdf
Download links
A two-part list of links to download the article, or parts of the article, in various formats.
Downloads (link to download the article as PDF)
Open citations (links to open the citations from this article in various online reference manager services)
Cite this article (links to download the citations from this article in formats compatible with various reference manager tools)
The pattern of nodal morphogen signaling is shaped by co-receptor expression
eLife 10:e54894.
https://doi.org/10.7554/eLife.54894


