Maf and Mafb control mouse pallial interneuron fate and maturation through neuropsychiatric disease gene regulation
- Department of Psychiatry, University of California San Francisco, United States
- Neuroscience Graduate Program, University of California San Francisco, United States
- Department of Cellular and Molecular Pharmacology, University of California San Francisco, United States
- Howard Hughes Medical Institute, University of California San Francisco, United States
- Department of Neurology, University of California San Francisco, United States
- Gladstone Institute of Neurological Disease, Gladstone Institutes, United States
- Biomedical Sciences Graduate Program, University of California San Francisco, United States
- The Kavli Institute for Fundamental Neuroscience, University of California San Francisco, United States
- Department of Pediatrics and Human Development, Michigan State University, United States
Figures
Scheme 1
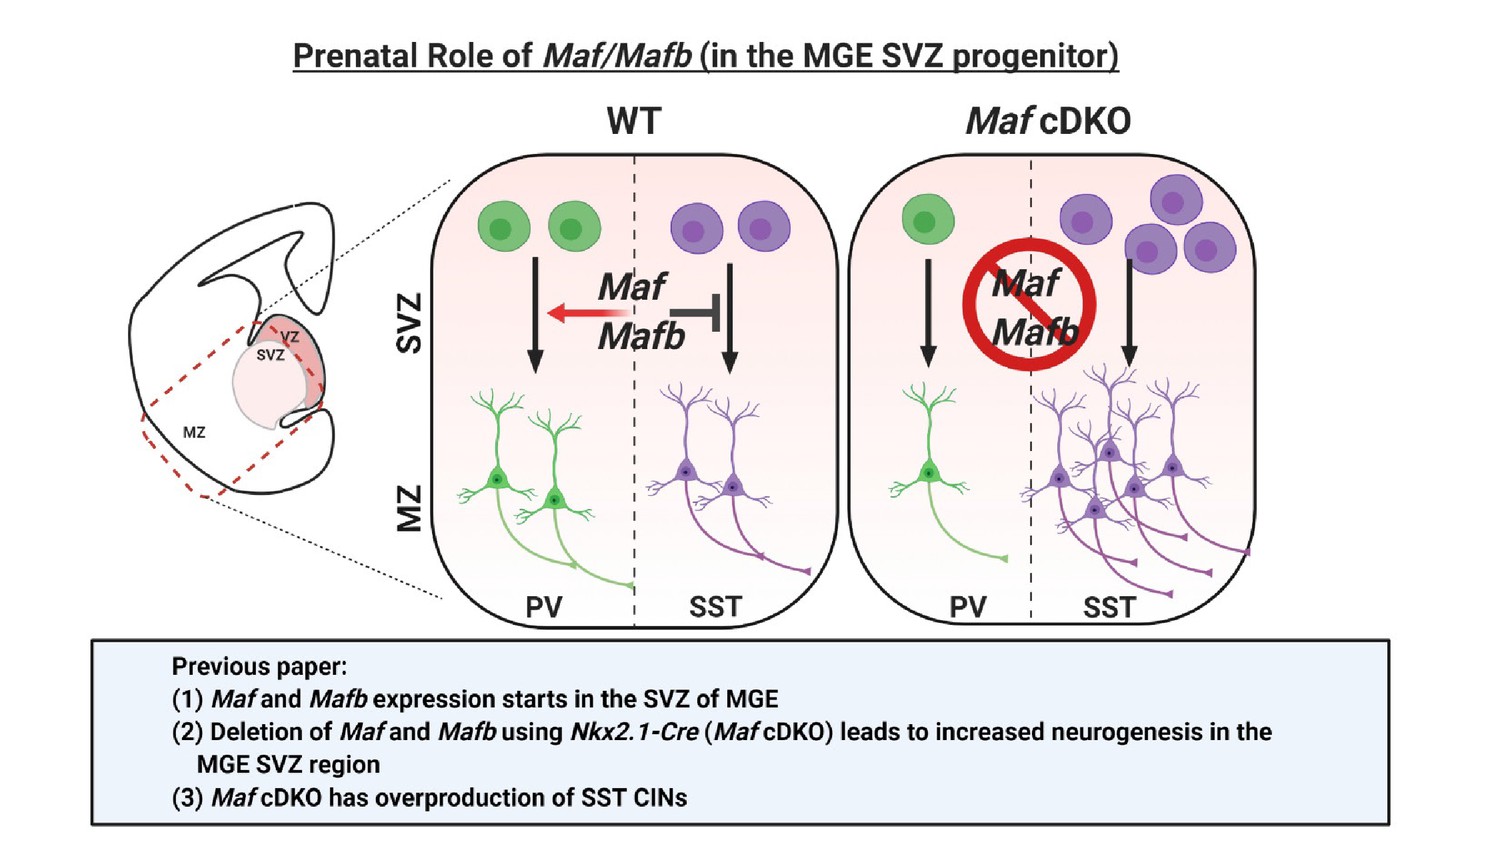
Schema depicting the prenatal roles of Maf and Mafb.
In Pai et al., 2019, we described that the expression of Maf and Mafb starts in the MGE SVZ. Deletion of Maf and Mafb using the Nkx2.1-Cre (Maf cDKO) leads to increased neurogenesis in the MGE SVZ and overproduction of somatostatin (SST) interneurons. In this paper, we aim to identify the downstream gene targets of Maf and Mafb that are involved in this process. SVZ: subventricular zone. MZ: mantle zone.
Scheme 2
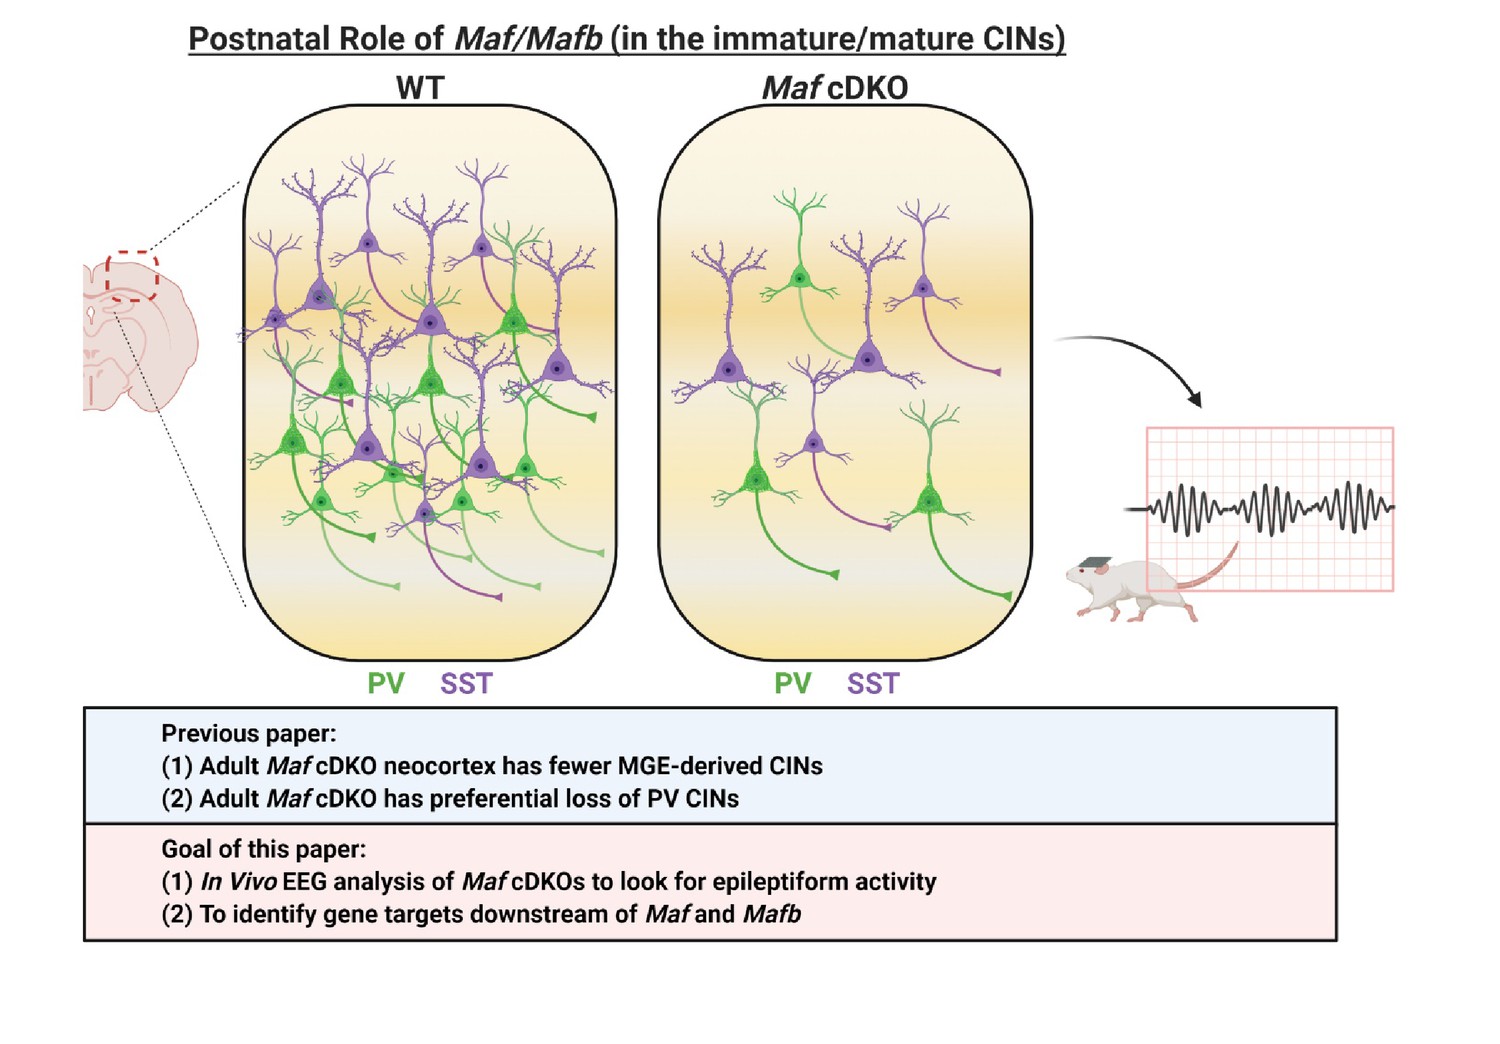
Schema depicting the postnatal roles of Maf and Mafb.
In Pai et al., 2019, we discovered that the adult Maf cDKO mice have drastic reduction of MGE-derived cortical interneurons (CINs) and a preferential loss of parvalbumin (PV) INs. In this paper, we aim to identify potential downstream gene targets of Maf and Mafb that are involved in PV CIN fate specification and differentiation. In this paper, we also provide data that suggest adult Maf cDKO animals have spontaneous epileptic activity in vivo.
Scheme 3

Loss of Maf and Mafb leads to MGE-derived IN morphogenesis defect.
In Pai et al., 2019, we showed that cultured neonatal Maf cDKO interneurons have neurite outgrowth defect compared to the WT counterparts. In this paper, we aim to identify gene targets of Maf and Mafb that are involved in CIN morphological maturation.
Figure 1 with 7 supplements
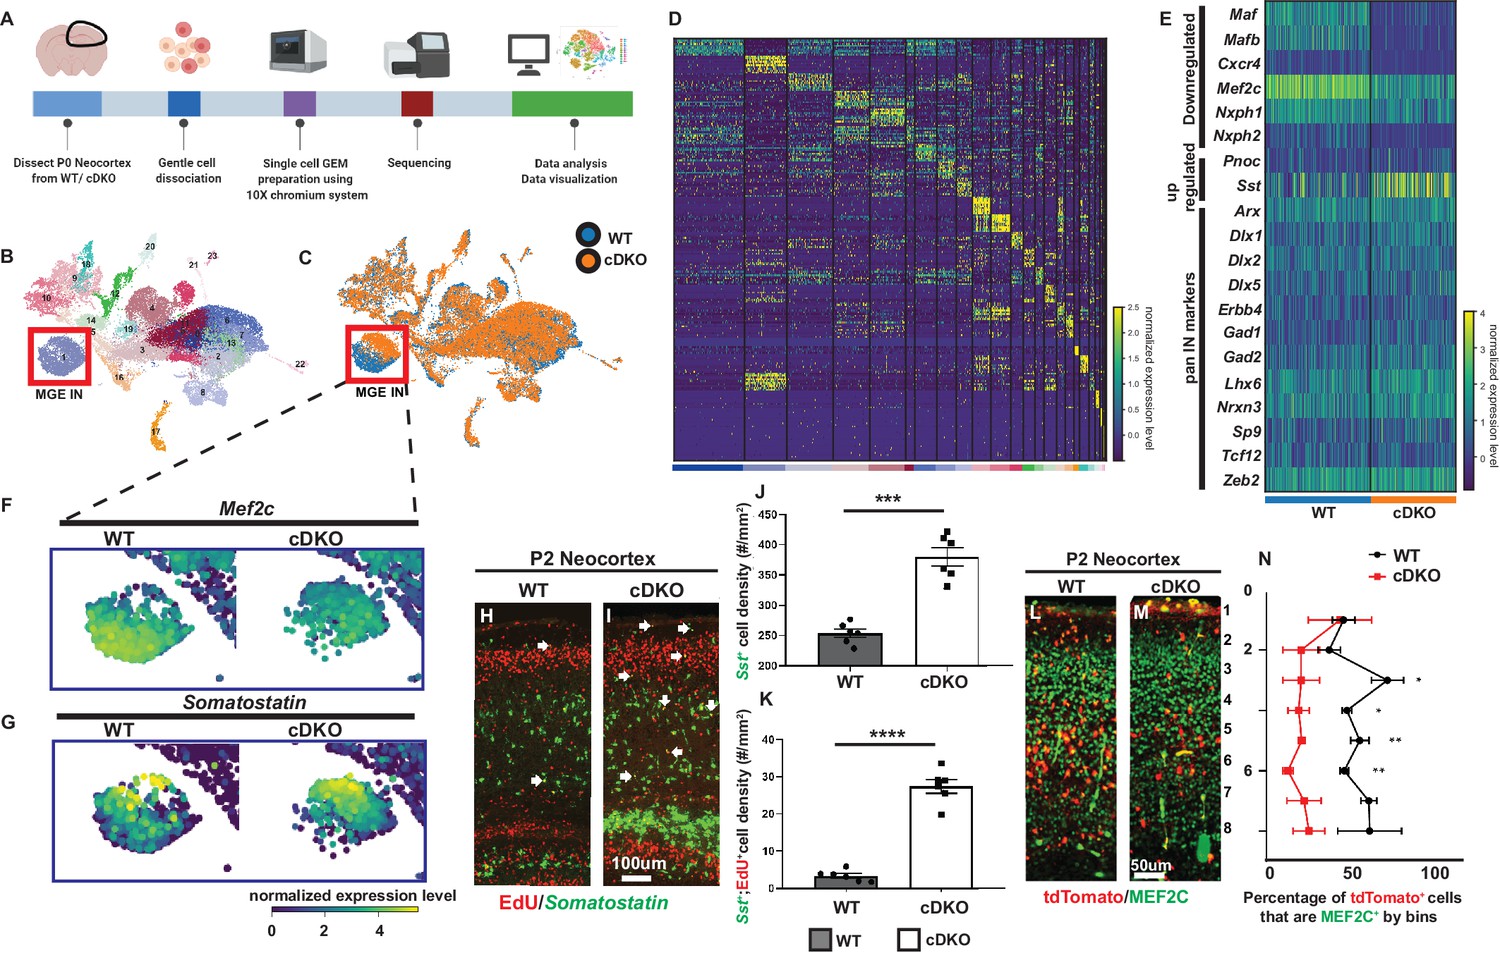
Single cell transcriptomic analysis of P0 WT and Maf cDKO neocortex.
(A) Experimental design for 10X genomics analysis of the P0 WT and Maf cDKO neocortex. Neocortical tissues were dissociated for single cell gel bead-in-emulsion (GEMs) particle preparation, followed by cDNA library preparation, sequencing and data analysis. (B) UMAP plot of WT and cDKO cells, color coded with cluster identities (see Figure 1—figure supplement 2). (C) UMAP plot of WT and cDKO cells, color coded with genotypes; cluster one are MGE INs. Note the genotype separation of the cells in cluster 1 (left bottom), but not other clusters, suggesting the lack of non-cell autonomous effects of the cDKO. (D) Heatmap showing cluster identities with corresponding marker genes. (E) Heatmap of cluster 1 cells from WT and cDKO showing average expression of selected MGE IN markers and pan-IN markers. Note the nearly full depletion of Mafb and Maf and increased expression of Sst, and the decreased expression of Mef2c, while other MGE-derived IN markers such as Dlx1/2/5, Gad2 and Lhx6 were not changed. This suggests that the deletion of Mafs in the MGE-lineage does not lead to a gross change in MGE-derived IN fate. (F–G) Enlarged feature plots showing the expression of Mef2c (F) and Sst (G) from WT and cDKO from cluster 1. (H–I) FISH in Sst together with EdU labeling showing the amount of E15.5 born MGE-derived CINs that became Sst+ in WTs and cDKOs. Arrows point to the cells that are EdU+;Sst+. (J) Quantification of Sst+ CINs at P2 WT and cDKO neocortex. (K) Quantification of EdU+;Sst+ CINs at P2 WT and cDKO neocortex. (L–M) Immunofluorescent staining of MEF2C colocalized with Nkx2.1-cre-driven tdTomato reporter. P2 Maf cDKOs have decreased MEF2C expression (M) compared to WTs (L). (N) Quantification of the proportion of tdTomato+ CINs that were MEF2C+ by bins. N = 3–4 animals per group and multiple brain sections were used for quantification. Scale bar in (I) = 100 um and in (M) = 50 um. *p<0.05, **p<0.01, ***p<0.001, ****p<0.0001.
-
Figure 1—source data 1
Cluster marker gene list Here we provide a list of genes that were used to define each cluster’s identity.
- https://cdn.elifesciences.org/articles/54903/elife-54903-fig1-data1-v2.xlsx
Figure 1—figure supplement 1
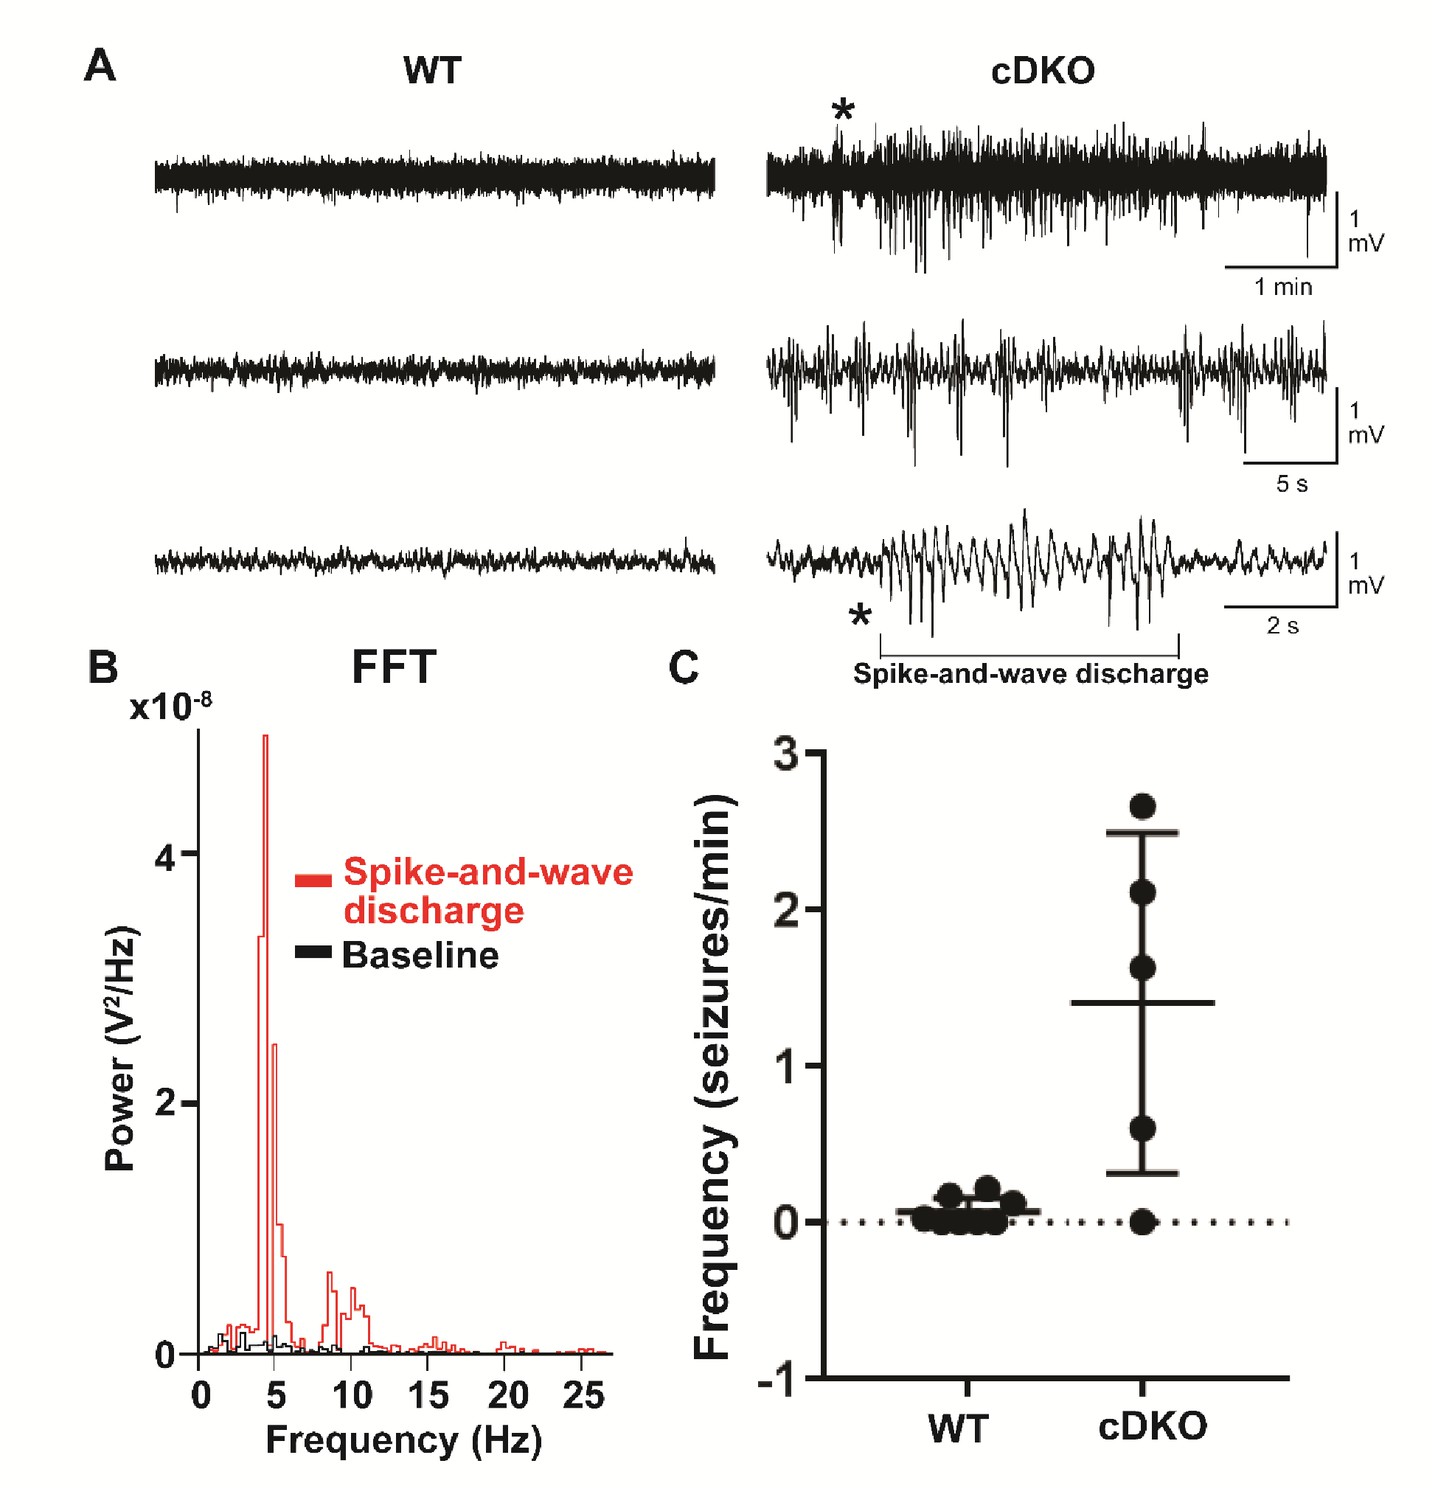
Adult Maf cDKO animals have spontaneous non-motor seizure activities.
(A) Representative EEG recordings from freely behaving WT and Maf cDKO mice. Note the presence of epileptic discharges in the cDKO but not the WT mouse. The epileptic episode indicated by the asterisk was expanded in the bottom trace to illustrate the spike-and-wave discharge characteristic of typical absence type seizures. (B) Fast-Fourier transform of the spike-and-wave discharge (red) illustrated in panel (A), and the preceding baseline EEG activity (black). (C) Quantification of the frequency of epileptiform events in freely behaving WT (n = 7 mice) and cDKO (n = 5 mice) mice.
Figure 1—figure supplement 2
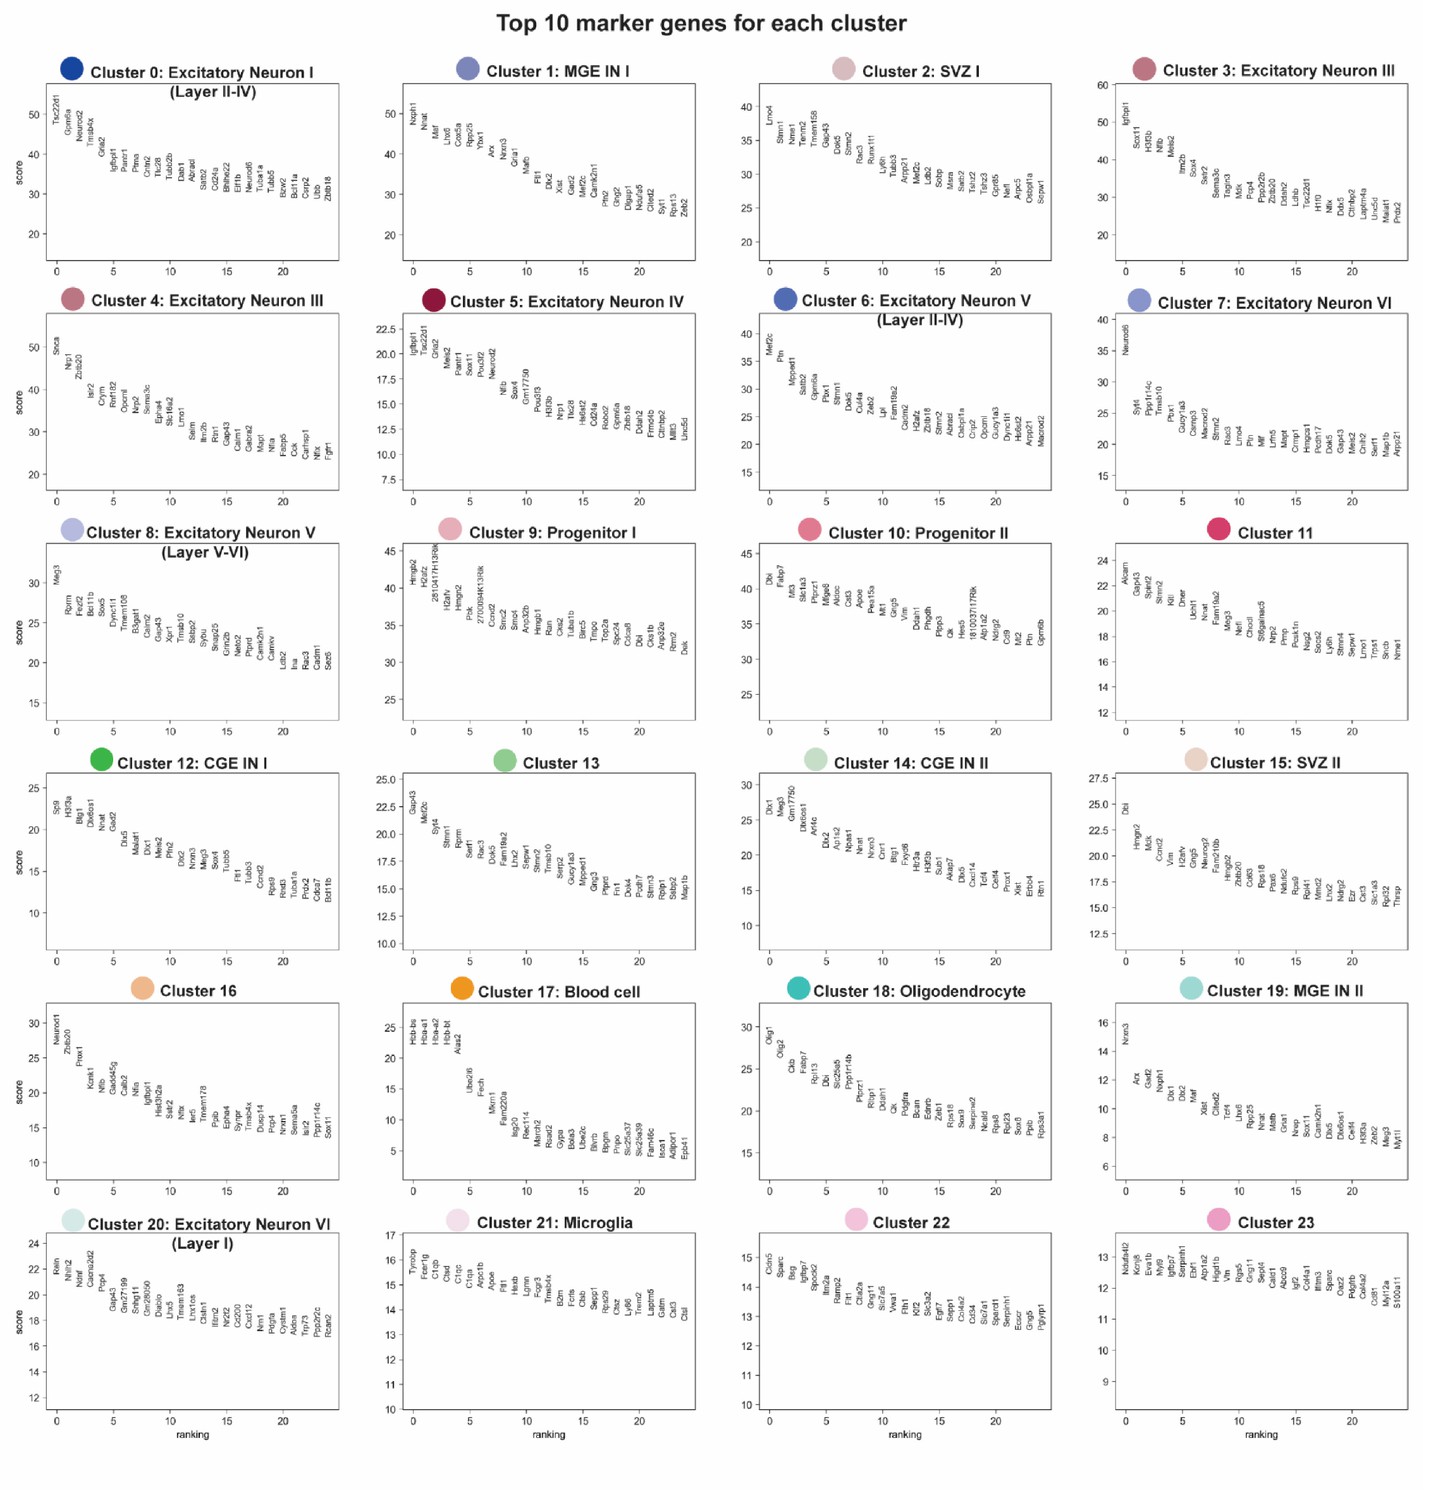
Top 10 ranked marker genes for each cluster.
Each panel shows the cluster number, each cluster’s corresponding color that matched the cluster localization in Figure 1B, and each cluster’s top 10 ranked marker genes.
Figure 1—figure supplement 3
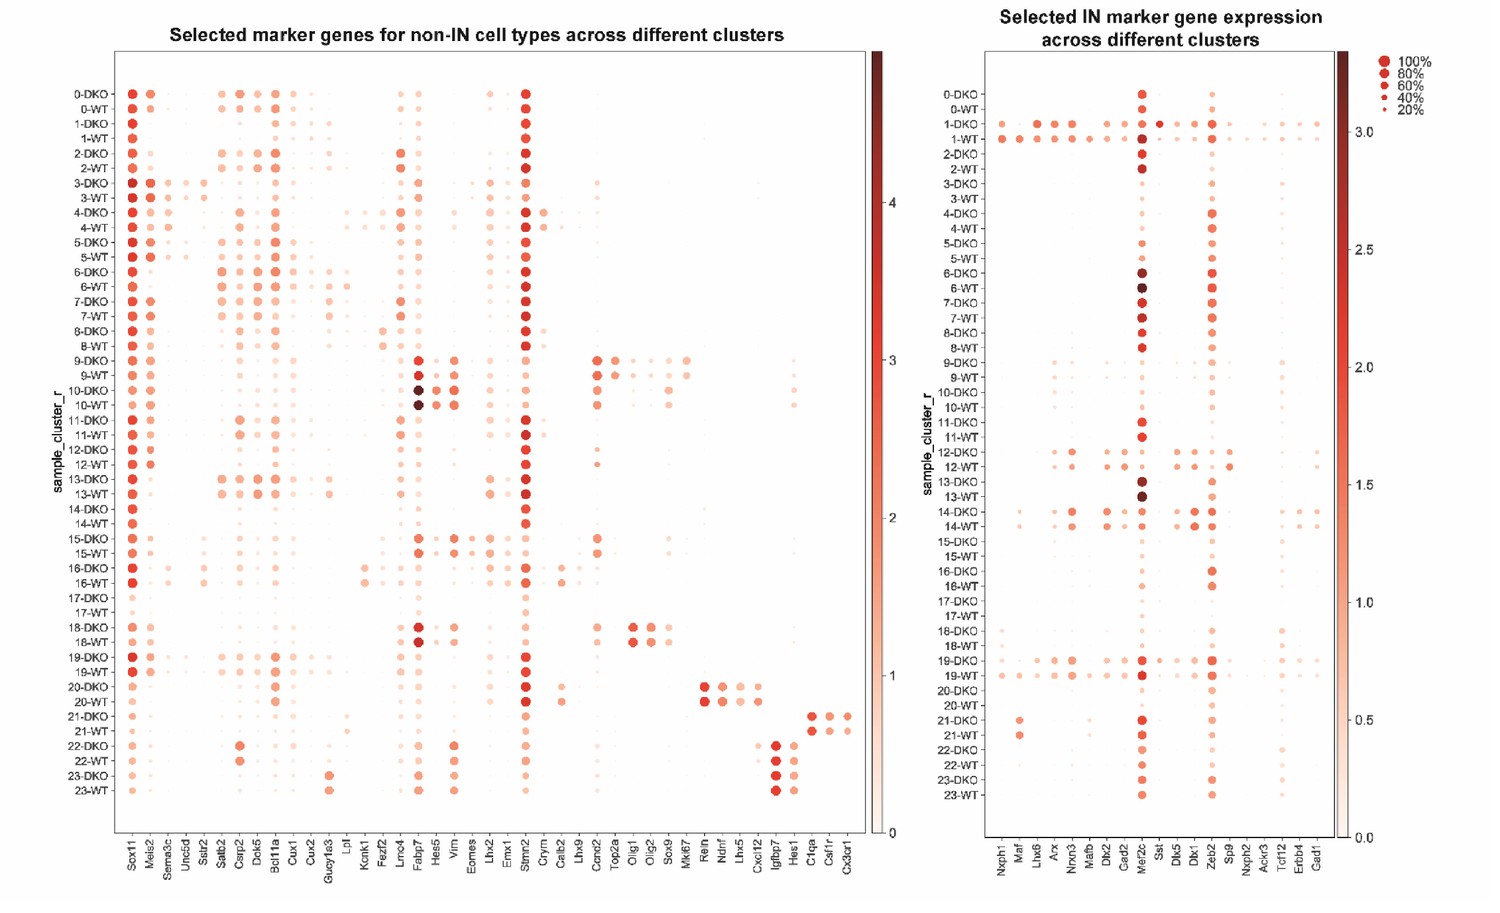
Dotplots of non-IN and IN population by selected marker genes.
Dotplots showing non-IN population (left) and IN population (right) of WT and cDKO based upon selected marker genes. The darkness of the dot positively corresponds to gene expression level and the size of the dot corresponds to the proportion of the cells within each cluster that express specific marker genes.
Figure 1—figure supplement 4
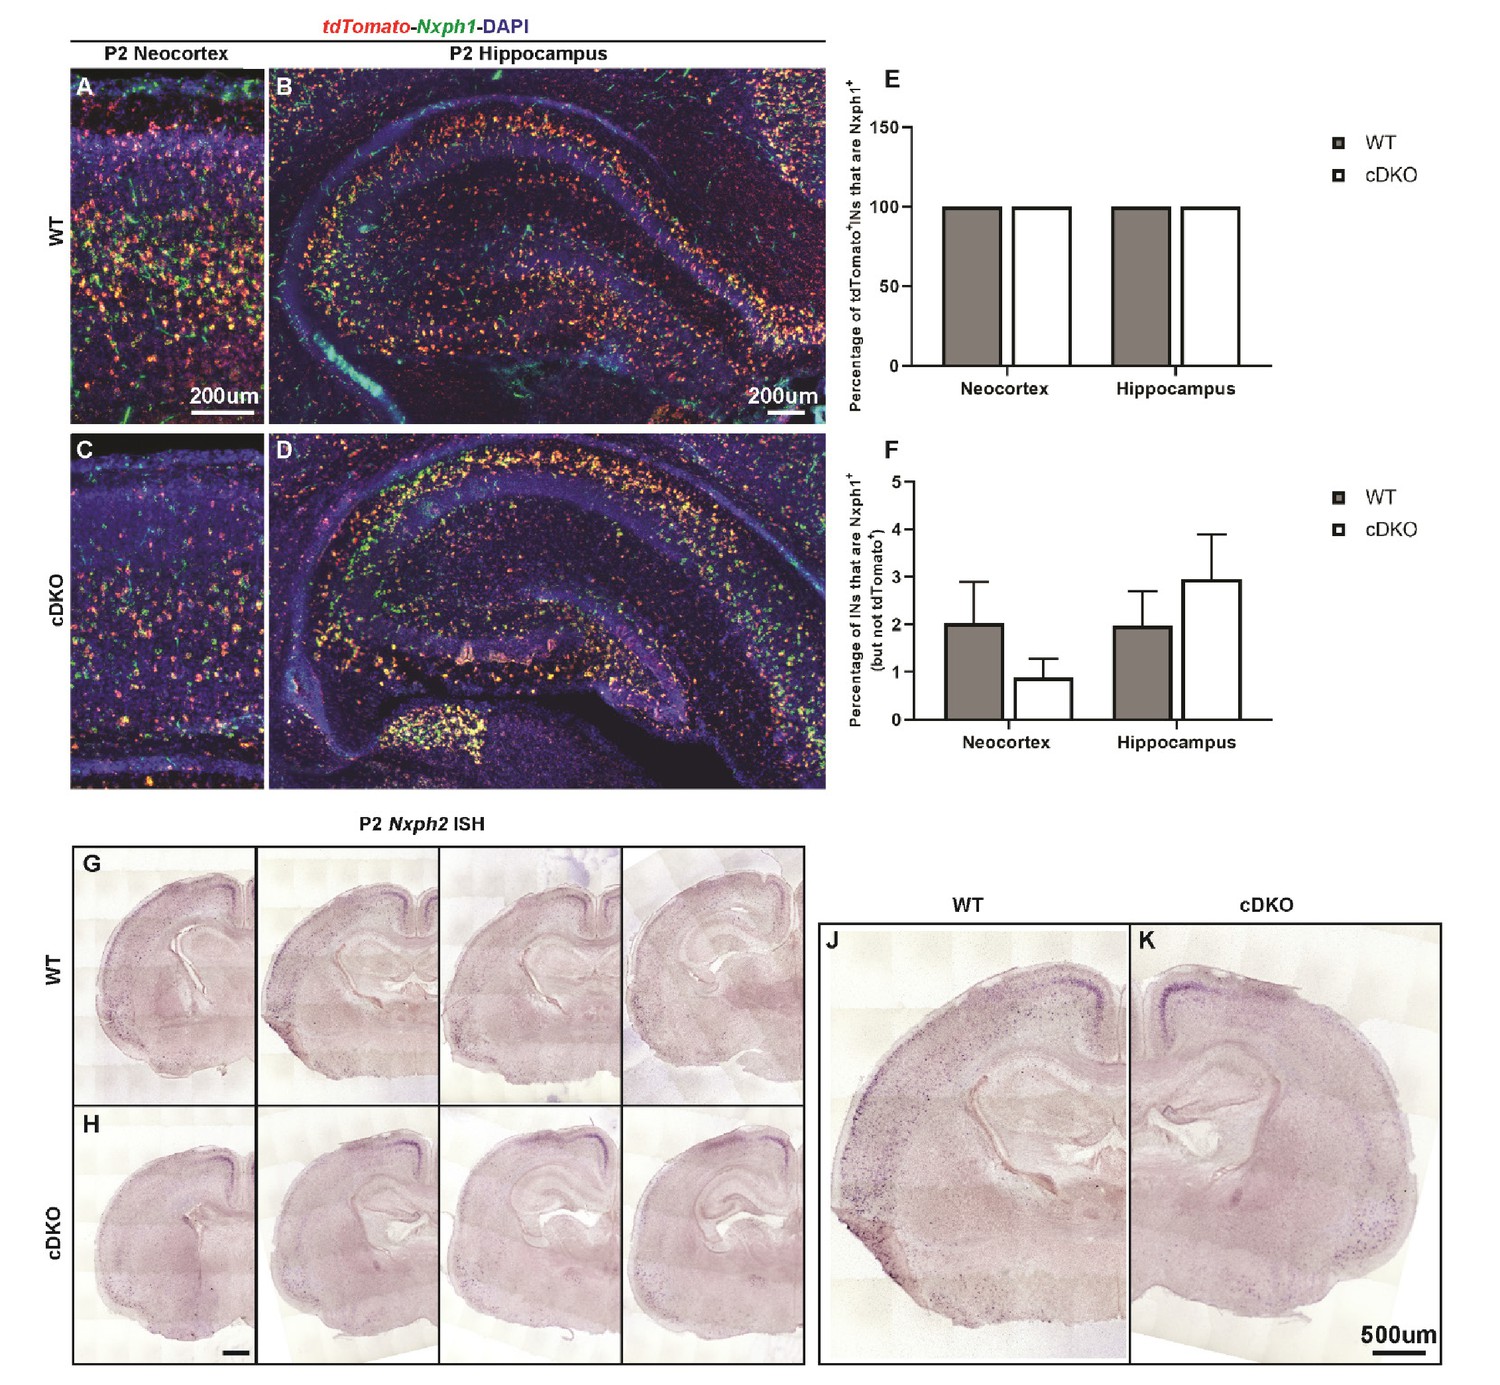
Nxph1-tdTomato double FISH and Nxph2 ISH.
(A–D) Nxph1-tdTomato double FISH on P2 WT (A–B) and cDKO (C–D) neocortex/hippocampus. (E) Quantification of the percentage of tdTomato+ INs that were Nxph1+ by regions. (F) Quantification of the percentage of the Nxph1+ INs that were not tdTomato+ by regions. These data demonstrate the high specificity of Nxph1 labeling in the Nkx2.1-cre lineage. (G–K) Nxph2 ISH on P2 WT (G, J) and cDKO (H, K) brain sections. Note in the WT, Nxph2 labels a subset of INs both in the deep neocortex and in the hippocampus, and the expression of Nxph2 is diminished in the cDKO. Scale bar in (A) and (B) = 200 um; (H) and (K) = 500 um. N = 3–4 per groups.
Figure 1—figure supplement 5
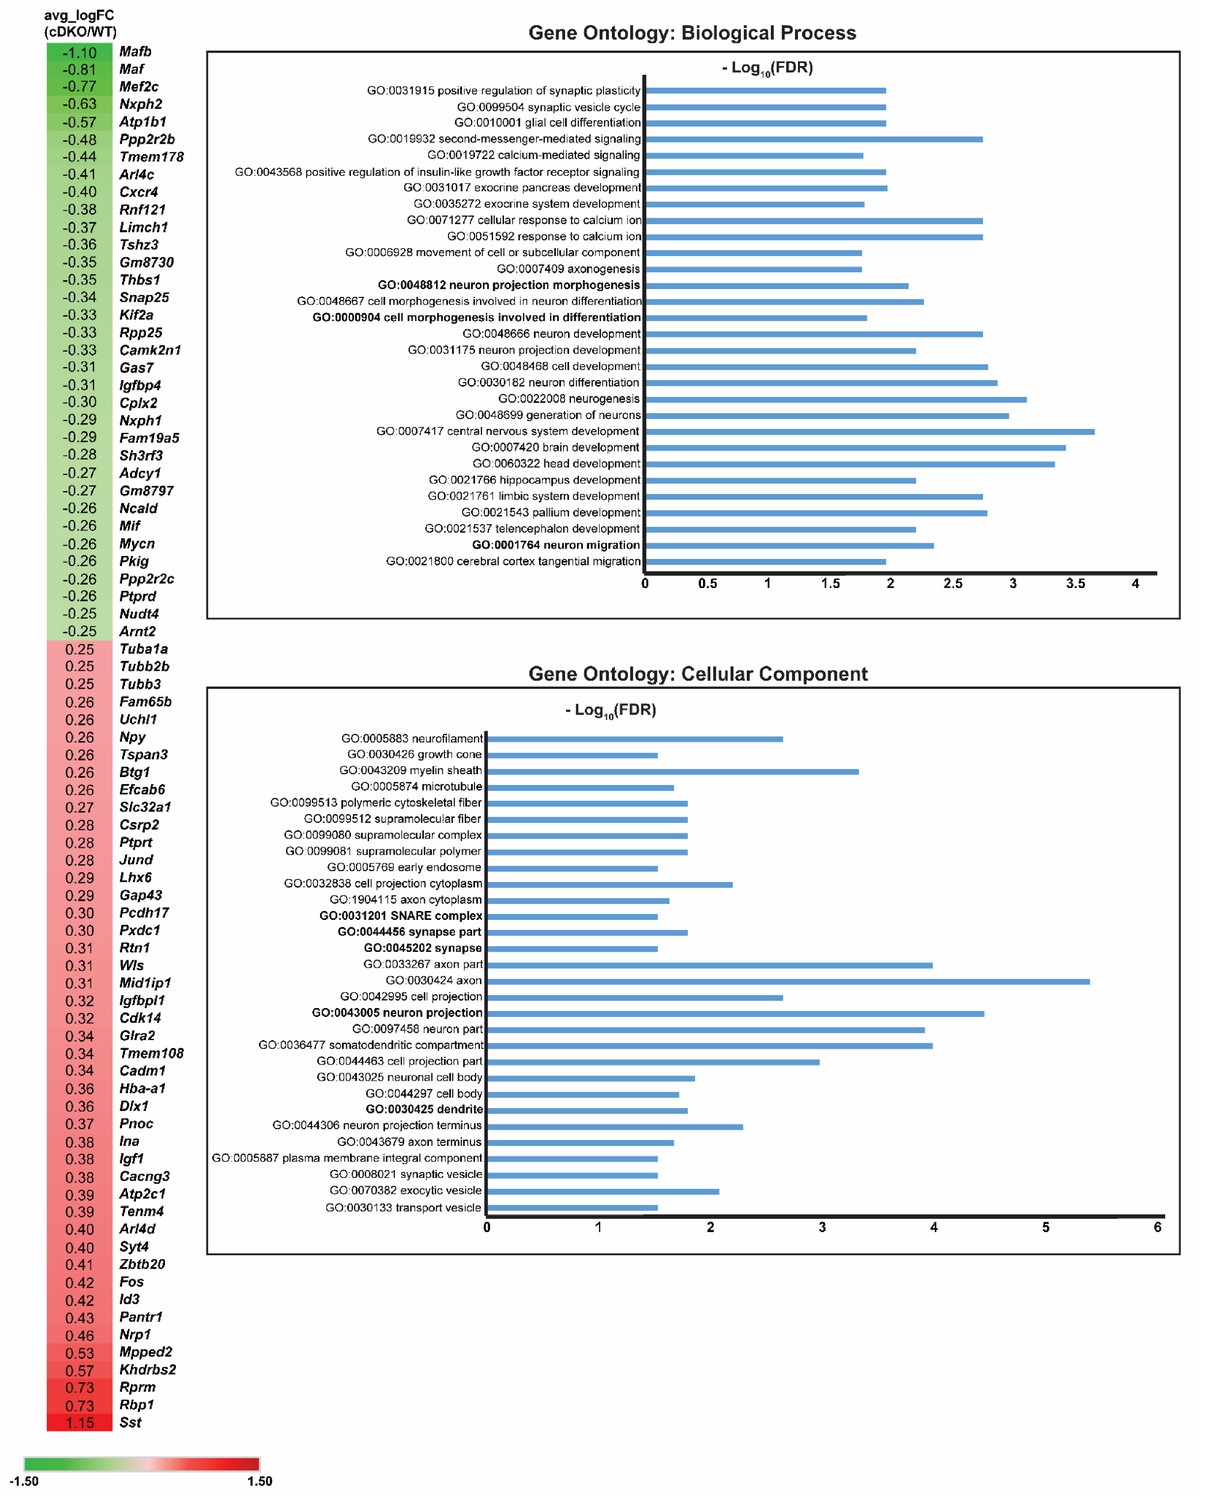
DEX gene list and Gene Ontology analysis on DEX genes Heatmap showing the DEX gene list of the MGE IN population (cluster 1) when compared cDKO to WT.
(Left) Numbers listed corresponds to Log (FoldChange) values. Green color represents genes downregulated in the Maf cDKO, while red color represents genes upregulated in the Maf cDKO. (Right) Gene ontology analysis of the DEX genes based upon biological processes and cellular components.
Figure 1—figure supplement 6
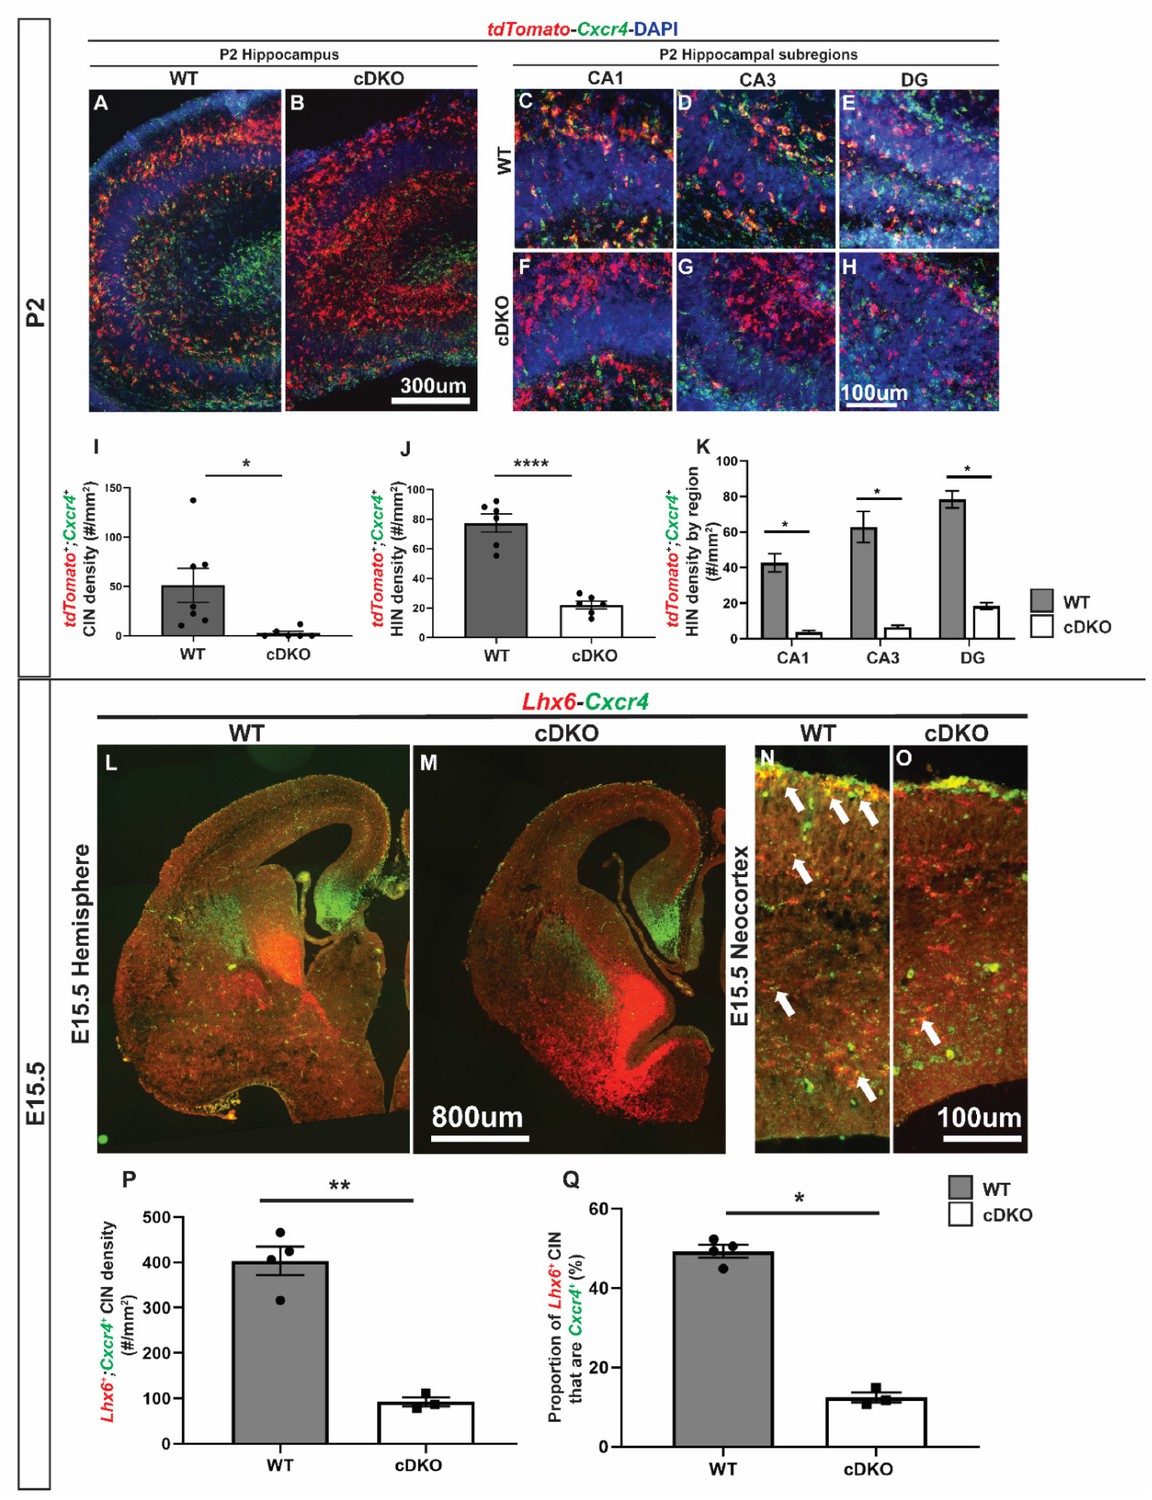
Downregulation of Cxcr4 expression at E15.5 and P2 in the Maf cDKO.
(A–B) double FISH of tdTomato and Cxcr4 on P2 WT (A) and cDKO (B) hippocampus. (C–H) Higher magnification images from WT and cDKO that show tdTomato and Cxcr4 expression in CA1 (C,F), CA3 (D,G) and DG (E, H). (I) Quantification of the tdTomato+;Cxcr4+ IN cell density in the neocortex. (J) Quantification of the tdTomato+;Cxcr4+ IN cell density in the hippocampus. (K) Quantification of the tdTomato+;Cxcr4+ HIN cell density by hippocampal regions. (L–O) double FISH of Lhx6 and Cxcr4 on E15.5 WT (L, N) and cDKO (M, O) hemispheres and higher magnification in neocortex. Arrows point to the Lhx6+ CINs that are Cxcr4+. (P) Quantification of the density of CINs that are Lhx6 and Cxcr4 double positive. (Q) Quantification of the proportion of Lhx6+ CINs that are Cxcr4+. Scale bar in (B) = 300 um, (H) and (O) = 100 um and (M) = 800 um. N = 3–4 per groups for the P2 experiment and N = 2 for the E15.5 experiment. *p<0.05, **p<0.01, ****p<0.0001. Cell density was compared using Welch’s t test while the proportion comparison was done using Mann-Whitney test.
Figure 1—figure supplement 7
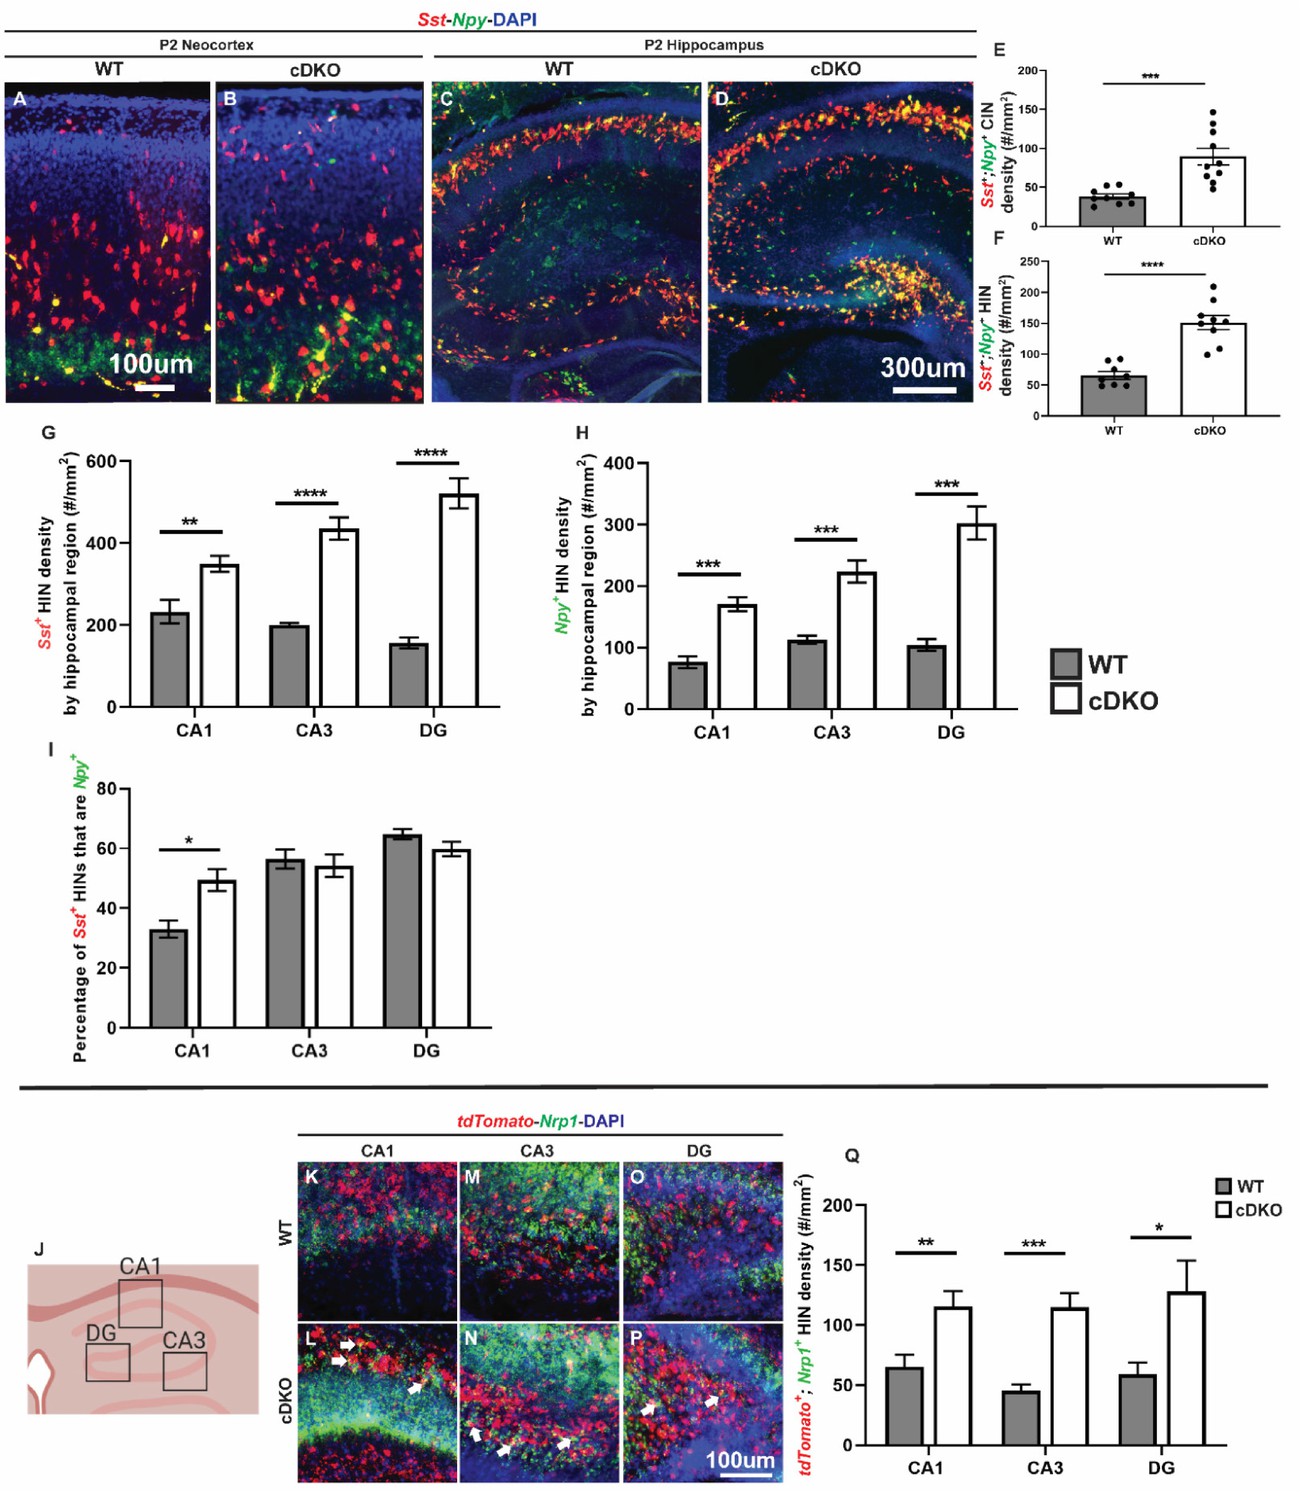
Maf cDKO has increased Sst+/Npy+/Nrp1+ expressing HINs.
(A–B) Double FISH of Sst and Npy on P2 WT (A) and cDKO (B) neocortex. (C–D) Double FISH of Sst and Npy on P2 WT (C) and cDKO (D) hippocampus. (E–F) Quantification of the Npy+; Sst+ CIN density (E) and HIN density (F). (G–H) Quantification of the HINs that are either Sst+ or Npy+ by region. (I) Quantification of the percentage of Sst+ HINs that are Npy+ by region. (J) Cartoon schema illustrating the hippocampal regions used for quantification. (K–P) FISH images from P2 WT and cDKO that show tdTomato and Nrp1 expression in CA1 (K, L), CA3 (M, N) and DG (O, P). Arrows point to the tdTomato+ HINs that are Nrp1+. (Q) Quantification of the tdTomato+;Nrp1+ IN cell density by hippocampal regions. Note that the HINs in the pyramidal cell layer were excluded from the quantification. Scale bar in (A) and (P) = 100 um and (D) = 300 um. N = 3 per groups per experiment for analysis. *p<0.05, **p<0.01, ***p<0.001, ****p<0.0001. Cell density was compared using Welch’s t test while the proportion comparison was done using Mann-Whitney test.
Figure 2 with 1 supplement

Mef2c rescues the deficit of PV CIN production in cDKOs.
(A) Schema showing the MGE transplantation assay. RosaT+ or Maff/f;Mafbf/f;RosaT+ MGE progenitors were dissected at E13.5, followed by transfection of Cre or Cre + Mef2c (expression vectors) to generate cDKO or cDKO + Mef2c MGE cells. We transplanted these cells into P1 WT neocortex and let them mature for 30 days before investigating CIN subtype markers. (B) Quantification of the proportion of transplanted WT, cDKO or cDKO with transfected Mef2c CINs that express either SST or PV. Note that the cDKO group recapitulated the phenotype of preferential loss of PV CINs; transfection with Mef2c rescued the production of PV CINs. Chi-square test was used for statistical analysis. (C–K) Representative singular cell images for group WT, cDKO and cDKO+Mef2c that are labeled with tdTomato and PV. Note that cDKO (F) has less complex neurite growing pattern compared to the WT (C). Also note the rescue of the PV expression in the cDKO+Mef2c (K) compared with the cDKO (H). Scale bar in (K) = 25 um. For SST IN comparison: WT-701 cells, cDKO-627 cells, cDKO+Mef2c- 304 cells; For PV IN comparison: WT- 670 cells, cDKO-587 cells, cDKO+Mef2c −236 cells. These numbers came from 6 WT animals, 4 cDKO animals and 3 cDKO + Mef2c animals. Cells analyzed were converted to contingency table to conduct Chi-square test. ****p<0.0001. Error bars represent standard errors of the mean.
Figure 2—figure supplement 1
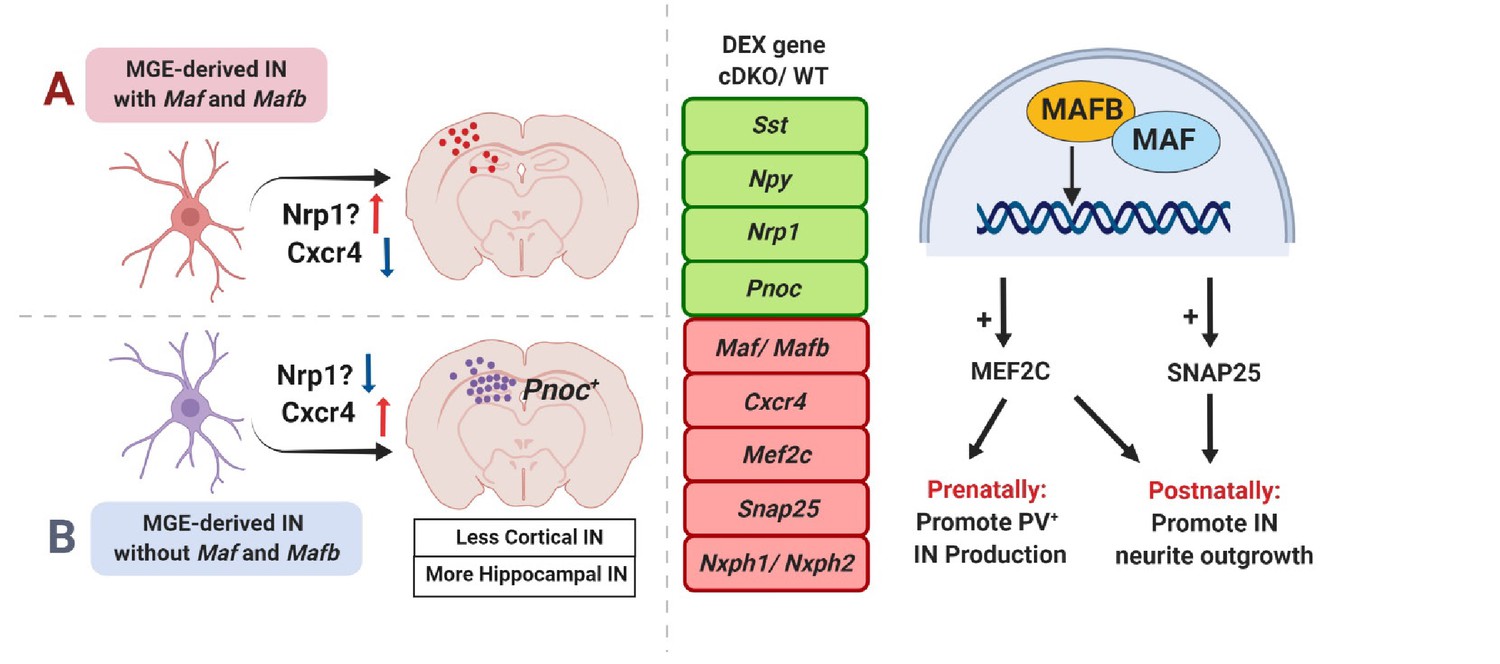
Model.
(Left) Loss of Maf and Mafb in the MGE leads to overproduction of HINs (Sst+ and/or Pnoc+). (Right) DEX analysis revealed that at P0, Maf cDKOs have upregulated expression of Sst, Npy, Nrp1 and Pnoc; downregulated expression of Maf, Mafb, Mef2c, Cxcr4, Snap25, Nxph1 and Nxph2. Our data suggested that prenatally, Maf and Mafb promote Mef2c expression to drive PV IN production; postnatally, Maf and Mafb regulate Mef2c and Snap25 expression to regulate IN neurite morphogenesis.
Figure 3 with 3 supplements
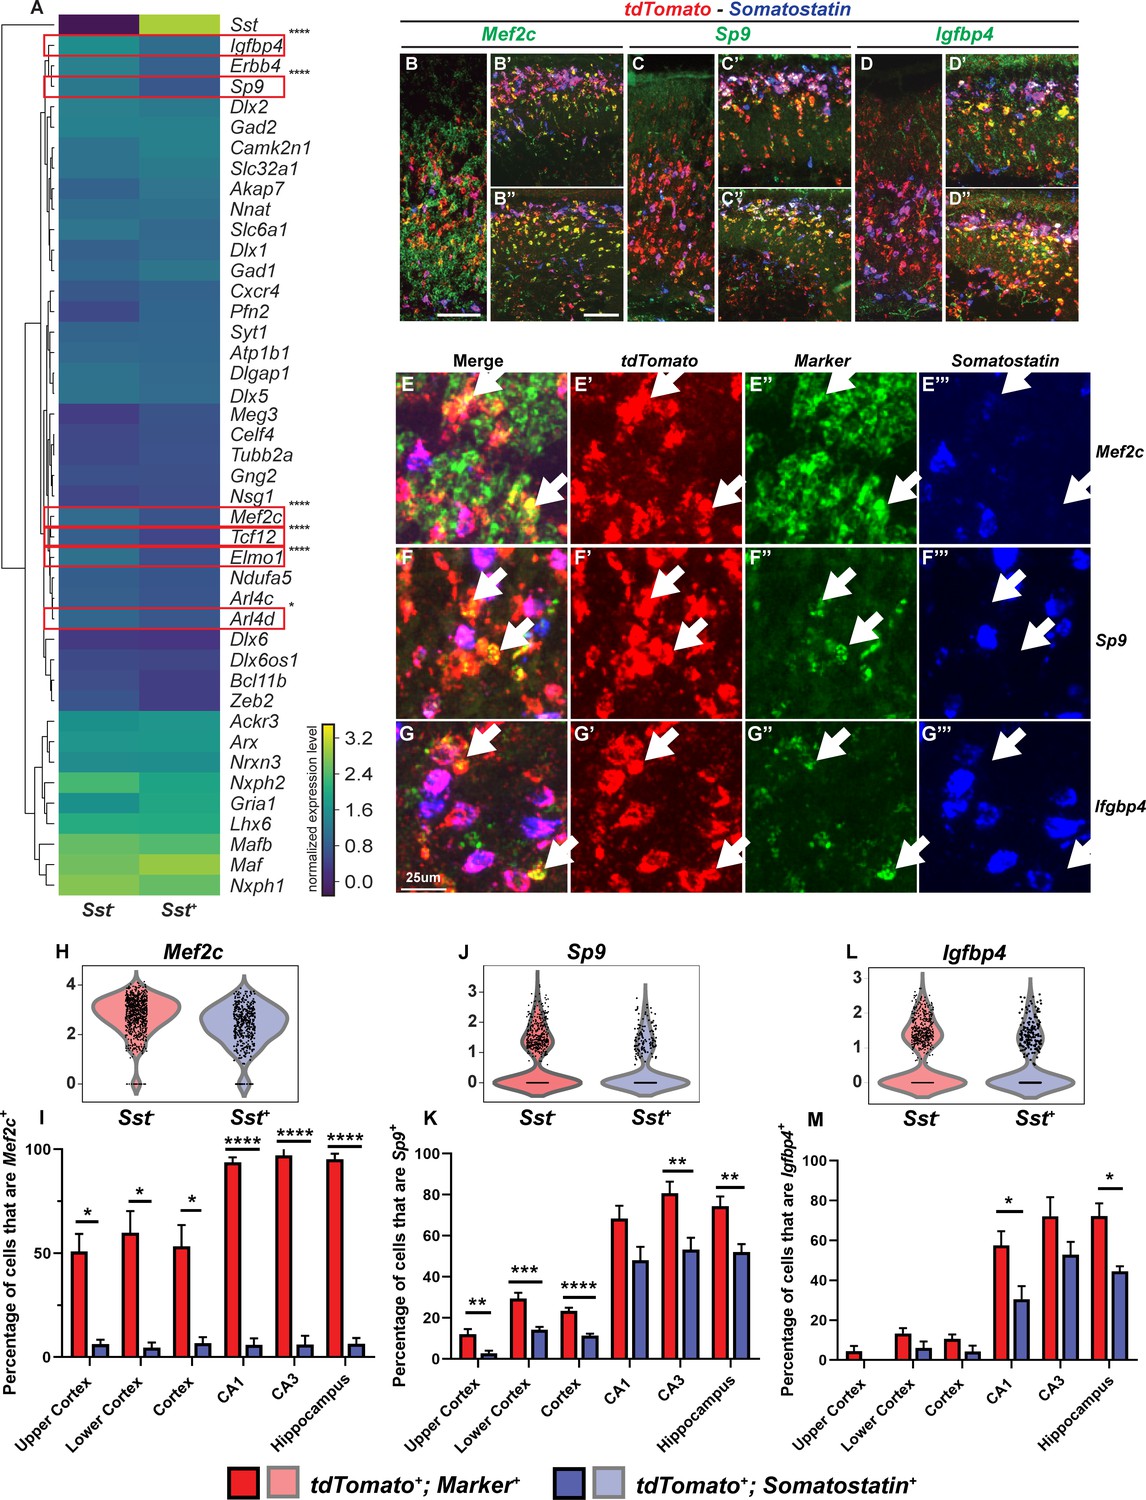
Multiplex RNA in situ hybridization validation of proposed immature PV IN markers.
(A) Heatmap of MGE IN marker genes for cluster 1 Sst- and Sst+ INs. (B–D’’) Lower magnification fluorescent images of multiplex RNA in situ hybridization for Mef2c (B–B’’), Sp9 (C–C’’) and Igfbp4 (D–D’’). (E–G’’’) Higher magnification fluorescent images of multiplex RNA in situ hybridization for Mef2c (E–E’’’), Sp9 (F–F’’’) and Igfbp4 (G–G’’’). White arrows point to INs that are marker (Mef2c, Sp9 or Igfbp4) and tdTomato positive but Sst negative. Violin plots showing the normalized expression value (Y-axis) of each cell analyzed in each group for Mef2c (H), Sp9 (J) and Igfbp4 (L). Quantification of the percentage of tdTomato+; Sst- and tdTomato+; Sst+ INs in the neocortex and in the hippocampus that are either Mef2c+(I), Sp9+(K) or Igfbp4+(M). Scale bar in (B) = 100 um, (B’’) = 200 um and (G) = 25 um. 2 WTs and multiple brain sections per animal were used for quantification. For statistical analysis, multiple independent t-tests without same standard deviation assumption were conducted to compare the expression of each gene in each brain region. *p<0.05, **p<0.01, ***p<0.001, ****p<0.0001.
Figure 3—figure supplement 1
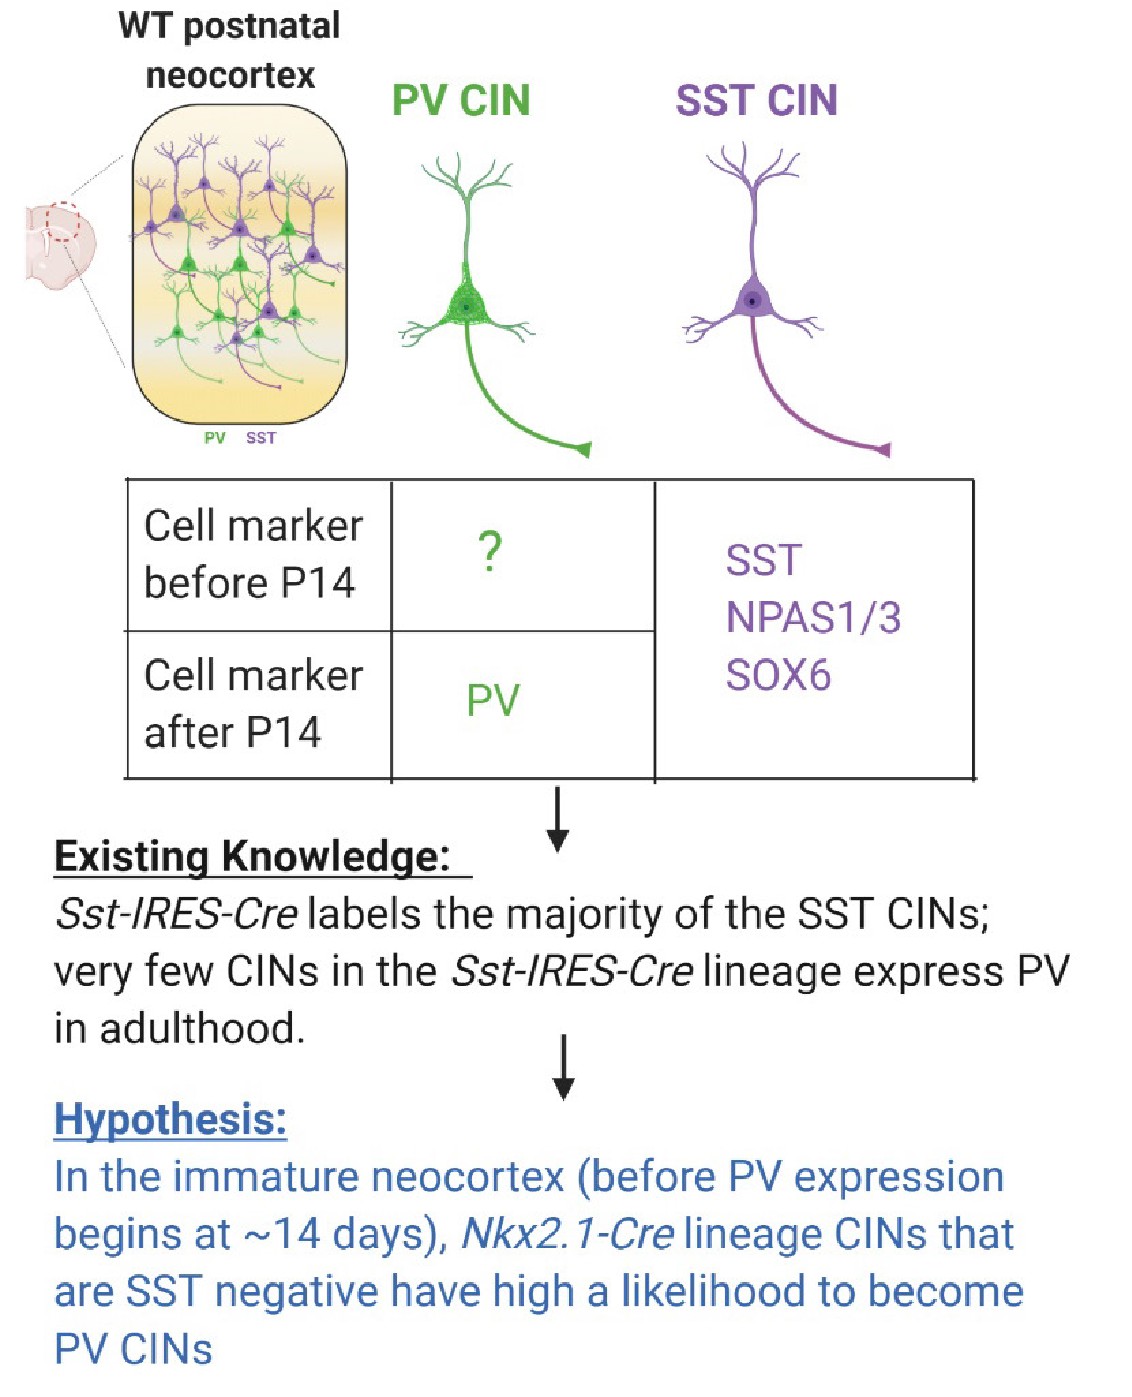
Schema depicting the hypothesis behind candidate PV IN marker discovery In Pai et al., 2019, we fate-mapped the Sst-IRES-Cres lineage and discovered that > 90% of Sst-IRES-Cre labeled CINs remain to be SST-expressing in adulthood.
Very few Sst-IRES-Cre CINs become PV-expressing. We hypothesize that the MGE-derived immature CINs that are SST-negative have a high likelihood to become PV CINs.
Figure 3—figure supplement 2
Multiplex RNA in situ hybridization validation of proposed immature PV IN markers.
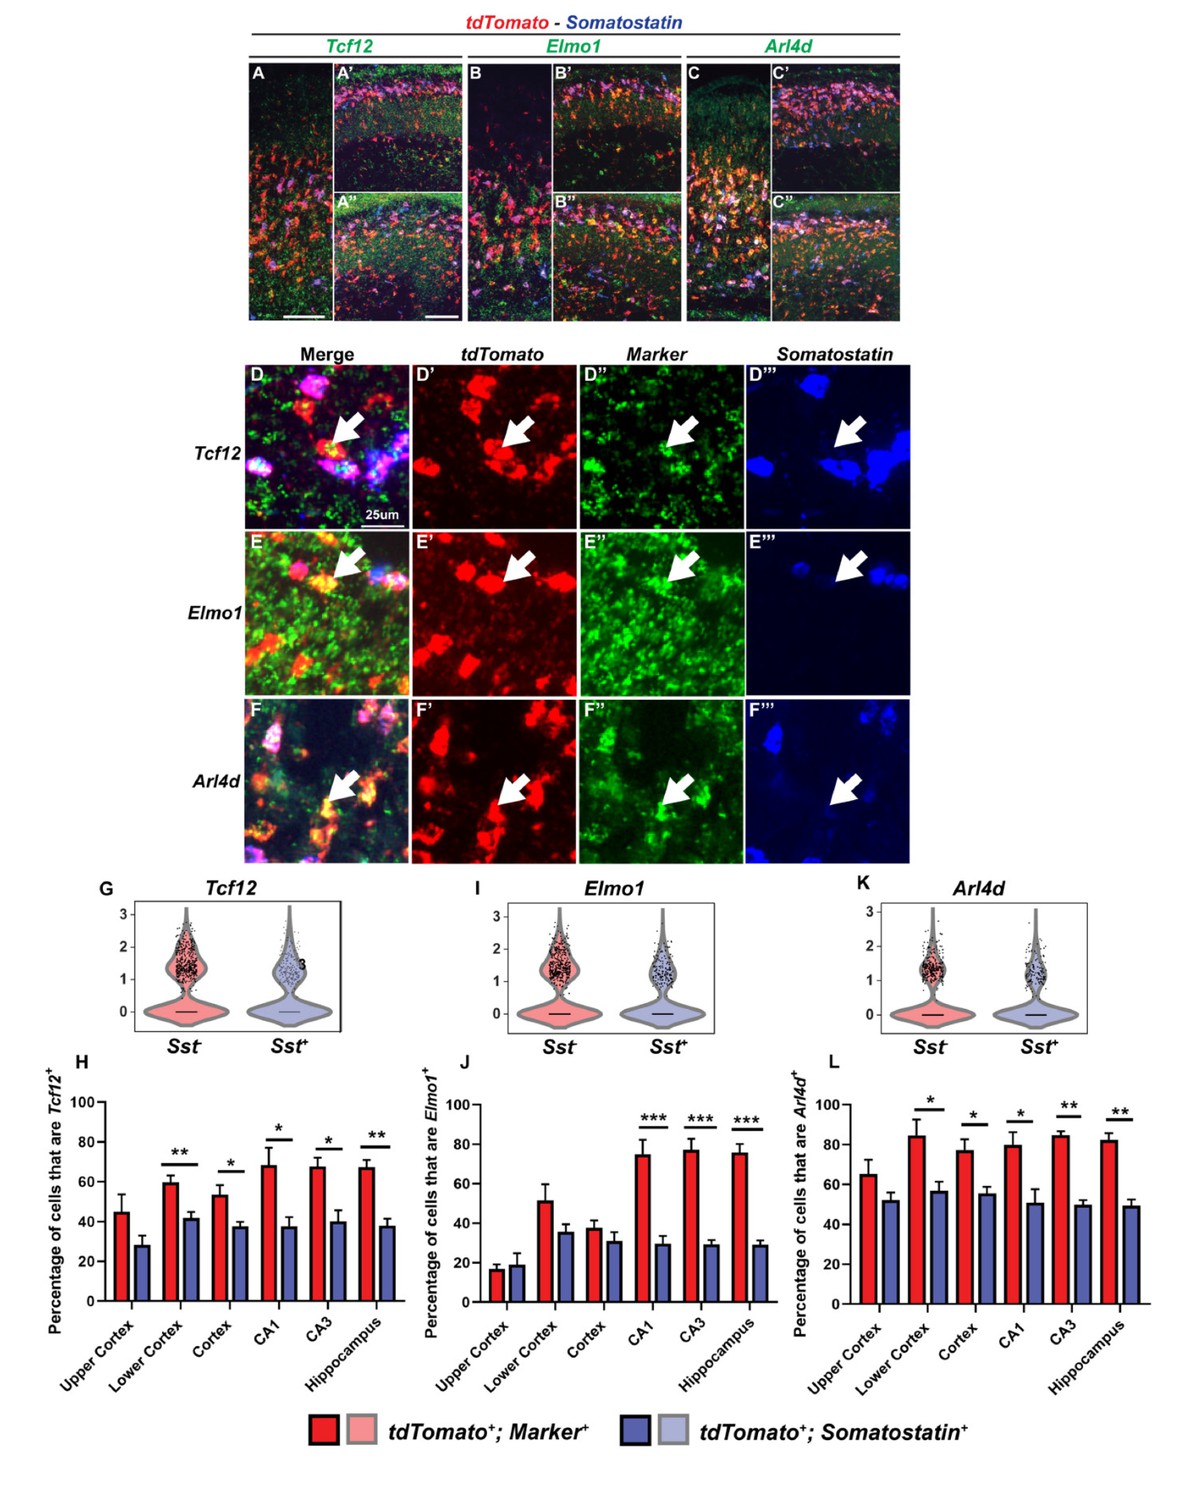
(A–C’’) Lower magnification fluorescent images of multiplex RNA in situ hybridization for Tcf12(A-A’’), Elmo1(B-B’’) and Arl4d(C-C’’). (D–F’’’) Higher magnification fluorescent images of multiplex RNA in situ hybridization for Tcf12(D-D’’’), Elmo1 (E–E’’’) and Arl4d (F–F’’’). White arrows point to INs that are marker (Tcf12, Elmo1 or Arl4d) and tdTomato positive but Sst negative. Violin plots showing the normalized expression value (Y-axis) of each cell analyzed in each group for Tcf12(G), Elmo1(I) and Arl4d(K). Quantification of the percentage of tdTomato+; Sst- and tdTomato+; Sst+ INs in the neocortex and in the hippocampus that are either Tcf12+(H), Elmo1+(J) or Arl4d+(L). Scale bar in (A) = 100 um, (A’’) = 200 um and (D) = 25 um. 2 WTs and multiple brain sections per animal were used for quantification. For statistical analysis, multiple independent t-tests without same standard deviation assumption were conducted to compare the expression of each gene in each brain region. *p<0.05, **p<0.01, ***p<0.001.
Figure 3—figure supplement 3
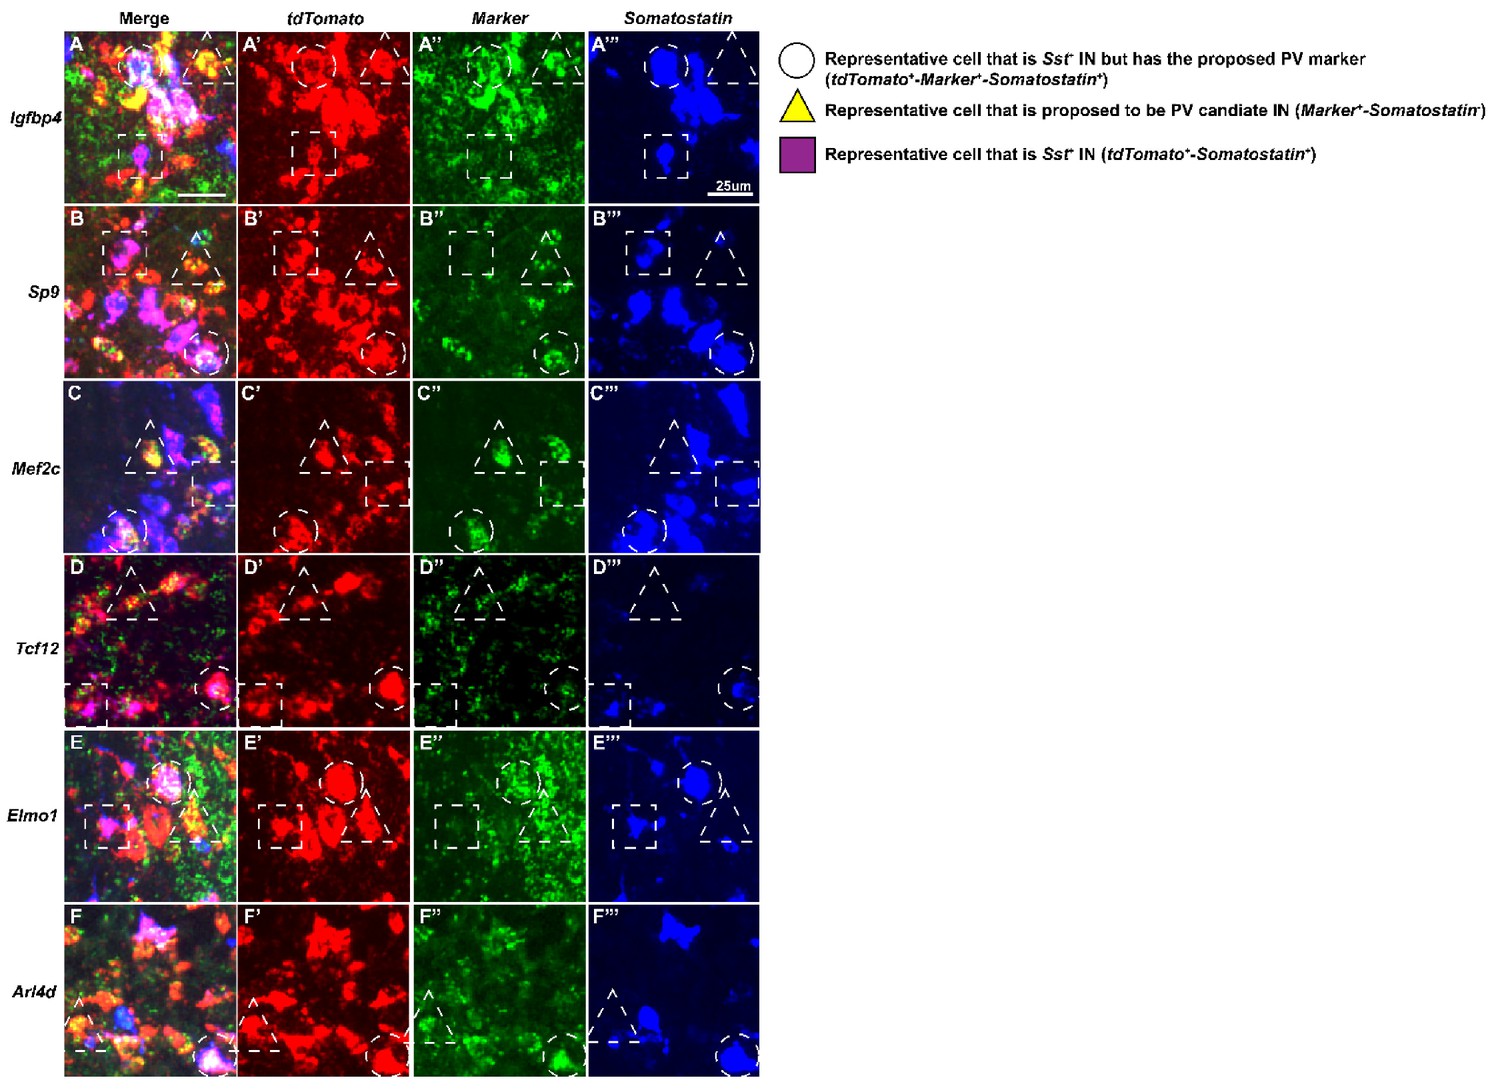
Higher magnification view of HINs from multiplex fluorescent in situ hybridization.
Higher magnification of HINs that are marker positive [Igfbp4(A-A’’’), Sp9(B-B’’’), Mef2c(C-C’’’), Tcf12(D-D’’’), Elmo1(E-E’’’) and Arl4d(F-F’’’)] that are either in the Sst-lineage or in the proposed immature PV-lineage. Circle: representative cell that is Sst+ In but has the proposed PV marker; Triangle: representative cell that is proposed to be PV candidate IN; Square: representative cell that is Sst+ IN. Scale bar in (A) = 25 um.
Figure 4 with 2 supplements

Mef2c and Snap25 are required downstream of Mafb and Maf to promote neurite outgrowth.
A) Schema showing the in vitro culture assay testing Maf and Mafb’s prenatal function on neurite outgrowth. P0 WT and cDKO neocortical tissues were dissociated (INs were labeled with Nkx2.1-cre-driven tdTomato) and diluted 5-fold with reporter negative dissociated P0 WT neocortical tissues before plating on culture slides. (B–C) Representative traces of cultured WT and cDKO INs. (D–F) Representative traces of cultured cDKO INs transfected with Maf, Mef2c or Snap25-expressing plasmids; each showed a rescue phenotype. (G–I) Sholl analysis showing the neurite complexity and the rescue effects of Maf (G), Mef2c (H) and Snap25 (I). (J) Schema showing the in vitro culture assay testing Maf and Mafb’s postnatal function on neurite outgrowth. (K–O) Representative traces of cultured INs using Maff/f;Mafbf/f; RosaT+ P0 neocortices to look at the effect of postnatal deletion of Maf and Mafb on neurite outgrowth and if Maf, Mef2c and Snap25 expression showed rescue effects. Thus, postnatal loss of Maf and Mafb (cDKOPOST) leads to defects in neurite outgrowth (K–L). (P–R) Sholl analysis showing the neurite complexity and the rescue effects of Maf (P), Mef2c (Q) and Snap25 (R) on cDKOPOST INs. Scale bar in (F) and (O) = 100 um. N = 3–4 per groups. The quantity of cells used for analysis was included in (G–I) and (P–R).
Figure 4—figure supplement 1
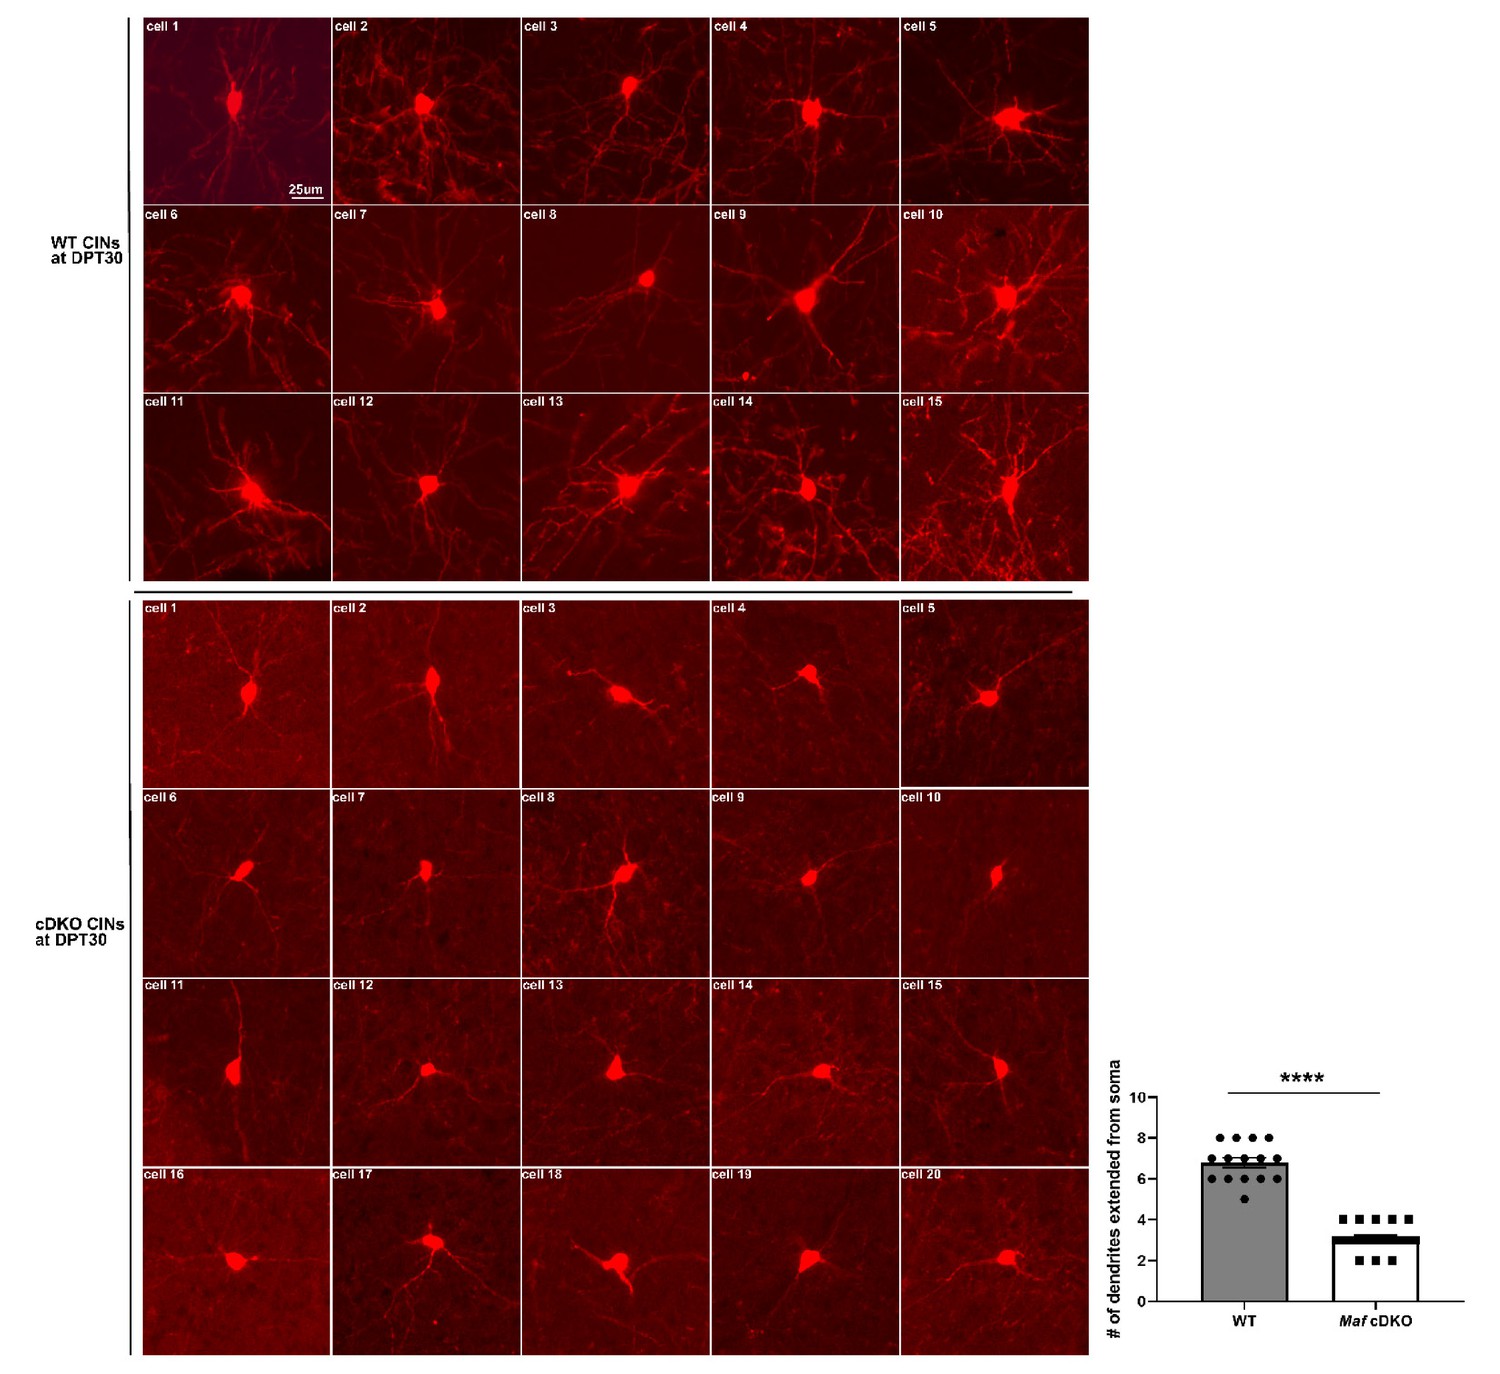
Individual CINs from transplanted WT and Maf cDKO MGE cells grown in vivo for 30 days.
Here we provide a collection of single cell images from the transplant experiment. Top three rows show WT CINs that developed in a WT neocortex in vivo for 30 days, while the bottom four rows show Maf cDKO CINs that developed in a WT neocortex in vivo for 30 days. We quantified the number of dendrites extending from the soma in each genotype, and used unpaired t-test to conduct statistical comparison. The data suggest that Maf cDKO CINs have decreased neurite numbers, which is consistent with our in vitro finding (Figure 4). Each data point represents 1 cells. ****p<0.0001. WT: 15 cells from three animals; Maf cDKO: 20 cells from three animals.
Figure 4—figure supplement 2
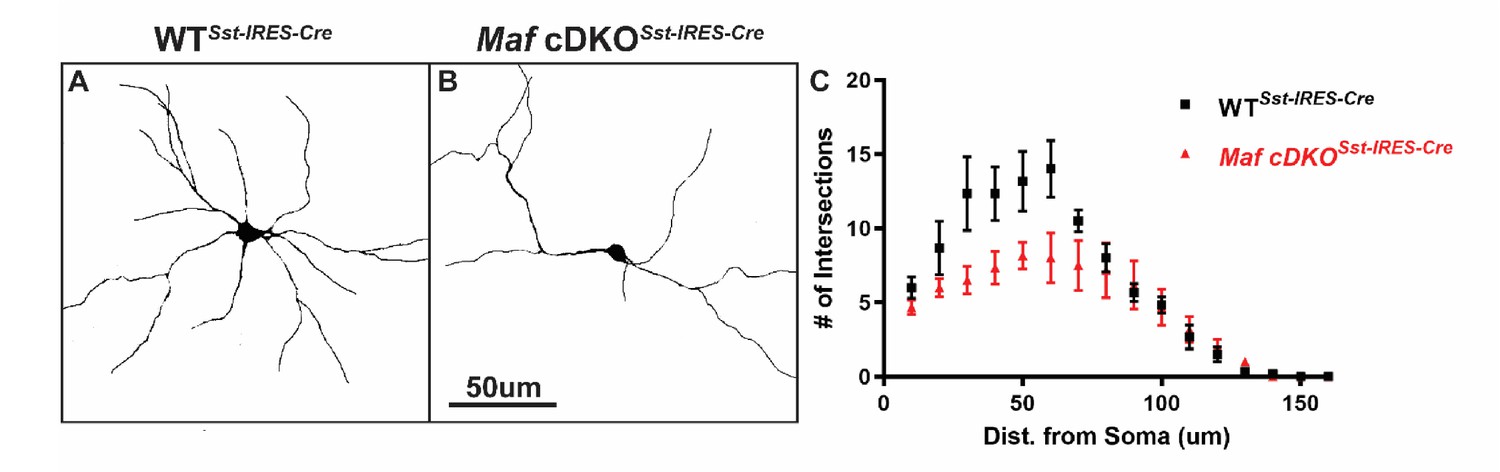
Maf cDKOSst-IRES-Cre showed defects in neurite outgrowth We used in vitro culture assay to test Mafb and c-Maf’s post-mitotic function on neurite outgrowth.
Briefly, P0 Sst-IRES-Cre generated WT and Maf cDKO neocortical tissues were dissociated (INs were labeled with Cre-dependent tdTomato expression) and diluted 5-fold with reporter negative dissociated P0 WT neocortical tissues before plating on culture slides. Cells were let grow for 14 days in vitro before analysis. (A–B) Representative traces of cultured WTSst-IRES-Cre and cDKO Sst-IRES-Cre INs. (C) Sholl analysis suggested that Maf cDKO Sst-IRES-Cre INs have less complex neurite growing pattern, suggesting Mafs roles in the post-mitotic stage for IN morphogenesis. N = 3 for both groups. 6–8 neurons per group were used for quantification. Scale bar in (B) = 50 um.
Figure 5 with 1 supplement
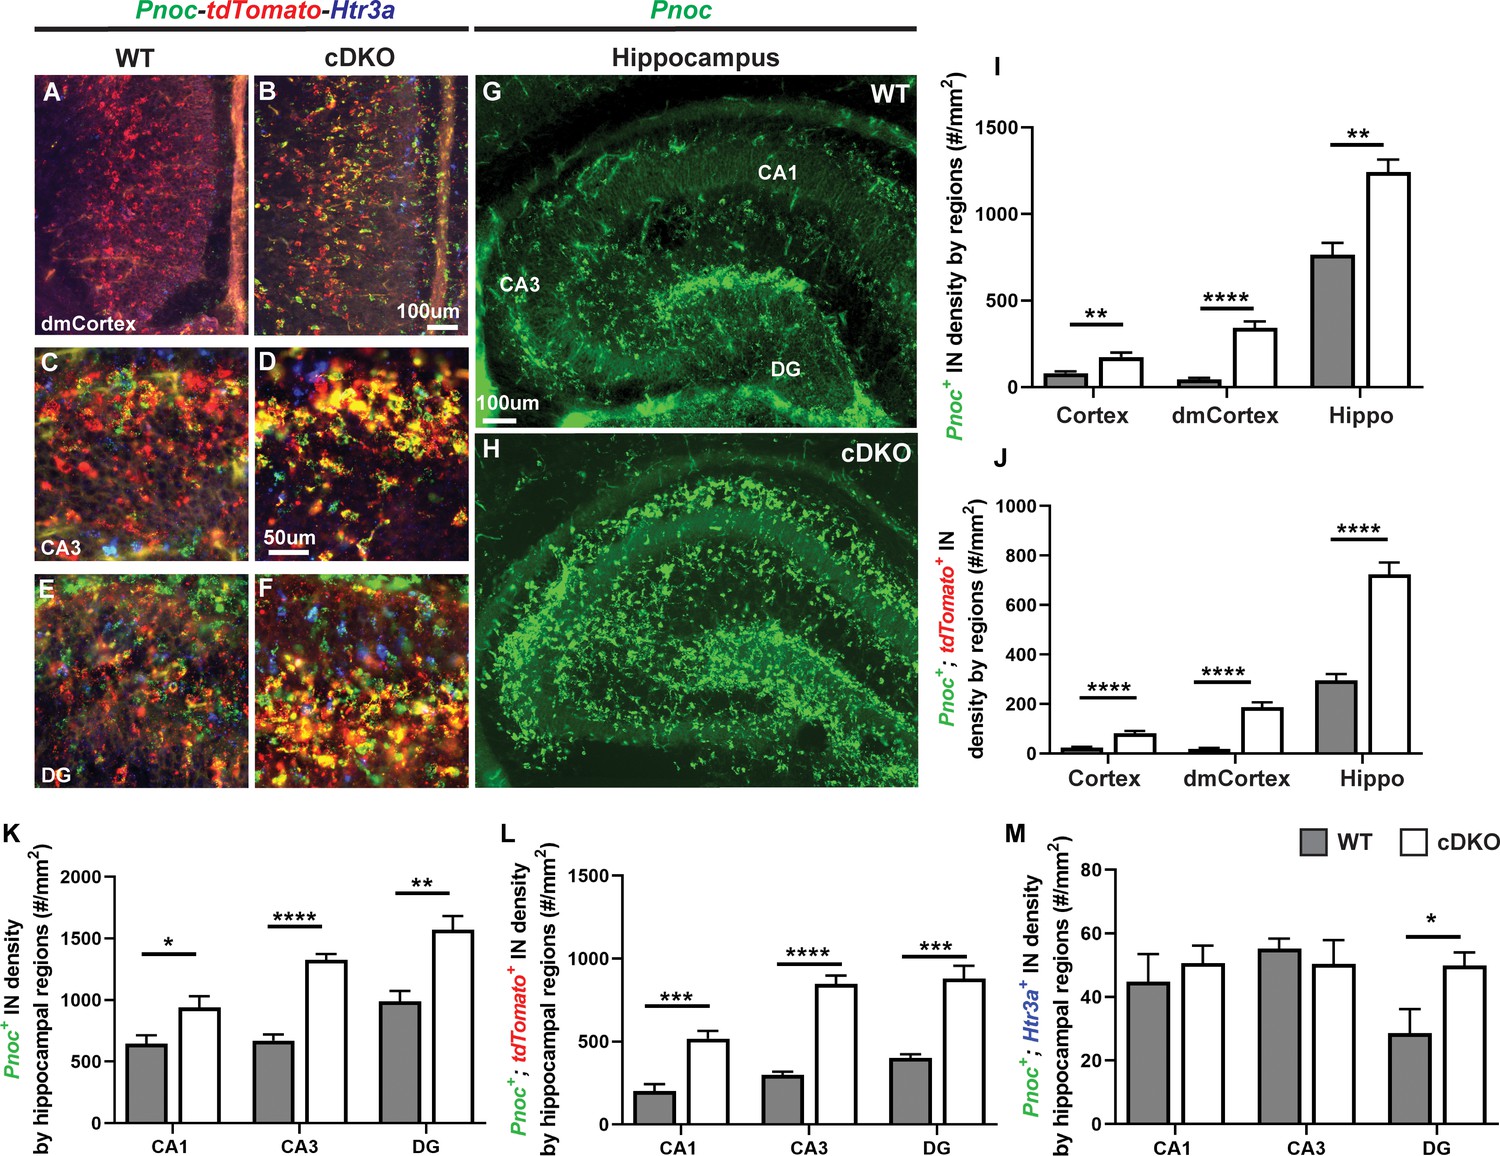
Maf cDKOs have preferential production of HINs over CINs that are Pnoc+.
(A–F) Multicolor FISH of tdTomato, Pnoc and Htr3a on P2 WT and cDKO neocortex (A–B) and hippocampus (C–F). (G–H) Pnoc expression in the WT and cDKO hippocampus. (I) Quantification of the Pnoc+ INs in the neocortex, dorsal-medial cortex (dmCortex) and hippocampus. (J) Quantification of the Pnoc+; tdTomato+ INs in the neocortex, dmCortex and hippocampus. (K) Quantification of the Pnoc+ HINs by regions. (L) Quantification of the Pnoc+; tdTomato+ HINs by regions. (M) Quantification of the Pnoc+; Htr3a+ HINs by regions. N = 3–4 per group and multiple sections were quantified per animal. Scale bar in (B) and (G) = 100 um and in (D) = 50 um. *p<0.05, **p<0.01, ***p<0.001, ****p<0.0001. Welch’s t test.
Figure 5—figure supplement 1
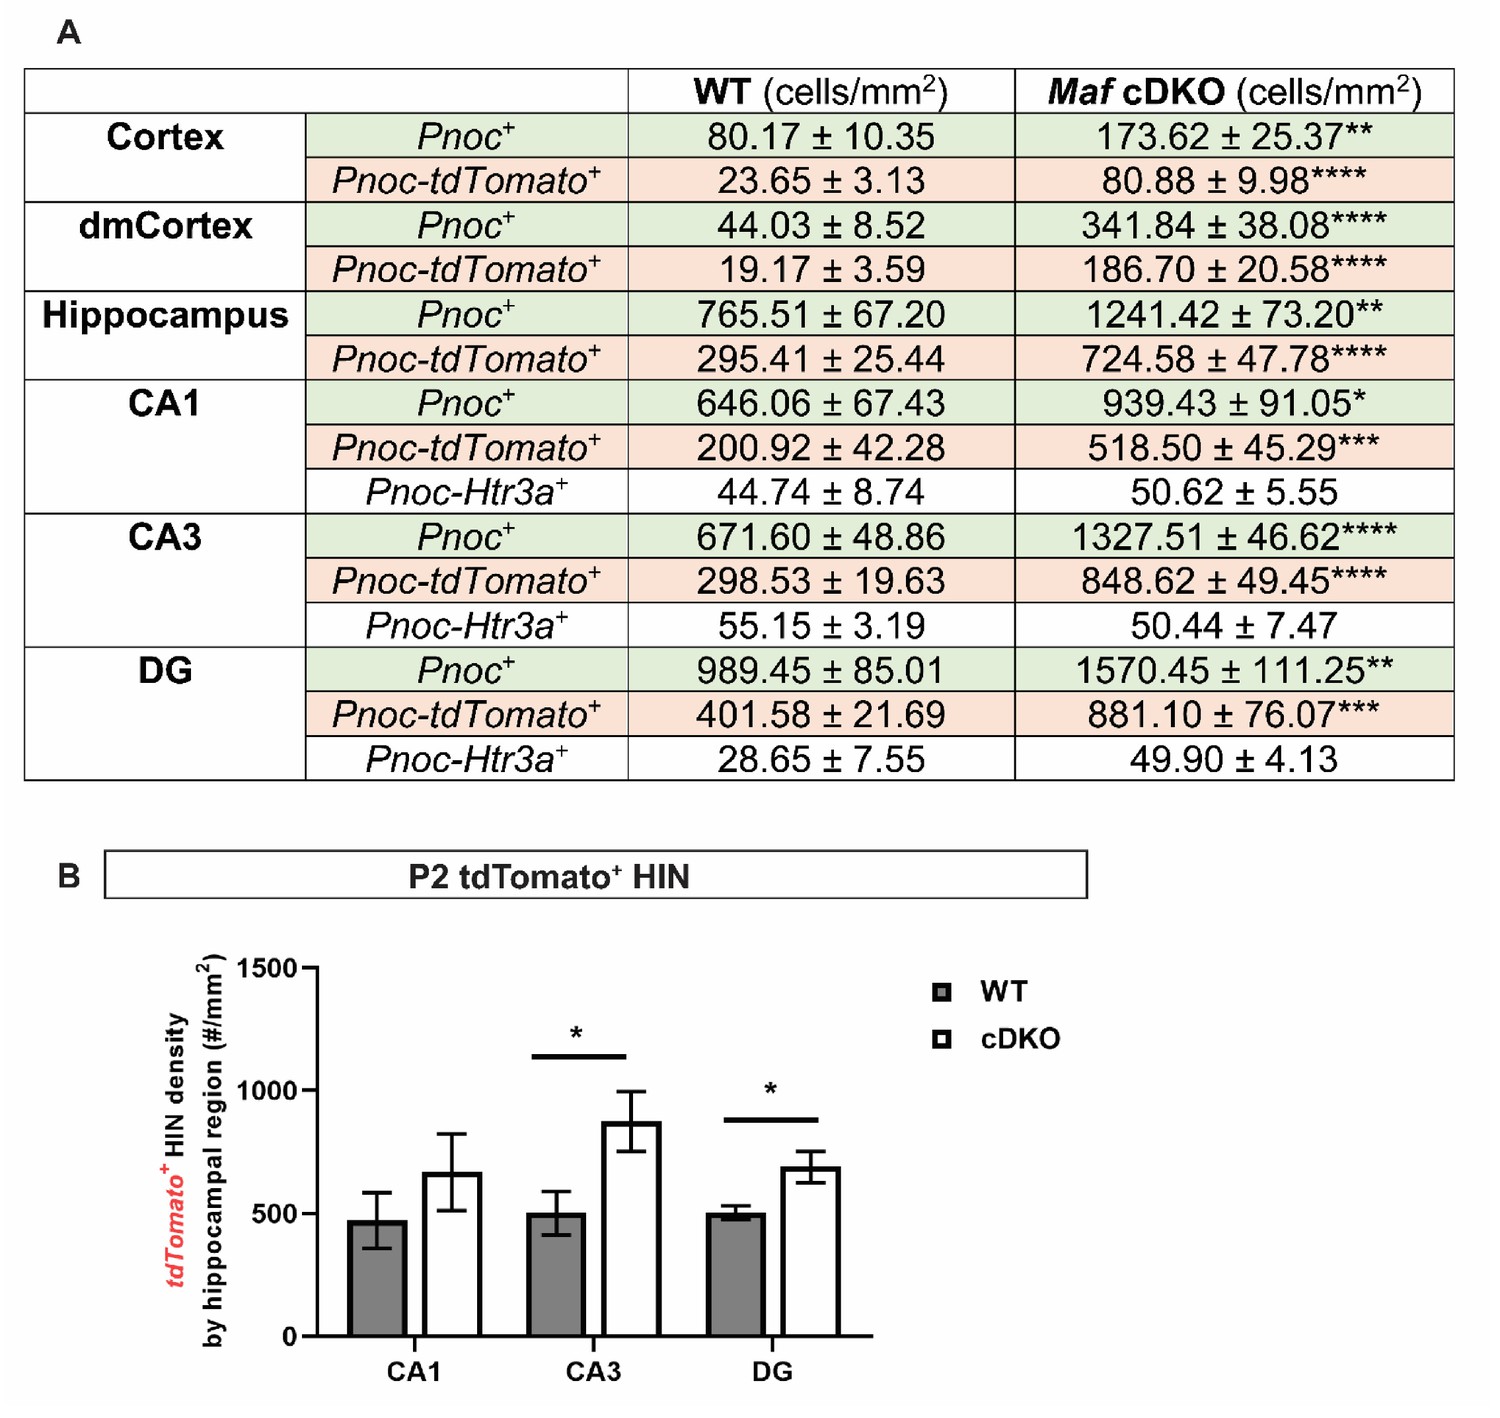
Quantification of Pnoc+ INs by region and by IN subgroups/Quantification of tdTomato+ HINs by hippocampal region.
(A) Quantification of Pnoc+ INs (cell density ± standard error) in the P2 neocortex and hippocampus by genotypes, and by IN subtypes. MGE origin: tdTomato- Pnoc+ INs; CGE origin: tdTomato- Htr3a+ INs. (B) Quantification of tdTomato+ HIN density by hippocampal regions. Unpaired t-test; *p<0.05, **p<0.01, ***p<0.0001, ****p<0.00001.
Figure 6 with 1 supplement

Maf cDKOs overproduce INs that will become HINs.
(A) Schema depicting the BrdU/EdU pulse-chase experiment. Briefly, BrdU was injected into a pregnant mouse at E12.5 and EdU was injected at E15.5. Neonatal pups were harvested at P2 analyzed for Lhx6/BrdU, Lhx6/EdU co-expression. (B) Quantification of Lhx6+ IN cell density in the P2 neocortex. (C) Quantification of Lhx6+ IN cell density in the P2 hippocampus by region. (D–G) Lhx6 FISH with BrdU (D-E, early-born) or EdU (F-G, late-born) co-labeling in P2 WT and cDKO hippocampus. (H–I) Quantification of the Lhx6+; BrdU+ IN cell density in the hippocampus by region (H) and in total (I). (J–K) Quantification of the Lhx6+; EdU+ IN cell density in the hippocampus by region (J) and in total (K). N = 3 per group and multiple sections were quantified per animal. Scale bar in (E) = 100 um. Welch’s t test.
Figure 6—figure supplement 1

Analysis of early-born and late-born MGE-derived CINs in WT and Maf cDKO.
(A–D) Lhx6 FISH with BrdU (A-B, early-born) or EdU (C-D, late-born) co-labeling on P2 WT and cDKO neocortex. (E) Quantification of the Lhx6+; BrdU+ or Lhx6+; EdU+ IN cell density in the neocortex. (F) Quantification of the early-born and late-born IN density (cDKO/WT) in the neocortex and in the hippocampus. (G) Quantification of the early-born and late-born HIN to CIN density ratio by genotypes. Scale bar in (B) = 100 um. N = 3–4 per groups. **p<0.01; Welch’s t test.
Tables
Key resources table
| Reagent type (species) or resource | Designation | Source or reference | Identifiers | Additional information |
|---|---|---|---|---|
| Genetic reagent (M. musculus) | Mafbf/f | Yu et al., 2013 | Generous gift from Dr. Lisa Goodrich | |
| Genetic reagent (M. musculus) | Maff/f | Wende et al., 2012 | Generous gift from Dr. Carmen Birchmeier | |
| Genetic reagent (M. musculus) | Nkx2.1-Cre | Xu et al., 2008 | Jax labs #008661 | |
| Genetic reagent (M. musculus) | Sst-IRES-Cre | Taniguchi et al., 2011 | Jax labs #013044 | |
| Genetic reagent (M. musculus) | Ai14 Rosa26-tdTomato (RosaT) | Madisen et al., 2010 | Jax labs #007908 | |
| Antibody | Rabbit anti-PARVALBUMIN (polyclonal) | Swant | PV27 RRID:AB_2631173 | 1:400 dilution; no need for antigen retrieval |
| Antibody | Rat anti-SOMATOSTATIN (monoclonal; clone YC7) | Millipore Sigma | MAB354 RRID:AB_2255365 | 1:200 dilution; works well in low fixed tissue |
| Antibody | Rabbit anti-MEF2C (polyclonal) | Proteintech | 10056–1-AP RRID:AB_513447 | 1:500 dilution; no need for antigen retrieval |
| Antibody | Rat anti-BrdU antibody (monoclonal [BU1/75(ICR1)] | Abcam | Ab6326 RRID:AB_305426 | 1:500 dilution; BrdU was stained after FISH procedure (proteinase K-based antigen retrieval) |
| Antibody | Sheep anti-DIG-POD antibody (polyclonal) | Millipore Sigma | 11207733910 RRID:AB_514500 | 1:1000 dilution |
| Antibody | Sheep anti-Fluorescein-POD antibody (polyclonal) | Millipore Sigma | 11426346910 RRID:AB_840257 | 1:1000 dilution |
| Antibody | Chicken anti-GFP (polyclonal) | Aves | GFP-1020 RRID:AB_100000240 | 1:1000 dilution |
| Commercial assay or kit | Click-iT EdU kit | Life Technologies | Cat #C10340 | Follow the manufacturer’s instruction |
| Commercial assay or kit | RNAscope multiplex fluorescent kit (version 2) | ACD Bio | Cat #323120 | Follow the manufacturer’s instruction |
| Commercial assay or kit | Mm-Igfbp4 | ACD Bio | Cat #425711 | Follow the manufacturer’s instruction and used it with the RNAscope multiplex fluorescent kit (version 2) |
| Commercial assay or kit | Mm-Sst | ACD Bio | Cat #404631 | |
| Commercial assay or kit | Mm-Sp9 | ACD Bio | Cat #564531 | |
| Commercial assay or kit | Mm-Mef2c | ACD Bio | Cat #421011 | |
| Commercial assay or kit | Mm-Tcf12 | ACD Bio | Cat #504861 | |
| Commercial assay or kit | Mm-tdTomato | ACD Bio | Cat #317041 | |
| Commercial assay or kit | Mm-Pnoc | ACD Bio | Cat #437881 |
Additional files
Download links
A two-part list of links to download the article, or parts of the article, in various formats.
Downloads (link to download the article as PDF)
Open citations (links to open the citations from this article in various online reference manager services)
Cite this article (links to download the citations from this article in formats compatible with various reference manager tools)
Maf and Mafb control mouse pallial interneuron fate and maturation through neuropsychiatric disease gene regulation
eLife 9:e54903.
https://doi.org/10.7554/eLife.54903


